TABLE OF CONTENTS
1 INTRODUCTION (Page No. - 21)
1.1 STUDY OBJECTIVES
1.2 MARKET DEFINITION
1.2.1 INCLUSIONS AND EXCLUSIONS
1.3 STUDY SCOPE
1.3.1 MARKET SEGMENTATION
1.3.2 REGIONAL SCOPE
1.3.3 YEARS CONSIDERED
1.3.4 CURRENCY CONSIDERED
1.3.5 UNITS CONSIDERED
1.4 LIMITATIONS
1.5 STAKEHOLDERS
1.6 SUMMARY OF CHANGES
2 RESEARCH METHODOLOGY (Page No. - 25)
2.1 RESEARCH DATA
2.1.1 SECONDARY DATA
2.1.1.1 Key data from secondary sources
2.1.2 PRIMARY DATA
2.1.2.1 Key participants in primary interviews
2.1.2.2 Breakdown of primary interviews
2.1.2.3 Key industry insights
2.2 MARKET ESTIMATION
2.2.1 TOP-DOWN APPROACH
2.2.2 BOTTOM-UP APPROACH
2.3 BASE NUMBER CALCULATION
2.3.1 DEMAND-SIDE APPROACH
2.3.2 SUPPLY-SIDE APPROACH
2.4 MARKET FORECAST APPROACH
2.4.1 SUPPLY SIDE
2.4.2 DEMAND SIDE
2.5 DATA TRIANGULATION
2.6 RESEARCH ASSUMPTIONS
2.7 FACTOR ANALYSIS
2.8 RESEARCH LIMITATIONS
2.9 RECESSION IMPACT
2.1 RISK ASSESSMENT
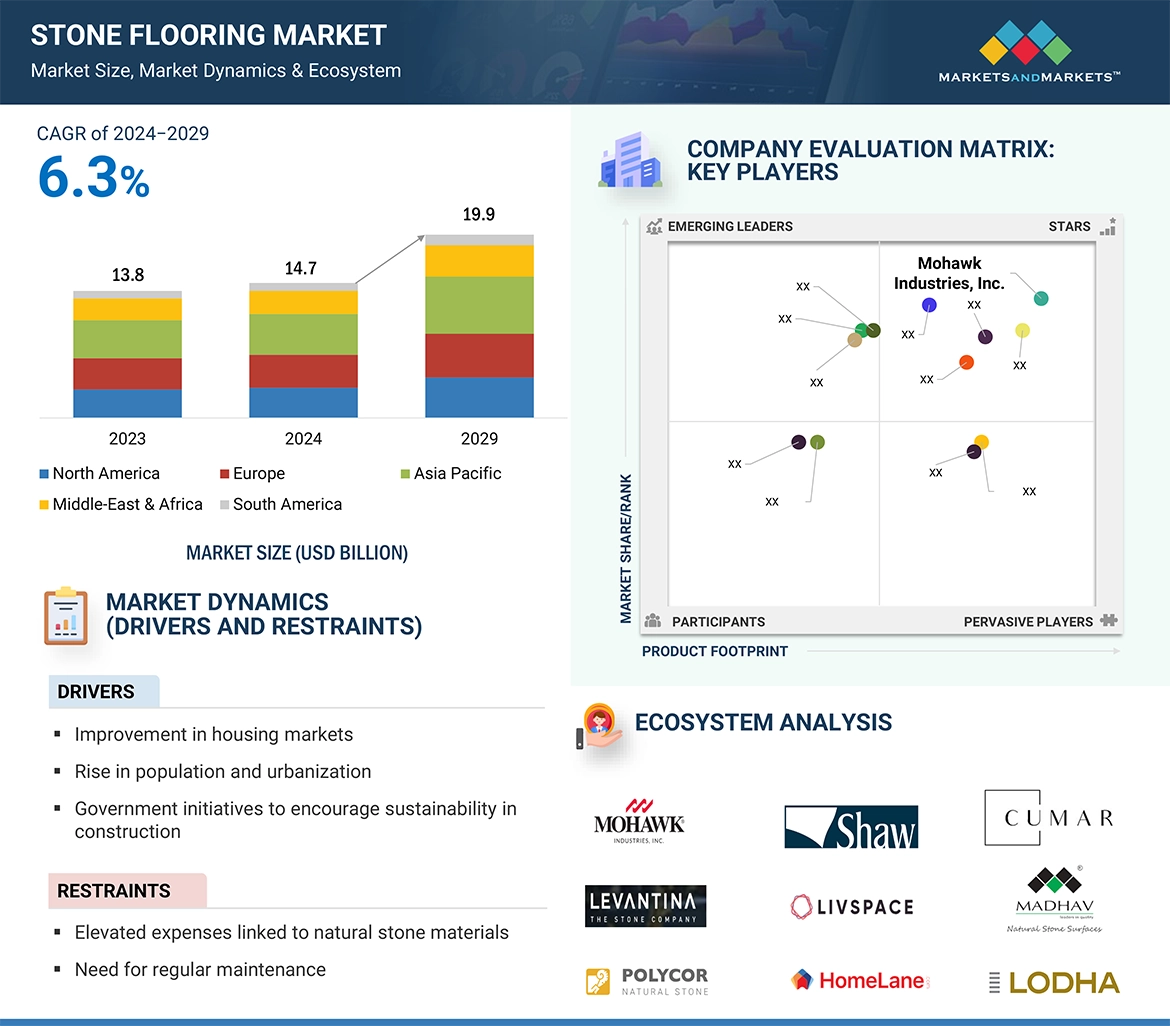
3 EXECUTIVE SUMMARY (Page No. - 34)
4 PREMIUM INSIGHTS (Page No. - 37)
4.1 ATTRACTIVE OPPORTUNITIES FOR PLAYERS IN STONE FLOORING MARKET
4.2 STONE FLOORING MARKET, BY TYPE
4.3 STONE FLOORING MARKET, BY APPLICATION
4.4 ASIA PACIFIC: STONE FLOORING MARKET, BY TYPE & COUNTRY
4.5 STONE FLOORING MARKET: BY COUNTRY
5 MARKET OVERVIEW (Page No. - 40)
5.1 INTRODUCTION
5.2 MARKET DYNAMICS
5.2.1 DRIVERS
5.2.1.1 Improvement in housing markets
5.2.1.2 Rise in population and urbanization
5.2.1.3 Government initiatives to encourage sustainability in construction
5.2.1.4 Increasing investments in infrastructure sector
5.2.2 RESTRAINTS
5.2.2.1 Elevated expenses linked to natural stone materials
5.2.2.2 Need for regular maintenance
5.2.3 OPPORTUNITIES
5.2.3.1 Expansion of hospitality and tourism industries
5.2.3.2 Increasing demand for high-quality flooring solutions
5.2.4 CHALLENGES
5.2.4.1 Irregular availability, and variations in appearance
5.2.4.2 Environmental impact of stone quarrying
5.2.4.3 Availability of alternative flooring materials
6 INDUSTRY TRENDS (Page No. - 49)
6.1 PATENT ANALYSIS
6.1.1 INTRODUCTION
6.1.2 METHODOLOGY
6.1.3 PATENT ANALYSIS (2014–2023)
6.2 KEY STAKEHOLDERS AND BUYING CRITERIA
6.2.1 KEY STAKEHOLDERS IN BUYING PROCESS
6.2.2 BUYING CRITERIA
6.3 HOME IMPROVEMENT SERVICES: INVESTMENT & FUNDING SCENARIO
6.4 REGULATORY LANDSCAPE
6.4.1 REGULATORY BODIES, GOVERNMENT AGENCIES, AND OTHER ORGANIZATIONS
6.5 KEY CONFERENCES & EVENTS, 2024–2025
6.6 TRADE ANALYSIS
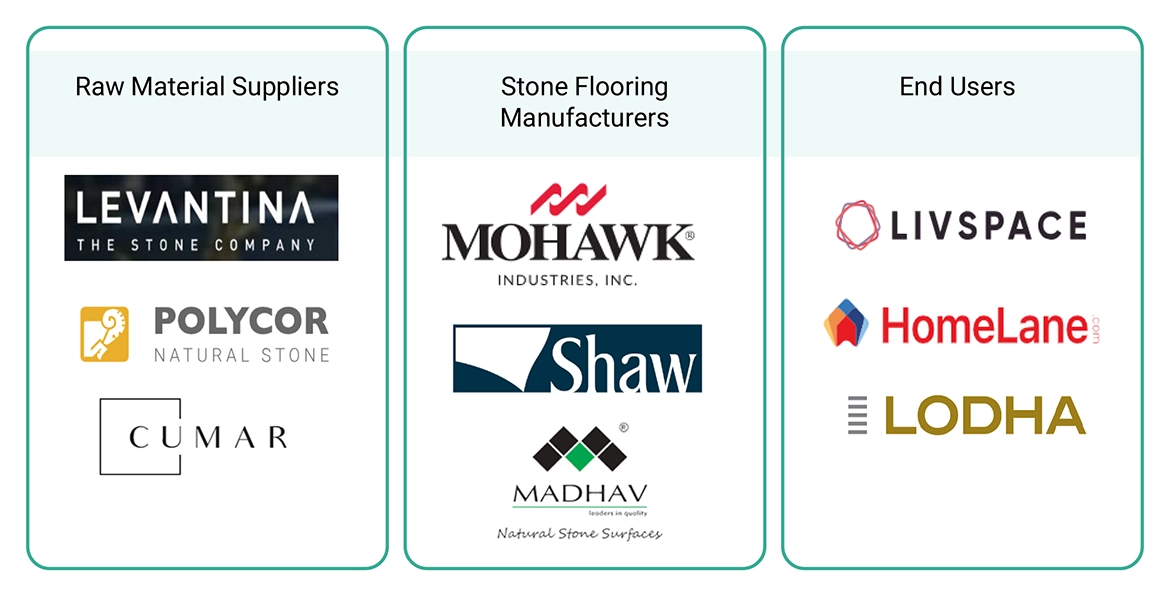
6.7 VALUE CHAIN ANALYSIS
6.8 ECOSYSTEM ANALYSIS
6.9 PORTER’S FIVE FORCES ANALYSIS
6.9.1 BARGAINING POWER OF SUPPLIERS
6.9.2 BARGAINING POWER OF BUYERS
6.9.3 INTENSITY OF COMPETITIVE RIVALRY
6.9.4 THREAT OF NEW ENTRANTS
6.9.5 THREAT OF SUBSTITUTES
6.10 PRICING ANALYSIS
6.10.1 AVERAGE SELLING PRICE TREND OF KEY PLAYERS, BY TYPE
6.10.2 PRICING ANALYSIS, BY REGION
6.11 MACROECONOMIC ANALYSIS
6.11.1 INTRODUCTION
6.11.2 GDP TRENDS AND FORECASTS
6.11.3 CONSTRUCTION INDUSTRY AS PERCENTAGE OF GDP
6.12 TECHNOLOGY ANALYSIS
6.12.1 KEY TECHNOLOGIES
6.12.1.1 CNC machines
6.12.1.2 AutoCAD
6.12.1.3 Hydrostatic port technology (HPT)
6.12.1.4 Triple reinforcement technology (TRT)
6.12.2 COMPLEMENTARY TECHNOLOGIES
6.12.2.1 Anti-slip technology
6.12.2.2 3D modeling & visualization
6.13 TRENDS & DISRUPTIONS IMPACTING CUSTOMER BUSINESS
6.14 CASE STUDY ANALYSIS
6.14.1 CASE STUDY 1: SEAMLESS FLOW OF STONE TILES CONNECTS INDOOR AND OUTDOOR SPACES
6.14.2 CASE STUDY 2: ANTIQUED LIMESTONE FLOORING RETAINS RUSTIC APPEAL OF FARMHOUSE
7 STONE FLOORING MARKET, BY APPLICATION (Page No. - 70)
7.1 INTRODUCTION
7.2 RESIDENTIAL
7.2.1 RISING DEMAND FOR NATURAL STONE IN SINGLE-FAMILY AND MULTI-UNIT RESIDENCES TO PROPEL MARKET
7.3 NON-RESIDENTIAL
7.3.1 RISING COMMERCIAL CONSTRUCTION IN EMERGING ECONOMIES TO BOOST MARKET
8 STONE FLOORING MARKET, BY TYPE (Page No. - 74)
8.1 INTRODUCTION
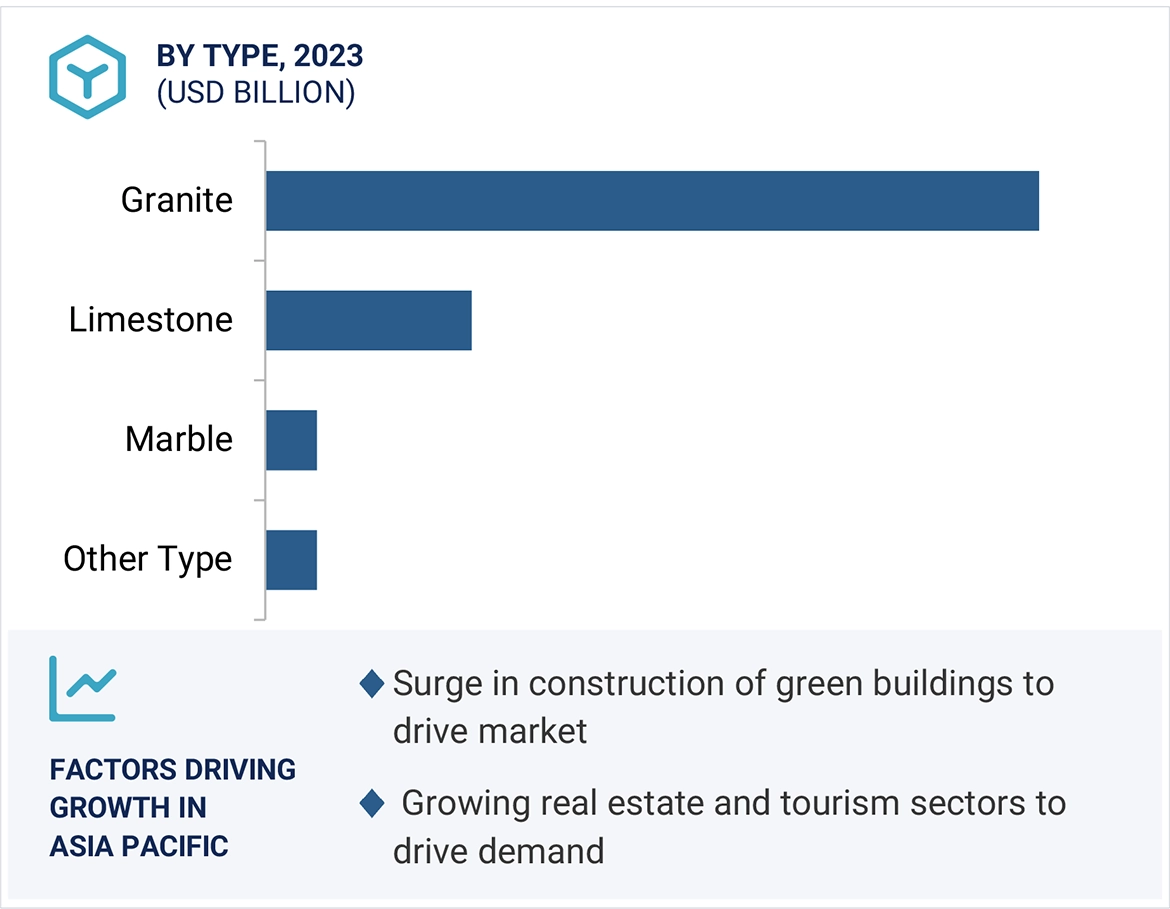
8.2 GRANITE
8.2.1 HIGH DEMAND IN CONSTRUCTION INDUSTRY TO DRIVE MARKET
8.3 LIMEST0NE
8.3.1 NEED FOR ECO-FRIENDLY FLOORING OPTIONS TO BOOST DEMAND
8.4 MARBLE
8.4.1 INCREASING DEMAND FOR HIGH-END HOME RENOVATIONS TO DRIVE MARKET
8.5 OTHER TYPES
9 STONE FLOORING MARKET, BY REGION (Page No. - 78)
9.1 INTRODUCTION
9.2 ASIA PACIFIC
9.2.1 ASIA PACIFIC: RECESSION IMPACT
9.2.2 CHINA
9.2.2.1 Surge in construction of green buildings to drive market
9.2.3 JAPAN
9.2.3.1 Urban renewal and redevelopment projects to drive market
9.2.4 INDIA
9.2.4.1 Growing real estate and tourism sectors to drive demand
9.2.5 SOUTH KOREA
9.2.5.1 Strategic partnerships in construction industry to boost market
9.2.6 INDONESIA
9.2.6.1 Rising demand in hospitality sector to propel market
9.2.7 REST OF ASIA PACIFIC
9.3 EUROPE
9.3.1 EUROPE: RECESSION IMPACT
9.3.2 GERMANY
9.3.2.1 Focus on energy-efficient renovation projects to drive market
9.3.3 FRANCE
9.3.3.1 Government initiatives to fuel demand
9.3.4 UK
9.3.4.1 Steady increase in construction sector to boost demand
9.3.5 ITALY
9.3.5.1 Investments in non-residential construction projects to fuel market
9.3.6 SPAIN
9.3.6.1 Government investments in construction sector to propel market
9.3.7 RUSSIA
9.3.7.1 Urban development initiatives to propel market
9.3.8 REST OF EUROPE
9.4 NORTH AMERICA
9.4.1 NORTH AMERICA: RECESSION IMPACT
9.4.2 US
9.4.2.1 Booming construction sector to drive market
9.4.3 CANADA
9.4.3.1 Focus on sustainable building practices to drive market
9.4.4 MEXICO
9.4.4.1 Public infrastructure investments to fuel market
9.5 MIDDLE EAST & AFRICA
9.5.1 MIDDLE EAST & AFRICA: RECESSION IMPACT
9.5.2 GCC COUNTRIES
9.5.2.1 SAUDI ARABIA
9.5.2.1.1 Robust construction industry to boost market
9.5.2.2 UAE
9.5.2.2.1 Increasing government support for construction projects to drive market
9.5.2.3 Rest of GCC Countries
9.5.3 SOUTH AFRICA
9.5.3.1 Increasing infrastructure development to drive demand
9.5.4 REST OF MIDDLE EAST & AFRICA
9.6 SOUTH AMERICA
9.6.1 SOUTH AMERICA: IMPACT OF RECESSION
9.6.2 BRAZIL
9.6.2.1 Growing construction industry to boost market
9.6.3 ARGENTINA
9.6.3.1 Public-private partnerships to propel demand
9.6.4 REST OF SOUTH AMERICA
10 COMPETITIVE LANDSCAPE (Page No. - 135)
10.1 KEY PLAYER STRATEGIES/RIGHT TO WIN, JANUARY 2019–JUNE 2024
10.2 MARKET SHARE ANALYSIS, 2023
10.3 MARKET RANKING ANALYSIS
10.4 REVENUE ANALYSIS, 2019–2023
10.5 COMPANY VALUATION AND FINANCIAL METRICS
10.6 PRODUCT/BRAND COMPARISON
10.7 COMPANY EVALUATION MATRIX: KEY PLAYERS, 2023
10.7.1 STARS
10.7.2 EMERGING LEADERS
10.7.3 PERVASIVE PLAYERS
10.7.4 PARTICIPANTS
10.7.5 COMPANY FOOTPRINT: KEY PLAYERS, 2023
10.8 COMPANY EVALUATION MATRIX: STARTUPS/SMES, 2023
10.8.1 PROGRESSIVE COMPANIES
10.8.2 RESPONSIVE COMPANIES
10.8.3 DYNAMIC COMPANIES
10.8.4 STARTING BLOCKS
10.9 COMPETITIVE BENCHMARKING: STARTUPS/SMES, 2023
10.9.1 STONE FLOORING MARKET: KEY STARTUPS/SMES
10.10 COMPETITIVE SCENARIO AND TRENDS
10.10.1 DEALS
10.10.2 EXPANSIONS
11 COMPANY PROFILES (Page No. - 153)
11.1 KEY PLAYERS
11.1.1 MOHAWK INDUSTRIES, INC.
11.1.1.1 Business overview
11.1.1.2 Products/Solutions/Services offered
11.1.1.3 MnM view
11.1.1.3.1 Right to win
11.1.1.3.2 Strategic choices
11.1.1.3.3 Weaknesses & competitive threats
11.1.2 SHAW INDUSTRIES GROUP, INC.
11.1.2.1 Business overview
11.1.2.2 Products/Solutions/Services offered
11.1.2.3 Recent developments
11.1.2.3.1 Deals
11.1.2.3.2 Expansions
11.1.2.4 MnM view
11.1.2.4.1 Right to win
11.1.2.4.2 Strategic choices
11.1.2.4.3 Weaknesses & competitive threats
11.1.3 POLYCOR INC.
11.1.3.1 Business overview
11.1.3.2 Products/Solutions/Services offered
11.1.3.3 Recent developments
11.1.3.3.1 Deals
11.1.3.4 MnM view
11.1.3.4.1 Right to win
11.1.3.4.2 Strategic choices
11.1.3.4.3 Weaknesses & competitive threats
11.1.4 EMSER TILE
11.1.4.1 Business overview
11.1.4.2 Products/Solutions/Services offered
11.1.4.3 Recent developments
11.1.4.3.1 Expansions
11.1.4.4 MnM view
11.1.4.4.1 Right to win
11.1.4.4.2 Strategic choices
11.1.4.4.3 Weaknesses & competitive threats
11.1.5 STONE SOURCE LLC
11.1.5.1 Business overview
11.1.5.2 Products/Solutions/Services offered
11.1.5.3 Recent developments
11.1.5.3.1 Deals
11.1.5.4 MnM view
11.1.5.4.1 Right to win
11.1.5.4.2 Strategic choices
11.1.5.4.3 Weaknesses & competitive threats
11.1.6 LEVANTINA Y ASOCIADOS DE MINERALES, S.A.
11.1.6.1 Business overview
11.1.6.2 Products/Solutions/Services offered
11.1.6.3 MnM view
11.1.7 MADHAV MARBLES AND GRANITES LTD.
11.1.7.1 Business overview
11.1.7.2 Products/Solutions/Services offered
11.1.7.3 MnM view
11.1.8 ARO GRANITE INDUSTRIES LTD.
11.1.8.1 Business overview
11.1.8.2 Products/Solutions/Services offered
11.1.8.3 MnM view
11.1.9 ASIAN GRANITO INDIA LIMITED
11.1.9.1 Business overview
11.1.9.2 Products/Solutions/Services offered
11.1.9.3 MnM view
11.1.10 OLD WORLD STONE IMPORTS FLOORING AND DESIGN
11.1.10.1 Business overview
11.1.10.2 Products/Solutions/Services offered
11.1.10.3 MnM view
11.2 OTHER PLAYERS
11.2.1 JAGSON INDIA
11.2.2 WESTMINSTER STONE LTD.
11.2.3 H & R JOHNSON (INDIA)
11.2.4 EMPEROR PORRSELEIN TEGEL B.V.
11.2.5 ARTISTIC TILE, INC.
11.2.6 KEVAY GROUP PVT. LTD.
11.2.7 RK MARBLES INDIA
11.2.8 TIBA MARBLE
11.2.9 TAB SURFACES
11.2.10 UNIVERSAL MARBLE & GRANITE GROUP LTD.
11.2.11 CLASSIC MARBLE COMPANY (CMC)
11.2.12 ADITYA STONEX
11.2.13 GUPTA STONE
11.2.14 REGATTA GRANITES INDIA
11.2.15 AVID MARBLES
12 ADJACENT & RELATED MARKETS (Page No. - 184)
12.1 INTRODUCTION
12.2 LIMITATIONS
12.2.1 FLOORING MARKET
12.2.1.1 Market definition
12.2.1.2 Flooring market, by material
12.2.1.3 Flooring market, by end-use industry
12.2.1.4 Flooring market, by region
12.2.2 FLOOR ADHESIVE MARKET
12.2.2.1 Market definition
12.2.2.2 Floor adhesive market, by resin type
12.2.2.3 Floor adhesive market, by technology
12.2.2.4 Floor adhesive market, by end use
12.2.2.5 Floor adhesive market, by application
12.2.2.6 Floor adhesive market, by region
13 APPENDIX (Page No. - 196)
13.1 DISCUSSION GUIDE
13.2 KNOWLEDGESTORE: MARKETSANDMARKETS’ SUBSCRIPTION PORTAL
13.3 CUSTOMIZATION OPTIONS
13.4 RELATED REPORTS
13.5 AUTHOR DETAILS
LIST OF TABLES (211 TABLES)
TABLE 1 US: SEASONALLY ADJUSTED ANNUAL RATE (SAAR) FOR NEW RESIDENTIAL CONSTRUCTION, APRIL 2024
TABLE 2 NAHB/WELLS FARGO NATIONAL AND REGIONAL HOUSING MARKET INDEX (HMI)
TABLE 3 POPULATION AND URBANIZATION, BY REGION, 2021–2050 (MILLION)
TABLE 4 POPULATION GROWTH, BY REGION, 2022–2050 (MILLION)
TABLE 5 STONE FLOORING-RELATED PATENTS
TABLE 6 INFLUENCE OF STAKEHOLDERS ON BUYING PROCESS FOR TOP TWO APPLICATIONS
TABLE 7 KEY BUYING CRITERIA FOR TOP TWO APPLICATIONS
TABLE 8 NORTH AMERICA: REGULATORY BODIES, GOVERNMENT AGENCIES, AND OTHER ORGANIZATIONS
TABLE 9 EUROPE: REGULATORY BODIES, GOVERNMENT AGENCIES, AND OTHER ORGANIZATIONS
TABLE 10 ASIA PACIFIC: REGULATORY BODIES, GOVERNMENT AGENCIES, AND OTHER ORGANIZATIONS
TABLE 11 STONE FLOORING MARKET: CONFERENCES & EVENTS, 2024–2025
TABLE 12 STONE FLOORING MARKET: PORTER’S FIVE FORCES ANALYSIS
TABLE 13 AVERAGE SELLING PRICE TREND OF KEY PLAYERS, BY TYPE (USD/SQUARE METER)
TABLE 14 AVERAGE SELLING PRICE OF KEY PLAYERS, BY REGION, 2023–2029 (USD/SQUARE METER)
TABLE 15 WORLD GDP GROWTH PROJECTION, 2021–2028 (USD TRILLION)
TABLE 16 CONSTRUCTION AS PERCENTAGE OF GDP, BY KEY COUNTRY, 2021
TABLE 17 STONE FLOORING MARKET, BY APPLICATION, 2022–2029 (USD MILLION)
TABLE 18 STONE FLOORING MARKET, BY APPLICATION, 2022–2029 (MILLION SQUARE METERS)
TABLE 19 STONE FLOORING MARKET, BY TYPE, 2022–2029 (USD MILLION)
TABLE 20 STONE FLOORING MARKET, BY TYPE, 2022–2029 (MILLION SQUARE METERS)
TABLE 21 STONE FLOORING MARKET, BY REGION, 2022–2029 (USD MILLION)
TABLE 22 STONE FLOORING MARKET, BY REGION, 2022–2029 (MILLION SQUARE METERS)
TABLE 23 ASIA PACIFIC: STONE FLOORING MARKET, BY COUNTRY, 2022–2029 (USD MILLION)
TABLE 24 ASIA PACIFIC: STONE FLOORING MARKET, BY COUNTRY, 2022–2029 (MILLION SQUARE METERS)
TABLE 25 ASIA PACIFIC: STONE FLOORING MARKET, BY TYPE, 2022–2029 (USD MILLION)
TABLE 26 ASIA PACIFIC: STONE FLOORING MARKET, BY TYPE, 2022–2029 (MILLION SQUARE METERS)
TABLE 27 ASIA PACIFIC: STONE FLOORING MARKET, BY APPLICATION, 2022–2029 (USD MILLION)
TABLE 28 ASIA PACIFIC: STONE FLOORING MARKET, BY APPLICATION, 2022–2029 (MILLION SQUARE METERS)
TABLE 29 CHINA: STONE FLOORING MARKET, BY TYPE, 2022–2029 (USD MILLION)
TABLE 30 CHINA: STONE FLOORING MARKET, BY TYPE, 2022–2029 (MILLION SQUARE METERS)
TABLE 31 CHINA: STONE FLOORING MARKET, BY APPLICATION, 2022–2029 (USD MILLION)
TABLE 32 CHINA: STONE FLOORING MARKET, BY APPLICATION, 2022–2029 (MILLION SQUARE METERS)
TABLE 33 JAPAN: STONE FLOORING MARKET, BY TYPE, 2022–2029 (USD MILLION)
TABLE 34 JAPAN: STONE FLOORING MARKET, BY TYPE, 2022–2029 (MILLION SQUARE METERS)
TABLE 35 JAPAN: STONE FLOORING MARKET, BY APPLICATION, 2022–2029 (USD MILLION)
TABLE 36 JAPAN: STONE FLOORING MARKET, BY APPLICATION, 2022–2029 (MILLION SQUARE METERS)
TABLE 37 INDIA: STONE FLOORING MARKET, BY TYPE, 2022–2029 (USD MILLION)
TABLE 38 INDIA: STONE FLOORING MARKET, BY TYPE, 2022–2029 (MILLION SQUARE METERS)
TABLE 39 INDIA: STONE FLOORING MARKET, BY APPLICATION, 2022–2029 (USD MILLION)
TABLE 40 INDIA: STONE FLOORING MARKET, BY APPLICATION, 2022–2029 (MILLION SQUARE METERS)
TABLE 41 SOUTH KOREA: STONE FLOORING MARKET, BY TYPE, 2022–2029 (USD MILLION)
TABLE 42 SOUTH KOREA: STONE FLOORING MARKET, BY TYPE, 2022–2029 (MILLION SQUARE METERS)
TABLE 43 SOUTH KOREA: STONE FLOORING MARKET, BY APPLICATION, 2022–2029 (USD MILLION)
TABLE 44 SOUTH KOREA: STONE FLOORING MARKET, BY APPLICATION, 2022–2029 (MILLION SQUARE METERS)
TABLE 45 INDONESIA: STONE FLOORING MARKET, BY TYPE, 2022–2029 (USD MILLION)
TABLE 46 INDONESIA: STONE FLOORING MARKET, BY TYPE, 2022–2029 (MILLION SQUARE METERS)
TABLE 47 INDONESIA: STONE FLOORING MARKET, BY APPLICATION, 2022–2029 (USD MILLION)
TABLE 48 INDONESIA: STONE FLOORING MARKET, BY APPLICATION, 2022–2029 (MILLION SQUARE METERS)
TABLE 49 REST OF ASIA PACIFIC: STONE FLOORING MARKET, BY TYPE, 2022–2029 (USD MILLION)
TABLE 50 REST OF ASIA PACIFIC: STONE FLOORING MARKET, BY TYPE, 2022–2029 (MILLION SQUARE METERS)
TABLE 51 REST OF ASIA PACIFIC: STONE FLOORING MARKET, BY APPLICATION, 2022–2029 (USD MILLION)
TABLE 52 REST OF ASIA PACIFIC: STONE FLOORING MARKET, BY APPLICATION, 2022–2029 (MILLION SQUARE METERS)
TABLE 53 EUROPE: STONE FLOORING MARKET, BY COUNTRY, 2022–2029 (USD MILLION)
TABLE 54 EUROPE: STONE FLOORING MARKET, BY COUNTRY, 2022–2029 (MILLION SQUARE METERS)
TABLE 55 EUROPE: STONE FLOORING MARKET, BY TYPE, 2022–2029 (USD MILLION)
TABLE 56 EUROPE: STONE FLOORING MARKET, BY TYPE, 2022–2029 (MILLION SQUARE METERS)
TABLE 57 EUROPE: STONE FLOORING MARKET, BY APPLICATION, 2022–2029 (USD MILLION)
TABLE 58 EUROPE: STONE FLOORING MARKET, BY APPLICATION, 2022–2029 (MILLION SQUARE METERS)
TABLE 59 GERMANY: STONE FLOORING MARKET, BY TYPE, 2022–2029 (USD MILLION)
TABLE 60 GERMANY: STONE FLOORING MARKET, BY TYPE, 2022–2029 (MILLION SQUARE METERS)
TABLE 61 GERMANY: STONE FLOORING MARKET, BY APPLICATION, 2022–2029 (USD MILLION)
TABLE 62 GERMANY: STONE FLOORING MARKET, BY APPLICATION, 2022–2029 (MILLION SQUARE METERS)
TABLE 63 FRANCE: STONE FLOORING MARKET, BY TYPE, 2022–2029 (USD MILLION)
TABLE 64 FRANCE: STONE FLOORING MARKET, BY TYPE, 2022–2029 (MILLION SQUARE METERS)
TABLE 65 FRANCE: STONE FLOORING MARKET, BY APPLICATION, 2022–2029 (USD MILLION)
TABLE 66 FRANCE: STONE FLOORING MARKET, BY APPLICATION, 2022–2029 (MILLION SQUARE METERS)
TABLE 67 UK: STONE FLOORING MARKET, BY TYPE, 2022–2029 (USD MILLION)
TABLE 68 UK: STONE FLOORING MARKET, BY TYPE, 2022–2029 (MILLION SQUARE METERS)
TABLE 69 UK: STONE FLOORING MARKET, BY APPLICATION, 2022–2029 (USD MILLION)
TABLE 70 UK: STONE FLOORING MARKET, BY APPLICATION, 2022–2029 (MILLION SQUARE METERS)
TABLE 71 ITALY: STONE FLOORING MARKET, BY TYPE, 2022–2029 (USD MILLION)
TABLE 72 ITALY: STONE FLOORING MARKET, BY TYPE, 2022–2029 (MILLION SQUARE METERS)
TABLE 73 ITALY: STONE FLOORING MARKET, BY APPLICATION, 2022–2029 (USD MILLION)
TABLE 74 ITALY: STONE FLOORING MARKET, BY APPLICATION, 2022–2029 (MILLION SQUARE METERS)
TABLE 75 SPAIN: STONE FLOORING MARKET, BY TYPE, 2022–2029 (USD MILLION)
TABLE 76 SPAIN: STONE FLOORING MARKET, BY TYPE, 2022–2029 (MILLION SQUARE METERS)
TABLE 77 SPAIN: STONE FLOORING MARKET, BY APPLICATION, 2022–2029 (USD MILLION)
TABLE 78 SPAIN: STONE FLOORING MARKET, BY APPLICATION, 2022–2029 (MILLION SQUARE METERS)
TABLE 79 RUSSIA: STONE FLOORING MARKET, BY TYPE, 2022–2029 (USD MILLION)
TABLE 80 RUSSIA: STONE FLOORING MARKET, BY TYPE, 2022–2029 (MILLION SQUARE METERS)
TABLE 81 RUSSIA: STONE FLOORING MARKET, BY APPLICATION, 2022–2029 (USD MILLION)
TABLE 82 RUSSIA: STONE FLOORING MARKET, BY APPLICATION, 2022–2029 (MILLION SQUARE METERS)
TABLE 83 REST OF EUROPE: STONE FLOORING MARKET, BY TYPE, 2022–2029 (USD MILLION)
TABLE 84 REST OF EUROPE: STONE FLOORING MARKET, BY TYPE, 2022–2029 (MILLION SQUARE METERS)
TABLE 85 REST OF EUROPE: STONE FLOORING MARKET, BY APPLICATION, 2022–2029 (USD MILLION)
TABLE 86 REST OF EUROPE: STONE FLOORING MARKET, BY APPLICATION, 2022–2029 (MILLION SQUARE METERS)
TABLE 87 NORTH AMERICA: STONE FLOORING MARKET, BY COUNTRY, 2022–2029 (USD MILLION)
TABLE 88 NORTH AMERICA: STONE FLOORING MARKET, BY COUNTRY, 2022–2029 (MILLION SQUARE METERS)
TABLE 89 NORTH AMERICA: STONE FLOORING MARKET, BY TYPE, 2022–2029 (USD MILLION)
TABLE 90 NORTH AMERICA: STONE FLOORING MARKET, BY TYPE, 2022–2029 (MILLION SQUARE METERS)
TABLE 91 NORTH AMERICA: STONE FLOORING MARKET, BY APPLICATION, 2022–2029 (USD MILLION)
TABLE 92 NORTH AMERICA: STONE FLOORING MARKET, BY APPLICATION, 2022–2029 (MILLION SQUARE METERS)
TABLE 93 US: STONE FLOORING MARKET, BY TYPE, 2022–2029 (USD MILLION)
TABLE 94 US: STONE FLOORING MARKET, BY TYPE, 2022–2029 (MILLION SQUARE METERS)
TABLE 95 US: STONE FLOORING MARKET, BY APPLICATION, 2022–2029 (USD MILLION)
TABLE 96 US: STONE FLOORING MARKET, BY APPLICATION, 2022–2029 (MILLION SQUARE METERS)
TABLE 97 CANADA: STONE FLOORING MARKET, BY TYPE, 2022–2029 (USD MILLION)
TABLE 98 CANADA: STONE FLOORING MARKET, BY TYPE, 2022–2029 (MILLION SQUARE METERS)
TABLE 99 CANADA: STONE FLOORING MARKET, BY APPLICATION, 2022–2029 (USD MILLION)
TABLE 100 CANADA: STONE FLOORING MARKET, BY APPLICATION, 2022–2029 (MILLION SQUARE METERS)
TABLE 101 MEXICO: STONE FLOORING MARKET, BY TYPE, 2022–2029 (USD MILLION)
TABLE 102 MEXICO: STONE FLOORING MARKET, BY TYPE, 2022–2029 (MILLION SQUARE METERS)
TABLE 103 MEXICO: STONE FLOORING MARKET, BY APPLICATION, 2022–2029 (USD MILLION)
TABLE 104 MEXICO: STONE FLOORING MARKET, BY APPLICATION, 2022–2029 (MILLION SQUARE METERS)
TABLE 105 MIDDLE EAST & AFRICA: STONE FLOORING MARKET, BY COUNTRY, 2022–2029 (USD MILLION)
TABLE 106 MIDDLE EAST & AFRICA: STONE FLOORING MARKET, BY COUNTRY, 2022–2029 (MILLION SQUARE METERS)
TABLE 107 MIDDLE EAST & AFRICA: STONE FLOORING MARKET, BY TYPE, 2022–2029 (USD MILLION)
TABLE 108 MIDDLE EAST & AFRICA: STONE FLOORING MARKET, BY TYPE, 2022–2029 (MILLION SQUARE METERS)
TABLE 109 SOUTH AMERICA: STONE FLOORING MARKET, BY APPLICATION, 2022–2029 (USD MILLION)
TABLE 110 SOUTH AMERICA: STONE FLOORING MARKET, BY APPLICATION, 2022–2029 (MILLION SQUARE METERS)
TABLE 111 GCC COUNTRIES: STONE FLOORING MARKET, BY TYPE, 2022–2029 (USD MILLION)
TABLE 112 GCC COUNTRIES: STONE FLOORING MARKET, BY TYPE, 2022–2029 (MILLION SQUARE METERS)
TABLE 113 GCC COUNTRIES: STONE FLOORING MARKET, BY APPLICATION, 2022–2029 (USD MILLION)
TABLE 114 GCC COUNTRIES: STONE FLOORING MARKET, BY APPLICATION, 2022–2029 (MILLION SQUARE METERS)
TABLE 115 SAUDI ARABIA: STONE FLOORING MARKET, BY TYPE, 2022–2029 (USD MILLION)
TABLE 116 SAUDI ARABIA: STONE FLOORING MARKET, BY TYPE, 2022–2029 (MILLION SQUARE METERS)
TABLE 117 SAUDI ARABIA: STONE FLOORING MARKET, BY APPLICATION, 2022–2029 (USD MILLION)
TABLE 118 SAUDI ARABIA: STONE FLOORING MARKET, BY APPLICATION, 2022–2029 (MILLION SQUARE METERS)
TABLE 119 UAE: STONE FLOORING MARKET, BY TYPE, 2022–2029 (USD MILLION)
TABLE 120 UAE: STONE FLOORING MARKET, BY TYPE, 2022–2029 (MILLION SQUARE METERS)
TABLE 121 UAE: STONE FLOORING MARKET, BY APPLICATION, 2022–2029 (USD MILLION)
TABLE 122 UAE: STONE FLOORING MARKET, BY APPLICATION, 2022–2029 (MILLION SQUARE METERS)
TABLE 123 REST OF GCC COUNTRIES: STONE FLOORING MARKET, BY TYPE, 2022–2029 (USD MILLION)
TABLE 124 REST OF GCC COUNTRIES: STONE FLOORING MARKET, BY TYPE, 2022–2029 (MILLION SQUARE METERS)
TABLE 125 REST OF GCC COUNTRIES: STONE FLOORING MARKET, BY APPLICATION, 2022–2029 (USD MILLION)
TABLE 126 REST OF GCC COUNTRIES: STONE FLOORING MARKET, BY APPLICATION, 2022–2029 (MILLION SQUARE METERS)
TABLE 127 SOUTH AFRICA: STONE FLOORING MARKET, BY TYPE, 2022–2029 (USD MILLION)
TABLE 128 SOUTH AFRICA: STONE FLOORING MARKET, BY TYPE, 2022–2029 (MILLION SQUARE METERS)
TABLE 129 SOUTH AFRICA: STONE FLOORING MARKET, BY APPLICATION, 2022–2029 (USD MILLION)
TABLE 130 SOUTH AFRICA: STONE FLOORING MARKET, BY APPLICATION, 2022–2029 (MILLION SQUARE METERS)
TABLE 131 REST OF MIDDLE EAST & AFRICA: STONE FLOORING MARKET, BY TYPE, 2022–2029 (USD MILLION)
TABLE 132 REST OF MIDDLE EAST & AFRICA: STONE FLOORING MARKET, BY TYPE, 2022–2029 (MILLION SQUARE METERS)
TABLE 133 REST OF MIDDLE EAST & AFRICA: STONE FLOORING MARKET, BY APPLICATION, 2022–2029 (USD MILLION)
TABLE 134 REST OF MIDDLE EAST & AFRICA: STONE FLOORING MARKET, BY APPLICATION, 2022–2029 (MILLION SQUARE METERS)
TABLE 135 SOUTH AMERICA: STONE FLOORING MARKET, BY COUNTRY, 2022–2029 (USD MILLION)
TABLE 136 SOUTH AMERICA: STONE FLOORING MARKET, BY COUNTRY, 2022–2029 (MILLION SQUARE METERS)
TABLE 137 SOUTH AMERICA: STONE FLOORING MARKET, BY TYPE, 2022–2029 (USD MILLION)
TABLE 138 SOUTH AMERICA: STONE FLOORING MARKET, BY TYPE, 2022–2029 (MILLION SQUARE METERS)
TABLE 139 SOUTH AMERICA: STONE FLOORING MARKET, BY APPLICATION, 2022–2029 (USD MILLION)
TABLE 140 SOUTH AMERICA: STONE FLOORING MARKET, BY APPLICATION, 2022–2029 (MILLION SQUARE METERS)
TABLE 141 BRAZIL: STONE FLOORING MARKET, BY TYPE, 2022–2029 (USD MILLION)
TABLE 142 BRAZIL: STONE FLOORING MARKET, BY TYPE, 2022–2029 (MILLION SQUARE METERS)
TABLE 143 BRAZIL: STONE FLOORING MARKET, BY APPLICATION, 2022–2029 (USD MILLION)
TABLE 144 BRAZIL: STONE FLOORING MARKET, BY APPLICATION, 2022–2029 (MILLION SQUARE METERS)
TABLE 145 ARGENTINA: STONE FLOORING MARKET, BY TYPE, 2022–2029 (USD MILLION)
TABLE 146 ARGENTINA: STONE FLOORING MARKET, BY TYPE, 2022–2029 (MILLION SQUARE METERS)
TABLE 147 ARGENTINA: STONE FLOORING MARKET, BY APPLICATION, 2022–2029 (USD MILLION)
TABLE 148 ARGENTINA: STONE FLOORING MARKET, BY APPLICATION, 2022–2029 (MILLION SQUARE METERS)
TABLE 149 REST OF SOUTH AMERICA: STONE FLOORING MARKET, BY TYPE, 2022–2029 (USD MILLION)
TABLE 150 REST OF SOUTH AMERICA: STONE FLOORING MARKET, BY TYPE, 2022–2029 (MILLION SQUARE METERS)
TABLE 151 REST OF SOUTH AMERICA: STONE FLOORING MARKET, BY APPLICATION, 2022–2029 (USD MILLION)
TABLE 152 REST OF SOUTH AMERICA: STONE FLOORING MARKET, BY APPLICATION, 2022–2029 (MILLION SQUARE METERS)
TABLE 153 OVERVIEW OF STRATEGIES ADOPTED BY KEY PLAYERS, JANUARY 2019–JUNE 2024
TABLE 154 STONE FLOORING MARKET: DEGREE OF COMPETITION
TABLE 155 STONE FLOORING MARKET: REGION FOOTPRINT (10 COMPANIES)
TABLE 156 STONE FLOORING MARKET: TYPE FOOTPRINT (10 COMPANIES)
TABLE 157 STONE FLOORING MARKET: APPLICATION FOOTPRINT (10 COMPANIES)
TABLE 158 STONE FLOORING MARKET: COMPETITIVE BENCHMARKING OF KEY STARTUPS/SMES
TABLE 159 STONE FLOORING MARKET: DEALS, JANUARY 2019–JUNE 2024
TABLE 160 STONE FLOORING MARKET: EXPANSIONS, JANUARY 2019–JUNE 2024
TABLE 161 MOHAWK INDUSTRIES, INC.: COMPANY OVERVIEW
TABLE 162 MOHAWK INDUSTRIES, INC.: PRODUCTS/SOLUTIONS/SERVICES OFFERED
TABLE 163 SHAW INDUSTRIES GROUP, INC.: COMPANY OVERVIEW
TABLE 164 SHAW INDUSTRIES GROUP, INC.: PRODUCTS/SOLUTIONS/SERVICES OFFERED
TABLE 165 SHAW INDUSTRIES GROUP, INC.: DEALS, JANUARY 2019–JUNE 2024
TABLE 166 SHAW INDUSTRIES GROUP, INC.: EXPANSIONS, JANUARY 2019–JUNE 2024
TABLE 167 POLYCOR INC.: COMPANY OVERVIEW
TABLE 168 POLYCOR INC.: PRODUCTS/SOLUTIONS/SERVICES OFFERED
TABLE 169 POLYCOR INC.: DEALS, JANUARY 2019–JUNE 2024
TABLE 170 EMSER TILE: COMPANY OVERVIEW
TABLE 171 EMSER TILE: PRODUCTS/SOLUTIONS/SERVICES OFFERED
TABLE 172 EMSER TILE: EXPANSIONS, JANUARY 2019–JUNE 2024
TABLE 173 STONE SOURCE LLC: COMPANY OVERVIEW
TABLE 174 STONE SOURCE LLC: PRODUCTS/SOLUTIONS/SERVICES OFFERED
TABLE 175 STONE SOURCE LLC: DEALS, JANUARY 2019–JUNE 2024
TABLE 176 LEVANTINA Y ASOCIADOS DE MINERALES, S.A.: COMPANY OVERVIEW
TABLE 177 LEVANTINA Y ASOCIADOS DE MINERALES, S.A.: PRODUCTS/SOLUTIONS/ SERVICES OFFERED
TABLE 178 MADHAV MARBLES AND GRANITES LTD.: COMPANY OVERVIEW
TABLE 179 MADHAV MARBLES AND GRANITES LTD.: PRODUCTS/SOLUTIONS/ SERVICES OFFERED
TABLE 180 ARO GRANITE INDUSTRIES LTD.: COMPANY OVERVIEW
TABLE 181 ARO GRANITE INDUSTRIES LTD.: PRODUCTS/SOLUTIONS/SERVICES OFFERED
TABLE 182 ASIAN GRANITO INDIA LIMITED: COMPANY OVERVIEW
TABLE 183 ASIAN GRANITO INDIA LIMITED: PRODUCTS/SOLUTIONS/SERVICES OFFERED
TABLE 184 OLD WORLD STONE IMPORTS FLOORING AND DESIGN: COMPANY OVERVIEW
TABLE 185 OLD WORLD STONE IMPORTS FLOORING AND DESIGN: PRODUCTS/SOLUTIONS/SERVICES OFFERED
TABLE 186 FLOORING MARKET, BY MATERIAL, 2021–2028 (USD MILLION)
TABLE 187 FLOORING MARKET, BY MATERIAL, 2021–2028 (MILLION SQUARE METERS)
TABLE 188 FLOORING MARKET, BY END-USE INDUSTRY, 2021–2028 (USD MILLION)
TABLE 189 FLOORING MARKET, BY END-USE INDUSTRY, 2021–2028 (MILLION SQUARE METERS)
TABLE 190 FLOORING MARKET, BY REGION, 2021–2028 (USD MILLION)
TABLE 191 FLOORING MARKET, BY REGION, 2021–2028 (MILLION SQUARE METERS)
TABLE 192 FLOOR ADHESIVE MARKET, BY RESIN TYPE, 2021–2022 (USD MILLION)
TABLE 193 FLOOR ADHESIVE MARKET, BY RESIN TYPE, 2023–2028 (USD MILLION)
TABLE 194 FLOOR ADHESIVE MARKET, BY RESIN TYPE, 2021–2022 (KILOTONS)
TABLE 195 FLOOR ADHESIVE MARKET, BY RESIN TYPE, 2023–2028 (KILOTONS)
TABLE 196 FLOOR ADHESIVE MARKET, BY TECHNOLOGY, 2021–2022 (USD MILLION)
TABLE 197 FLOOR ADHESIVE MARKET, BY TECHNOLOGY, 2023–2028 (USD MILLION)
TABLE 198 FLOOR ADHESIVE MARKET, BY TECHNOLOGY, 2021–2022 (KILOTONS)
TABLE 199 FLOOR ADHESIVE MARKET, BY TECHNOLOGY, 2023–2028 (KILOTONS)
TABLE 200 FLOOR ADHESIVE MARKET, BY END USE, 2021–2022 (USD MILLION)
TABLE 201 FLOOR ADHESIVE MARKET, BY END USE, 2023–2028 (USD MILLION)
TABLE 202 FLOOR ADHESIVE MARKET, BY END USE, 2021–2022 (KILOTONS)
TABLE 203 FLOOR ADHESIVE MARKET, BY END USE, 2023–2028 (KILOTONS)
TABLE 204 FLOOR ADHESIVE MARKET, BY APPLICATION, 2021–2022 (USD MILLION)
TABLE 205 FLOOR ADHESIVE MARKET, BY APPLICATION, 2023–2028 (USD MILLION)
TABLE 206 FLOOR ADHESIVE MARKET, BY APPLICATION, 2021–2022 (KILOTONS)
TABLE 207 FLOOR ADHESIVE MARKET, BY APPLICATION, 2023–2028 (KILOTONS)
TABLE 208 FLOOR ADHESIVE MARKET, BY REGION, 2021–2022 (USD MILLION)
TABLE 209 FLOOR ADHESIVE MARKET, BY REGION, 2023–2028 (USD MILLION)
TABLE 210 FLOOR ADHESIVE MARKET, BY REGION, 2021–2022 (KILOTONS)
TABLE 211 FLOOR ADHESIVE MARKET, BY REGION, 2023–2028 (KILOTONS)
LIST OF FIGURES (43 FIGURES)
FIGURE 1 STONE FLOORING MARKET: RESEARCH DESIGN
FIGURE 2 MARKET SIZE ESTIMATION: TOP-DOWN APPROACH
FIGURE 3 MARKET SIZE ESTIMATION: BOTTOM-UP APPROACH
FIGURE 4 STONE FLOORING MARKET: APPROACH 1
FIGURE 5 STONE FLOORING MARKET: APPROACH 2
FIGURE 6 STONE FLOORING MARKET: DATA TRIANGULATION
FIGURE 7 GRANITE SEGMENT TO LEAD STONE FLOORING MARKET DURING FORECAST PERIOD
FIGURE 8 RESIDENTIAL SEGMENT TO DOMINATE MARKET DURING FORECAST PERIOD
FIGURE 9 ASIA PACIFIC HELD LARGEST SHARE OF STONE FLOORING MARKET IN 2023
FIGURE 10 ASIA PACIFIC TO REGISTER FASTEST GROWTH IN STONE FLOORING MARKET DURING FORECAST PERIOD
FIGURE 11 GRANITE SEGMENT TO LEAD STONE FLOORING MARKET DURING FORECAST PERIOD
FIGURE 12 RESIDENTIAL APPLICATION TO DOMINATE STONE FLOORING MARKET DURING FORECAST PERIOD
FIGURE 13 CHINA ACCOUNTED FOR LARGEST SHARE OF STONE FLOORING MARKET IN ASIA PACIFIC IN 2023
FIGURE 14 STONE FLOORING MARKET IN INDIA TO REGISTER HIGHEST CAGR DURING FORECAST PERIOD
FIGURE 15 STONE FLOORING MARKET: DRIVERS, RESTRAINTS, OPPORTUNITIES, AND CHALLENGES
FIGURE 16 ANNUAL GROWTH RATE FOR INDUSTRY (INCLUDING CONSTRUCTION)
FIGURE 17 TOP APPLICANTS FOR STONE FLOORING-RELATED PATENTS (2014–2023)
FIGURE 18 INFLUENCE OF STAKEHOLDERS ON BUYING PROCESS FOR TOP TWO APPLICATIONS
FIGURE 19 KEY BUYING CRITERIA FOR TOP TWO APPLICATIONS
FIGURE 20 INVESTOR DEALS & FUNDING FOR HOME IMPROVEMENT SERVICES
FIGURE 21 EXPORT SCENARIO: HS CODE 680210 TILES, CUBES, AND OTHER PROCESSED ARTICLES OF NATURAL STONE, INCL. SLATE, FOR MOSAICS, 2019–2023 (USD MILLION)
FIGURE 22 IMPORT SCENARIO: HS CODE 680210 TILES, CUBES, AND OTHER PROCESSED ARTICLES OF NATURAL STONE, INCL. SLATE, FOR MOSAICS, 2019–2023 (USD MILLION)
FIGURE 23 STONE FLOORING MARKET: ECOSYSTEM ANALYSIS
FIGURE 24 STONE FLOORING MARKET: PORTER’S FIVE FORCES ANALYSIS
FIGURE 25 STONE FLOORING MARKET: AVERAGE SELLING PRICE, BY REGION (USD/ SQUARE METER)
FIGURE 26 REVENUE SHIFT FOR STONE FLOORING MANUFACTURERS
FIGURE 27 RESIDENTIAL SEGMENT TO DOMINATE MARKET DURING FORECAST PERIOD
FIGURE 28 GRANITE SEGMENT TO DOMINATE MARKET DURING FORECAST PERIOD
FIGURE 29 INDIA TO RECORD FASTEST GROWTH IN GLOBAL STONE FLOORING MARKET DURING FORECAST PERIOD
FIGURE 30 ASIA PACIFIC: STONE FLOORING MARKET SNAPSHOT
FIGURE 31 EUROPE: STONE FLOORING MARKET SNAPSHOT
FIGURE 32 SHARE OF KEY PLAYERS IN STONE FLOORING MARKET, 2023
FIGURE 33 RANKING OF TOP FIVE PLAYERS IN STONE FLOORING MARKET
FIGURE 34 REVENUE OF KEY PLAYERS, 2019–2023
FIGURE 35 COMPANY VALUATION (USD BILLION)
FIGURE 36 FINANCIAL MATRIX: EV/EBITDA RATIO
FIGURE 37 STONE FLOORING MARKET: PRODUCT COMPARISON
FIGURE 38 STONE FLOORING MARKET: COMPANY EVALUATION MATRIX (KEY PLAYERS), 2023
FIGURE 39 STONE FLOORING MARKET: COMPANY FOOTPRINT (10 COMPANIES)
FIGURE 40 STONE FLOORING MARKET: COMPANY EVALUATION MATRIX (STARTUPS/SMES), 2023
FIGURE 41 MOHAWK INDUSTRIES, INC.: COMPANY SNAPSHOT (2023)
FIGURE 42 ARO GRANITE INDUSTRIES LTD.: COMPANY SNAPSHOT (2023)
FIGURE 43 ASIAN GRANITO INDIA LIMITED: COMPANY SNAPSHOT (2023)


Growth opportunities and latent adjacency in Stone Flooring Market