Spray Pyrolysis Market

Report Code CH 9234
Published in Dec, 2024, By MarketsandMarkets™
Download PDF

Choose License Type

Buy Report Now Inquire Before Buying

Spray Pyrolysis Market by Device Type (Ultrasonic Spray Pyrolysis System, High-Throughput Spray Pyrolysis System), Process, Application, End-Use Industry (Energy & Utilities, Electronics & Semiconductors), and Region - Global Forecast to 2029

Overview

The global spray pyrolysis market is projected to grow from USD 167.3 million in 2024 to USD 234.2 million by 2029, at a CAGR of 7.0%. The increasing use of spray pyrolysis systems in the electronics & semiconductor and pharmaceuticals & biotechnology industry in emerging economies is expected to drive the market during the forecast period. The strong growth in the solar sector supports the growth of the spray pyrolysis market. This technology plays a critical role in enhancing solar efficiency and manufacturing scalability. Also, various government initiatives of key countries, namely China, India, the US, and Germany in the solar and battery sectors, further propel the demand for spray pyrolysis systems.

Spray Pyrolysis Market

Attractive Opportunities in the Spray Pyrolysis Market

Asia Pacific

The availability of low-cost raw material and labor along with increasing demand from energy & utilities and electronics industries in Asia Pacific drive the spray pyrolysis market.

Rapid growth in the battery sector is contributing to the growth of the market in Asia Pacific.

China’s dominance in the manufacturing sector is driving significant growth in the Asia Pacific market.

The Asia Pacific spray pyrolysis market is expected to be worth USD 112.2 million by 2029, projected to grow at a CAGR of 8.6%, during the forecast period.

Easy availability of raw materials, low-cost labor, along with government support are growth opportunities for the spray pyrolysis market.

Global Spray Pyrolysis Market Dynamics

DRIVER: Rapid growth in the global battery sector

The global battery sector is experiencing remarkable growth at an impressive rate. It is a primary factor fuelling the development of the spray pyrolysis market since this technology is integral in the manufacture of sophisticated materials for the next generation of energy storage systems. Spray pyrolysis makes it possible to manufacture high-purity and well-controlled cathodes, anodes, and solid electrolytes that may be useful in achieving improved battery performance, higher energy density, and extended life cycle. The ability of the technique to control the particle size, morphology, and composition makes it valuable in producing materials that are suited to meet the high specifications of modern batteries, such as lithium-ion batteries.

The global demand for batteries continuously increases due to the increased adoption of electric vehicles, renewable energy storage, and portable electronics. Governments of various countries and prominent companies invest heavily in battery production facilities, further boosting the demand for spray pyrolysis systems for advanced material synthesis. This method is compatible with many battery chemistries, make spray pyrolysis system valuable in addressing the demand for the battery sector. These factors are driving the growth of the spray pyrolysis market.

RESTRAINT: High competition from alternative technologies

The growing spray pyrolysis market faces one restraining factor, which is high competition from alternative technologies. For thin-film coatings and nanoparticle synthesis, established techniques such as chemical vapor deposition (CVD) and sol-gel methods can often provide similar or even superior properties. Such methods are already well-accepted in the electronics and solar energy and catalysis industries as they provide a higher precision or higher rates of deposition. Similarly, the same manner, technologies such as atomic layer deposition (ALD) and sputtering have a slighter edge over spray pyrolysis due to their precise control in producing ultra-thin films that are highly uniform and have atomic-level control. The existence of these alternative techniques, along with the suitability of these methods for either large-scale manufacturing or specific applications are expected to inhibit the embrace of spray pyrolysis systems.


OPPORTUNITY: Emerging applications of spray pyrolysis in healthcare

The development of nanotechnology and biomedical materials is creating new opportunities for the spray pyrolysis market in the healthcare segment. A wide variety of nanoparticles, as well as thin films and coatings, can be synthesized using spray pyrolysis with controlled particle size composition, and morphology, which makes it ideal for drug delivery systems, biosensors, and biocompatible implant coatings. This system is highly valuable in creating nanoparticles for drug delivery, which enhances drug efficacy while minimizing side effects. The method is also being researched to apply bioactive coatings to medical implants, such as orthopedic and dental implants, which could improve the compatibility of the implants and prevent the risk of infection. It is gaining traction in diagnostic methods, where coatings made from spray pyrolysis are used in biosensors and lab-on-chip systems to monitor and detect highly sensitive diseases. The scalability, precision, and versatility of spray pyrolysis are consistent with the need in the healthcare industry for efficient and affordable technologies, presenting good growth prospects in this industry.

CHALLENGES: Complexity of process control in spray pyrolysis

The complexity of process control is acting as a significant challenge for its market growth. The process involves intricate steps such as droplet formation, thermal decomposition, and film deposition, all of which must be carefully regulated to ensure uniformity, purity, and desired particle size or film thickness. Factors like precursor concentration, droplet size, substrate temperature, and carrier gas flow require precise optimization, and even minor deviations can lead to defects, inconsistent material quality, or reduced efficiency. This complexity increases the need for advanced equipment and skilled operators, driving up production costs and limiting its accessibility to smaller manufacturers or research facilities. In addition, achieving consistent scalability from lab-scale to industrial production remains a challenge, as maintaining process stability becomes increasingly difficult at larger scales. These factors can make spray pyrolysis less competitive compared to simpler or more established alternative technologies, restraining its adoption in certain markets.

Global Spray Pyrolysis Market Ecosystem Analysis

The spray pyrolysis ecosystem comprises raw material/equipment suppliers providing chemicals, and equipment to manufacturers, manufacturers conducting research & development of the final products for use in various industries, and intermediaries & distributors providing a link between manufacturers and end users by supplying final products. They work together to supply the final products to end users in different industries. It involves a series of processes, from raw material procurement to manufacturing the end products and distributing them to end users for further use in various end-use industries.

Spray Pyrolysis Market
 

The energy & utilities industry is projected to be the largest end-use industry during the forecast period.

The energy & utilities segment is a major end-use industry for the spray pyrolysis market. This market is driven by various applications in renewable energy and battery storage systems. This technique has found applications in fabricating films and nanomaterials to enhance the efficiency, durability, and performance of solar panels, batteries, or fuel cells. For example, in the solar energy sector, they are utilized for manufacturing coatings for photovoltaic cells as well as electrodes for batteries and fuel cells that are associated with superior electrochemical properties. As the world shifts toward clean energy, the spray pyrolysis technique plays a key role in advancing next-generation energy technologies.

Ultrasonic spray pyrolysis system is expected to be the largest type during the forecast period in terms of value.

Ultrasonic spray pyrolysis systems use high-frequency ultrasonic waves. These waves atomize a precursor solution and transport the resulting aerosol droplets to a heated zone for thermal decomposition of the solution into nanoparticles, thin films, or coatings. This technique guarantees complete control of the final product with regard to droplet sizes and material attributes. Ultrasonic spray pyrolysis is particularly suitable for the synthesis of advanced materials like oxides, semiconductors, and nanostructures, which has made it useful in a wide range of areas, including electronics, energy storage, catalysis, and biomedicine. Its small scale, cost-effectiveness, and ability to accommodate different precursors have led to its extensive application in research and industrial processes.

Asia Pacific to account for the largest market share during the forecast period.

The major markets for spray pyrolysis are Europe, North America, and Asia Pacific. The availability of low-cost raw materials and labor, as well as the increased growth in solar, battery, pharmaceutical, and chemical industries, are expected to make Asia Pacific an attractive investment destination for spray pyrolysis system manufacturers. Various countries, including China, India, South Korea, and Japan are heavily investing in solar energy and manufacturing capacity. The region is also supported by government policies and schemes such as India’s National Solar Mission, Pradhan Mantri Kisan Urja Suraksha Evam Utthan Mahabhiyan (PM-KUSUM), and Made in China 2025.

HIGHEST CAGR MARKET IN 2023
CHINA FASTEST GROWING MARKET IN THE REGION
Spray Pyrolysis Market

Recent Developments of Spray Pyrolysis Market

  • In September 2021, Sono-Tek launched a new program to enhance its application expertise in emerging markets identified as having significant growth opportunities. The program is designed to focus on identifying and building application expertise in key markets where Sono-Tek’s comprehensive coating solutions can demonstrate their superiority over other coating technologies. The primary target markets are expected to center on next-generation, technology-driven products requiring functional coatings.

Key Market Players

Want to explore hidden markets that can drive new revenue in Spray Pyrolysis Market?

Scope of the Report

Report Metric Details
Market size available for years 2021-2029
Base Year Considered 2023
Forecast period 2024-2029
Forecast units Value (USD Million), Volume (Units)
Segments Device Type, Process, Application, End Use Industry, and Region
Regions Asia Pacific, North America, Europe, Middle East & Africa, and South America


Key Questions Addressed by the Report

Which are the major companies in the spray pyrolysis market?
Hansun (China), Sono-Tek Corporation (US), MTI Corporation (US), Zhengzhou CY Scientific Instrument Co., Ltd. (China), Acmefil Engineering Systems Pvt. Ltd. (India), Holmarc Opto-Mechatronics Ltd. (India), Cheersonic Ultrasonic Equipments Co., Ltd. (China), Siansonic (China), Navson Technologies Pvt. Ltd. (India), and Shanghai Huashao Intelligent Equipment Co., Ltd. (China).
What are the drivers and opportunities for the spray pyrolysis market?
Rapid growth in the global battery sector and increased growth in the electronics sector boost the market. The emerging application of spray pyrolysis in healthcare offers growth opportunities.
Which region is expected to hold the highest market share?
The Asia Pacific region, driven by economic growth in countries such as China and India, is expected to account for the highest market share due to increased demand from various end-use industries.
What is the total CAGR expected to be recorded for the spray pyrolysis market during 2024–2029?
The market is expected to record a CAGR of 7.0% during 2024–2029.
How is the spray pyrolysis market aligned?
The market is highly competitive, with manufacturers adopting strategies such as investment, expansion, partnerships, and the launch of new programs to maintain market presence.


Personalize This Research

  • Triangulate with your Own Data
  • Get Data as per your Format and Definition
  • Gain a Deeper Dive on a Specific Application, Geography, Customer or Competitor
  • Any level of Personalization
Request A Free Customisation

Let Us Help You

  • What are the Known and Unknown Adjacencies Impacting the Spray Pyrolysis Market
  • What will your New Revenue Sources be?
  • Who will be your Top Customer; what will make them switch?
  • Defend your Market Share or Win Competitors
  • Get a Scorecard for Target Partners
Customized Workshop Request

Table of Contents

Exclusive indicates content/data unique to MarketsandMarkets and not available with any competitors.

TITLE
PAGE NO
INTRODUCTION
21
RESEARCH METHODOLOGY
25
EXECUTIVE SUMMARY
34
PREMIUM INSIGHTS
38
MARKET OVERVIEW
41
  • 5.1 INTRODUCTION
  • 5.2 MARKET DYNAMICS
    DRIVERS
    - Expanding solar energy industry
    - Rapid growth of global battery industry
    - Increased use of electronics and optoelectronics
    RESTRAINTS
    - High competition from alternative technologies
    OPPORTUNITIES
    - Emerging applications in healthcare industry
    - Increasing adoption in environmental applications
    CHALLENGES
    - Complexity associated with process control in spray pyrolysis
  • 5.3 PORTER’S FIVE FORCES ANALYSIS
    THREAT OF NEW ENTRANTS
    THREAT OF SUBSTITUTES
    BARGAINING POWER OF SUPPLIERS
    BARGAINING POWER OF BUYERS
    INTENSITY OF COMPETITIVE RIVALRY
  • 5.4 KEY STAKEHOLDERS AND BUYING CRITERIA
    KEY STAKEHOLDERS IN BUYING PROCESS
    BUYING CRITERIA
  • 5.5 VALUE CHAIN ANALYSIS
  • 5.6 ECOSYSTEM ANALYSIS
  • 5.7 KEY CONFERENCES AND EVENTS, 2024–2025
  • 5.8 PATENT ANALYSIS
    METHODOLOGY
    DOCUMENT TYPES
    PUBLICATION TRENDS
    INSIGHTS
    JURISDICTION ANALYSIS
    TOP APPLICANTS
  • 5.9 TRADE ANALYSIS
    IMPORT SCENARIO (HS CODE 8424)
    EXPORT SCENARIO (HS CODE 8424)
  • 5.10 IMPACT OF AI
  • 5.11 REGULATORY LANDSCAPE
    REGULATORY BODIES, GOVERNMENT AGENCIES, AND OTHER ORGANIZATIONS
    REGULATIONS/STANDARDS ON ELECTRIC VEHICLE (EV) BATTERIES
    EUROPE AND US REGULATIONS ON LITHIUM-ION BATTERY PRODUCTION
    REGULATIONS ON BATTERIES AND ACCUMULATORS
    REGULATIONS ON TRANSPORTATION OF LITHIUM-ION BATTERIES
  • 5.12 MACROECONOMIC INDICATORS
    GLOBAL GDP TRENDS
    GLOBAL VEHICLE PRODUCTION STATISTICS
  • 5.13 TECHNOLOGY ANALYSIS
    KEY TECHNOLOGIES
    - High-throughput spray pyrolysis system
    - Advanced atomization techniques
    COMPLEMENTARY TECHNOLOGIES
    - Plasma-assisted spray pyrolysis
  • 5.14 PRICING ANALYSIS
    AVERAGE SELLING PRICE TREND, BY REGION
    INDICATIVE PRICING ANALYSIS OF KEY PLAYERS, BY DEVICE TYPE
    INDICATIVE PRICING ANALYSIS OF KEY PLAYERS, BY END-USE INDUSTRY
  • 5.15 INVESTMENT AND FUNDING SCENARIO
  • 5.16 CASE STUDY ANALYSIS
    HOLMARC OPTO-MECHATRONICS HELPED WAAREE ENERGIES TACKLE CHALLENGES IN ACHIEVING CONSISTENT AND UNIFORM DEPOSITION OF TCO LAYERS ACROSS LARGE GLASS SUBSTRATES
  • 5.17 TRENDS/DISRUPTIONS IMPACTING CUSTOMER BUSINESS
SPRAY PYROLYSIS MARKET, BY PROCESS
72
  • 6.1 INTRODUCTION
  • 6.2 SLOW PYROLYSIS
  • 6.3 FAST PYROLYSIS
  • 6.4 FLASH PYROLYSIS
SPRAY PYROLYSIS MARKET, BY DEVICE TYPE
73
  • 7.1 INTRODUCTION
  • 7.2 ULTRASONIC SPRAY PYROLYSIS SYSTEM
    POTENTIAL TO REVOLUTIONIZE THIN FILM PRODUCTION TO DRIVE MARKET
  • 7.3 HIGH THROUGHPUT SPRAY PYROLYSIS SYSTEM
    INCREASING APPLICATIONS IN SOLAR AND ELECTRONICS SYSTEMS TO BOOST DEMAND
  • 7.4 FLAME-ASSISTED SPRAY PYROLYSIS SYSTEM
    GROWING DEMAND FROM VARIOUS END-USE INDUSTRIES TO DRIVE MARKET
  • 7.5 VACUUM SPRAY PYROLYSIS SYSTEM
    SURGING USE IN SOLAR CELLS AND SENSORS TO BOOST MARKET GROWTH
SPRAY PYROLYSIS MARKET, BY APPLICATION
78
  • 8.1 INTRODUCTION
  • 8.2 THIN & THICK FILM DEPOSITION
    RISING APPLICATIONS IN TRANSISTORS AND DIODES TO DRIVE MARKET
  • 8.3 NANOPARTICLE SYNTHESIS
    INCREASING DEMAND FROM MEDICAL SECTOR TO DRIVE MARKET
  • 8.4 OTHER APPLICATIONS
SPRAY PYROLYSIS MARKET, BY END-USE INDUSTRY
82
  • 9.1 INTRODUCTION
  • 9.2 ENERGY & UTILITIES
    GLOBAL TRANSITION TO RENEWABLE ENERGY TO DRIVE SEGMENT
    - Solar panels
    - Batteries
    - Fuel cells
    - Other energy & utilities industries
  • 9.3 ELECTRONICS & SEMICONDUCTORS
    RAPID ADVANCEMENTS IN MINIATURIZATION AND FUNCTIONALITY TO BOOST DEMAND
    - Sensors & detectors
    - Optoelectronics
    - Transistors
    - Semiconductor devices & integrated circuits (ICs)
    - Other electronics & semiconductors industries
  • 9.4 CHEMICALS & PETROCHEMICALS
    HIGH USE TO MANUFACTURE HIGH-PURITY NANOPARTICLES AND COATING PRECURSORS TO DRIVE MARKET
    - Specialty chemicals production
    - Polymer manufacturing
  • 9.5 PHARMACEUTICAL & BIOTECHNOLOGY
    INCREASING DEMAND FOR ACTIVE PHARMACEUTICAL INGREDIENTS TO DRIVE MARKET
  • 9.6 OTHER END-USE INDUSTRIES
SPRAY PYROLYSIS MARKET, BY REGION
94
  • 10.1 INTRODUCTION
  • 10.2 NORTH AMERICA
    US
    - Booming solar energy industry to drive market
    CANADA
    - High investments in battery sector to boost market growth
    MEXICO
    - Expansion of solar and EV industries to drive market
  • 10.3 EUROPE
    GERMANY
    - High growth of solar industry to drive market
    UK
    - Government-led support and high investments in energy and utilities industries to drive market
    FRANCE
    - Rising investments in renewable energy, battery manufacturing, and EV production to drive market
    ITALY
    - Booming solar industry to drive market
    SPAIN
    - Renewable energy ambitions, EV market growth, and surge in battery demand to drive market
    REST OF EUROPE
  • 10.4 ASIA PACIFIC
    CHINA
    - Industrial expansion and government-led initiatives promoting sustainable practices to propel market
    JAPAN
    - Growing electronics industry to drive market
    INDIA
    - Strong demand from renewable energy, battery storage, and electronics industries to drive market
    SOUTH KOREA
    - High battery production and growing EV market to drive market
    REST OF ASIA PACIFIC
  • 10.5 MIDDLE EAST & AFRICA
    GCC COUNTRIES
    - Saudi Arabia
    - UAE
    - Rest of GCC countries
    SOUTH AFRICA
    - Rising demand for advanced battery materials to boost market growth
    REST OF MIDDLE EAST & AFRICA
  • 10.6 SOUTH AMERICA
    BRAZIL
    - Expanding automotive industry to drive market
    ARGENTINA
    - Growing solar industry to drive market
    REST OF SOUTH AMERICA
COMPETITIVE LANDSCAPE
165
  • 11.1 OVERVIEW
  • 11.2 KEY PLAYER STRATEGIES/RIGHT TO WIN
  • 11.3 REVENUE ANALYSIS
  • 11.4 MARKET SHARE ANALYSIS
  • 11.5 COMPANY VALUATION AND FINANCIAL METRICS
  • 11.6 BRAND/PRODUCT COMPARISON ANALYSIS
  • 11.7 COMPANY EVALUATION MATRIX: KEY PLAYERS, 2023
    STARS
    EMERGING LEADERS
    PERVASIVE PLAYERS
    PARTICIPANTS
    COMPANY FOOTPRINT: KEY PLAYERS, 2023
    - Company footprint
    - Application footprint
    - End-use industry footprint
    - Region footprint
  • 11.8 COMPANY EVALUATION MATRIX: STARTUPS/SMES, 2023
    PROGRESSIVE COMPANIES
    RESPONSIVE COMPANIES
    DYNAMIC COMPANIES
    STARTING BLOCKS
    COMPETITIVE BENCHMARKING: STARTUPS/SMES, 2023
    - Detailed list of key startups/SMEs
    - Competitive benchmarking of key startups/SMEs
  • 11.9 COMPETITIVE SCENARIO
    OTHERS
COMPANY PROFILES
182
  • 12.1 KEY PLAYERS
    MTI CORPORATION
    - Business overview
    - Products/Solutions/Services offered
    - MnM view
    SONO-TEK CORPORATION
    - Business overview
    - Products/Solutions/Services offered
    - Recent developments
    - MnM view
    HOLMARC OPTO-MECHATRONICS LTD.
    - Business overview
    - Products/Solutions/Services offered
    - MnM view
    ACMEFIL ENGINEERING SYSTEMS PVT LTD.
    - Business overview
    - Products/Solutions/Services offered
    - MnM view
    ZHENGZHOU CY SCIENTIFIC INSTRUMENT CO., LTD.
    - Business overview
    - Products/Solutions/Services offered
    - MnM view
    HANSUN
    - Business overview
    - Products/Solutions/Services offered
    - MnM view
    CHEERSONIC ULTRASONICS EQUIPMENTS CO., LTD.
    - Business overview
    - Products/Solutions/Services offered
    - MnM view
    SIANSONIC
    - Business overview
    - Products/Solutions/Services offered
    - MnM view
    NAVSON TECHNOLOGIES PVT. LTD.
    - Business overview
    - Products/Solutions/Services offered
    - MnM view
    SHANGHAI HUASHAO INTELLIGENT EQUIPMENT CO., LTD.
    - Business overview
    - Products/Solutions/Services offered
    - MnM view
  • 12.2 OTHER PLAYERS
    PRIZMA
    SHENYANG KEJING AUTO-INSTRUMENT CO., LTD.
    XIAMEN TMAX BATTERY EQUIPMENTS LIMITED
    SONEAR INC.
    VB CERAMIC CONSULTANTS (VBCC)
    XIAMEN LITH MACHINE LIMITED
    PREMIER SOLUTIONS PTE. LTD.
    DAS INSTRUMENT AND SOLUTIONS
    CAPITAL LAB TECH
    INTEGRATED ENERGY ENGINEERING
    HANGZHOU POWERSONIC EQUIPMENT CO., LTD.
    RUBRODER GROUP
    RK ENGINEERING SERVICE
    WAVENXD TECHNOLOGIES PVT. LTD.
    PI-KEM
APPENDIX
207
  • 13.1 DISCUSSION GUIDE
  • 13.2 KNOWLEDGESTORE: MARKETSANDMARKETS’ SUBSCRIPTION PORTAL
  • 13.3 CUSTOMIZATION OPTIONS
  • 13.4 RELATED REPORTS
  • 13.5 AUTHOR DETAILS
LIST OF TABLES
 
  • TABLE 1 SPRAY PYROLYSIS MARKET: INCLUSIONS AND EXCLUSIONS
  • TABLE 2 SPRAY PYROLYSIS MARKET: PORTER’S FIVE FORCES ANALYSIS
  • TABLE 3 INFLUENCE OF STAKEHOLDERS ON BUYING PROCESS, BY END-USE INDUSTRY (%)
  • TABLE 4 KEY BUYING CRITERIA, BY END-USE INDUSTRY
  • TABLE 5 ROLES OF COMPANIES IN SPRAY PYROLYSIS ECOSYSTEM
  • TABLE 6 SPRAY PYROLYSIS MARKET: LIST OF KEY CONFERENCES AND EVENTS, 2024–2025
  • TABLE 7 TOP 10 PATENT OWNERS DURING LAST 10 YEARS, 2014–2023
  • TABLE 8 NORTH AMERICA: LIST OF REGULATORY BODIES, GOVERNMENT AGENCIES, AND OTHER ORGANIZATIONS
  • TABLE 9 EUROPE: LIST OF REGULATORY BODIES, GOVERNMENT AGENCIES, AND OTHER ORGANIZATIONS
  • TABLE 10 REGULATIONS/VOLUNTARY PROCEDURES FOR EV BATTERY PERFORMANCE
  • TABLE 11 REGULATIONS/VOLUNTARY PROCEDURES FOR EV BATTERY DURABILITY
  • TABLE 12 REGULATIONS/VOLUNTARY PROCEDURES FOR EV BATTERY SAFETY
  • TABLE 13 REGULATIONS/VOLUNTARY PROCEDURES FOR EV BATTERY RECYCLING
  • TABLE 14 TRENDS OF PER CAPITA GDP, BY COUNTRY, 2020–2023 (USD)
  • TABLE 15 GDP GROWTH ESTIMATES AND PROJECTIONS OF KEY COUNTRIES, 2024–2027 (USD)
  • TABLE 16 VEHICLE PRODUCTION STATISTICS, BY COUNTRY, 2021–2023 (UNITS)
  • TABLE 17 INDICATIVE PRICING ANALYSIS OF SPRAY PYROLYSIS SYSTEMS OFFERED BY KEY PLAYERS, BY DEVICE TYPE, 2023 (USD/UNIT)
  • TABLE 18 INDICATIVE PRICING ANALYSIS OF SPRAY PYROLYSIS SYSTEMS OFFERED BY KEY PLAYERS, BY END-USE INDUSTRY, 2023 (USD/UNIT)
  • TABLE 19 SPRAY PYROLYSIS MARKET, BY DEVICE TYPE, 2021–2023 (USD MILLION)
  • TABLE 20 SPRAY PYROLYSIS MARKET, BY DEVICE TYPE, 2024–2029 (USD MILLION)
  • TABLE 21 SPRAY PYROLYSIS MARKET, BY DEVICE TYPE, 2021–2023 (UNITS)
  • TABLE 22 SPRAY PYROLYSIS MARKET, BY DEVICE TYPE, 2024–2029 (UNITS)
  • TABLE 23 SPRAY PYROLYSIS MARKET, BY APPLICATION, 2021–2023 (USD MILLION)
  • TABLE 24 SPRAY PYROLYSIS MARKET, BY APPLICATION, 2024–2029 (USD MILLION)
  • TABLE 25 SPRAY PYROLYSIS MARKET, BY APPLICATION, 2021–2023 (UNITS)
  • TABLE 26 SPRAY PYROLYSIS MARKET, BY APPLICATION, 2024–2029 (UNITS)
  • TABLE 27 SPRAY PYROLYSIS MARKET, BY END-USE INDUSTRY, 2021–2023 (USD MILLION)
  • TABLE 28 SPRAY PYROLYSIS MARKET, BY END-USE INDUSTRY, 2024–2029 (USD MILLION)
  • TABLE 29 SPRAY PYROLYSIS MARKET, BY END-USE INDUSTRY, 2021–2023 (UNITS)
  • TABLE 30 SPRAY PYROLYSIS MARKET, BY END-USE INDUSTRY, 2024–2029 (UNITS)
  • TABLE 31 SPRAY PYROLYSIS MARKET, BY REGION, 2021–2023 (USD MILLION)
  • TABLE 32 SPRAY PYROLYSIS MARKET, BY REGION, 2024–2029 (USD MILLION)
  • TABLE 33 SPRAY PYROLYSIS MARKET, BY REGION, 2021–2023 (UNITS)
  • TABLE 34 SPRAY PYROLYSIS MARKET, BY REGION, 2024–2029 (UNITS)
  • TABLE 35 NORTH AMERICA: SPRAY PYROLYSIS MARKET, BY COUNTRY, 2021–2023 (USD MILLION)
  • TABLE 36 NORTH AMERICA: SPRAY PYROLYSIS MARKET, BY COUNTRY, 2024–2029 (USD MILLION)
  • TABLE 37 NORTH AMERICA: SPRAY PYROLYSIS MARKET, BY COUNTRY, 2021–2023 (UNITS)
  • TABLE 38 NORTH AMERICA: SPRAY PYROLYSIS MARKET, BY COUNTRY, 2024–2029 (UNITS)
  • TABLE 39 NORTH AMERICA: SPRAY PYROLYSIS MARKET, BY END-USE INDUSTRY, 2021–2023 (USD MILLION)
  • TABLE 40 NORTH AMERICA: SPRAY PYROLYSIS MARKET, BY END-USE INDUSTRY,2024–2029 (USD MILLION)
  • TABLE 41 NORTH AMERICA: SPRAY PYROLYSIS MARKET, BY END-USE INDUSTRY, 2021–2023 (UNITS)
  • TABLE 42 NORTH AMERICA: SPRAY PYROLYSIS MARKET, BY END-USE INDUSTRY, 2024–2029 (UNITS)
  • TABLE 43 US: SPRAY PYROLYSIS MARKET, BY END-USE INDUSTRY, 2021–2023 (USD MILLION)
  • TABLE 44 US: SPRAY PYROLYSIS MARKET, BY END-USE INDUSTRY, 2024–2029 (USD MILLION)
  • TABLE 45 US: SPRAY PYROLYSIS MARKET, BY END-USE INDUSTRY, 2021–2023 (UNITS)
  • TABLE 46 US: SPRAY PYROLYSIS MARKET, BY END-USE INDUSTRY, 2024–2029 (UNITS)
  • TABLE 47 CANADA: SPRAY PYROLYSIS MARKET, BY END-USE INDUSTRY, 2021–2023 (USD MILLION)
  • TABLE 48 CANADA: SPRAY PYROLYSIS MARKET, BY END-USE INDUSTRY, 2024–2029 (USD MILLION)
  • TABLE 49 CANADA: SPRAY PYROLYSIS MARKET, BY END-USE INDUSTRY, 2021–2023 (UNITS)
  • TABLE 50 CANADA: SPRAY PYROLYSIS MARKET, BY END-USE INDUSTRY, 2024–2029 (UNITS)
  • TABLE 51 MEXICO: SPRAY PYROLYSIS MARKET, BY END-USE INDUSTRY, 2021–2023 (USD MILLION)
  • TABLE 52 MEXICO: SPRAY PYROLYSIS MARKET, BY END-USE INDUSTRY, 2024–2029 (USD MILLION)
  • TABLE 53 MEXICO: SPRAY PYROLYSIS MARKET, BY END-USE INDUSTRY, 2021–2023 (UNITS)
  • TABLE 54 MEXICO: SPRAY PYROLYSIS MARKET, BY END-USE INDUSTRY, 2024–2029 (UNITS)
  • TABLE 55 EUROPE: SPRAY PYROLYSIS MARKET, BY COUNTRY, 2021–2023 (USD MILLION)
  • TABLE 56 EUROPE: SPRAY PYROLYSIS MARKET, BY COUNTRY, 2024–2029 (USD MILLION)
  • TABLE 57 EUROPE: SPRAY PYROLYSIS MARKET, BY COUNTRY, 2021–2023 (UNITS)
  • TABLE 58 EUROPE: SPRAY PYROLYSIS MARKET, BY COUNTRY, 2024–2029 (UNITS)
  • TABLE 59 EUROPE: SPRAY PYROLYSIS MARKET, BY END-USE INDUSTRY, 2021–2023 (USD MILLION)
  • TABLE 60 EUROPE: SPRAY PYROLYSIS MARKET, BY END-USE INDUSTRY, 2024–2029 (USD MILLION)
  • TABLE 61 EUROPE: SPRAY PYROLYSIS MARKET, BY END-USE INDUSTRY, 2021–2023 (UNITS)
  • TABLE 62 EUROPE: SPRAY PYROLYSIS MARKET, BY END-USE INDUSTRY, 2024–2029 (UNITS)
  • TABLE 63 GERMANY: SPRAY PYROLYSIS MARKET, BY END-USE INDUSTRY, 2021–2023 (USD MILLION)
  • TABLE 64 GERMANY: SPRAY PYROLYSIS MARKET, BY END-USE INDUSTRY, 2024–2029 (USD MILLION)
  • TABLE 65 GERMANY: SPRAY PYROLYSIS MARKET, BY END-USE INDUSTRY, 2021–2023 (UNITS)
  • TABLE 66 GERMANY: SPRAY PYROLYSIS MARKET, BY END-USE INDUSTRY, 2024–2029 (UNITS)
  • TABLE 67 UK: SPRAY PYROLYSIS MARKET, BY END-USE INDUSTRY, 2021–2023 (USD MILLION)
  • TABLE 68 UK: SPRAY PYROLYSIS MARKET, BY END-USE INDUSTRY, 2024–2029 (USD MILLION)
  • TABLE 69 UK: SPRAY PYROLYSIS MARKET, BY END-USE INDUSTRY, 2021–2023 (UNITS)
  • TABLE 70 UK: SPRAY PYROLYSIS MARKET, BY END-USE INDUSTRY, 2024–2029 (UNITS)
  • TABLE 71 FRANCE: SPRAY PYROLYSIS MARKET, BY END-USE INDUSTRY, 2021–2023 (USD MILLION)
  • TABLE 72 FRANCE: SPRAY PYROLYSIS MARKET, BY END-USE INDUSTRY, 2024–2029 (USD MILLION)
  • TABLE 73 FRANCE: SPRAY PYROLYSIS MARKET, BY END-USE INDUSTRY, 2021–2023 (UNITS)
  • TABLE 74 FRANCE: SPRAY PYROLYSIS MARKET, BY END-USE INDUSTRY, 2024–2029 (UNITS)
  • TABLE 75 ITALY: SPRAY PYROLYSIS MARKET, BY END-USE INDUSTRY, 2021–2023 (USD MILLION)
  • TABLE 76 ITALY: SPRAY PYROLYSIS MARKET, BY END-USE INDUSTRY, 2024–2029 (USD MILLION)
  • TABLE 77 ITALY: SPRAY PYROLYSIS MARKET, BY END-USE INDUSTRY, 2021–2023 (UNITS)
  • TABLE 78 ITALY: SPRAY PYROLYSIS MARKET, BY END-USE INDUSTRY, 2024–2029 (UNITS)
  • TABLE 79 SPAIN: SPRAY PYROLYSIS MARKET, BY END-USE INDUSTRY, 2021–2023 (USD MILLION)
  • TABLE 80 SPAIN: SPRAY PYROLYSIS MARKET, BY END-USE INDUSTRY, 2024–2029 (USD MILLION)
  • TABLE 81 SPAIN: SPRAY PYROLYSIS MARKET, BY END-USE INDUSTRY, 2021–2023 (UNITS)
  • TABLE 82 SPAIN: SPRAY PYROLYSIS MARKET, BY END-USE INDUSTRY, 2024–2029 (UNITS)
  • TABLE 83 REST OF EUROPE: SPRAY PYROLYSIS MARKET, BY END-USE INDUSTRY, 2021–2023 (USD MILLION)
  • TABLE 84 REST OF EUROPE: SPRAY PYROLYSIS MARKET, BY END-USE INDUSTRY, 2024–2029 (USD MILLION)
  • TABLE 85 REST OF EUROPE: SPRAY PYROLYSIS MARKET, BY END-USE INDUSTRY, 2021–2023 (UNITS)
  • TABLE 86 REST OF EUROPE: SPRAY PYROLYSIS MARKET, BY END-USE INDUSTRY, 2024–2029 (UNITS)
  • TABLE 87 ASIA PACIFIC: SPRAY PYROLYSIS MARKET, BY COUNTRY, 2021–2023 (USD MILLION)
  • TABLE 88 ASIA PACIFIC: SPRAY PYROLYSIS MARKET, BY COUNTRY, 2024–2029 (USD MILLION)
  • TABLE 89 ASIA PACIFIC: SPRAY PYROLYSIS MARKET, BY COUNTRY, 2021–2023 (UNITS)
  • TABLE 90 ASIA PACIFIC: SPRAY PYROLYSIS MARKET, BY COUNTRY, 2024–2029 (UNITS)
  • TABLE 91 ASIA PACIFIC: SPRAY PYROLYSIS MARKET, BY END-USE INDUSTRY, 2021–2023 (USD MILLION)
  • TABLE 92 ASIA PACIFIC: SPRAY PYROLYSIS MARKET, BY END-USE INDUSTRY,2024–2029 (USD MILLION)
  • TABLE 93 ASIA PACIFIC: SPRAY PYROLYSIS MARKET, BY END-USE INDUSTRY, 2021–2023 (UNITS)
  • TABLE 94 ASIA PACIFIC: SPRAY PYROLYSIS MARKET, BY END-USE INDUSTRY, 2024–2029 (UNITS)
  • TABLE 95 CHINA: SPRAY PYROLYSIS MARKET, BY END-USE INDUSTRY, 2021–2023 (USD MILLION)
  • TABLE 96 CHINA: SPRAY PYROLYSIS MARKET, BY END-USE INDUSTRY, 2024–2029 (USD MILLION)
  • TABLE 97 CHINA: SPRAY PYROLYSIS MARKET, BY END-USE INDUSTRY, 2021–2023 (UNITS)
  • TABLE 98 CHINA: SPRAY PYROLYSIS MARKET, BY END-USE INDUSTRY, 2024–2029 (UNITS)
  • TABLE 99 JAPAN: SPRAY PYROLYSIS MARKET, BY END-USE INDUSTRY, 2021–2023 (USD MILLION)
  • TABLE 100 JAPAN: SPRAY PYROLYSIS MARKET, BY END-USE INDUSTRY, 2024–2029 (USD MILLION)
  • TABLE 101 JAPAN: SPRAY PYROLYSIS MARKET, BY END-USE INDUSTRY, 2021–2023 (UNITS)
  • TABLE 102 JAPAN: SPRAY PYROLYSIS MARKET, BY END-USE INDUSTRY, 2024–2029 (UNITS)
  • TABLE 103 INDIA: SPRAY PYROLYSIS MARKET, BY END-USE INDUSTRY, 2021–2023 (USD MILLION)
  • TABLE 104 INDIA: SPRAY PYROLYSIS MARKET, BY END-USE INDUSTRY, 2024–2029 (USD MILLION)
  • TABLE 105 INDIA: SPRAY PYROLYSIS MARKET, BY END-USE INDUSTRY, 2021–2023 (UNITS)
  • TABLE 106 INDIA: SPRAY PYROLYSIS MARKET, BY END-USE INDUSTRY, 2024–2029 (UNITS)
  • TABLE 107 SOUTH KOREA: SPRAY PYROLYSIS MARKET, BY END-USE INDUSTRY, 2021–2023 (USD MILLION)
  • TABLE 108 SOUTH KOREA: SPRAY PYROLYSIS MARKET, BY END-USE INDUSTRY, 2024–2029 (USD MILLION)
  • TABLE 109 SOUTH KOREA: SPRAY PYROLYSIS MARKET, BY END-USE INDUSTRY, 2021–2023 (UNITS)
  • TABLE 110 SOUTH KOREA: SPRAY PYROLYSIS MARKET, BY END-USE INDUSTRY, 2024–2029 (UNITS)
  • TABLE 111 REST OF ASIA PACIFIC: SPRAY PYROLYSIS MARKET, BY END-USE INDUSTRY, 2021–2023 (USD MILLION)
  • TABLE 112 REST OF ASIA PACIFIC: SPRAY PYROLYSIS MARKET, BY END-USE INDUSTRY, 2024–2029 (USD MILLION)
  • TABLE 113 REST OF ASIA PACIFIC: SPRAY PYROLYSIS MARKET, BY END-USE INDUSTRY, 2021–2023 (UNITS)
  • TABLE 114 REST OF ASIA PACIFIC: SPRAY PYROLYSIS MARKET, BY END-USE INDUSTRY, 2024–2029 (UNITS)
  • TABLE 115 MIDDLE EAST & AFRICA: SPRAY PYROLYSIS MARKET, BY COUNTRY, 2021–2023 (USD MILLION)
  • TABLE 116 MIDDLE EAST & AFRICA: SPRAY PYROLYSIS MARKET, BY COUNTRY, 2024–2029 (USD MILLION)
  • TABLE 117 MIDDLE EAST & AFRICA: SPRAY PYROLYSIS MARKET, BY COUNTRY, 2021–2023 (UNITS)
  • TABLE 118 MIDDLE EAST & AFRICA: SPRAY PYROLYSIS MARKET, BY COUNTRY, 2024–2029 (UNIT)
  • TABLE 119 MIDDLE EAST & AFRICA: SPRAY PYROLYSIS MARKET, BY END-USE INDUSTRY, 2021–2023 (USD MILLION)
  • TABLE 120 MIDDLE EAST & AFRICA: SPRAY PYROLYSIS MARKET, BY END-USE INDUSTRY, 2024–2029 (USD MILLION)
  • TABLE 121 MIDDLE EAST & AFRICA: SPRAY PYROLYSIS MARKET, BY END-USE INDUSTRY, 2021–2023 (UNITS)
  • TABLE 122 MIDDLE EAST & AFRICA: SPRAY PYROLYSIS MARKET, BY END-USE INDUSTRY, 2024–2029 (UNIT)
  • TABLE 123 GCC COUNTRIES: SPRAY PYROLYSIS MARKET, BY END-USE INDUSTRY, 2021–2023 (USD MILLION)
  • TABLE 124 GCC COUNTRIES: SPRAY PYROLYSIS MARKET, BY END-USE INDUSTRY, 2024–2029 (USD MILLION)
  • TABLE 125 GCC COUNTRIES: SPRAY PYROLYSIS MARKET, BY END-USE INDUSTRY,2021–2023 (UNITS)
  • TABLE 126 GCC COUNTRIES: SPRAY PYROLYSIS MARKET, BY END-USE INDUSTRY, 2024–2029 (UNITS)
  • TABLE 127 SAUDI ARABIA: SPRAY PYROLYSIS MARKET, BY END-USE INDUSTRY, 2021–2023 (USD MILLION)
  • TABLE 128 SAUDI ARABIA: SPRAY PYROLYSIS MARKET, BY END-USE INDUSTRY, 2024–2029 (USD MILLION)
  • TABLE 129 SAUDI ARABIA: SPRAY PYROLYSIS MARKET, BY END-USE INDUSTRY, 2021–2023 (UNITS)
  • TABLE 130 SAUDI ARABIA: SPRAY PYROLYSIS MARKET, BY END-USE INDUSTRY, 2024–2029 (UNITS)
  • TABLE 131 UAE: SPRAY PYROLYSIS MARKET, BY END-USE INDUSTRY, 2021–2023 (USD MILLION)
  • TABLE 132 UAE: SPRAY PYROLYSIS MARKET, BY END-USE INDUSTRY, 2024–2029 (USD MILLION)
  • TABLE 133 UAE: SPRAY PYROLYSIS MARKET, BY END-USE INDUSTRY, 2021–2023 (UNITS)
  • TABLE 134 UAE: SPRAY PYROLYSIS MARKET, BY END-USE INDUSTRY, 2024–2029 (UNITS)
  • TABLE 135 REST OF GCC COUNTRIES: SPRAY PYROLYSIS MARKET, BY END-USE INDUSTRY, 2021–2023 (USD MILLION)
  • TABLE 136 REST OF GCC COUNTRIES: SPRAY PYROLYSIS MARKET, BY END-USE INDUSTRY, 2024–2029 (USD MILLION)
  • TABLE 137 REST OF GCC COUNTRIES: SPRAY PYROLYSIS MARKET, BY END-USE INDUSTRY, 2021–2023 (UNITS)
  • TABLE 138 REST OF GCC COUNTRIES: SPRAY PYROLYSIS MARKET, BY END-USE INDUSTRY, 2024–2029 (UNITS)
  • TABLE 139 SOUTH AFRICA: SPRAY PYROLYSIS MARKET, BY END-USE INDUSTRY, 2021–2023 (USD MILLION)
  • TABLE 140 SOUTH AFRICA: SPRAY PYROLYSIS MARKET, BY END-USE INDUSTRY, 2024–2029 (USD MILLION)
  • TABLE 141 SOUTH AFRICA: SPRAY PYROLYSIS MARKET, BY END-USE INDUSTRY, 2021–2023 (UNITS)
  • TABLE 142 SOUTH AFRICA: SPRAY PYROLYSIS MARKET, BY END-USE INDUSTRY, 2024–2029 (UNITS)
  • TABLE 143 REST OF MIDDLE EAST & AFRICA: SPRAY PYROLYSIS MARKET, BY END-USE INDUSTRY, 2021–2023 (USD MILLION)
  • TABLE 144 REST OF MIDDLE EAST & AFRICA: SPRAY PYROLYSIS MARKET, BY END-USE INDUSTRY, 2024–2029 (USD MILLION)
  • TABLE 145 REST OF MIDDLE EAST & AFRICA: SPRAY PYROLYSIS MARKET, BY END-USE INDUSTRY, 2021–2023 (UNITS)
  • TABLE 146 REST OF MIDDLE EAST & AFRICA: SPRAY PYROLYSIS MARKET, BY END-USE INDUSTRY, 2024–2029 (UNITS)
  • TABLE 147 SOUTH AMERICA: SPRAY PYROLYSIS MARKET, BY COUNTRY, 2021–2023 (USD MILLION)
  • TABLE 148 SOUTH AMERICA: SPRAY PYROLYSIS MARKET, BY COUNTRY, 2024–2029 (USD MILLION)
  • TABLE 149 SOUTH AMERICA: SPRAY PYROLYSIS MARKET, BY COUNTRY, 2021–2023 (UNITS)
  • TABLE 150 SOUTH AMERICA: SPRAY PYROLYSIS MARKET, BY COUNTRY, 2024–2029 (UNITS)
  • TABLE 151 SOUTH AMERICA: SPRAY PYROLYSIS MARKET, BY END-USE INDUSTRY, 2021–2023 (USD MILLION)
  • TABLE 152 SOUTH AMERICA: SPRAY PYROLYSIS MARKET, BY END-USE INDUSTRY, 2024–2029 (USD MILLION)
  • TABLE 153 SOUTH AMERICA: SPRAY PYROLYSIS MARKET, BY END-USE INDUSTRY, 2021–2023 (UNITS)
  • TABLE 154 SOUTH AMERICA: SPRAY PYROLYSIS MARKET, BY END-USE INDUSTRY, 2024–2029 (UNITS)
  • TABLE 155 BRAZIL: SPRAY PYROLYSIS MARKET, BY END-USE INDUSTRY, 2021–2023 (USD MILLION)
  • TABLE 156 BRAZIL: SPRAY PYROLYSIS MARKET, BY END-USE INDUSTRY, 2024–2029 (USD MILLION)
  • TABLE 157 BRAZIL: SPRAY PYROLYSIS MARKET, BY END-USE INDUSTRY, 2021–2023 (UNITS)
  • TABLE 158 BRAZIL: SPRAY PYROLYSIS MARKET, BY END-USE INDUSTRY, 2024–2029 (UNITS)
  • TABLE 159 ARGENTINA: SPRAY PYROLYSIS MARKET, BY END-USE INDUSTRY, 2021–2023 (USD MILLION)
  • TABLE 160 ARGENTINA: SPRAY PYROLYSIS MARKET, BY END-USE INDUSTRY, 2024–2029 (USD MILLION)
  • TABLE 161 ARGENTINA: SPRAY PYROLYSIS MARKET, BY END-USE INDUSTRY, 2021–2023 (UNITS)
  • TABLE 162 ARGENTINA: SPRAY PYROLYSIS MARKET, BY END-USE INDUSTRY, 2024–2029 (UNITS)
  • TABLE 163 REST OF SOUTH AMERICA: SPRAY PYROLYSIS MARKET, BY END-USE INDUSTRY, 2021–2023 (USD MILLION)
  • TABLE 164 REST OF SOUTH AMERICA: SPRAY PYROLYSIS MARKET, BY END-USE INDUSTRY, 2024–2029 (USD MILLION)
  • TABLE 165 REST OF SOUTH AMERICA: SPRAY PYROLYSIS MARKET, BY END-USE INDUSTRY, 2021–2023 (UNITS)
  • TABLE 166 REST OF SOUTH AMERICA: SPRAY PYROLYSIS MARKET, BY END-USE INDUSTRY, 2024–2029 (UNITS)
  • TABLE 167 SPRAY PYROLYSIS MARKET: REVENUE ANALYSIS OF KEY COMPANIES, 2023 (USD MILLION)
  • TABLE 168 SPRAY PYROLYSIS MARKET: DEGREE OF COMPETITION, 2023
  • TABLE 169 SPRAY PYROLYSIS MARKET: APPLICATION FOOTPRINT
  • TABLE 170 SPRAY PYROLYSIS MARKET: END-USE INDUSTRY FOOTPRINT
  • TABLE 171 SPRAY PYROLYSIS MARKET: REGION FOOTPRINT
  • TABLE 172 SPRAY PYROLYSIS MARKET: LIST OF KEY STARTUPS/SMES
  • TABLE 173 SPRAY PYROLYSIS MARKET: COMPETITIVE BENCHMARKING OF KEY STARTUPS/SMES
  • TABLE 174 SPRAY PYROLYSIS MARKET: OTHERS, APRIL 2020–JUNE 2024
  • TABLE 175 MTI CORPORATION: COMPANY OVERVIEW
  • TABLE 176 MTI CORPORATION: PRODUCTS/SOLUTIONS/SERVICES OFFERED
  • TABLE 177 SONO-TEK CORPORATION: COMPANY OVERVIEW
  • TABLE 178 SONO-TEK CORPORATION: PRODUCTS/SOLUTIONS/SERVICES OFFERED
  • TABLE 179 SONO-TEK CORPORATION: OTHERS
  • TABLE 180 HOLMARC OPTO-MECHATRONICS LTD.: COMPANY OVERVIEW
  • TABLE 181 HOLMARC OPTO- MECHATRONICS LTD.: PRODUCTS/SOLUTIONS/SERVICES OFFERED
  • TABLE 182 ACMEFIL ENGINEERING SYSTEMS PVT LTD.: COMPANY OVERVIEW
  • TABLE 183 ACMEFIL ENGINEERING SYSTEMS PVT LTD.: PRODUCTS/SOLUTIONS/SERVICES OFFERED
  • TABLE 184 ZHENGZHOU CY SCIENTIFIC INSTRUMENT CO., LTD.: COMPANY OVERVIEW
  • TABLE 185 ZHENGZHOU CY SCIENTIFIC INSTRUMENT CO., LTD.: PRODUCTS/SOLUTIONS/ SERVICES OFFERED
  • TABLE 186 HANSUN: COMPANY OVERVIEW
  • TABLE 187 HANSUN: PRODUCTS/SOLUTIONS/SERVICES OFFERED
  • TABLE 188 CHEERSONIC ULTRASONIC EQUIPMENTS CO., LTD.: COMPANY OVERVIEW
  • TABLE 189 CHEERSONIC ULTRASONIC EQUIPMENTS CO., LTD.: PRODUCTS/SOLUTIONS/ SERVICES OFFERED
  • TABLE 190 SIANSONIC: COMPANY OVERVIEW
  • TABLE 191 SIANSONIC: PRODUCTS/SOLUTIONS/SERVICES OFFERED
  • TABLE 192 NAVSON TECHNOLOGIES PVT. LTD.: COMPANY OVERVIEW
  • TABLE 193 NAVSON TECHNOLOGIES PVT. LTD.: PRODUCTS/SOLUTIONS/SERVICES OFFERED
  • TABLE 194 SHANGHAI HUASHAO INTELLIGENT EQUIPMENT CO., LTD.: COMPANY OVERVIEW
  • TABLE 195 SHANGHAI HUASHAO INTELLIGENT EQUIPMENT CO., LTD.: PRODUCTS/SOLUTIONS/SERVICES OFFERED
  • TABLE 196 PRIZMA: COMPANY OVERVIEW
  • TABLE 197 SHENYANG KEJING AUTO-INSTRUMENT CO., LTD.: COMPANY OVERVIEW
  • TABLE 198 XIAMEN TMAX BATTERY EQUIPMENTS LIMITED: COMPANY OVERVIEW
  • TABLE 199 SONEAR INC.: COMPANY OVERVIEW
  • TABLE 200 VB CERAMIC CONSULTANTS (VBCC): COMPANY OVERVIEW
  • TABLE 201 XIAMEN LITH MACHINE LIMITED: COMPANY OVERVIEW
  • TABLE 202 PREMIER SOLUTIONS PTE. LTD.: COMPANY OVERVIEW
  • TABLE 203 DAS INSTRUMENT AND SOLUTIONS: COMPANY OVERVIEW
  • TABLE 204 CAPITAL LAB TECH: COMPANY OVERVIEW
  • TABLE 205 INTEGRATED ENERGY ENGINEERING: COMPANY OVERVIEW
  • TABLE 206 HANGZHOU POWERSONIC EQUIPMENT CO., LTD.: COMPANY OVERVIEW
  • TABLE 207 RUBRODER GROUP: COMPANY OVERVIEW
  • TABLE 208 RK ENGINEERING SERVICE: COMPANY OVERVIEW
  • TABLE 209 WAVENXD TECHNOLOGIES PVT. LTD.: COMPANY OVERVIEW
  • TABLE 210 PI-KEM: COMPANY OVERVIEW
LIST OF FIGURES
 
  • FIGURE 1 SPRAY PYROLYSIS MARKET: SEGMENTATION AND REGIONAL SCOPE
  • FIGURE 2 SPRAY PYROLYSIS MARKET: RESEARCH DESIGN
  • FIGURE 3 SPRAY PYROLYSIS MARKET: BOTTOM-UP APPROACH
  • FIGURE 4 SPRAY PYROLYSIS MARKET: TOP-DOWN APPROACH
  • FIGURE 5 SPRAY PYROLYSIS MARKET: DATA TRIANGULATION
  • FIGURE 6 ULTRASONIC SPRAY PYROLYSIS SYSTEM SEGMENT TO ACCOUNT FOR LARGEST MARKET SHARE IN 2029
  • FIGURE 7 THIN & THICK FILM DEPOSITION SEGMENT TO ACCOUNT FOR LARGEST MARKET SHARE IN 2029
  • FIGURE 8 ENERGY & UTILITIES SEGMENT TO ACCOUNT FOR LARGEST MARKET SHARE IN 2029
  • FIGURE 9 ASIA PACIFIC TO BE FASTEST-GROWING MARKET FOR SPRAY PYROLYSIS DURING FORECAST PERIOD
  • FIGURE 10 INCREASING DEMAND FROM ELECTRONICS AND SEMICONDUCTOR INDUSTRIES TO CREATE LUCRATIVE OPPORTUNITIES FOR MARKET PLAYERS
  • FIGURE 11 ULTRASONIC SPRAY PYROLYSIS SYSTEM SEGMENT TO REGISTER HIGHEST CAGR DURING FORECAST PERIOD
  • FIGURE 12 THIN & THICK FILM DEPOSITION SEGMENT TO REGISTER HIGHEST CAGR DURING FORECAST PERIOD
  • FIGURE 13 ENERGY & UTILITIES SEGMENT TO RECORD HIGHEST CAGR DURING FORECAST PERIOD
  • FIGURE 14 CHINA TO REGISTER HIGHEST CAGR DURING FORECAST PERIOD
  • FIGURE 15 SPRAY PYROLYSIS MARKET: DRIVERS, RESTRAINTS, OPPORTUNITIES, AND CHALLENGES
  • FIGURE 16 SPRAY PYROLYSIS MARKET: PORTER’S FIVE FORCES ANALYSIS
  • FIGURE 17 INFLUENCE OF STAKEHOLDERS ON BUYING PROCESS, BY END-USE INDUSTRY
  • FIGURE 18 KEY BUYING CRITERIA, BY END-USE INDUSTRY
  • FIGURE 19 SPRAY PYROLYSIS MARKET: VALUE CHAIN ANALYSIS
  • FIGURE 20 SPRAY PYROLYSIS MARKET: ECOSYSTEM ANALYSIS
  • FIGURE 21 DOCUMENT TYPE, 2014–2023
  • FIGURE 22 NUMBER OF PATENTS GRANTED PER YEAR, 2014–2023
  • FIGURE 23 TOP JURISDICTION, BY DOCUMENT, 2014–2023
  • FIGURE 24 APPLICANT ANALYSIS, 2014–2023
  • FIGURE 25 IMPORT DATA RELATED TO HS CODE 8424-COMPLIANT PRODUCTS, BY KEY COUNTRY, 2019–2023 (USD THOUSAND)
  • FIGURE 26 EXPORT DATA RELATED TO HS CODE 8424-COMPLIANT PRODUCTS, BY KEY COUNTRY, 2019–2023 (USD THOUSAND)
  • FIGURE 27 AVERAGE SELLING PRICE TREND OF SPRAY PYROLYSIS SYSTEMS, BY REGION, 2022–2029 (USD/UNIT)
  • FIGURE 28 SPRAY PYROLYSIS MARKET: INVESTMENT AND FUNDING SCENARIO, 2019−2023 (USD MILLION)
  • FIGURE 29 TRENDS/DISRUPTIONS INFLUENCING CUSTOMER BUSINESS
  • FIGURE 30 ULTRASONIC SPRAY PYROLYSIS SYSTEM TO REGISTER HIGHEST CAGR DURING FORECAST PERIOD
  • FIGURE 31 THIN & THICK FILM DEPOSITION SEGMENT TO RECORD HIGHEST CAGR DURING FORECAST PERIOD
  • FIGURE 32 ENERGY & UTILITIES SEGMENT TO REGISTER HIGHEST CAGR DURING FORECAST PERIOD
  • FIGURE 33 ASIA PACIFIC TO BE FASTEST-GROWING MARKET FOR SPRAY PYROLYSIS DURING FORECAST PERIOD
  • FIGURE 34 NORTH AMERICA: SPRAY PYROLYSIS MARKET SNAPSHOT
  • FIGURE 35 ASIA PACIFIC: SPRAY PYROLYSIS MARKET SNAPSHOT
  • FIGURE 36 SPRAY PYROLYSIS MARKET: OVERVIEW OF MAJOR STRATEGIES ADOPTED BY KEY PLAYERS, 2019–2024
  • FIGURE 37 SPRAY PYROLYSIS MARKET: REVENUE ANALYSIS OF KEY COMPANIES, 2023 (USD MILLION)
  • FIGURE 38 SPRAY PYROLYSIS MARKET SHARE ANALYSIS, 2023
  • FIGURE 39 SPRAY PYROLYSIS MARKET: COMPANY VALUATION OF LEADING COMPANIES, 2023 (USD MILLION)
  • FIGURE 40 SPRAY PYROLYSIS MARKET: FINANCIAL METRICS OF LEADING COMPANIES, 2023
  • FIGURE 41 SPRAY PYROLYSIS MARKET: BRAND/PRODUCT COMPARISON
  • FIGURE 42 SPRAY PYROLYSIS MARKET: COMPANY EVALUATION MATRIX (KEY PLAYERS), 2023
  • FIGURE 43 SPRAY PYROLYSIS MARKET: COMPANY FOOTPRINT
  • FIGURE 44 SPRAY PYROLYSIS MARKET: COMPANY EVALUATION MATRIX (STARTUPS/SMES), 2023
  • FIGURE 45 SONO-TEK CORPORATION: COMPANY SNAPSHOT
  • FIGURE 46 HOLMARC OPTO-MECHATRONICS LTD.: COMPANY SNAPSHOT

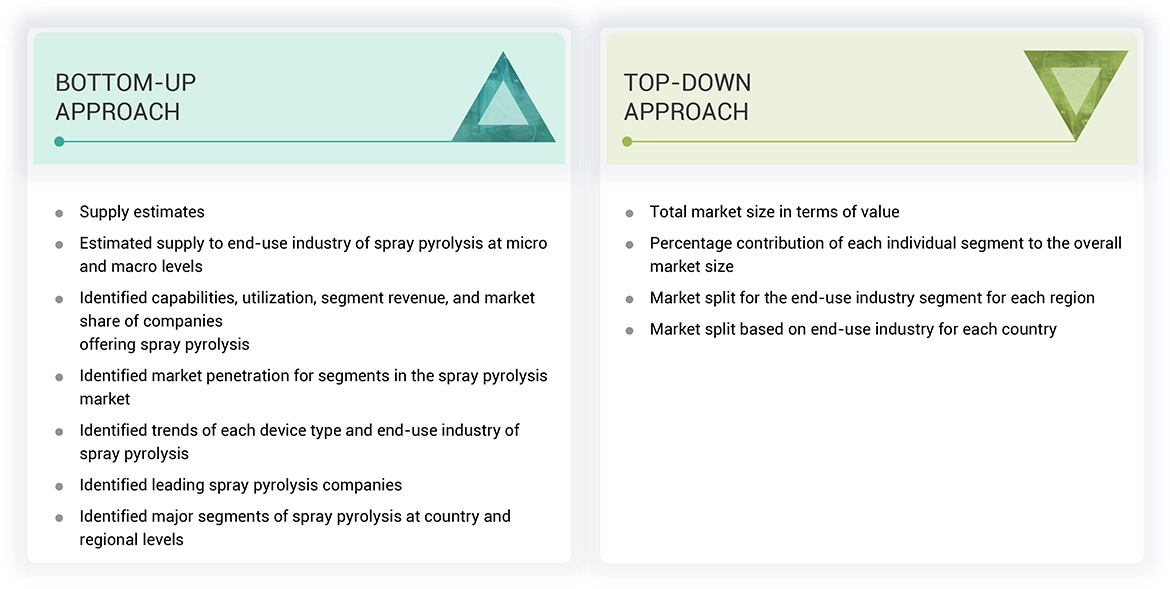
The study involved four major activities in estimating the market size of the spray pyrolysis market. Exhaustive secondary research was done to collect information on the market, the peer market, and the parent market. The next step was to validate these findings, assumptions, and sizing with industry experts across the value chain through primary research. Both top-down and bottom-up approaches were employed to estimate the complete market size. Thereafter, the market breakdown and data triangulation procedures were used to estimate the market size of the segments and subsegments.

Secondary Research

In the secondary research process, various secondary sources have been referred to for identifying and collecting information for this study. These secondary sources include annual reports, press releases, investor presentations of companies, corporate documents, white papers, certified publications, trade directories, certified publications, articles from recognized authors, associations, gold standard and silver standard websites, and databases.

Secondary research has been used to obtain key information about the value chain of the industry, monetary chain of the market, the total pool of key players, market classification and segmentation according to industry trends to the bottom-most level, and regional markets. It was also used to obtain information about the key developments from a market-oriented perspective.

Primary Research

The spray pyrolysis market comprises several stakeholders in the value chain, which include raw material, equipment suppliers, component manufacturers, system manufacturers, distributors and end consumers. Various primary sources from the supply and demand sides of the spray pyrolysis market have been interviewed to obtain qualitative and quantitative information. The primary interviewees from the demand side include key opinion leaders in end-use sectors. The primary sources from the supply side include manufacturers, associations, and institutions involved in the spray pyrolysis industry.

Primary interviews were conducted to gather insights such as market statistics, data of revenue collected from the products and services, market breakdowns, market size estimations, market forecasting, and data triangulation. Primary research also helped in understanding the various trends related to device type, application, process, end use industry and region. Stakeholders from the demand side, such as CIOs, CTOs, and CSOs were interviewed to understand the buyer’s perspective on the suppliers, products, component providers, and their current usage of spray pyrolysis and future outlook of their business which will affect the overall market.

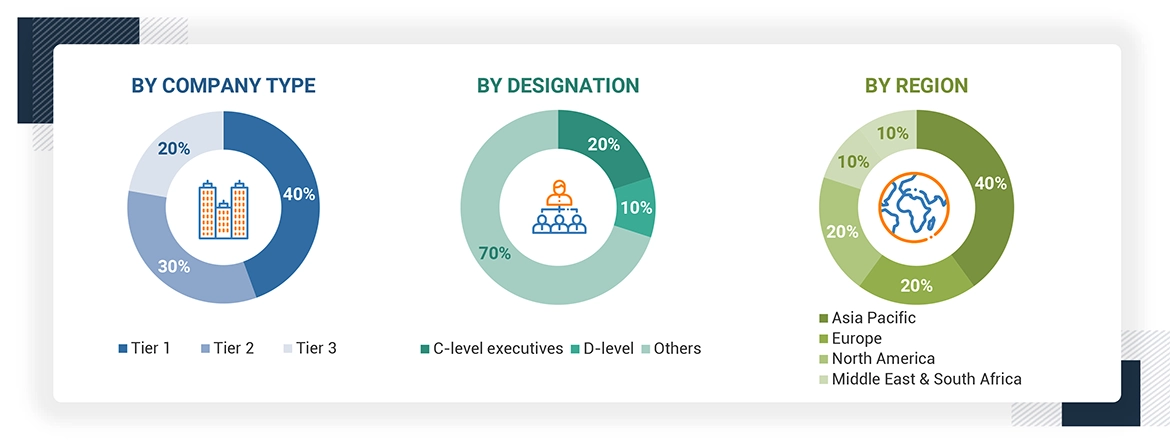
The breakdown of profiles of the primary interviewees is illustrated in the figure below:
Spray Pyrolysis Market

Note: Tier 1, Tier 2, and Tier 3 companies are classified based on their market revenue in 2023 available in the public domain, product portfolios, and geographical presence.

Other designations include sales representatives, production heads, and technicians.

To know about the assumptions considered for the study, download the pdf brochure

Market Size Estimation

The top-down approach was used to estimate and validate the size of various submarkets for spray pyrolysis for each region. The research methodology used to estimate the market size included the following steps:

  • The key players in the industry have been identified through extensive secondary research.
  • The supply chain of the industry has been determined through primary and secondary research.
  • The global market was then segmented into five major regions and validated by industry experts.
  • All percentage shares, splits, and breakdowns based on device type, application, process, end use industry and region were determined using secondary sources and verified through primary sources.
  • All possible parameters that affect the markets covered in this research study were accounted for, viewed in extensive detail, verified through primary research, and analyzed to get the final quantitative and qualitative data. This data was consolidated and added with detailed inputs and analysis and presented in this report.
Spray Pyrolysis Market

Data Triangulation

After arriving at the total market size from the estimation process of spray pyrolysis systems above, the overall market has been split into several segments and sub-segments. To complete the overall market engineering process and arrive at the exact statistics for all the segments and sub-segments, the data triangulation and market breakdown procedures have been employed, wherever applicable. The data has been triangulated by studying various factors and trends from both the demand and supply sides. Along with this, the market size has been validated by using both the top-down and bottom-up approaches and primary interviews. Hence, for every data segment, there have been three sources—top-down approach, bottom-up approach, and expert interviews. The data was assumed correct when the values arrived from the three sources matched.

Market Definition

Spray pyrolysis is a technique where a solution is sprayed over a heated surface, where the ingredients react to create a chemical compound, resulting in the deposition of a thin film. This process allows for precise control over material composition, thickness, and morphology, making it highly versatile for fabricating advanced materials in a wide range of applications, including electronics, energy storage, catalysis, and biomedical devices.

Stakeholders

  • Spray Pyrolysis System Manufacturers
  • Raw Material Suppliers
  • Equipment Suppliers
  • Manufacturing Technology Providers
  • Industry Associations
  • End-Use Industries

Report Objectives

  • To define, describe, and forecast the size of the spray pyrolysis market, in terms of value and volume.
  • To provide detailed information regarding the major factors (drivers, opportunities, restraints, and challenges) influencing the growth of the market.
  • To estimate and forecast the market size based on device type, application, end use industry, and region.
  • To forecast the size of the market with respect to major regions, namely, Europe, North America, Asia Pacific, Middle East & Africa, and South America, along with their key countries.
  • To strategically analyze micromarkets1 with respect to individual growth trends, prospects, and their contribution to the overall market.
  • To analyze opportunities in the market for stakeholders and provide a competitive landscape of market leaders.
  • To track and analyze recent developments such as expansions, new product launches, partnerships & agreements, and acquisitions in the market.
  • To strategically profile key market players and comprehensively analyze their core competencies.

Previous Versions of this Report

Custom Market Research Services

We Will Customise The Research For You, In Case The Report Listed Above Does Not Meet With Your Requirements

Get 10% Free Customisation

Growth opportunities and latent adjacency in Spray Pyrolysis Market

DMCA.com Protection Status