Software Defined Vehicle Market by SDV Type (Semi-SDV. SDV), E/E Architecture (Distributed, Domain Centralised, Zonal Control), Vehicle Type (Passenger Car and Light Commercial Vehicle) and Region - Global Forecast to 2030
[238 Pages Report] The Software Defined Vehicle Market size is projected to grow from USD 213.5 billion in 2024 to USD 1,237.6 billion by 2030, at a CAGR of 34.0%. With the increase in the adoption of 5G technology in vehicles and autonomous driving experience, primarily in emerging markets, are expected to increase the demand for SDV solutions globally. Moreover, the increasing adoption of EVs and growing demand for driving experience and intelligent cockpits are also expected to create lucrative opportunities for the Software Defined Vehicle market size globally in the coming years.
To know about the assumptions considered for the study, Request for Free Sample Report
To know about the assumptions considered for the study, download the pdf brochure
Software Defined Vehicle market Dynamics:
Driver: Reduced recall and manufacturing costs
In conventional vehicles there are limitations with respect to predefined hardware configurations. When the faults identified in hardware, it often needs extensive recall campaigns, leading to substantial costs and logistical challenges for manufacturers. However, with the introduction of SDVs, a lot of the functionality previously controlled by hardware components is now controlled by software and over-the-air updates. Because issues can frequently be fixed online, this change drastically lowers the requirement for actual recalls. For example, car owners don't have to visit service centers to get software faults or performance optimizations fixed quickly. This reduces operational costs for manufacturers by reducing the costs associated with physical recalls and servicing campaigns and improves customer satisfaction by limiting disruptions.
Restraint: Increase in risk of cyberattacks
The risk of cyberattacks is increased due to the integration of complex software systems and connection elements in modern cars, which leads to loopholes that hackers could attack. One of the primary concerns is the potential for remote hacking of SDVs. Vehicles are becoming more and more convenient targets for hackers looking to cause disruption with operations or steal confidential information since they depend more and more on software for essential features such as navigation, autonomous driving, and V2X communication. Software development shortcomings, insecure safety protocols, and inadequate encryption procedures can expose SDVs to unauthorized access and control.
Opportunity:SDV platform monetization
OEMs and technology providers generate new revenue streams by SDV platform monetization through innovative software and services. This shift from a hardware-centric to a software-centric business model boosts profitability and advances continuous customer engagement and loyalty. The monetization of SDV platforms can be achieved through various strategies. For instance, OEMs can offer premium features such as ADAS, enhanced navigation, and entertainment options on a pay-per-use or subscription basis. These features can be dynamically updated and customized to individual preferences. Additionally, data-Defined services such as predictive maintenance, remote diagnostics, and fleet management can offer valuable insights and operational efficiencies for both individual users and commercial fleet operators.
Challenge: Complex software updates and security patching
The updates and maintenance in conventional vehicles were primarily mechanical, involving physical parts and periodic service checks. However, nowadays vehicles are become increasingly software-Defined and the maintenance landscape has shifted toward continuous software updates and security patching. This shift brings about new complexities and challenges that manufacturers and service providers must address to ensure vehicle safety, functionality, and security. Managing software updates in SDVs involves coordinating an array of interconnected systems, each with its unique requirements and dependencies. The complexity is further increased by the need to perform these updates remotely, often while the vehicle is in use. Security patching in SDVs presents another layer of complexity. As vehicles become more connected, they become more vulnerable to cyber threats. Hackers can exploit vulnerabilities in the software to gain control of critical vehicle functions, posing serious safety risks. Hence, timely and effective security patching is crucial. Moreover, patching security flaws must be done so as not to disrupt the vehicle's functionality or the driver's experience. This requires a complex balance between rapid response to emerging threats and thorough testing to ensure patches do not cause potential hazards.
SOFTWARE DEFINED VEHICLE MARKET ECOSYSTEM
The ecosystem analysis highlights various players in the Software Defined Vehicle ecosystem, which OEMs, SDV providers, Tier 1 Hardware provider, Tier 2 players, and chip providers primarily represent. Prominent companies in this market include Tesla (US), Li Auto Inc. (China), NIO (China), ZEEKR (China), XPENG Inc. (China), Rivian (US), among others.
Domain Centralized Architecture is projected to witness significant growth rate in the global Software Defined Vehicle market during the forecast period.
Legacy OEM which are planning for a shift to software-based architectures, are transitioning to domain-centralized architecture as a transition towards zonal control architecture. In such vehicles, functions are grouped into domains such as powertrain, body, and ADAS, each controlled by a few powerful ECUs. This reduces the number of ECUs to around 20-40 per vehicle, streamlining operations and improving integration. However, vehicles are becoming more technologically advanced and software-focused, so they define function based on domains. Key legacy OEMs such as Mercedes-Benz (Germany), BMW (Germany), Ford (US), General Motors (US), Volkswagen AG (Germany), Renault Group (Germany), BYD (China), and Toyota (Japan) have shifted to this architecture with developments in their latest vehicle platforms. Mercedes-Benz has shifted to domain centralized architecture in its MB.OS integrated MB.EA, MB.Van, AMG.E platforms. For instance, BMW has shifted to this architecture with its new vehicle skateboards through its CLAR New Class platform. Other examples include STLA Small to Frame platforms and the MEB platforms of Stellantis and Volkswagen, respectively, which come with domain centralized architecture.
Leading manufacturers such as Tesla (US), Li Auto Inc. (China), NIO (China), ZEEKR (China), XPENG Inc. (China), and Rivian (US), are integrating SDV technology into their vehicles. Companies such as Stellantis, BMW, Volkswagen, and BYD are transitioning towards SDVs to offer software Defined passenger cars.
“The Asia Pacific Software Defined Vehicle market is projected to hold the largest share by 2030.”
Asia Pacific is estimated to be the largest market for SDVs by 2030. In this region, leading countries such as China, Japan, India, and South Korea are expected to develop autonomous driving technology in the coming years. Leading OEMs in this region, such as Toyota, BYD, and Hyundai, have utilized the advantages of R&D in autonomous technology and collaborated with various technology enablers such as SAMSUNG, among others to enhance their sdv vehicles capabilities. China is expected to be the most significant factor in the Asia Pacific Software Defined Vehicle market growth in terms of value & volume. China leads the region in terms of value and volume for SDV market, which can also be attributed to the increased demand for EVs and increased sales of vehicles equipped with SDV technology. For example, ZEEKR 001, XPENG P5, XPENG P7, ZEEKR X, and BYD Seal H6 are some of the models in China equipped with SDVs.
Key Market Players
The global software-defined vehicle market is dominated by major players such as Tesla (US), Li Auto Inc. (China), NIO (China), Rivian (US), XPENG Inc. (China), and ZEEKR (China) and among others. These companies have strengthened distribution networks at a global level and offer a wide range of SDVs such as XPENG P5, Rivian R1T, Tesla Model Y, among others. The key strategies these companies adopt to sustain their market position are collaborations, new product developments, acquisitions, etc.
Want to explore hidden markets that can drive new revenue in Software Defined Vehicle Market?
Scope of the Report
Want to explore hidden markets that can drive new revenue in Software Defined Vehicle Market?
Report Metric |
Details |
Market size available for years |
2020–2030 |
Base year considered |
2023 |
Forecast period |
2024-2030 |
Forecast units |
Volume (Thousand Units) & Value (USD Billion) |
Segments Covered |
SDV Type, Vehicle Type, E/E Architecture, and Region |
Geographies covered |
Asia Pacific, North America, and Europe. |
Companies Covered |
Tesla (US), Li Auto Inc. (China), NIO (China), Rivian (US), ZEEKR (China), XPENG Inc. (China) |
This research report categorizes the SDV market based on SDV type, vehicle type, E/E Architecture, and region.
Software Defined Vehicle Market, By SDV Type
- Semi-SDV
- SDV
Software Defined Vehicle Market, By E/E Architecture
- Distributed Architecture
- Domain Centralised Architecture
- Zonal Control Architecture
Software Defined Vehicle Market, By Vehicle Type
- Passenger Car
- Light Commercial Vehicle
Software Defined Vehicle Market, By Region
-
North America
- US
- Canada
-
Europe
- France
- Germany
- UK
- Spain
-
Asia Pacific
- China
- Japan
- South Korea
Recent Developments
- In June 2024, XPENG Inc. partnered with NVIDIA Corporation for the adoption of the NVIDIA DRIVE Thor platform for its next-generation EVs. This platform will power XPENG's XNGP AI-assisted driving system, enhancing intelligent driving capabilities. XPENG launched the G6 Coupe SUV, G9 SUV, and P7 Sedan equipped with NVIDIA DRIVE Orin, boasts continuously upgraded AI capabilities through over-the-air updates.
- In June 2024, XPENG Inc. launched its all-new G6 electric mid-size SUV, positioning it as a strong contender against established rivals like the Tesla Model Y in the Australian market. It is designed on XPENG's SEPA 2.0 platform. The vehicle also features bidirectional charging (V2X) with V2L support up to 3.3 kW AC, making it versatile for energy transfer to external devices. This SUV accelerates from 0 to 100 km/h in 6.9 seconds and reaches a top speed of 200 km/h, powered by a rear-wheel drive system generating 190 kW (258 PS) of total power and 440 Nm of torque. Its battery architecture operates at 800 V, and it supports up to 11 kW AC charging.
- In June 2024, Rivian launched the second generation of the R1 lineup i.e., R1S and R1T models with software-defined technology. These vehicles feature a streamlined electrical architecture, reducing ECUs from 17 to 7 and significantly cutting down wiring. The new Rivian Autonomy Platform, powered by advanced sensors and AI, enhances driving assistance capabilities. In-vehicle connectivity includes digital car keys via Apple Wallet and Google Pixel, a rich entertainment system with streaming video and Apple Music integration, and an interactive user interface powered by Unreal Engine.
- In April 2024, Li Auto launched Li L6, which is a five-seat premium family SUV, available in Pro and Max trims. Li L6 offers a spacious, high-tech interior, advanced safety features, and robust performance with an extended range of 1,390 kilometers. The Li L6 combines luxury with advanced technology, featuring a four-screen interactive system powered by the Qualcomm Snapdragon 8295P chip for a seamless infotainment experience. The Li L6 Pro includes the Li AD Pro autonomous driving system, using a Horizon Robotics Journey 5 chip for enhanced computing power, while the Li L6 Max boasts the Li AD Max system with dual Orin-X chips for superior autonomous driving capabilities.
- In April 2024, ZEEKR launched ZEEKR MIX, the first model built on the sustainable experience architecture (SEA)-M platform. All SEA-M-based vehicles will meet global five-star safety standards and qualify for IIHS Top Safety Pick. The ZEEKR MIX, the fifth model from ZEEKR and the first on the SEA-M platform, has a length of 4.7 meters, a 3-meter wheelbase length, and a ground clearance of 39 centimeters.
- In March 2024, Panasonic Holdings Corporation and Mazda Motor Corporation partnered and installed full-display meters for the CX-70 model of Mazda Motor Corporation. The CX-70 integrates a large 12.3-inch display, showcasing graphics of the vehicle conditions, such as speed and warnings. It adapts in real-time to offer drivers timely and pertinent information, enhancing their safety and driving experience.
Frequently Asked Questions (FAQ):
What is the current size of the Software Defined Vehicle market?
The Software Defined Vehicle market is estimated to be USD 213.5 billion in 2024 and is projected to reach USD 1,237.6 billion by 2030.
Who are the winners in the global Software Defined Vehicle market?
The Software Defined Vehicle market is dominated by global players such as Tesla (US), Li Auto Inc. (China), NIO (China), Rivian (US), and XPENG Inc. (China) among others. These companies develop new products, adopt expansion strategies, and undertake collaborations, partnerships, and mergers & acquisitions to gain traction in the Software Defined Vehicle market.
What are the new market trends impacting the growth of the Software Defined Vehicle market?
Increasing demand for ADAS digital cockpits in vehicles and the adoption of 5G technology are major trends affecting this market.
Which region is expected to be the largest market during the forecast period?
Asia Pacific is expected to be the largest market in the Software Defined Vehicle market due to increased demand for SDVs and increased sales of vehicles equipped with autonomous technology, especially in China.
What is the total CAGR expected to be recorded for the Software Defined Vehicle market during 2024-2030?
The CAGR is expected to record a CAGR of 34.0% from 2024-2030. .
To speak to our analyst for a discussion on the above findings, click Speak to Analyst
Exclusive indicates content/data unique to MarketsandMarkets and not available with any competitors.
- 5.1 INTRODUCTION
-
5.2 MARKET DYNAMICSDRIVERS- Reduced recall and manufacturing costs- Personalized client engagement- Integration of ADAS digital cockpits- Increasing adoption of 5G technologyRESTRAINTS- Limited over-the-air updates- Increase in risk of cyberattacks in SDVsOPPORTUNITIES- Remote diagnostics- Pay-per-use mobility- SDV platform monetization- Digital twin for emergency repairCHALLENGES- Complex software updates and security patching- Risk of data breach
-
5.3 ECOSYSTEM ANALYSISOEMSTIER 1 HARDWARE PROVIDERSTIER 2 PLAYERSCHIP PROVIDERSSOFTWARE PROVIDERSCLOUD PROVIDERS
-
5.4 TECHNOLOGY ANALYSIS (KEY ENABLERS OF SDV)INTRODUCTIONCENTRAL HPCZONAL CONTROLLERSOVER-THE-AIR UPDATESSCALABLE E/E ARCHITECTURE
- 5.5 OEM SDV SHIFT COMPARISON
-
5.6 STRATEGIES FOLLOWED BY LEGACY OEMS FOR SDV SHIFTOEM DASHBOARD FOR SDV OFFERINGS BY KEY OEMS
- 5.7 COMPARISON OF TECH PLAYERS AND CLOUD PROVIDERS IN SDV ECOSYSTEM
- 5.8 E/E ARCHITECTURE PLANS OF OEMS SHIFTING TO SDV
-
5.9 CASE STUDY ANALYSISCUBIC TELECOM'S ROLE IN TRANSFORMING VEHICLE ARCHITECTUREIMPLEMENTING VIRTUAL TESTING ENVIRONMENT WITH RED HATVOLKSWAGEN'S STRATEGIC FOCUS ON SOFTWARE INNOVATIONSTANDARDIZING OVER-THE-AIR UPDATES WITH ESYNC ALLIANCECONTINENTAL AUTOMOTIVE EDGE PLATFORM IN COLLABORATION WITH AWSREVOLUTIONIZING AUTOMOTIVE SOFTWARE DEVELOPMENT WITH BLACKBERRY IVY AND AWSAWS AND BLACKBERRY'S APPROACH TO MODERNIZING VEHICLE SOFTWARENVIDIA’S DRIVE PLATFORM POWERS VOLVO’S AUTONOMOUS VISIONTESLA'S JOURNEY INTO SOFTWARE-DEFINED VEHICLESBMW'S STRATEGIC SHIFT IN AUTOMOTIVE SOFTWARE
- 6.1 INTRODUCTION
- 6.2 DISTRIBUTED ARCHITECTURE
- 6.3 DOMAIN CENTRALIZED ARCHITECTURE
- 6.4 ZONAL CONTROL ARCHITECTURE
- 7.1 INTRODUCTION
-
7.2 SDVINCREASED FLEXIBILITY AND AGILITY THROUGH OVER-THE-AIR UPDATES TO DRIVE SDV SHIFT
-
7.3 SEMI-SDVTRANSITIONAL PHASE TOWARD MORE ADVANCED ZONAL CONTROL ARCHITECTURE
- 7.4 KEY PRIMARY INSIGHTS
- 8.1 INTRODUCTION
-
8.2 PASSENGER CARCONSUMER EXPECTATIONS FOR SEAMLESS, TECH-DRIVEN EXPERIENCES TO DRIVE MARKET
-
8.3 LIGHT COMMERCIAL VEHICLERAPID ADOPTION OF SOFTWARE-DEFINED LIGHT COMMERCIAL VEHICLES FOR GOODS TRANSPORT IN NORTH AMERICA TO DRIVE MARKET
- 8.4 KEY PRIMARY INSIGHTS
- 9.1 INTRODUCTION
-
9.2 ASIA PACIFICGENERATIVE AI IMPACT ANALYSISCHINA- Platformization and SDV ecosystem development to drive marketJAPAN- Government and OEM partnerships to drive marketSOUTH KOREA- Global expansion of South Korean OEMs to drive market
-
9.3 EUROPEGENERATIVE AI IMPACT ANALYSISGERMANY- Strong engineering landscape and leading component providers and OEMs shifting to SDV offerings to drive marketFRANCE- OEM initiatives and partnerships with software providers to drive marketUK- Government regulations to drive SDV adoptionSPAIN- OEMs planning to develop software architecture for SDVs to drive market
-
9.4 NORTH AMERICAGENERATIVE AI IMPACT ANALYSISUS- Technological advancements and OTA updates by OEMs to drive marketCANADA- Strategic partnerships and infrastructure development to drive market
- 10.1 INTRODUCTION
- 10.2 KEY PLAYER STRATEGIES
- 10.3 MARKET SHARE ANALYSIS, 2023
- 10.4 REVENUE ANALYSIS, 2019–2023
-
10.5 COMPANY EVALUATION MATRIX: KEY PLAYERS, 2023STARSEMERGING LEADERSPERVASIVE PLAYERSPARTICIPANTSCOMPANY FOOTPRINT: KEY PLAYERS, 2023- Company footprint- Vehicle type footprint- Region footprint
-
10.6 COMPANY EVALUATION MATRIX: START-UPS/SMES, 2023PROGRESSIVE COMPANIESRESPONSIVE COMPANIESDYNAMIC COMPANIESSTARTING BLOCKSCOMPETITIVE BENCHMARKING: START-UPS/SMES, 2023
- 10.7 COMPANY VALUATION AND FINANCIAL METRICS
-
10.8 COMPETITIVE SCENARIOS AND TRENDSPRODUCT LAUNCHESDEALS
-
11.1 KEY SDV PROVIDERSTESLA- Business overview- Products offered- Recent developments- MnM viewLI AUTO INC.- Business overview- Products offered- Recent developments- MnM viewZEEKR- Business overview- Products offered- Recent developments- MnM viewXPENG INC.- Business overview- Products offered- Recent developments- MnM viewNIO- Business overview- Products offered- Recent developments- MnM viewRIVIAN- Business overview- Products offered- Recent developments- MnM view
-
11.2 KEY OEMS SHIFTING TO SDVVOLKSWAGEN AG- Business overview- Products offered- Recent developmentsHYUNDAI MOTOR CORPORATION- Business overview- Products offered- Recent developmentsFORD MOTOR COMPANY- Business overview- Products offered- Recent developmentsGENERAL MOTORS- Business overview- Products offered- Recent developmentsRENAULT GROUP- Business overview- Products offered- Recent developmentsTOYOTA MOTOR CORPORATION- Business overview- Products offered- Recent developmentsSTELLANTIS- Business overview- Products offered- Recent developmentsMERCEDES-BENZ AG- Business overview- Products offered- Recent developmentsBYD- Business overview- Products offered- Recent developmentsBMW- Business overview- Products offered- Recent developments
-
11.3 KEY TECH INTEGRATORSNVIDIA CORPORATIONQUALCOMM TECHNOLOGIES INC.BLACKBERRY LIMITEDVECTOR INFORMATIK GMBHGOOGLE INC.AMAZON INC.MICROSOFTAPEX.AIMOBILEYETENCENTALIBABAHORIZON ROBOTICSTATA TECHNOLOGIESKPIT TECHNOLOGIES
- 12.1 LEGACY OEMS BACKWARD-INTEGRATING TO DEVELOP THEIR SOFTWARE SYSTEMS
- 12.2 TRANSITION TO SDV TO BE SLOWER IN ICE VEHICLES AND MARKET TO BE LED BY LUXURY VEHICLES
- 12.3 LEGACY OEMS SHIFTING TO DOMAIN CENTRALIZED ARCHITECTURE AND ZONAL CONTROL
- 12.4 CONCLUSION
- 13.1 KEY INSIGHTS OF INDUSTRY EXPERTS
- 13.2 DISCUSSION GUIDE
- 13.3 KNOWLEDGESTORE: MARKETSANDMARKETS’ SUBSCRIPTION PORTAL
-
13.4 CUSTOMIZATION OPTIONSFURTHER BREAKDOWN OF FUTURE OF SDV MARKET, BY VEHICLE TYPE AT COUNTRY-LEVEL (FOR COUNTRIES PRESENT IN THE REPORT)ADDITIONAL COUNTRIES (APART FROM THOSE ALREADY CONSIDERED IN REPORT) WITH SIGNIFICANT SDV MARKETCOMPANY INFORMATIONPROFILES OF ADDITIONAL MARKET PLAYERS (UP TO FIVE)
- 13.5 RELATED REPORTS
- 13.6 AUTHOR DETAILS
- TABLE 1 FUTURE OF SDV MARKET DEFINITION, BY VEHICLE TYPE
- TABLE 2 FUTURE OF SDV MARKET DEFINITION, BY SDV TYPE
- TABLE 3 FUTURE OF SDV MARKET DEFINITION, BY E/E ARCHITECTURE
- TABLE 4 INCLUSIONS AND EXCLUSIONS
- TABLE 5 USD EXCHANGE RATES
- TABLE 6 NETWORK SPEED REQUIRED FOR PERFORMANCE
- TABLE 7 PAID SERVICES PROVIDED BY KEY OEMS
- TABLE 8 IMPACT OF MARKET DYNAMICS
- TABLE 9 ROLE OF COMPANIES IN ECOSYSTEM
- TABLE 10 OEMS PROVIDING OVER-THE-AIR UPDATES
- TABLE 11 COMPUTE PLATFORM PROVIDERS
- TABLE 12 CLOUD PROVIDERS
- TABLE 13 REFERENCE OS AND SOFTWARE SUITE PROVIDERS
- TABLE 14 OEM PLANS FOR NEW E/E ARCHITECTURE
- TABLE 15 FUTURE OF SDV MARKET, BY SDV TYPE, 2020–2023 (THOUSAND UNITS)
- TABLE 16 FUTURE OF SDV MARKET, BY SDV TYPE, 2024–2030 (THOUSAND UNITS)
- TABLE 17 FUTURE OF SDV MARKET, BY VEHICLE TYPE, 2020–2023 (THOUSAND UNITS)
- TABLE 18 FUTURE OF SDV MARKET, BY VEHICLE TYPE, 2024–2030 (THOUSAND UNITS)
- TABLE 19 PASSENGER CAR: FUTURE OF SDV MARKET, BY REGION, 2020–2023 (THOUSAND UNITS)
- TABLE 20 PASSENGER CAR: FUTURE OF SDV MARKET, BY REGION, 2024–2030 (THOUSAND UNITS)
- TABLE 21 LIGHT COMMERCIAL VEHICLE: FUTURE OF SDV MARKET, BY REGION, 2020–2023 (THOUSAND UNITS)
- TABLE 22 LIGHT COMMERCIAL VEHICLE: FUTURE OF SDV MARKET, BY REGION, 2024–2030 (THOUSAND UNITS)
- TABLE 23 FUTURE OF SDV MARKET, BY REGION, 2020–2023 (USD BILLION)
- TABLE 24 FUTURE OF SDV MARKET, BY REGION, 2024–2030 (USD BILLION)
- TABLE 25 FUTURE OF SDV MARKET, BY REGION, 2020–2023 (THOUSAND UNITS)
- TABLE 26 FUTURE OF SDV MARKET, BY REGION, 2024–2030 (THOUSAND UNITS)
- TABLE 27 ASIA PACIFIC: FUTURE OF SDV MARKET, 2020–2023 (THOUSAND UNITS)
- TABLE 28 ASIA PACIFIC: FUTURE OF SDV MARKET, 2024–2030 (THOUSAND UNITS)
- TABLE 29 EUROPE: FUTURE OF SDV MARKET, 2020–2023 (THOUSAND UNITS)
- TABLE 30 EUROPE: FUTURE OF SDV MARKET, 2024–2030 (THOUSAND UNITS)
- TABLE 31 NORTH AMERICA: FUTURE OF SDV MARKET, 2020–2023 (THOUSAND UNITS)
- TABLE 32 NORTH AMERICA: FUTURE OF SDV MARKET, 2024–2030 (THOUSAND UNITS)
- TABLE 33 KEY PLAYER STRATEGIES, 2021–2024
- TABLE 34 FUTURE OF SDV MARKET: VEHICLE TYPE FOOTPRINT, 2023
- TABLE 35 FUTURE OF SDV MARKET: REGION FOOTPRINT, 2023
- TABLE 36 FUTURE OF SDV MARKET: LIST OF KEY START-UPS/SMES
- TABLE 37 FUTURE OF SDV MARKET: COMPETITIVE BENCHMARKING OF START-UPS/SMES
- TABLE 38 FUTURE OF SDV MARKET: PRODUCT LAUNCHES, JANUARY 2021–JUNE 2024
- TABLE 39 FUTURE OF SDV MARKET: DEALS, JANUARY 2021–JUNE 2024
- TABLE 40 TESLA: COMPANY OVERVIEW
- TABLE 41 TESLA: PRODUCTS OFFERED
- TABLE 42 TESLA: PRODUCT LAUNCHES
- TABLE 43 TESLA: DEALS
- TABLE 44 LI AUTO INC.: COMPANY OVERVIEW
- TABLE 45 LI AUTO INC.: PRODUCTS OFFERED
- TABLE 46 LI AUTO INC.: PRODUCT LAUNCHES
- TABLE 47 LI AUTO INC.: DEALS
- TABLE 48 ZEEKR: COMPANY OVERVIEW
- TABLE 49 ZEEKR: PRODUCTS OFFERED
- TABLE 50 ZEEKR: PRODUCT LAUNCHES
- TABLE 51 ZEEKR: DEALS
- TABLE 52 ZEEKR: EXPANSIONS
- TABLE 53 ZEEKR: OTHERS
- TABLE 54 XPENG INC.: COMPANY OVERVIEW
- TABLE 55 XPENG INC.: PRODUCTS OFFERED
- TABLE 56 XPENG INC.: PRODUCT LAUNCHES
- TABLE 57 XPENG INC.: DEALS
- TABLE 58 NIO: COMPANY OVERVIEW
- TABLE 59 NIO: PRODUCTS OFFERED
- TABLE 60 NIO: PRODUCT LAUNCHES
- TABLE 61 NIO: DEALS
- TABLE 62 RIVIAN: COMPANY OVERVIEW
- TABLE 63 RIVIAN: PRODUCTS OFFERED
- TABLE 64 RIVIAN: PRODUCT LAUNCHES
- TABLE 65 RIVIAN: DEALS
- TABLE 66 VOLKSWAGEN AG: COMPANY OVERVIEW
- TABLE 67 VOLKSWAGEN AG: PRODUCTS OFFERED
- TABLE 68 VOLKSWAGEN AG: PRODUCT LAUNCHES
- TABLE 69 VOLKSWAGEN AG: DEALS
- TABLE 70 VOLKSWAGEN AG: EXPANSIONS
- TABLE 71 HYUNDAI MOTOR CORPORATION: COMPANY OVERVIEW
- TABLE 72 HYUNDAI MOTOR CORPORATION: PRODUCTS OFFERED
- TABLE 73 HYUNDAI MOTOR CORPORATION: DEALS
- TABLE 74 FORD MOTOR COMPANY: COMPANY OVERVIEW
- TABLE 75 FORD MOTOR COMPANY: PRODUCTS OFFERED
- TABLE 76 FORD MOTOR COMPANY: PRODUCT LAUNCHES
- TABLE 77 FORD MOTOR COMPANY: DEALS
- TABLE 78 GENERAL MOTORS: COMPANY OVERVIEW
- TABLE 79 GENERAL MOTORS: PRODUCTS OFFERED
- TABLE 80 GENERAL MOTORS: PRODUCT LAUNCHES
- TABLE 81 GENERAL MOTORS: DEALS
- TABLE 82 RENAULT GROUP: COMPANY OVERVIEW
- TABLE 83 RENAULT GROUP: PRODUCTS OFFERED
- TABLE 84 RENAULT GROUP: PRODUCT LAUNCHES
- TABLE 85 RENAULT GROUP: DEALS
- TABLE 86 TOYOTA MOTOR CORPORATION: COMPANY OVERVIEW
- TABLE 87 TOYOTA MOTOR CORPORATION: PRODUCTS OFFERED
- TABLE 88 TOYOTA MOTOR CORPORATION: DEALS
- TABLE 89 STELLANTIS: COMPANY OVERVIEW
- TABLE 90 STELLANTIS: PRODUCTS OFFERED
- TABLE 91 STELLANTIS: PRODUCT LAUNCHES
- TABLE 92 STELLANTIS: DEALS
- TABLE 93 MERCEDES-BENZ AG: COMPANY OVERVIEW
- TABLE 94 MERCEDES-BENZ AG: PRODUCTS OFFERED
- TABLE 95 MERCEDES-BENZ AG: PRODUCT LAUNCHES
- TABLE 96 MERCEDES-BENZ AG: DEALS
- TABLE 97 BYD: COMPANY OVERVIEW
- TABLE 98 BYD: PRODUCTS OFFERED
- TABLE 99 BYD: PRODUCT LAUNCHES
- TABLE 100 BYD: DEALS
- TABLE 101 BMW: COMPANY OVERVIEW
- TABLE 102 BMW: PRODUCTS OFFERED
- TABLE 103 BMW: PRODUCT LAUNCHES
- TABLE 104 BMW: DEALS
- TABLE 105 NVIDIA CORPORATION: COMPANY OVERVIEW
- TABLE 106 QUALCOMM TECHNOLOGIES INC.: COMPANY OVERVIEW
- TABLE 107 BLACKBERRY LIMITED: COMPANY OVERVIEW
- TABLE 108 VECTOR INFORMATIK GMBH: COMPANY OVERVIEW
- TABLE 109 GOOGLE INC.: COMPANY OVERVIEW
- TABLE 110 AMAZON INC.: COMPANY OVERVIEW
- TABLE 111 MICROSOFT: COMPANY OVERVIEW
- TABLE 112 APEX.AI: COMPANY OVERVIEW
- TABLE 113 MOBILEYE: COMPANY OVERVIEW
- TABLE 114 TENCENT: COMPANY OVERVIEW
- TABLE 115 ALIBABA: COMPANY OVERVIEW
- TABLE 116 HORIZON ROBOTICS: COMPANY OVERVIEW
- TABLE 117 TATA TECHNOLOGIES: COMPANY OVERVIEW
- TABLE 118 KPIT TECHNOLOGIES: COMPANY OVERVIEW
- FIGURE 1 FUTURE OF SDV MARKET SEGMENTATION
- FIGURE 2 RESEARCH DESIGN
- FIGURE 3 RESEARCH PROCESS FLOW
- FIGURE 4 KEY INDUSTRY INSIGHTS
- FIGURE 5 BREAKDOWN OF PRIMARY INTERVIEWS: BY COMPANY TYPE, DESIGNATION, AND REGION
- FIGURE 6 RESEARCH METHODOLOGY: HYPOTHESIS BUILDING
- FIGURE 7 BOTTOM-UP APPROACH
- FIGURE 8 MARKET GROWTH PROJECTIONS FROM DEMAND-SIDE DRIVERS AND OPPORTUNITIES
- FIGURE 9 DEMAND AND SUPPLY-SIDE FACTOR ANALYSIS
- FIGURE 10 SDV GROWTH FACTORS: DATA STREAMS FUEL NEW FEATURES AND SERVICES
- FIGURE 11 GLOBAL SDV SHIFT SCENARIO
- FIGURE 12 KEY PLAYERS: SDV SHIFT COMPARISON
- FIGURE 13 SEMI-SDV TO BE TRANSITIONAL PHASE IN SHIFT TO SDV
- FIGURE 14 INCREASING DEMAND FOR BETTER DRIVING EXPERIENCE AND OEM PLANS FOR ALTERNATIVE REVENUE STREAMS TO DRIVE MARKET
- FIGURE 15 EUROPE TO BE FASTEST-GROWING MARKET WITH MAJOR EUROPEAN AUTOMAKERS SHIFTING TO DIGITAL FIRST ECOSYSTEM
- FIGURE 16 SEMI-SDV SEGMENT TO ACT AS TRANSITION PHASE FOR SDV SHIFT
- FIGURE 17 LIGHT COMMERCIAL VEHICLE TO BE FASTER-GROWING VEHICLE TYPE DURING FORECAST PERIOD
- FIGURE 18 INTEGRATED COMPONENTS OF SOFTWARE-DEFINED VEHICLES
- FIGURE 19 DRIVERS, RESTRAINTS, OPPORTUNITIES, AND CHALLENGES
- FIGURE 20 COST SAVINGS BY REGULAR OVER-THE-AIR UPDATES
- FIGURE 21 PERSONALIZED CLIENT ENGAGEMENT: BENEFITS TO CUSTOMERS
- FIGURE 22 QUALCOMM’S SNAPDRAGON DIGITAL CHASSIS PLATFORM
- FIGURE 23 5G USE CASES IN AUTOMOTIVE SECTOR
- FIGURE 24 OVER-THE-AIR UPDATE METHOD
- FIGURE 25 WORKING OF INTRUSION DETECTION SYSTEMS
- FIGURE 26 SERVICE-ORIENTED VEHICLE DIAGNOSTICS
- FIGURE 27 AUTOMOTIVE TECHNOLOGY STACK
- FIGURE 28 DIGITAL TWIN ECOSYSTEM
- FIGURE 29 ECOSYSTEM ANALYSIS
- FIGURE 30 CENTRAL HIGH-PERFORMANCE COMPUTING IN SDV
- FIGURE 31 NXP SEMICONDUCTORS: ZONE CONTROL POC
- FIGURE 32 OVER-THE-AIR FIRMWARE UPDATE THROUGH DEVICE MANAGEMENT SYSTEM
- FIGURE 33 TRENDS OF FUTURE E/E-ARCHITECTURE
- FIGURE 34 COMPARISON OF SDV OFFERINGS BY LEADING OEMS
- FIGURE 35 STRATEGIES FOLLOWED BY KEY LEGACY OEMS FOR SDV SHIFT
- FIGURE 36 OEM DASHBOARD ON SDV OFFERING AND EFFORTS BY KEY LEGACY OEMS
- FIGURE 37 CURRENT E/E ARCHITECTURE SCENARIO
- FIGURE 38 SHIFT IN E/E ARCHITECTURE FOR VEHICLE ELECTRONICS CONTROL
- FIGURE 39 SDV SEGMENT TO DOMINATE MARKET DURING FORECAST PERIOD
- FIGURE 40 PASSENGER CAR SEGMENT TO LEAD MARKET DURING FORECAST PERIOD
- FIGURE 41 FUTURE OF SDV MARKET, BY REGION, 2024–2030
- FIGURE 42 ASIA PACIFIC: FUTURE OF SDV MARKET SNAPSHOT
- FIGURE 43 SDV MARKET IN CHINA (2023)
- FIGURE 44 EUROPE: FUTURE OF SDV MARKET, BY COUNTRY, 2024–2030 (THOUSAND UNITS)
- FIGURE 45 NORTH AMERICA: FUTURE OF SDV MARKET SNAPSHOT
- FIGURE 46 MARKET SHARE ANALYSIS, 2023
- FIGURE 47 REVENUE ANALYSIS OF OEMS, 2019–2023
- FIGURE 48 FUTURE OF SDV MARKET: COMPANY EVALUATION MATRIX (KEY PLAYERS), 2023
- FIGURE 49 FUTURE OF SDV MARKET: COMPANY FOOTPRINT, 2023
- FIGURE 50 FUTURE OF SDV MARKET: OVERALL FOOTPRINT FOR OEMS TRANSITIONING TO SDV, 2023
- FIGURE 51 FUTURE OF SDV MARKET: COMPANY EVALUATION MATRIX (START-UPS/SMES), 2023
- FIGURE 52 VALUATION OF TOP 5 COMPANIES (OEMS)
- FIGURE 53 FINANCIAL METRICS OF TOP 5 PLAYERS (OEMS)
- FIGURE 54 TESLA: COMPANY SNAPSHOT
- FIGURE 55 TESLA: SDV SHIFT JOURNEY
- FIGURE 56 LI AUTO INC.: COMPANY SNAPSHOT
- FIGURE 57 LI AUTO INC.: SDV SHIFT JOURNEY
- FIGURE 58 ZEEKR: SDV SHIFT JOURNEY
- FIGURE 59 XPENG INC.: COMPANY SNAPSHOT
- FIGURE 60 XPENG INC.: SDV SHIFT JOURNEY
- FIGURE 61 NIO: COMPANY SNAPSHOT
- FIGURE 62 NIO: SDV SHIFT JOURNEY
- FIGURE 63 RIVIAN: COMPANY SNAPSHOT
- FIGURE 64 RIVIAN: SDV SHIFT JOURNEY
- FIGURE 65 VOLKSWAGEN AG: COMPANY SNAPSHOT
- FIGURE 66 VOLKSWAGEN AG: SDV SHIFT JOURNEY
- FIGURE 67 HYUNDAI MOTOR CORPORATION: COMPANY SNAPSHOT
- FIGURE 68 HYUNDAI MOTOR CORPORATION: SDV SHIFT JOURNEY
- FIGURE 69 FORD MOTOR COMPANY: COMPANY SNAPSHOT
- FIGURE 70 FORD MOTOR COMPANY: SDV SHIFT JOURNEY
- FIGURE 71 GENERAL MOTORS: COMPANY SNAPSHOT
- FIGURE 72 GENERAL MOTORS: SDV SHIFT JOURNEY
- FIGURE 73 RENAULT GROUP: COMPANY SNAPSHOT
- FIGURE 74 RENAULT GROUP: SDV SHIFT JOURNEY
- FIGURE 75 TOYOTA MOTOR CORPORATION: COMPANY SNAPSHOT
- FIGURE 76 TOYOTA MOTOR CORPORATION: SDV SHIFT JOURNEY
- FIGURE 77 STELLANTIS: COMPANY SNAPSHOT
- FIGURE 78 STELLANTIS: SDV SHIFT JOURNEY
- FIGURE 79 STELLANTIS: VEHICLE PLATFORMS
- FIGURE 80 MERCEDES-BENZ AG: COMPANY SNAPSHOT
- FIGURE 81 MERCEDES-BENZ AG: SDV SHIFT JOURNEY
- FIGURE 82 BYD: COMPANY SNAPSHOT
- FIGURE 83 BYD: SDV SHIFT JOURNEY
- FIGURE 84 BMW: COMPANY SNAPSHOT
- FIGURE 85 BMW: SDV SHIFT JOURNEY
- FIGURE 86 NVIDIA CORPORATION: SDV OFFERINGS
- FIGURE 87 QUALCOMM TECHNOLOGIES INC.: SDV OFFERING
- FIGURE 88 QUALCOMM TECHNOLOGIES INC.: SNAPDRAGON DIGITAL CHASSIS
- FIGURE 89 BLACKBERRY LIMITED: SDV OFFERING
- FIGURE 90 VECTOR INFORMATIK GMBH: SDV OFFERING
- FIGURE 91 GOOGLE INC.: SDV OFFERING
- FIGURE 92 AMAZON INC.: SDV OFFERING
- FIGURE 93 STRATEGIC RECOMMENDATIONS FOR OEMS IN SDV MARKET
The study involved four major activities to estimate the current size of the Software Defined Vehicle market. Exhaustive secondary research was done to collect information on the market, the peer market, and model mapping. The next step was to validate these findings, assumptions, and sizing with the industry experts across value chains through primary research. The bottom-up approach was employed to estimate the total market size. After that, market breakdown and data triangulation were used to determine the market size of segments and subsegments.
Secondary Research
Secondary sources referred to for this research study included automotive industry organizations involved with head-up display; publications from government sources [such as country level automotive associations and organizations, Organisation for Economic Co-operation and Development (OECD), World Bank, CDC, and Eurostat]; corporate filings (annual reports, investor presentations, and financial statements); and trade, business, and automotive associations. Secondary data was collected and analyzed to arrive at the overall market size, which was further validated through primary research.
Primary Research
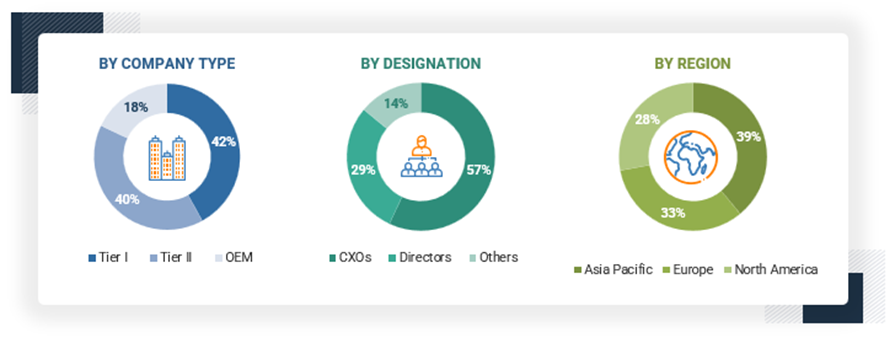
Extensive primary research has been conducted after acquiring an understanding of the SDV market scenario through secondary research. Several primary interviews have been conducted with market experts from both the demand-side vehicle manufacturers [(in terms of component supply), country-level government associations, and trade associations] and supply-side OEMs and component manufacturers across three major regions—North America, Europe, and Asia Pacific. Approximately 23% and 77% of primary interviews have been conducted from the demand and supply sides, respectively. Primary data has been collected through questionnaires, emails, and telephonic interviews. In the canvassing of primaries, efforts have been made to cover various departments within organizations, such as sales, operations, and administration, to provide a holistic viewpoint in our report.
After interacting with industry experts, brief sessions with highly experienced independent consultants have been conducted to reinforce the findings from the primaries. This, along with the in-house subject-matter experts’ opinions, has led to the findings as described in the remainder of this report.
To know about the assumptions considered for the study, download the pdf brochure
Market Size Estimation
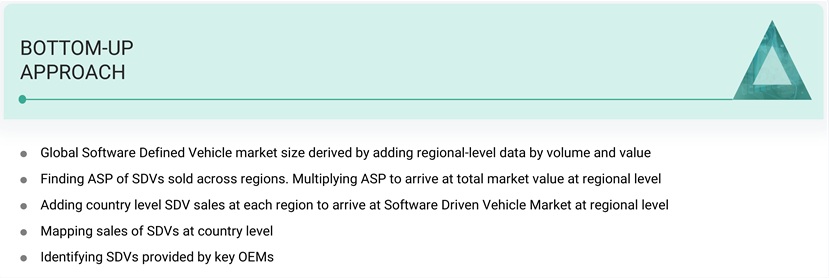
The bottom-up approach has been used to estimate and validate the size of the Software Defined Vehicle market. In this approach, the SDV statistics have been considered at the country level.
A model mapping of the SDVs has been carried out for each country to determine the market size in terms of volume. The number of SDV models varied from country to country. Then, the penetration of SDVs is applied to vehicle sales, giving the volume of the Software Defined Vehicle market. The country-level data has been summed up to arrive at the region-level data in terms of volume. The summation of the country-level market size has given the regional market size, and further summation of the regional market size has provided the global Software Defined Vehicle market size.
- The key players in the industry and markets have been identified through extensive secondary research.
- The industry’s future supply chain and market size, in terms of value, have been determined through primary and secondary research processes.
- All percentage shares, splits, and breakdowns have been determined using secondary sources and verified through primary sources.
Global Software Defined Vehicle Market Size: Bottom-Up Approach
To know about the assumptions considered for the study, Request for Free Sample Report
Data Triangulation
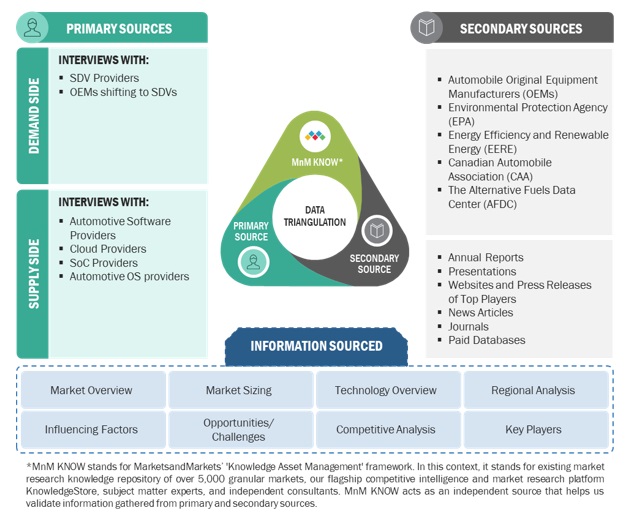
All percentage shares, splits, and breakdowns have been determined using secondary sources and verified by primary sources. All parameters that are said to affect the markets covered in this research study have been accounted for, viewed in extensive detail, and analyzed to obtain the final quantitative and qualitative data. This data has been consolidated and enhanced with detailed inputs and analysis from MarketsandMarkets and presented in the report.
data triangulation
Market Definition
SDV: A software-defined vehicle is one in which the majority of the vehicle's functions and features are controlled, enhanced, and updated through software rather than solely relying on hardware. This approach leverages advanced computing, connectivity, and software technologies to offer a range of benefits, including improved performance, enhanced safety, and greater flexibility in terms of updates and customization.
Key Stakeholders
- Third-party FOD providers
- Associations, forums, and alliances related to electric vehicles
- Automotive blogs
- Automobile manufacturers
- Automotive component providers
- Automotive cybersecurity providers
- Automotive software providers
- Autonomous vehicle manufacturers
- Autonomous vehicle platform providers
- Government agencies and policymakers
- Industry associations and experts
- Software providers for SDVs
Report Objectives
- To analyze and forecast the SDV market in terms of value (USD billion) and volume (thousand units) from 2024 to 2030
-
To segment the market by vehicle type, SDV type, and region
- To segment and forecast the market size by volume based on vehicle type (passenger car and light commercial vehicle)
- To segment and forecast the market size by volume based on SDV type (Semi-SDV and SDV)
- To segment and forecast the market by value and volume based on region (Asia Pacific, Europe, and North America)
- To segment the market qualitatively based on E/E architecture (Distributed architecture, domain centralized architecture, zonal control architecture)
- To provide detailed information about the factors influencing the market growth (drivers, challenges, restraints, and opportunities)
- To strategically analyze the market with respect to individual growth trends, prospects, and contributions to the total market
-
To study the following with respect to the market
- Ecosystem analysis
- Technology A\analysis
- OEM SDV shift strategies
- E/E architecture plans of OEM’s shifting to SDV
- Tech enabler developments for SDVs
-
To strategically profile the key players and comprehensively analyze their market share and core competencies
- To analyze the opportunities for stakeholders and the competitive landscape for market leaders
- To track and analyze competitive developments such as deals, product launches/developments, expansions, and other activities undertaken by the key industry participants
AVAILABLE CUSTOMIZATIONS
With the given market data, MarketsandMarkets offers customizations in accordance to the company’s specific needs.
- Software Defined Vehicle market, by Vehicle type, at a regional level
- Software Defined Vehicmarket, by SDV type, at a regional level
- Profiling of additional market players (Up to 5)
Growth opportunities and latent adjacency in Software Defined Vehicle Market