Smart Infrastructure Market

Smart Infrastructure Market Size, Share, Growth Analysis, By Offering, Focus Area (Smart Transportation, Smart Buildings, Smart Utilities, Smart Government), End User (Commercial, Residential, Industrial) and Region - Global Forecast to 2029

Report Code: TC 9052 Jun, 2024, by marketsandmarkets.com

[281 Pages Report] MarketsandMarkets forecasts that the smart infrastructure market size is projected to grow from USD 923.0 billion in 2024 to USD 2,109.5 billion by 2029 at a CAGR of 18.0% during the forecast period. The proliferation of connected devices and the availability of vast amounts of data enable the development of innovative smart infrastructure solutions. Organizations can gain insights to optimize operations and improve decision-making by harnessing data analytics and machine learning. Safety and security concerns drive the adoption of smart infrastructure solutions that enhance monitoring, surveillance, and emergency response capabilities. These solutions include smart traffic management systems, video surveillance, and disaster management platforms.

Smart Infrastructure Market

To know about the assumptions considered for the study, Request for Free Sample Report

Smart Infrastructure Market Opportunities

To know about the assumptions considered for the study, download the pdf brochure

Smart Infrastructure Market Dynamics

Driver:  The proliferation of IoT, AI, smart infrastructure, and connected devices

The proliferation of IoT, AI, smart infrastructure, and connected devices is significantly driving the growth of the smart infrastructure market. With its ability to interconnect everyday objects and enable data exchange, IoT facilitates the collection and analysis of vast amounts of data, optimizing infrastructure performance and enabling predictive maintenance. AI enhances this by processing data from IoT devices, providing actionable insights, automating operations, and improving decision-making processes. In the context of smart infrastructure, these technologies integrate to improve the quality of life, enhance sustainability, and streamline urban operations through interconnected systems, smart transportation, and energy management. Connected devices, which include smartphones and smart appliances, further enhance user interaction with infrastructure, improve energy management, and bolster public safety through real-time monitoring and control. Market trends indicate significant growth, driven by advancements in 5G connectivity, edge computing, a focus on sustainability, and increasing public-private partnerships. As these technologies evolve, their impact on smart infrastructure will expand, driving further advancements and market expansion.

Restraint: Lack of standardization

The lack of standardized frameworks creates a significant impediment to the growth of smart infrastructure. Without clear guidelines, interoperability concerns occur, preventing effective communication between diverse components. This fragmentation hampers integration while increasing costs due to specific solutions and specialized knowledge requirements. Furthermore, the lack of established standards increases security risks, making systems open to cyber-attacks. Regulatory uncertainty exacerbates issues, stifling investment and innovation. As a result, without a firm basis of standards, the rate of technical innovation slows, reducing smart infrastructure's ability to address urban difficulties efficiently. Collaboration among industry players, governments, and regulatory agencies is critical to define and accept common standards, unleashing the full potential of smart infrastructure solutions.

Opportunity: Growing smart city initiatives

Growing smart city initiatives represent a burgeoning opportunity for the smart infrastructure market, encompassing diverse sectors like energy, transportation, healthcare, water management, waste management, and public safety. These initiatives are driven by the pressing challenges of urbanization, including congestion, pollution, and resource management. By integrating technology such as IoT devices, data analytics, and AI algorithms, smart infrastructure aims to optimize urban systems and enhance residents' quality of life. From smart energy management and intelligent transportation systems to connected healthcare and water/waste management, these initiatives effectively leverage digital transformation to address urban challenges. Moreover, public-private partnerships are pivotal in funding and implementing these projects, offering significant investment opportunities for companies specializing in smart grids, IoT platforms, data analytics, and urban planning. As governments and businesses worldwide invest in smart city projects, the smart infrastructure market is poised for rapid growth, driving innovation and sustainability in urban development.

Challenge: Integration with existing infrastructure

Integration with current infrastructure is a significant hurdle for the smart infrastructure business due to various factors. Legacy systems are typically incompatible with new smart solutions, demanding expensive and time-consuming retrofitting or modifications to assure interoperability. Furthermore, interoperability concerns come from multiple suppliers using proprietary protocols, which impedes seamless data sharing and coordination. Overcoming data silos and technical challenges hinders integration initiatives, necessitating specialized knowledge and resources. Furthermore, integration projects can interrupt existing operations, affecting service delivery and needing careful planning and coordination to avoid unwanted outcomes. Given the significant costs, organizations must carefully assess the advantages against possible increases in efficiency and innovation. Regulatory compliance adds another layer of complexity, requiring extensive paperwork and testing to ensure legal conformity.

Smart Infrastructure
Market Ecosystem

Prominent companies in this market have innovated their offerings and possess a diversified product portfolio, state-of-the-art technologies, and marketing networks. Prominent companies in this market include Siemens (Germany), Cisco (US), Honeywell (US), Hitachi (Japan), IBM (US), Schneider Electric (France), Microsoft (US), Huawei (China), ABB (Switzerland), Johnson Controls (Ireland), Intel (US), Oracle (US), TCS (India), Fujitsu (Japan), Itron (US), Accenture (Ireland), Sense (US), AppyWay (UK), Telensa (UK), Gaia (India), Panamax Infotech (India), Envelio (Germany), XENIUS (India), Anavision (Hong Kong), Enevo (US), Cubic Telecom (Ireland).

Top Companies in Smart Infrastructure Market

Based on end user, the industrial segment is expected to grow with the highest CAGR during the forecast period

Industrials increasingly leverage smart infrastructure to enhance efficiency, safety, and sustainability. This advanced infrastructure encompasses IoT, AI, big data analytics, and automation, facilitating various applications. Predictive maintenance, driven by sensors and machine learning, allows for timely machinery servicing, minimizing downtime and reducing costs. Smart grids and energy management systems optimize energy consumption and integrate renewable sources effectively. Automation and robotics streamline production, while digital twins enable precise simulations and optimizations. Real-time tracking and data analytics improve supply chain management, and smart sensors ensure compliance with safety regulations. Environmental sustainability is supported through smart waste management and resource monitoring. Remote monitoring and comprehensive asset lifecycle management enhance operational oversight and asset utilization. Companies like General Electric, Siemens, Schneider Electric, and Bosch exemplify the successful integration of these technologies, reaping benefits such as cost savings, increased uptime, enhanced productivity, improved safety, and sustainability. By adopting smart infrastructure, industrials are better equipped to meet market demands, adhere to regulations, and address environmental challenges, gaining a competitive advantage.

By focus area, the smart transportation segment to hold the largest market size during the forecast period

Smart transportation is a cornerstone, embodying innovation and efficiency in urban and rural mobility. Through a blend of cutting-edge technologies like sensors, data analytics, and IoT, smart transportation revolutionizes how we navigate our surroundings. From optimizing traffic flow and managing public transport networks to facilitating the rise of autonomous vehicles and electric mobility, its applications are diverse and far-reaching. By seamlessly integrating various modes of transportation and promoting sustainable alternatives, smart transportation enhances convenience and safety and addresses pressing urban challenges like congestion and emissions. Ultimately, it's a driving force behind the creation of resilient, interconnected cities that prioritize the well-being of their inhabitants while paving the way toward a more sustainable future.

Based on region, Asia Pacific is expected to grow with the highest CAGR during the forecast period

The market in Asia Pacific is experiencing robust growth, fueled by factors such as rapid urbanization, population expansion, and the pressing need for advanced infrastructure solutions. Countries across the region are investing heavily in expanding and modernizing their infrastructure. Energy solutions are evolving towards smarter grids and renewable integration to meet growing demands sustainably. Water management initiatives are leveraging sensors and IoT to monitor and optimize distribution networks, addressing water scarcity challenges. In buildings, automation and IoT are enhancing energy efficiency and occupant comfort. The foundation of this transformation lies in robust ICT infrastructure, including 5G and fiber-optic broadband, enabling seamless connectivity and data transmission. With governments, businesses, and communities embracing these innovations, the Asia Pacific region is poised for continued growth and advancement in smart infrastructure.

North American Smart Infrastructure Market Size, and Share

Market Players:

The major players in the Smart infrastructure Siemens AG (Germany), Cisco (US), IBM (US), Honeywell (US), Schneider Electric (France). These players have adopted various growth strategies, such as partnerships, agreements and collaborations, new product launches, product enhancements, and acquisitions to expand their footprint in the smart infrastructure market.

Get online access to the report on the World's First Market Intelligence Cloud

  • Easy to Download Historical Data & Forecast Numbers
  • Company Analysis Dashboard for high growth potential opportunities
  • Research Analyst Access for customization & queries
  • Competitor Analysis with Interactive dashboard
  • Latest News, Updates & Trend analysis
Request Sample

Scope of the Report

Report Metrics

Details

Market size available for years

2019-2029

Base year considered

2023

Forecast period

2024–2029

Forecast units

Value (USD) Million/Billion

Segments Covered

Offering (hardware, software, services (professional services (consulting & implementation, support & maintenance, training & education), managed services)), Focus Area (smart transportation, smart buildings, smart utilities, smart healthcare, smart hospitality, smart agriculture, smart manufacturing, smart government, other focus areas), End Users (commercial, residential, industrial, government & defense)

Region covered

North America, Europe, Asia Pacific, Middle East & Africa, Latin America

Companies covered

Siemens (Germany), Cisco, (US), Honeywell (US), Hitachi (Japan), IBM (US), Schneider Electric (France), Microsoft (US), Huawei (China), ABB (Switzerland), Johnson Controls (Ireland), Intel (US), Oracle (US), TCS (India), Fujitsu (Japan), Itron (US), Accenture (Ireland), Sense (US), AppyWay (UK), Telensa (UK), Gaia (India), Panamax Infotech (India), Envelio (Germany), XENIUS (India), Anavision (Hong Kong), Enevo (US), Cubic Telecom (Ireland)

This research report categorizes the smart infrastructure market based on offering, focus area, end user, and region.

Based on Offering:
  • Hardware
  • Software
  • Services
    • Professional Services
      • Consulting & Implementation
      • Support & Maintenance
      • Training & Education
    • Managed Services
  • Focus Area
    • Smart Transportation
    • Smart Buildings
    • Smart Utilities
    • Smart Healthcare
    • Smart Hospitality
    • Smart Agriculture
    • Smart Manufacturing
    • Smart Government
    • Other Focus Areas
  • End Users
    • Commercial
    • Residential
    • Industrial
    • Government & Defense
Based on the region:
  • North America
    • US
    • Canada
  • Europe
    • UK
    • Germany
    • France
    • Italy
    • Rest of Europe
  • Asia Pacific
    • China
    • Japan
    • India
    • Rest of Asia Pacific
  • Middle East & Africa
    • GCC Countries
      • UAE
      • KSA
      • Rest of GCC Countries
    • South Africa
    • Rest of Middle East & Africa
  • Latin America
    • Brazil
    • Mexico
    • Rest of Latin America

Recent Developments

  • In May 2024, Siemens and Foxconn signed a memorandum of understanding (MoU), to drive digital transformation and sustainability in smart manufacturing platforms. The focus is on global manufacturing processes in electronics, information and communications technology, and electric vehicles (EV). Siemens and Foxconn are working together to establish a scalable and seamless engineering and manufacturing ecosystem.
  • In May 2024, Cisco collaborated with Telenor to advance shared strategic priorities, including sustainability, connectivity, security, and managed services for critical industries. The two companies have collaborated on various initiatives, including enhancing connected experiences for Telenor customers with improved 5G, cloud, data analysis, IoT, Open vRAN, Smart Buildings, and security solutions.
  • In May 2024, Schneider Electric collaborated with Capgemini to help organizations accelerate their journey towards smarter and greener facility management and energy efficiency; the Energy Command Center leverages a unique end-to-end combination of digital solutions and cutting-edge technologies to both simplify energy management and optimize its consumption.
  • In May 2024, Honeywell partnered with Enel to enhance building automation and demand response solutions for commercial and industrial organizations by using automation to control and regulate energy loads to help stabilize the power grid.
  • In April 2024, Siemens Smart Infrastructure launched Electrification X, a highly scalable Internet-of-Things (IoT) SaaS offering to transform electrification infrastructure. Electrification X is a continuously growing dynamic, open, and interoperable portfolio, facilitating the seamless digital transformation of electrification infrastructure across commercial, industrial, and utility applications.
  • In March 2024, Hitachi developed a mobility control infrastructure that achieves high safety and operational efficiency in transport infrastructure. When automatically or remotely operating mobility devices, the new technology determines environmental changes along a route in real-time, such as weather or status of wireless communication. It manages them within a digital space to predict subsequent changes and calculates a safe movement route, thus enabling stable operation, to provide safe and efficient automatic operation for supporting daily living and recovery activities in disaster-stricken areas.

Frequently Asked Questions (FAQ):

To speak to our analyst for a discussion on the above findings, click Speak to Analyst

TABLE OF CONTENTS
 
1 INTRODUCTION (Page No. - 43)
    1.1 STUDY OBJECTIVES 
    1.2 MARKET DEFINITION 
           1.2.1 INCLUSIONS & EXCLUSIONS
    1.3 STUDY SCOPE 
           1.3.1 MARKET SEGMENTATION
           1.3.2 REGIONS COVERED
    1.4 YEARS CONSIDERED 
    1.5 CURRENCY CONSIDERED 
           TABLE 1 USD EXCHANGE RATES, 2021–2023
    1.6 STAKEHOLDERS 
 
2 RESEARCH METHODOLOGY (Page No. - 47)
    2.1 RESEARCH DATA 
           FIGURE 1 SMART INFRASTRUCTURE MARKET: RESEARCH DESIGN
           2.1.1 SECONDARY DATA
                    2.1.1.1 Key data from secondary sources
           2.1.2 PRIMARY DATA
                    2.1.2.1 Primary interviews with experts
                    2.1.2.2 Breakdown of primary profiles
                    2.1.2.3 Key data from primary sources
                    2.1.2.4 Key insights from industry experts
    2.2 MARKET SIZE ESTIMATION 
           FIGURE 2 MARKET SIZE ESTIMATION METHODOLOGY-APPROACH 1 (SUPPLY-SIDE): REVENUE OF OFFERINGS IN SMART INFRASTRUCTURE MARKET
           FIGURE 3 MARKET SIZE ESTIMATION METHODOLOGY: APPROACH 2 (DEMAND-SIDE)
           FIGURE 4 MARKET SIZE ESTIMATION: TOP-DOWN & BOTTOM-UP APPROACHES
           2.2.1 TOP-DOWN APPROACH
           2.2.2 BOTTOM-UP APPROACH
    2.3 DATA TRIANGULATION 
           FIGURE 5 DATA TRIANGULATION
           TABLE 2 FACTOR ANALYSIS
    2.4 RESEARCH ASSUMPTIONS 
    2.5 LIMITATIONS AND RISK ASSESSMENT 
    2.6 RECESSION IMPACT ON SMART INFRASTRUCTURE MARKET 
 
3 EXECUTIVE SUMMARY (Page No. - 57)
    FIGURE 6 SMART INFRASTRUCTURE MARKET, 2022–2029 (USD BILLION) 
    FIGURE 7 SMART INFRASTRUCTURE MARKET, REGIONAL SHARE, 2024 
 
4 PREMIUM INSIGHTS (Page No. - 60)
    4.1 ATTRACTIVE OPPORTUNITIES FOR PLAYERS IN SMART INFRASTRUCTURE MARKET 
           FIGURE 8 INCREASING TECHNOLOGICAL ADVANCEMENTS TO ENHANCE INFRASTRUCTURES AND RISING SMART CITY INITIATIVES TO DRIVE MARKET
    4.2 NORTH AMERICA: SMART INFRASTRUCTURE MARKET, BY OFFERING AND COUNTRY 
           FIGURE 9 HARDWARE SEGMENT AND US TO ACCOUNT FOR LARGEST MARKET SHARES IN NORTH AMERICA, 2024
    4.3 ASIA PACIFIC SMART INFRASTRUCTURE MARKET: KEY OFFERINGS AND TOP THREE COUNTRIES 
           FIGURE 10 HARDWARE SEGMENT AND CHINA TO ACCOUNT FOR LARGEST MARKET SHARES IN ASIA PACIFIC, 2024
    4.4 SMART INFRASTRUCTURE MARKET, BY FOCUS AREA 
           FIGURE 11 SMART TRANSPORTATION SEGMENT TO ACCOUNT FOR LARGEST MARKET SHARE DURING FORECAST PERIOD
    4.5 SMART INFRASTRUCTURE MARKET, BY END USER 
           FIGURE 12 COMMERCIAL SEGMENT TO ACCOUNT FOR LARGEST MARKET SHARE DURING FORECAST PERIOD
 
5 MARKET OVERVIEW AND INDUSTRY TRENDS (Page No. - 63)
    5.1 INTRODUCTION 
    5.2 MARKET DYNAMICS 
           FIGURE 13 SMART INFRASTRUCTURE MARKET: DRIVERS, RESTRAINTS, OPPORTUNITIES, AND CHALLENGES
           5.2.1 DRIVERS
                    5.2.1.1 Proliferation of IoT, AI, smart infrastructure, and connected devices
                    5.2.1.2 Growing urbanization and demand for sustainable solutions
                    5.2.1.3 Global shift toward sustainable energy transition
           5.2.2 RESTRAINTS
                    5.2.2.1 High implementation costs
                    5.2.2.2 Lack of standardized frameworks
           5.2.3 OPPORTUNITIES
                    5.2.3.1 Growing smart city initiatives
                    5.2.3.2 Rising public and private investments
           5.2.4 CHALLENGES
                    5.2.4.1 Integration with existing infrastructure
                    5.2.4.2 Data security and privacy concerns
    5.3 INDUSTRY TRENDS 
           5.3.1 BRIEF HISTORY OF SMART INFRASTRUCTURE MARKET
                    FIGURE 14 BRIEF HISTORY OF SMART INFRASTRUCTURE
                    5.3.1.1 1990–2000
                    5.3.1.2 2000–2010
                    5.3.1.3 2010–2020
                    5.3.1.4 2020–present
           5.3.2 TRENDS/DISRUPTIONS IMPACTING CUSTOMERS’ BUSINESSES
                    FIGURE 15 TRENDS/DISRUPTIONS IMPACTING CUSTOMERS’ BUSINESSES
           5.3.3 PRICING ANALYSIS
                    5.3.3.1 Average selling price trend of key players, by focus area
                               FIGURE 16 AVERAGE SELLING PRICE TREND OF KEY PLAYERS, BY FOCUS AREA (USD)
                               TABLE 3 AVERAGE SELLING PRICE TREND OF KEY PLAYERS, BY FOCUS AREA (USD)
                    5.3.3.2 Indicative pricing analysis of smart infrastructure
                               TABLE 4 INDICATIVE PRICING ANALYSIS OF SMART INFRASTRUCTURE
           5.3.4 SUPPLY CHAIN ANALYSIS
                    FIGURE 17 SMART INFRASTRUCTURE MARKET: SUPPLY CHAIN ANALYSIS
           5.3.5 ECOSYSTEM
                    TABLE 5 SMART INFRASTRUCTURE MARKET: ECOSYSTEM
                    FIGURE 18 KEY PLAYERS IN SMART INFRASTRUCTURE MARKET ECOSYSTEM
           5.3.6 TECHNOLOGY ANALYSIS
                    5.3.6.1 Key technologies
                               5.3.6.1.1 AI and ML
                               5.3.6.1.2 Internet of Things
                               5.3.6.1.3 Big data analytics
                               5.3.6.1.4 5G
                    5.3.6.2 Adjacent technologies
                               5.3.6.2.1 Robotics
                               5.3.6.2.2 Augmented intelligence
                               5.3.6.2.3 Edge computing
                               5.3.6.2.4 Renewable energy solutions
                    5.3.6.3 Complementary technologies
                               5.3.6.3.1 AR and VR
                               5.3.6.3.2 Smart grids
                               5.3.6.3.3 Cybersecurity solutions
           5.3.7 PATENT ANALYSIS
                    5.3.7.1 Methodology
                               FIGURE 19 LIST OF MAJOR PATENTS FOR SMART INFRASTRUCTURE
                               TABLE 6 LIST OF MAJOR PATENTS
           5.3.8 HS CODE: LUMINARIES AND LIGHTING FITTINGS, SOLELY FOR LED LIGHT SOURCES (940542)
                    5.3.8.1 Export scenario
                               TABLE 7 EXPORT SCENARIO FOR HS CODE: 940542, BY COUNTRY, 2022–2023 (USD THOUSAND)
                    5.3.8.2 Import scenario
                               TABLE 8 IMPORT SCENARIO FOR HS CODE: 940542, BY COUNTRY, 2022–2023 (USD THOUSAND)
           5.3.9 CASE STUDY ANALYSIS
                    TABLE 9 SMART INFRASTRUCTURE LLP TRANSFORMED CLOUD SERVICE DELIVERY WITH CISCO ACI AND TERRAFORM
                    TABLE 10 PROVINCE OF CÓRDOBA IMPROVED SAFETY OF ITS MUNICIPALITIES USING NEC’S CLOUD-BASED SHARED PLATFORM
                    TABLE 11 ABB HELPED FASTNED EXPAND ITS EV FAST CHARGE NETWORK ACROSS EUROPE
                    TABLE 12 HONEYWELL ENABLED EFFICIENT FLIGHT ROUTING FOR NEWARK LIBERTY INTERNATIONAL AIRPORT
                    TABLE 13 BANE NOR SELECTED THALES TO PROVIDE NEXT-GENERATION NATIONWIDE TRAFFIC MANAGEMENT SYSTEM
                    TABLE 14 CURTIN UNIVERSITY ADOPTED HITACHI IOT SOLUTION TO IMPLEMENT SMART CAMPUS AND MAKE INFORMED DECISIONS
           5.3.10 KEY CONFERENCES AND EVENTS, 2024–2025
                    TABLE 15 SMART INFRASTRUCTURE MARKET: DETAILED LIST OF CONFERENCES AND EVENTS
           5.3.11 CURRENT AND EMERGING BUSINESS MODELS
                    5.3.11.1 Current business models
                               5.3.11.1.1 Public-Private Partnerships (PPPs) model
                               5.3.11.1.2 Subscription-based services model
                               5.3.11.1.3 Pay-per-use model
                    5.3.11.2 Emerging business models
                               5.3.11.2.1 Revenue sharing with data monetization model
                               5.3.11.2.2 Asset-based value creation model
                               5.3.11.2.3 Circular economy model
                               5.3.11.2.4 Tokenization and blockchain model
           5.3.12 BEST PRACTICES IN SMART INFRASTRUCTURE MARKET
           5.3.13 SMART INFRASTRUCTURE MARKET: TOOLS, FRAMEWORKS, AND TECHNIQUES
           5.3.14 SMART INFRASTRUCTURE MARKET: FUTURE LANDSCAPE
                    5.3.14.1 Smart infrastructure technology roadmap till 2030
                    5.3.14.2 Short-term roadmap (2024–2025)
                    5.3.14.3 Mid-term roadmap (2026–2028)
                    5.3.14.4 Long-term roadmap (2029–2030)
           5.3.15 REGULATORY LANDSCAPE
                    5.3.15.1 Regulatory bodies, government agencies, and other organizations
                               TABLE 16 NORTH AMERICA: LIST OF REGULATORY BODIES, GOVERNMENT AGENCIES, AND OTHER ORGANIZATIONS
                               TABLE 17 EUROPE: LIST OF REGULATORY BODIES, GOVERNMENT AGENCIES, AND OTHER ORGANIZATIONS
                               TABLE 18 ASIA PACIFIC: LIST OF REGULATORY BODIES, GOVERNMENT AGENCIES, AND OTHER ORGANIZATIONS
                               TABLE 19 ROW: LIST OF REGULATORY BODIES, GOVERNMENT AGENCIES, AND OTHER ORGANIZATIONS
                    5.3.15.2 North America
                               5.3.15.2.1 US
                               5.3.15.2.2 Canada
                    5.3.15.3 Europe
                    5.3.15.4 Asia Pacific
                               5.3.15.4.1 South Korea
                               5.3.15.4.2 China
                               5.3.15.4.3 India
                    5.3.15.5 Middle East & Africa
                               5.3.15.5.1 UAE
                               5.3.15.5.2 KSA
                               5.3.15.5.3 Bahrain
                    5.3.15.6 Latin America
                               5.3.15.6.1 Brazil
                               5.3.15.6.2 Mexico
           5.3.16 PORTER’S FIVE FORCES ANALYSIS
                    TABLE 20 PORTER’S FIVE FORCES IMPACT ON SMART INFRASTRUCTURE MARKET
                    FIGURE 20 SMART INFRASTRUCTURE MARKET: PORTER’S FIVE FORCES MODEL
                    5.3.16.1 Threat of new entrants
                    5.3.16.2 Threat of substitutes
                    5.3.16.3 Bargaining power of buyers
                    5.3.16.4 Bargaining power of suppliers
                    5.3.16.5 Intensity of competitive rivalry
           5.3.17 KEY STAKEHOLDERS AND BUYING CRITERIA
                    5.3.17.1 Key stakeholders in buying process
                               FIGURE 21 INFLUENCE OF STAKEHOLDERS ON BUYING PROCESS FOR KEY END USERS
                               TABLE 21 INFLUENCE OF STAKEHOLDERS ON BUYING PROCESS FOR KEY END USERS (%)
                    5.3.17.2 Buying criteria
                               FIGURE 22 KEY BUYING CRITERIA FOR TOP THREE END USERS
                               TABLE 22 KEY BUYING CRITERIA FOR TOP THREE END USERS
           5.3.18 INVESTMENT AND FUNDING SCENARIO
 
6 SMART INFRASTRUCTURE MARKET, BY OFFERING (Page No. - 97)
    6.1 INTRODUCTION 
           FIGURE 23 SOFTWARE SEGMENT TO GROW AT HIGHEST CAGR DURING FORECAST PERIOD
           TABLE 23 SMART INFRASTRUCTURE MARKET, BY OFFERING, 2019–2023 (USD BILLION)
           TABLE 24 SMART INFRASTRUCTURE MARKET, BY OFFERING, 2024–2029 (USD BILLION)
           6.1.1 OFFERINGS: SMART INFRASTRUCTURE MARKET DRIVERS
    6.2 HARDWARE 
           6.2.1 NEED TO ENHANCE EFFICIENCY, REDUCE COSTS, SUPPORT SUSTAINABILITY, AND IMPROVE SAFETY TO DRIVE MARKET
                    TABLE 25 HARDWARE: SMART INFRASTRUCTURE MARKET, BY REGION, 2019–2023 (USD BILLION)
                    TABLE 26 HARDWARE: SMART INFRASTRUCTURE MARKET, BY REGION, 2024–2029 (USD BILLION)
    6.3 SOFTWARE 
           6.3.1 NEED TO OPTIMIZE EFFICIENCY, IMPROVE FUNCTIONALITY, AND ENSURE SUSTAINABILITY IN MODERN URBAN ENVIRONMENTS TO PROPEL MARKET
                    TABLE 27 SOFTWARE: SMART INFRASTRUCTURE MARKET, BY REGION, 2019–2023 (USD BILLION)
                    TABLE 28 SOFTWARE: SMART INFRASTRUCTURE MARKET, BY REGION, 2024–2029 (USD BILLION)
    6.4 SERVICES 
           6.4.1 SERVICES TO CONTRIBUTE TO SUCCESSFUL DEVELOPMENT, DEPLOYMENT, AND OPERATION OF ADVANCED URBAN AND RURAL INFRASTRUCTURE
                    FIGURE 24 MANAGED SERVICES SEGMENT TO GROW AT HIGHER CAGR DURING FORECAST PERIOD
                    TABLE 29 SMART INFRASTRUCTURE MARKET, BY SERVICE, 2019–2023 (USD BILLION)
                    TABLE 30 SMART INFRASTRUCTURE MARKET, BY SERVICE, 2024–2029 (USD BILLION)
                    TABLE 31 SERVICES: SMART INFRASTRUCTURE MARKET, BY REGION, 2019–2023 (USD BILLION)
                    TABLE 32 SERVICES: SMART INFRASTRUCTURE MARKET, BY REGION, 2024–2029 (USD BILLION)
           6.4.2 PROFESSIONAL SERVICES
                    FIGURE 25 CONSULTING & IMPLEMENTATION SERVICES SEGMENT TO GROW AT HIGHEST CAGR DURING FORECAST PERIOD
                    TABLE 33 SMART INFRASTRUCTURE MARKET, BY PROFESSIONAL SERVICE, 2019–2023 (USD BILLION)
                    TABLE 34 SMART INFRASTRUCTURE MARKET, BY PROFESSIONAL SERVICE, 2024–2029 (USD BILLION)
                    TABLE 35 PROFESSIONAL SERVICES: SMART INFRASTRUCTURE MARKET, BY REGION, 2019–2023 (USD BILLION)
                    TABLE 36 PROFESSIONAL SERVICES: SMART INFRASTRUCTURE MARKET, BY REGION, 2024–2029 (USD BILLION)
                    6.4.2.1 Consulting & implementation
                               TABLE 37 CONSULTING & IMPLEMENTATION: SMART INFRASTRUCTURE SERVICES MARKET, BY REGION, 2019–2023 (USD BILLION)
                               TABLE 38 CONSULTING & IMPLEMENTATION: SMART INFRASTRUCTURE SERVICES MARKET, BY REGION, 2024–2029 (USD BILLION)
                    6.4.2.2 Support & maintenance
                               TABLE 39 SUPPORT & MAINTENANCE: SMART INFRASTRUCTURE SERVICES MARKET, BY REGION, 2019–2023 (USD BILLION)
                               TABLE 40 SUPPORT & MAINTENANCE: SMART INFRASTRUCTURE SERVICES MARKET, BY REGION, 2024–2029 (USD BILLION)
                    6.4.2.3 Training & education
                               TABLE 41 TRAINING & EDUCATION: SMART INFRASTRUCTURE SERVICES MARKET, BY REGION, 2019–2023 (USD BILLION)
                               TABLE 42 TRAINING & EDUCATION: SMART INFRASTRUCTURE SERVICES MARKET, BY REGION, 2024–2029 (USD BILLION)
           6.4.3 MANAGED SERVICES
                    TABLE 43 MANAGED SERVICES: SMART INFRASTRUCTURE MARKET, BY REGION,  2019–2023 (USD BILLION)
                    TABLE 44 MANAGED SERVICES: SMART INFRASTRUCTURE MARKET, BY REGION,  2024–2029 (USD BILLION)
 
7 SMART INFRASTRUCTURE MARKET, BY FOCUS AREA (Page No. - 109)
    7.1 INTRODUCTION 
           FIGURE 26 SMART HEALTHCARE SEGMENT TO GROW AT HIGHEST CAGR DURING FORECAST PERIOD
           TABLE 45 SMART INFRASTRUCTURE MARKET, BY FOCUS AREA, 2019–2023 (USD BILLION)
           TABLE 46 SMART INFRASTRUCTURE MARKET, BY FOCUS AREA, 2024–2029 (USD BILLION)
           7.1.1 FOCUS AREAS: SMART INFRASTRUCTURE MARKET DRIVERS
    7.2 SMART TRANSPORTATION 
           7.2.1 NEED TO ENHANCE EFFICIENCY, SAFETY, AND SUSTAINABILITY IN URBAN AND RURAL ENVIRONMENTS TO FUEL DEMAND FOR SMART TRANSPORTATION
                    TABLE 47 SMART TRANSPORTATION: SMART INFRASTRUCTURE MARKET, BY REGION,  2019–2023 (USD BILLION)
                    TABLE 48 SMART TRANSPORTATION: SMART INFRASTRUCTURE MARKET, BY REGION,  2024–2029 (USD BILLION)
    7.3 SMART BUILDINGS 
           7.3.1 SMART BUILDINGS TO LEVERAGE INTERCONNECTED SYSTEMS TO OPTIMIZE ENERGY CONSUMPTION, REDUCE OPERATIONAL COSTS, AND ENHANCE OCCUPANT COMFORT AND PRODUCTIVITY
                    TABLE 49 SMART BUILDINGS: SMART INFRASTRUCTURE MARKET, BY REGION,  2019–2023 (USD BILLION)
                    TABLE 50 SMART BUILDINGS: SMART INFRASTRUCTURE MARKET, BY REGION,  2024–2029 (USD BILLION)
    7.4 SMART UTILITIES 
           7.4.1 SMART UTILITIES TO CREATE MORE RESILIENT AND SUSTAINABLE URBAN ENVIRONMENTS BY PROMOTING ENERGY EFFICIENCY, REDUCING WASTE, AND MITIGATING ENVIRONMENTAL IMPACT
                    TABLE 51 SMART UTILITIES: SMART INFRASTRUCTURE MARKET, BY REGION,  2019–2023 (USD BILLION)
                    TABLE 52 SMART UTILITIES: SMART INFRASTRUCTURE MARKET, BY REGION,  2024–2029 (USD BILLION)
    7.5 SMART HEALTHCARE 
           7.5.1 SMART HEALTHCARE SOLUTIONS TO HELP ORGANIZATIONS MANAGE VARIOUS BOTTLENECKS IN CAREGIVING AND BRIDGE GAP BETWEEN PATIENTS AND CARE PROVIDERS
                    TABLE 53 SMART HEALTHCARE: SMART INFRASTRUCTURE MARKET, BY REGION,  2019–2023 (USD BILLION)
                    TABLE 54 SMART HEALTHCARE: SMART INFRASTRUCTURE MARKET, BY REGION,  2024–2029 (USD BILLION)
    7.6 SMART HOSPITALITY 
           7.6.1 INCREASING NEED TO ENHANCE GUEST EXPERIENCES, STREAMLINE OPERATIONS, AND IMPROVE OVERALL EFFICIENCY TO DRIVE MARKET
                    TABLE 55 SMART HOSPITALITY: SMART INFRASTRUCTURE MARKET, BY REGION,  2019–2023 (USD BILLION)
                    TABLE 56 SMART HOSPITALITY: SMART INFRASTRUCTURE MARKET, BY REGION,  2024–2029 (USD BILLION)
    7.7 SMART AGRICULTURE 
           7.7.1 SMART AGRICULTURE TO ENHANCE RESOURCE MANAGEMENT, SUSTAINABILITY, AND DATA-DRIVEN DECISION-MAKING
                    TABLE 57 SMART AGRICULTURE: SMART INFRASTRUCTURE MARKET, BY REGION,  2019–2023 (USD BILLION)
                    TABLE 58 SMART AGRICULTURE: SMART INFRASTRUCTURE MARKET, BY REGION,  2024–2029 (USD BILLION)
    7.8 SMART MANUFACTURING 
           7.8.1 GROWING NEED TO REDUCE ENERGY CONSUMPTION, MINIMIZE WASTE, AND OPTIMIZE RESOURCE UTILIZATION TO DRIVE MARKET
                    TABLE 59 SMART MANUFACTURING: SMART INFRASTRUCTURE MARKET, BY REGION,  2019–2023 (USD BILLION)
                    TABLE 60 SMART MANUFACTURING: SMART INFRASTRUCTURE MARKET, BY REGION,  2024–2029 (USD BILLION)
    7.9 SMART GOVERNMENT 
           7.9.1 SMART GOVERNMENTS TO SPUR ADOPTION OF SMART TECHNOLOGIES BY ALLOCATING FUNDS AND OFFERING FINANCIAL INCENTIVES
                    TABLE 61 SMART GOVERNMENT: SMART INFRASTRUCTURE MARKET, BY REGION,  2019–2023 (USD BILLION)
                    TABLE 62 SMART GOVERNMENT: SMART INFRASTRUCTURE MARKET, BY REGION,  2024–2029 (USD BILLION)
    7.10 OTHER FOCUS AREAS 
           TABLE 63 OTHER FOCUS AREAS: SMART INFRASTRUCTURE MARKET, BY REGION,  2019–2023 (USD BILLION)
           TABLE 64 OTHER FOCUS AREAS: SMART INFRASTRUCTURE MARKET, BY REGION,  2024–2029 (USD BILLION)
 
8 SMART INFRASTRUCTURE MARKET, BY END USER (Page No. - 122)
    8.1 INTRODUCTION 
           FIGURE 27 INDUSTRIAL SEGMENT TO GROW AT HIGHEST CAGR DURING FORECAST PERIOD
           TABLE 65 SMART INFRASTRUCTURE MARKET, BY END USER, 2019–2023 (USD BILLION)
           TABLE 66 SMART INFRASTRUCTURE MARKET, BY END USER, 2024–2029 (USD BILLION)
           8.1.1 END USERS: SMART INFRASTRUCTURE MARKET DRIVERS
    8.2 COMMERCIAL 
           8.2.1 NEED TO ENHANCE OPERATIONAL EFFICIENCY, IMPROVE CUSTOMER EXPERIENCE, AND DRIVE SUSTAINABILITY TO PROPEL MARKET
                    TABLE 67 COMMERCIAL: SMART INFRASTRUCTURE MARKET, BY REGION,  2019–2023 (USD BILLION)
                    TABLE 68 COMMERCIAL: SMART INFRASTRUCTURE MARKET, BY REGION,  2024–2029 (USD BILLION)
    8.3 RESIDENTIAL 
           8.3.1 SMART INFRASTRUCTURE IN RESIDENTIAL INDUSTRY TO ENHANCE QUALITY OF LIFE AND FOCUS ON AUTOMATION, CONNECTIVITY, AND ENERGY EFFICIENCY
                    TABLE 69 RESIDENTIAL: SMART INFRASTRUCTURE MARKET, BY REGION,  2019–2023 (USD BILLION)
                    TABLE 70 RESIDENTIAL: SMART INFRASTRUCTURE MARKET, BY REGION,  2024–2029 (USD BILLION)
    8.4 INDUSTRIAL 
           8.4.1 SMART INFRASTRUCTURE TO ENHANCE EFFICIENCY, SAFETY, AND SUSTAINABILITY IN INDUSTRIAL OPERATIONS
                    TABLE 71 INDUSTRIAL: SMART INFRASTRUCTURE MARKET, BY REGION, 2019–2023 (USD BILLION)
                    TABLE 72 INDUSTRIAL: SMART INFRASTRUCTURE MARKET, BY REGION, 2024–2029 (USD BILLION)
    8.5 GOVERNMENT & DEFENSE 
           8.5.1 GROWTH IN DIGITALIZATION, INCREASING CONNECTIVITY, AND INNOVATION TO BOOST DEMAND FOR SMART INFRASTRUCTURE IN GOVERNMENT & DEFENSE SECTORS
                    TABLE 73 GOVERNMENT & DEFENSE: SMART INFRASTRUCTURE MARKET, BY REGION,  2019–2023 (USD BILLION)
                    TABLE 74 GOVERNMENT & DEFENSE: SMART INFRASTRUCTURE MARKET, BY REGION,  2024–2029 (USD BILLION)
 
9 SMART INFRASTRUCTURE MARKET, BY REGION (Page No. - 129)
    9.1 INTRODUCTION 
           FIGURE 28 SMART INFRASTRUCTURE MARKET: REGIONAL SNAPSHOT, 2024
           FIGURE 29 ASIA PACIFIC TO ACCOUNT FOR HIGHEST CAGR DURING FORECAST PERIOD
           TABLE 75 SMART INFRASTRUCTURE MARKET, BY REGION, 2019–2023 (USD BILLION)
           TABLE 76 SMART INFRASTRUCTURE MARKET, BY REGION, 2024–2029 (USD BILLION)
    9.2 NORTH AMERICA 
           FIGURE 30 NORTH AMERICA: MARKET SNAPSHOT
           9.2.1 NORTH AMERICA: SMART INFRASTRUCTURE MARKET DRIVERS
           9.2.2 NORTH AMERICA: RECESSION IMPACT
                    TABLE 77 NORTH AMERICA: SMART INFRASTRUCTURE MARKET, BY OFFERING,  2019–2023 (USD BILLION)
                    TABLE 78 NORTH AMERICA: SMART INFRASTRUCTURE MARKET, BY OFFERING,  2024–2029 (USD BILLION)
                    TABLE 79 NORTH AMERICA: SMART INFRASTRUCTURE MARKET, BY SERVICE,  2019–2023 (USD BILLION)
                    TABLE 80 NORTH AMERICA: SMART INFRASTRUCTURE MARKET, BY SERVICE,  2024–2029 (USD BILLION)
                    TABLE 81 NORTH AMERICA: SMART INFRASTRUCTURE MARKET, BY PROFESSIONAL SERVICE, 2019–2023 (USD BILLION)
                    TABLE 82 NORTH AMERICA: SMART INFRASTRUCTURE MARKET, BY PROFESSIONAL SERVICE, 2024–2029 (USD BILLION)
                    TABLE 83 NORTH AMERICA: SMART INFRASTRUCTURE MARKET, BY FOCUS AREA,  2019–2023 (USD BILLION)
                    TABLE 84 NORTH AMERICA: SMART INFRASTRUCTURE MARKET, BY FOCUS AREA,  2024–2029 (USD BILLION)
                    TABLE 85 NORTH AMERICA: SMART INFRASTRUCTURE MARKET, BY END USER,  2019–2023 (USD BILLION)
                    TABLE 86 NORTH AMERICA: SMART INFRASTRUCTURE MARKET, BY END USER,  2024–2029 (USD BILLION)
                    TABLE 87 NORTH AMERICA: SMART INFRASTRUCTURE MARKET, BY COUNTRY,  2019–2023 (USD BILLION)
                    TABLE 88 NORTH AMERICA: SMART INFRASTRUCTURE MARKET, BY COUNTRY,  2024–2029 (USD BILLION)
           9.2.3 US
                    9.2.3.1 Rapid urbanization, technological advancements, and governmental initiatives to propel market
                               TABLE 89 US: SMART INFRASTRUCTURE MARKET, BY OFFERING, 2019–2023 (USD BILLION)
                               TABLE 90 US: SMART INFRASTRUCTURE MARKET, BY OFFERING, 2024–2029 (USD BILLION)
                               TABLE 91 US: SMART INFRASTRUCTURE MARKET, BY SERVICE, 2019–2023 (USD BILLION)
                               TABLE 92 US: SMART INFRASTRUCTURE MARKET, BY SERVICE, 2024–2029 (USD BILLION)
                               TABLE 93 US: SMART INFRASTRUCTURE MARKET, BY PROFESSIONAL SERVICE,  2019–2023 (USD BILLION)
                               TABLE 94 US: SMART INFRASTRUCTURE MARKET, BY PROFESSIONAL SERVICE,  2024–2029 (USD BILLION)
                               TABLE 95 US: SMART INFRASTRUCTURE MARKET, BY FOCUS AREA, 2019–2023 (USD BILLION)
                               TABLE 96 US: SMART INFRASTRUCTURE MARKET, BY FOCUS AREA, 2024–2029 (USD BILLION)
                               TABLE 97 US: SMART INFRASTRUCTURE MARKET, BY END USER, 2019–2023 (USD BILLION)
                               TABLE 98 US: SMART INFRASTRUCTURE MARKET, BY END USER, 2024–2029 (USD BILLION)
           9.2.4 CANADA
                    9.2.4.1 Increasing investments & partnerships and implementation of IoT technologies to improve and optimize business processes to drive market
                               TABLE 99 CANADA: SMART INFRASTRUCTURE MARKET, BY OFFERING, 2019–2023 (USD BILLION)
                               TABLE 100 CANADA: SMART INFRASTRUCTURE MARKET, BY OFFERING, 2024–2029 (USD BILLION)
                               TABLE 101 CANADA: SMART INFRASTRUCTURE MARKET, BY SERVICE, 2019–2023 (USD BILLION)
                               TABLE 102 CANADA: SMART INFRASTRUCTURE MARKET, BY SERVICE, 2024–2029 (USD BILLION)
                               TABLE 103 CANADA: SMART INFRASTRUCTURE MARKET, BY PROFESSIONAL SERVICE,  2019–2023 (USD BILLION)
                               TABLE 104 CANADA: SMART INFRASTRUCTURE MARKET, BY PROFESSIONAL SERVICE,  2024–2029 (USD BILLION)
                               TABLE 105 CANADA: SMART INFRASTRUCTURE MARKET, BY FOCUS AREA,  2019–2023 (USD BILLION)
                               TABLE 106 CANADA: SMART INFRASTRUCTURE MARKET, BY FOCUS AREA,  2024–2029 (USD BILLION)
                               TABLE 107 CANADA: SMART INFRASTRUCTURE MARKET, BY END USER, 2019–2023 (USD BILLION)
                               TABLE 108 CANADA: SMART INFRASTRUCTURE MARKET, BY END USER, 2024–2029 (USD BILLION)
    9.3 EUROPE 
           9.3.1 EUROPE: SMART INFRASTRUCTURE MARKET DRIVERS
           9.3.2 EUROPE: RECESSION IMPACT
                    TABLE 109 EUROPE: SMART INFRASTRUCTURE MARKET, BY OFFERING, 2019–2023 (USD BILLION)
                    TABLE 110 EUROPE: SMART INFRASTRUCTURE MARKET, BY OFFERING, 2024–2029 (USD BILLION)
                    TABLE 111 EUROPE: SMART INFRASTRUCTURE MARKET, BY SERVICE, 2019–2023 (USD BILLION)
                    TABLE 112 EUROPE: SMART INFRASTRUCTURE MARKET, BY SERVICE, 2024–2029 (USD BILLION)
                    TABLE 113 EUROPE: SMART INFRASTRUCTURE MARKET, BY PROFESSIONAL SERVICE,  2019–2023 (USD BILLION)
                    TABLE 114 EUROPE: SMART INFRASTRUCTURE MARKET, BY PROFESSIONAL SERVICE,  2024–2029 (USD BILLION)
                    TABLE 115 EUROPE: SMART INFRASTRUCTURE MARKET, BY FOCUS AREA,  2019–2023 (USD BILLION)
                    TABLE 116 EUROPE: SMART INFRASTRUCTURE MARKET, BY FOCUS AREA,  2024–2029 (USD BILLION)
                    TABLE 117 EUROPE: SMART INFRASTRUCTURE MARKET, BY END USER, 2019–2023 (USD BILLION)
                    TABLE 118 EUROPE: SMART INFRASTRUCTURE MARKET, BY END USER, 2024–2029 (USD BILLION)
                    TABLE 119 EUROPE: SMART INFRASTRUCTURE MARKET, BY COUNTRY, 2019–2023 (USD BILLION)
                    TABLE 120 EUROPE: SMART INFRASTRUCTURE MARKET, BY COUNTRY, 2024–2029 (USD BILLION)
           9.3.3 UK
                    9.3.3.1 Growing need for smart infrastructure solutions to fuel demand for smart infrastructure solutions
                               TABLE 121 UK: SMART INFRASTRUCTURE MARKET, BY OFFERING, 2019–2023 (USD BILLION)
                               TABLE 122 UK: SMART INFRASTRUCTURE MARKET, BY OFFERING, 2024–2029 (USD BILLION)
                               TABLE 123 UK: SMART INFRASTRUCTURE MARKET, BY SERVICE, 2019–2023 (USD BILLION)
                               TABLE 124 UK: SMART INFRASTRUCTURE MARKET, BY SERVICE, 2024–2029 (USD BILLION)
                               TABLE 125 UK: SMART INFRASTRUCTURE MARKET, BY PROFESSIONAL SERVICE,  2019–2023 (USD BILLION)
                               TABLE 126 UK: SMART INFRASTRUCTURE MARKET, BY PROFESSIONAL SERVICE,  2024–2029 (USD BILLION)
                               TABLE 127 UK: SMART INFRASTRUCTURE MARKET, BY FOCUS AREA, 2019–2023 (USD BILLION)
                               TABLE 128 UK: SMART INFRASTRUCTURE MARKET, BY FOCUS AREA, 2024–2029 (USD BILLION)
                               TABLE 129 UK: SMART INFRASTRUCTURE MARKET, BY END USER, 2019–2023 (USD BILLION)
                               TABLE 130 UK: SMART INFRASTRUCTURE MARKET, BY END USER, 2024–2029 (USD BILLION)
           9.3.4 GERMANY
                    9.3.4.1 Technological advancements, government initiatives, and increasing urbanization to spur market growth
                               TABLE 131 GERMANY: SMART INFRASTRUCTURE MARKET, BY OFFERING, 2019–2023 (USD BILLION)
                               TABLE 132 GERMANY: SMART INFRASTRUCTURE MARKET, BY OFFERING, 2024–2029 (USD BILLION)
                               TABLE 133 GERMANY: SMART INFRASTRUCTURE MARKET, BY SERVICE, 2019–2023 (USD BILLION)
                               TABLE 134 GERMANY: SMART INFRASTRUCTURE MARKET, BY SERVICE, 2024–2029 (USD BILLION)
                               TABLE 135 GERMANY: SMART INFRASTRUCTURE MARKET, BY PROFESSIONAL SERVICE,  2019–2023 (USD BILLION)
                               TABLE 136 GERMANY: SMART INFRASTRUCTURE MARKET, BY PROFESSIONAL SERVICE,  2024–2029 (USD BILLION)
                               TABLE 137 GERMANY: SMART INFRASTRUCTURE MARKET, BY FOCUS AREA,  2019–2023 (USD BILLION)
                               TABLE 138 GERMANY: SMART INFRASTRUCTURE MARKET, BY FOCUS AREA,  2024–2029 (USD BILLION)
                               TABLE 139 GERMANY: SMART INFRASTRUCTURE MARKET, BY END USER, 2019–2023 (USD BILLION)
                               TABLE 140 GERMANY: SMART INFRASTRUCTURE MARKET, BY END USER, 2024–2029 (USD BILLION)
           9.3.5 ITALY
                    9.3.5.1 Increasing digital transformation and focus on 5G & fiber development to accelerate market growth
           9.3.6 FRANCE
                    9.3.6.1 Rising focus on efficiency, sustainability, and quality of life to boost demand for smart infrastructure solutions
           9.3.7 REST OF EUROPE
    9.4 ASIA PACIFIC 
           FIGURE 31 ASIA PACIFIC: MARKET SNAPSHOT
           9.4.1 ASIA PACIFIC: SMART INFRASTRUCTURE MARKET DRIVERS
           9.4.2 ASIA PACIFIC: RECESSION IMPACT
                    TABLE 141 ASIA PACIFIC: SMART INFRASTRUCTURE MARKET, BY OFFERING,  2019–2023 (USD BILLION)
                    TABLE 142 ASIA PACIFIC: SMART INFRASTRUCTURE MARKET, BY OFFERING,  2024–2029 (USD BILLION)
                    TABLE 143 ASIA PACIFIC: SMART INFRASTRUCTURE MARKET, BY SERVICE,  2019–2023 (USD BILLION)
                    TABLE 144 ASIA PACIFIC: SMART INFRASTRUCTURE MARKET, BY SERVICE,  2024–2029 (USD BILLION)
                    TABLE 145 ASIA PACIFIC: SMART INFRASTRUCTURE MARKET, BY PROFESSIONAL SERVICE,  2019–2023 (USD BILLION)
                    TABLE 146 ASIA PACIFIC: SMART INFRASTRUCTURE MARKET, BY PROFESSIONAL SERVICE,  2024–2029 (USD BILLION)
                    TABLE 147 ASIA PACIFIC: SMART INFRASTRUCTURE MARKET, BY FOCUS AREA,  2019–2023 (USD BILLION)
                    TABLE 148 ASIA PACIFIC: SMART INFRASTRUCTURE MARKET, BY FOCUS AREA,  2024–2029 (USD BILLION)
                    TABLE 149 ASIA PACIFIC: SMART INFRASTRUCTURE MARKET, BY END USER,  2019–2023 (USD BILLION)
                    TABLE 150 ASIA PACIFIC: SMART INFRASTRUCTURE MARKET, BY END USER,  2024–2029 (USD BILLION)
                    TABLE 151 ASIA PACIFIC: SMART INFRASTRUCTURE MARKET, BY COUNTRY,  2019–2023 (USD BILLION)
                    TABLE 152 ASIA PACIFIC: SMART INFRASTRUCTURE MARKET, BY COUNTRY,  2024–2029 (USD BILLION)
           9.4.3 CHINA
                    9.4.3.1 Need for integrating advanced technologies with traditional infrastructure domains to foster market growth
                               TABLE 153 CHINA: SMART INFRASTRUCTURE MARKET, BY OFFERING, 2019–2023 (USD BILLION)
                               TABLE 154 CHINA: SMART INFRASTRUCTURE MARKET, BY OFFERING, 2024–2029 (USD BILLION)
                               TABLE 155 CHINA: SMART INFRASTRUCTURE MARKET, BY SERVICE, 2019–2023 (USD BILLION)
                               TABLE 156 CHINA: SMART INFRASTRUCTURE MARKET, BY SERVICE, 2024–2029 (USD BILLION)
                               TABLE 157 CHINA: SMART INFRASTRUCTURE MARKET, BY PROFESSIONAL SERVICE,  2019–2023 (USD BILLION)
                               TABLE 158 CHINA: SMART INFRASTRUCTURE MARKET, BY PROFESSIONAL SERVICE,  2024–2029 (USD BILLION)
                               TABLE 159 CHINA: SMART INFRASTRUCTURE MARKET, BY FOCUS AREA, 2019–2023 (USD BILLION)
                               TABLE 160 CHINA: SMART INFRASTRUCTURE MARKET, BY FOCUS AREA, 2024–2029 (USD BILLION)
                               TABLE 161 CHINA: SMART INFRASTRUCTURE MARKET, BY END USER, 2019–2023 (USD BILLION)
                               TABLE 162 CHINA: SMART INFRASTRUCTURE MARKET, BY END USER, 2024–2029 (USD BILLION)
           9.4.4 JAPAN
                    9.4.4.1 Deployment of 5G technology and increasing demand for seamless connectivity within urban environments to drive market
                               TABLE 163 JAPAN: SMART INFRASTRUCTURE MARKET, BY OFFERING, 2019–2023 (USD BILLION)
                               TABLE 164 JAPAN: SMART INFRASTRUCTURE MARKET, BY OFFERING, 2024–2029 (USD BILLION)
                               TABLE 165 JAPAN: SMART INFRASTRUCTURE MARKET, BY SERVICE, 2019–2023 (USD BILLION)
                               TABLE 166 JAPAN: SMART INFRASTRUCTURE MARKET, BY SERVICE, 2024–2029 (USD BILLION)
                               TABLE 167 JAPAN: SMART INFRASTRUCTURE MARKET, BY PROFESSIONAL SERVICE,  2019–2023 (USD BILLION)
                               TABLE 168 JAPAN: SMART INFRASTRUCTURE MARKET, BY PROFESSIONAL SERVICE,  2024–2029 (USD BILLION)
                               TABLE 169 JAPAN: SMART INFRASTRUCTURE MARKET, BY FOCUS AREA, 2019–2023 (USD BILLION)
                               TABLE 170 JAPAN: SMART INFRASTRUCTURE MARKET, BY FOCUS AREA, 2024–2029 (USD BILLION)
                               TABLE 171 JAPAN: SMART INFRASTRUCTURE MARKET, BY END USER, 2019–2023 (USD BILLION)
                               TABLE 172 JAPAN: SMART INFRASTRUCTURE MARKET, BY END USER, 2024–2029 (USD BILLION)
           9.4.5 INDIA
                    9.4.5.1 Increasing urbanization, government initiatives, and technological advancements to propel market
                               TABLE 173 INDIA: SMART INFRASTRUCTURE MARKET, BY OFFERING, 2019–2023 (USD BILLION)
                               TABLE 174 INDIA: SMART INFRASTRUCTURE MARKET, BY OFFERING, 2024–2029 (USD BILLION)
                               TABLE 175 INDIA: SMART INFRASTRUCTURE MARKET, BY SERVICE, 2019–2023 (USD BILLION)
                               TABLE 176 INDIA: SMART INFRASTRUCTURE MARKET, BY SERVICE, 2024–2029 (USD BILLION)
                               TABLE 177 INDIA: SMART INFRASTRUCTURE MARKET, BY PROFESSIONAL SERVICE,  2019–2023 (USD BILLION)
                               TABLE 178 INDIA: SMART INFRASTRUCTURE MARKET, BY PROFESSIONAL SERVICE,  2024–2029 (USD BILLION)
                               TABLE 179 INDIA: SMART INFRASTRUCTURE MARKET, BY FOCUS AREA, 2019–2023 (USD BILLION)
                               TABLE 180 INDIA: SMART INFRASTRUCTURE MARKET, BY FOCUS AREA, 2024–2029 (USD BILLION)
                               TABLE 181 INDIA: SMART INFRASTRUCTURE MARKET, BY END USER, 2019–2023 (USD BILLION)
                               TABLE 182 INDIA: SMART INFRASTRUCTURE MARKET, BY END USER, 2024–2029 (USD BILLION)
           9.4.6 REST OF ASIA PACIFIC
    9.5 MIDDLE EAST & AFRICA 
           9.5.1 MIDDLE EAST & AFRICA: SMART INFRASTRUCTURE MARKET DRIVERS
           9.5.2 MIDDLE EAST & AFRICA: RECESSION IMPACT
                    TABLE 183 MIDDLE EAST & AFRICA: SMART INFRASTRUCTURE MARKET, BY OFFERING,  2019–2023 (USD BILLION)
                    TABLE 184 MIDDLE EAST & AFRICA: SMART INFRASTRUCTURE MARKET, BY OFFERING,  2024–2029 (USD BILLION)
                    TABLE 185 MIDDLE EAST & AFRICA: SMART INFRASTRUCTURE MARKET, BY SERVICE,  2019–2023 (USD BILLION)
                    TABLE 186 MIDDLE EAST & AFRICA: SMART INFRASTRUCTURE MARKET, BY SERVICE,  2024–2029 (USD BILLION)
                    TABLE 187 MIDDLE EAST & AFRICA: SMART INFRASTRUCTURE MARKET, BY PROFESSIONAL SERVICE, 2019–2023 (USD BILLION)
                    TABLE 188 MIDDLE EAST & AFRICA: SMART INFRASTRUCTURE MARKET, BY PROFESSIONAL SERVICE, 2024–2029 (USD BILLION)
                    TABLE 189 MIDDLE EAST & AFRICA: SMART INFRASTRUCTURE MARKET, BY FOCUS AREA,  2019–2023 (USD BILLION)
                    TABLE 190 MIDDLE EAST & AFRICA: SMART INFRASTRUCTURE MARKET, BY FOCUS AREA,  2024–2029 (USD BILLION)
                    TABLE 191 MIDDLE EAST & AFRICA: SMART INFRASTRUCTURE MARKET, BY END USER,  2019–2023 (USD BILLION)
                    TABLE 192 MIDDLE EAST & AFRICA: SMART INFRASTRUCTURE MARKET, BY END USER,  2024–2029 (USD BILLION)
                    TABLE 193 MIDDLE EAST & AFRICA: SMART INFRASTRUCTURE MARKET, BY SUBREGION,  2019–2023 (USD BILLION)
                    TABLE 194 MIDDLE EAST & AFRICA: SMART INFRASTRUCTURE MARKET, BY SUBREGION,  2024–2029 (USD BILLION)
           9.5.3 GCC COUNTRIES
                    TABLE 195 GCC COUNTRIES: SMART INFRASTRUCTURE MARKET, BY OFFERING,  2019–2023 (USD BILLION)
                    TABLE 196 GCC COUNTRIES: SMART INFRASTRUCTURE MARKET, BY OFFERING,  2024–2029 (USD BILLION)
                    TABLE 197 GCC COUNTRIES: SMART INFRASTRUCTURE MARKET, BY SERVICE,  2019–2023 (USD BILLION)
                    TABLE 198 GCC COUNTRIES: SMART INFRASTRUCTURE MARKET, BY SERVICE,  2024–2029 (USD BILLION)
                    TABLE 199 GCC COUNTRIES: SMART INFRASTRUCTURE MARKET, BY PROFESSIONAL SERVICE, 2019–2023 (USD BILLION)
                    TABLE 200 GCC COUNTRIES: SMART INFRASTRUCTURE MARKET, BY PROFESSIONAL SERVICE, 2024–2029 (USD BILLION)
                    TABLE 201 GCC COUNTRIES: SMART INFRASTRUCTURE MARKET, BY FOCUS AREA,  2019–2023 (USD BILLION)
                    TABLE 202 GCC COUNTRIES: SMART INFRASTRUCTURE MARKET, BY FOCUS AREA,  2024–2029 (USD BILLION)
                    TABLE 203 GCC COUNTRIES: SMART INFRASTRUCTURE MARKET, BY END USER,  2019–2023 (USD BILLION)
                    TABLE 204 GCC COUNTRIES: SMART INFRASTRUCTURE MARKET, BY END USER,  2024–2029 (USD BILLION)
                    TABLE 205 GCC COUNTRIES: SMART INFRASTRUCTURE MARKET, BY COUNTRY/SUBREGION,  2019–2023 (USD BILLION)
                    TABLE 206 GCC COUNTRIES: SMART INFRASTRUCTURE MARKET, BY COUNTRY/SUBREGION,  2024–2029 (USD BILLION)
                    9.5.3.1 UAE
                               9.5.3.1.1 Focus on digital transformations and rapid expansion of commercial and residential developments to boost market growth
                               TABLE 207 UAE: SMART INFRASTRUCTURE MARKET, BY OFFERING, 2019–2023 (USD BILLION)
                               TABLE 208 UAE: SMART INFRASTRUCTURE MARKET, BY OFFERING, 2024–2029 (USD BILLION)
                               TABLE 209 UAE: SMART INFRASTRUCTURE MARKET, BY SERVICE, 2019–2023 (USD BILLION)
                               TABLE 210 UAE: SMART INFRASTRUCTURE MARKET, BY SERVICE, 2024–2029 (USD BILLION)
                               TABLE 211 UAE: SMART INFRASTRUCTURE MARKET, BY PROFESSIONAL SERVICE,  2019–2023 (USD BILLION)
                               TABLE 212 UAE: SMART INFRASTRUCTURE MARKET, BY PROFESSIONAL SERVICE,  2024–2029 (USD BILLION)
                               TABLE 213 UAE: SMART INFRASTRUCTURE MARKET, BY FOCUS AREA, 2019–2023 (USD BILLION)
                               TABLE 214 UAE: SMART INFRASTRUCTURE MARKET, BY FOCUS AREA, 2024–2029 (USD BILLION)
                               TABLE 215 UAE: SMART INFRASTRUCTURE MARKET, BY END USER, 2019–2023 (USD BILLION)
                               TABLE 216 UAE: SMART INFRASTRUCTURE MARKET, BY END USER, 2024–2029 (USD BILLION)
                    9.5.3.2 KSA
                               9.5.3.2.1 Saudi Vision 2030 initiative and focus on expanding telecommunication systems to spur market growth
                               TABLE 217 KSA: SMART INFRASTRUCTURE MARKET, BY OFFERING, 2019–2023 (USD BILLION)
                               TABLE 218 KSA: SMART INFRASTRUCTURE MARKET, BY OFFERING, 2024–2029 (USD BILLION)
                               TABLE 219 KSA: SMART INFRASTRUCTURE MARKET, BY SERVICE, 2019–2023 (USD BILLION)
                               TABLE 220 KSA: SMART INFRASTRUCTURE MARKET, BY SERVICE, 2024–2029 (USD BILLION)
                               TABLE 221 KSA: SMART INFRASTRUCTURE MARKET, BY PROFESSIONAL SERVICE,  2019–2023 (USD BILLION)
                               TABLE 222 KSA: SMART INFRASTRUCTURE MARKET, BY PROFESSIONAL SERVICE,  2024–2029 (USD BILLION)
                               TABLE 223 KSA: SMART INFRASTRUCTURE MARKET, BY FOCUS AREA, 2019–2023 (USD BILLION)
                               TABLE 224 KSA: SMART INFRASTRUCTURE MARKET, BY FOCUS AREA, 2024–2029 (USD BILLION)
                               TABLE 225 KSA: SMART INFRASTRUCTURE MARKET, BY END USER, 2019–2023 (USD BILLION)
                               TABLE 226 KSA: SMART INFRASTRUCTURE MARKET, BY END USER, 2024–2029 (USD BILLION)
                    9.5.3.3 Rest of GCC Countries
           9.5.4 SOUTH AFRICA
                    9.5.4.1 Need for urban sustainability, smart transportation, and free WiFi to fuel adoption of smart infrastructure solutions
           9.5.5 REST OF MIDDLE EAST & AFRICA
    9.6 LATIN AMERICA 
           9.6.1 LATIN AMERICA: SMART INFRASTRUCTURE MARKET DRIVERS
           9.6.2 LATIN AMERICA: RECESSION IMPACT
                    TABLE 227 LATIN AMERICA: SMART INFRASTRUCTURE MARKET, BY OFFERING,  2019–2023 (USD BILLION)
                    TABLE 228 LATIN AMERICA: SMART INFRASTRUCTURE MARKET, BY OFFERING,  2024–2029 (USD BILLION)
                    TABLE 229 LATIN AMERICA: SMART INFRASTRUCTURE MARKET, BY SERVICE,  2019–2023 (USD BILLION)
                    TABLE 230 LATIN AMERICA: SMART INFRASTRUCTURE MARKET, BY SERVICE,  2024–2029 (USD BILLION)
                    TABLE 231 LATIN AMERICA: SMART INFRASTRUCTURE MARKET, BY PROFESSIONAL SERVICE,  2019–2023 (USD BILLION)
                    TABLE 232 LATIN AMERICA: SMART INFRASTRUCTURE MARKET, BY PROFESSIONAL SERVICE,  2024–2029 (USD BILLION)
                    TABLE 233 LATIN AMERICA: SMART INFRASTRUCTURE MARKET, BY FOCUS AREA,  2019–2023 (USD BILLION)
                    TABLE 234 LATIN AMERICA: SMART INFRASTRUCTURE MARKET, BY FOCUS AREA,  2024–2029 (USD BILLION)
                    TABLE 235 LATIN AMERICA: SMART INFRASTRUCTURE MARKET, BY END USER,  2019–2023 (USD BILLION)
                    TABLE 236 LATIN AMERICA: SMART INFRASTRUCTURE MARKET, BY END USER,  2024–2029 (USD BILLION)
                    TABLE 237 LATIN AMERICA: SMART INFRASTRUCTURE MARKET, BY COUNTRY,  2019–2023 (USD BILLION)
                    TABLE 238 LATIN AMERICA: SMART INFRASTRUCTURE MARKET, BY COUNTRY,  2024–2029 (USD BILLION)
           9.6.3 BRAZIL
                    9.6.3.1 Convergence of urbanization, technological innovation, and rising investments by multinational companies to drive market
                               TABLE 239 BRAZIL: SMART INFRASTRUCTURE MARKET, BY OFFERING, 2019–2023 (USD BILLION)
                               TABLE 240 BRAZIL: SMART INFRASTRUCTURE MARKET, BY OFFERING, 2024–2029 (USD BILLION)
                               TABLE 241 BRAZIL: SMART INFRASTRUCTURE MARKET, BY SERVICE, 2019–2023 (USD BILLION)
                               TABLE 242 BRAZIL: SMART INFRASTRUCTURE MARKET, BY SERVICE, 2024–2029 (USD BILLION)
                               TABLE 243 BRAZIL: SMART INFRASTRUCTURE MARKET, BY PROFESSIONAL SERVICE,  2019–2023 (USD BILLION)
                               TABLE 244 BRAZIL: SMART INFRASTRUCTURE MARKET, BY PROFESSIONAL SERVICE,  2024–2029 (USD BILLION)
                               TABLE 245 BRAZIL: SMART INFRASTRUCTURE MARKET, BY FOCUS AREA, 2019–2023 (USD BILLION)
                               TABLE 246 BRAZIL: SMART INFRASTRUCTURE MARKET, BY FOCUS AREA, 2024–2029 (USD BILLION)
                               TABLE 247 BRAZIL: SMART INFRASTRUCTURE MARKET, BY END USER, 2019–2023 (USD BILLION)
                               TABLE 248 BRAZIL: SMART INFRASTRUCTURE MARKET, BY END USER, 2024–2029 (USD BILLION)
           9.6.4 MEXICO
                    9.6.4.1 Rising government initiatives and partnerships by large enterprises for better infrastructure to trigger market growth
           9.6.5 REST OF LATIN AMERICA
 
10 COMPETITIVE LANDSCAPE (Page No. - 192)
     10.1 OVERVIEW 
     10.2 KEY PLAYER STRATEGIES/RIGHT TO WIN 
             10.2.1 OVERVIEW OF STRATEGIES DEPLOYED BY KEY SMART INFRASTRUCTURE VENDORS
     10.3 REVENUE ANALYSIS 
               FIGURE 32 TOP FIVE PLAYERS DOMINATING IN LAST FIVE YEARS
     10.4 MARKET SHARE ANALYSIS 
               FIGURE 33 SHARE OF LEADING COMPANIES IN SMART INFRASTRUCTURE MARKET, 2023
               TABLE 249 SMART INFRASTRUCTURE MARKET: DEGREE OF COMPETITION
             10.4.1 MARKET RANKING ANALYSIS
                       FIGURE 34 MARKET RANKING ANALYSIS OF TOP FIVE PLAYERS
     10.5 COMPANY EVALUATION MATRIX: KEY PLAYERS, 2023 
             10.5.1 STARS
             10.5.2 EMERGING LEADERS
             10.5.3 PERVASIVE PLAYERS
             10.5.4 PARTICIPANTS
                       FIGURE 35 SMART INFRASTRUCTURE MARKET: COMPANY EVALUATION MATRIX (KEY PLAYERS), 2023
             10.5.5 COMPANY FOOTPRINT: KEY PLAYERS, 2023
                       10.5.5.1 Company footprint
                                   TABLE 250 COMPANY FOOTPRINT
                       10.5.5.2 Regional footprint
                                   TABLE 251 REGIONAL FOOTPRINT
                       10.5.5.3 Offering footprint
                                   TABLE 252 OFFERING FOOTPRINT
                       10.5.5.4 End-user footprint
                                   TABLE 253 END-USER FOOTPRINT
     10.6 COMPANY EVALUATION MATRIX: START-UPS/SMES, 2023 
             10.6.1 PROGRESSIVE COMPANIES
             10.6.2 RESPONSIVE COMPANIES
             10.6.3 DYNAMIC COMPANIES
             10.6.4 STARTING BLOCKS
                       FIGURE 36 SMART INFRASTRUCTURE MARKET: COMPANY EVALUATION MATRIX (START-UPS/SMES), 2023
             10.6.5 COMPETITIVE BENCHMARKING, 2023
                       10.6.5.1 Detailed list of key start-ups/SMEs
                                   TABLE 254 DETAILED LIST OF KEY START-UPS/SMES
                       10.6.5.2 Competitive benchmarking of key start-ups/SMEs
     10.7 COMPETITIVE SCENARIO AND TRENDS 
             10.7.1 PRODUCT LAUNCHES AND ENHANCEMENTS
                       TABLE 255 SMART INFRASTRUCTURE MARKET: PRODUCT LAUNCHES AND ENHANCEMENTS, JANUARY 2020–APRIL 2024
             10.7.2 DEALS
                       TABLE 256 SMART INFRASTRUCTURE MARKET: DEALS, FEBRUARY 2021–MAY 2024
     10.8 BRAND/PRODUCT COMPARISON 
               FIGURE 37 BRAND/PRODUCT COMPARISON
     10.9 COMPANY VALUATION AND FINANCIAL METRICS 
               FIGURE 38 COMPANY VALUATION
               FIGURE 39 EBITDA OF KEY SMART INFRASTRUCTURE VENDORS
 
11 COMPANY PROFILES (Page No. - 211)
     11.1 MAJOR PLAYERS 
(Business overview, Products/Solutions/Services offered, Recent developments, MnM view, Right to win, Strategic choices made, and Weaknesses and Competitive threats)*
             11.1.1 SIEMENS
                       TABLE 257 SIEMENS: BUSINESS OVERVIEW
                       FIGURE 40 SIEMENS: COMPANY SNAPSHOT
                       TABLE 258 SIEMENS: PRODUCTS/SOLUTIONS/SERVICES OFFERED
                       TABLE 259 SIEMENS: PRODUCT LAUNCHES AND ENHANCEMENTS
                       TABLE 260 SIEMENS: DEALS
             11.1.2 CISCO
                       TABLE 261 CISCO: BUSINESS OVERVIEW
                       FIGURE 41 CISCO: COMPANY SNAPSHOT
                       TABLE 262 CISCO: PRODUCTS/SOLUTIONS/SERVICES OFFERED
                       TABLE 263 CISCO: PRODUCT ENHANCEMENTS
                       TABLE 264 CISCO: DEALS
             11.1.3 HITACHI
                       TABLE 265 HITACHI: BUSINESS OVERVIEW
                       FIGURE 42 HITACHI: COMPANY SNAPSHOT
                       TABLE 266 HITACHI: PRODUCTS/SOLUTIONS/SERVICES OFFERED
                       TABLE 267 HITACHI: PRODUCT ENHANCEMENTS
                       TABLE 268 HITACHI: DEALS
                       TABLE 269 HITACHI: OTHER DEALS/DEVELOPMENTS
             11.1.4 IBM
                       TABLE 270 IBM: BUSINESS OVERVIEW
                       FIGURE 43 IBM: COMPANY SNAPSHOT
                       TABLE 271 IBM: PRODUCTS/SOLUTIONS/SERVICES OFFERED
                       TABLE 272 IBM: PRODUCT ENHANCEMENTS
                       TABLE 273 IBM: DEALS
             11.1.5 MICROSOFT
                       TABLE 274 MICROSOFT: BUSINESS OVERVIEW
                       FIGURE 44 MICROSOFT: COMPANY SNAPSHOT
                       TABLE 275 MICROSOFT: PRODUCTS/SOLUTIONS/SERVICES OFFERED
                       TABLE 276 MICROSOFT: DEALS
                       TABLE 277 MICROSOFT: EXPANSIONS
             11.1.6 SCHNEIDER ELECTRIC
                       TABLE 278 SCHNEIDER ELECTRIC: BUSINESS OVERVIEW
                       FIGURE 45 SCHNEIDER ELECTRIC: COMPANY SNAPSHOT
                       TABLE 279 SCHNEIDER ELECTRIC: PRODUCTS/SOLUTIONS/SERVICES OFFERED
                       TABLE 280 SCHNEIDER ELECTRIC: PRODUCT ENHANCEMENTS
                       TABLE 281 SCHNEIDER ELECTRIC: DEALS
                       TABLE 282 SCHNEIDER ELECTRIC: EXPANSIONS
             11.1.7 HUAWEI
                       TABLE 283 HUAWEI: BUSINESS OVERVIEW
                       FIGURE 46 HUAWEI: COMPANY SNAPSHOT
                       TABLE 284 HUAWEI: PRODUCTS/SOLUTIONS/SERVICES OFFERED
                       TABLE 285 HUAWEI: PRODUCT ENHANCEMENTS
                       TABLE 286 HUAWEI: DEALS
             11.1.8 ABB
                       TABLE 287 ABB: BUSINESS OVERVIEW
                       FIGURE 47 ABB: COMPANY SNAPSHOT
                       TABLE 288 ABB: PRODUCTS/SOLUTIONS/SERVICES OFFERED
                       TABLE 289 ABB: PRODUCT ENHANCEMENTS
                       TABLE 290 ABB: DEALS
                       TABLE 291 ABB: OTHER DEALS/DEVELOPMENTS
             11.1.9 JOHNSON CONTROLS
                       TABLE 292 JOHNSON CONTROLS: BUSINESS OVERVIEW
                       FIGURE 48 JOHNSON CONTROLS: COMPANY SNAPSHOT
                       TABLE 293 JOHNSON CONTROLS: PRODUCTS/SOLUTIONS/SERVICES OFFERED
                       TABLE 294 JOHNSON CONTROLS: PRODUCT ENHANCEMENTS
                       TABLE 295 JOHNSON CONTROLS: DEALS
               11.1.10 HONEYWELL
                                   TABLE 296 HONEYWELL: BUSINESS OVERVIEW
                                   FIGURE 49 HONEYWELL: COMPANY SNAPSHOT
                                   TABLE 297 HONEYWELL: PRODUCTS/SOLUTIONS/SERVICES OFFERED
                                   TABLE 298 HONEYWELL: PRODUCT ENHANCEMENTS
                                   TABLE 299 HONEYWELL: DEALS
     11.2 OTHER PLAYERS 
             11.2.1 INTEL
             11.2.2 ORACLE
             11.2.3 TCS
             11.2.4 FUJITSU
             11.2.5 ITRON
             11.2.6 ACCENTURE
     11.3 SMES/START-UPS 
             11.3.1 SENSE
             11.3.2 APPYWAY
             11.3.3 TELENSA
             11.3.4 GAIA
             11.3.5 PANAMAX INFOTECH
             11.3.6 ENVELIO
             11.3.7 XENIUS
             11.3.8 ANAVISION
             11.3.9 ENEVO
             11.3.10 CUBIC TELECOM
*Details on Business overview, Products/Solutions/Services offered, Recent developments, MnM view, Right to win, Strategic choices made, and Weaknesses and Competitive threats might not be captured in case of unlisted companies.
 
12 ADJACENT/RELATED MARKETS (Page No. - 267)
     12.1 INTRODUCTION 
               TABLE 300 ADJACENT MARKETS AND FORECASTS
     12.2 LIMITATIONS 
     12.3 SMART CITIES MARKET 
             12.3.1 MARKET DEFINITION
                       TABLE 301 SMART CITIES MARKET, BY FOCUS AREA, 2017–2022 (USD BILLION)
                       TABLE 302 SMART CITIES MARKET, BY FOCUS AREA, 2023–2028 (USD BILLION)
                       TABLE 303 SMART TRANSPORTATION MARKET, BY REGION, 2017–2022 (USD BILLION)
                       TABLE 304 SMART TRANSPORTATION MARKET, BY REGION, 2023–2028 (USD BILLION)
                       TABLE 305 SMART BUILDINGS MARKET, BY REGION, 2017–2022 (USD BILLION)
                       TABLE 306 SMART BUILDINGS MARKET, BY REGION, 2023–2028 (USD BILLION)
                       TABLE 307 SMART UTILITIES MARKET, BY REGION, 2017–2022 (USD BILLION)
                       TABLE 308 SMART UTILITIES MARKET, BY REGION, 2023–2028 (USD BILLION)
                       TABLE 309 SMART CITIZEN SERVICES MARKET, BY TYPE, 2017–2022 (USD BILLION)
                       TABLE 310 SMART CITIZEN SERVICES MARKET, BY TYPE, 2023–2028 (USD BILLION)
                       TABLE 311 SMART CITIES MARKET, BY REGION, 2017–2022 (USD BILLION)
                       TABLE 312 SMART CITIES MARKET, BY REGION, 2023–2028 (USD BILLION)
     12.4 SMART TRANSPORTATION MARKET 
             12.4.1 MARKET DEFINITION
                       TABLE 313 SMART TRANSPORTATION MARKET, BY TRANSPORTATION MODE,  2018–2022 (USD MILLION)
                       TABLE 314 SMART TRANSPORTATION MARKET, BY TRANSPORTATION MODE,  2023–2028 (USD MILLION)
                       TABLE 315 SMART TRANSPORTATION MARKET, BY TYPE, 2018–2022 (USD MILLION)
                       TABLE 316 SMART TRANSPORTATION MARKET, BY TYPE, 2023–2028 (USD MILLION)
                       TABLE 317 ROADWAY: SMART TRANSPORTATION MARKET, BY TYPE, 2018–2022 (USD MILLION)
                       TABLE 318 ROADWAY: SMART TRANSPORTATION MARKET, BY TYPE, 2023–2028 (USD MILLION)
                       TABLE 319 RAILWAY: SMART TRANSPORTATION MARKET, BY TYPE, 2018–2022 (USD MILLION)
                       TABLE 320 RAILWAY: SMART TRANSPORTATION MARKET, BY TYPE, 2023–2028 (USD MILLION)
                       TABLE 321 AIRWAY: SMART TRANSPORTATION MARKET, BY TYPE, 2018–2022 (USD MILLION)
                       TABLE 322 AIRWAY: SMART TRANSPORTATION MARKET, BY TYPE, 2023–2028 (USD MILLION)
                       TABLE 323 MARITIME: SMART TRANSPORTATION MARKET, BY TYPE, 2018–2022 (USD MILLION)
                       TABLE 324 MARITIME: SMART TRANSPORTATION MARKET, BY TYPE, 2023–2028 (USD MILLION)
                       TABLE 325 SMART TRANSPORTATION MARKET, BY REGION, 2018–2022 (USD MILLION)
                       TABLE 326 SMART TRANSPORTATION MARKET, BY REGION, 2023–2028 (USD MILLION)
 
13 APPENDIX (Page No. - 276)
     13.1 DISCUSSION GUIDE 
     13.2 KNOWLEDGESTORE: MARKETSANDMARKETS’ SUBSCRIPTION PORTAL 
     13.3 CUSTOMIZATION OPTIONS 
     13.4 RELATED REPORTS 
     13.5 AUTHOR DETAILS 

The study involved four major activities in estimating the current size of the global smart infrastructure market. Exhaustive secondary research was done to collect information on the market, peer market, and parent market. The next step was to validate these findings, assumptions, and sizing with industry experts across the value chain through primary research. Both top-down and bottom-up approaches were employed to estimate the total smart infrastructure market size. After that, the market breakup and data triangulation techniques were used to estimate the market size of segments and subsegments.

Secondary Research

Various secondary sources, such as Bloomberg and BusinessWeek, were referred to in the secondary research process to identify and collect information for this study. The secondary sources included company annual reports, press releases, and investor presentations; white papers; journals, such as Linux Journal and Container Journal; and articles from recognized authors, directories, and databases.

Primary Research

Various primary sources from supply and demand sides were interviewed to obtain qualitative and quantitative information for this report. The primary sources from the supply side included industry experts, such as Chief Executive Officers (CEOs), Chief Marketing Officers (CMO), Vice Presidents (VPs), Managing Directors (MDs), technology and innovation directors, and related key executives from various key companies and organizations operating in the smart infrastructure market along with the associated service providers, and system integrators operating in the targeted regions. All possible parameters that affect the market covered in this research study have been accounted for, viewed in extensive detail, verified through primary research, and analyzed to get the final quantitative and qualitative data. Following is the breakup of primary respondents.

Smart Infrastructure Market Size, and Share

To know about the assumptions considered for the study, download the pdf brochure

Company Name

Designation

Siemens

Senior Manager

Sense

VP

Hitachi

Business Executive

Market Size Estimation

The top-down and bottom-up approaches were used to make market estimates and forecast the smart infrastructure market and other dependent submarkets. The bottom-up procedure was used to arrive at the overall market size of the global smart infrastructure market using key companies’ revenue and their offerings in the market. The research methodology used to estimate the market size includes the following:

  • The key players in the Smart Infrastructure Market have been identified through extensive secondary research.
  • The market size, in terms of value, has been determined through primary and secondary research processes.
  • All percentage shares, splits, and breakups have been determined using secondary sources and verified through primary sources.

Smart Infrastructure Market Size: Bottom-Up Approach

Smart Infrastructure Market Bottom Up Approach

To know about the assumptions considered for the study, Request for Free Sample Report

Smart infrastructure market Size: Top-Down Approach

Smart Infrastructure Market Top Down Approach

Data Triangulation

This study determined and confirmed the exact value of the overall parent market size through data triangulation and validation through primary interviews. The overall market size was then used in the top-down procedure to estimate the size of other individual markets via percentage splits of the market segmentation.


Market Definition

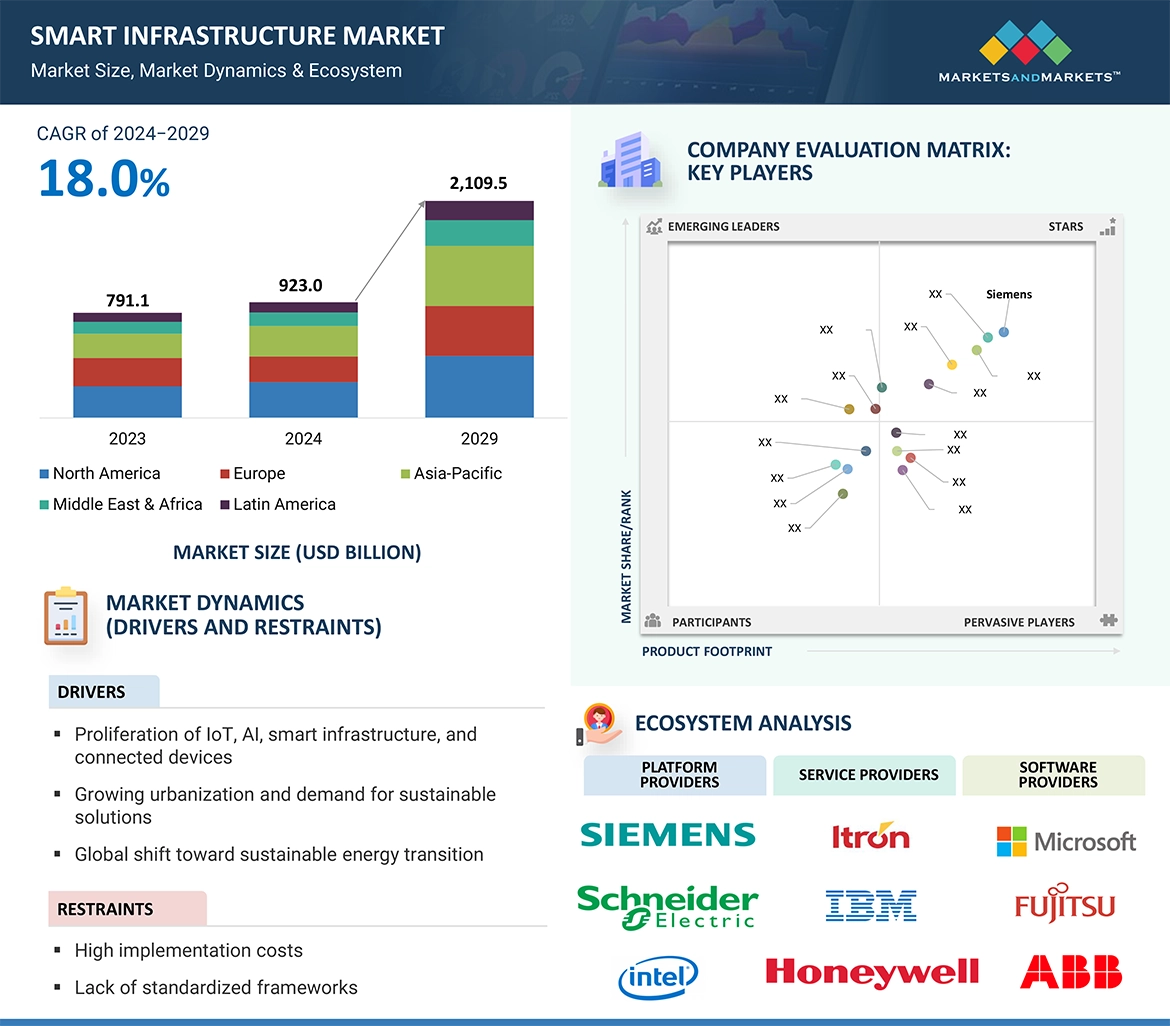
Smart infrastructure encompasses advanced technologies and solutions designed to improve the efficiency, sustainability, and functionality of infrastructure systems. These systems include transportation, buildings, energy, water, waste management, public services, etc. Smart infrastructure integrates various digital technologies, such as IoT (Internet of Things), AI (Artificial Intelligence), big data analytics, and cloud computing, among others, to create interconnected, intelligent systems that enhance the quality of life, economic efficiency, and environmental sustainability.

Key Stakeholders

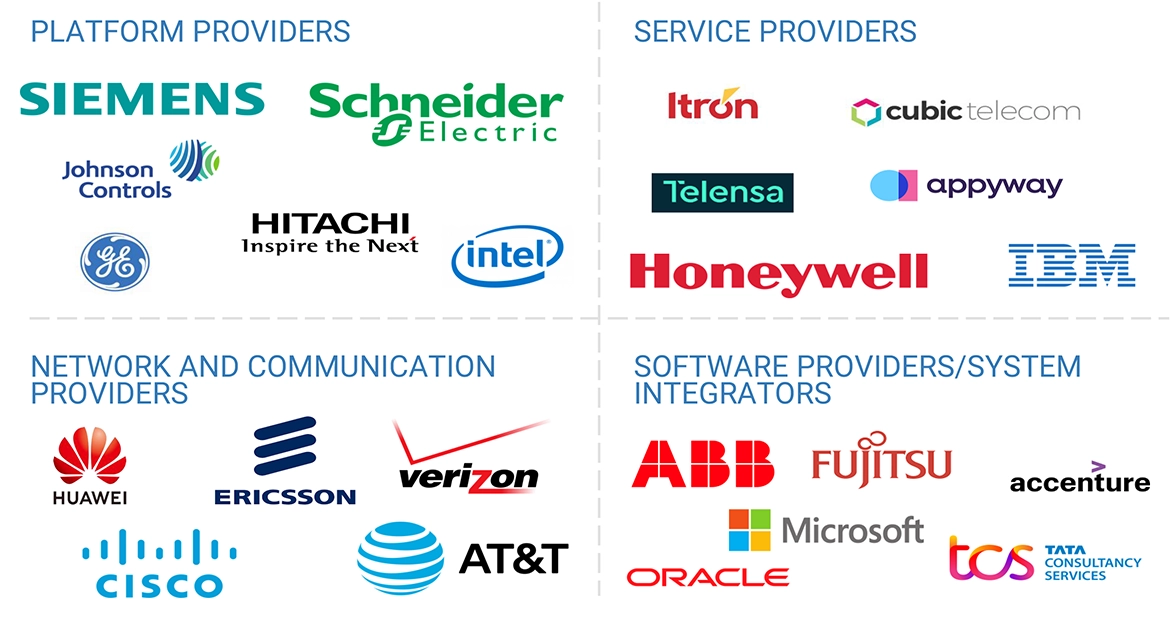
  • Network infrastructure enablers
  • Technology vendors
  • Real-estate Developers
  • Telecom Service Providers (TSPs)
  • Communication Service Providers (CSPs)
  • System Integrators (SIs)
  • Platform Providers
  • Compliance regulatory authorities
  • Government authorities
  • Investment firms
  • Independent Software Vendors (ISVs)
  • Smart Infrastructure Alliances/Groups
  • Utility Companies
  • Transportation Service Providers

Report Objectives

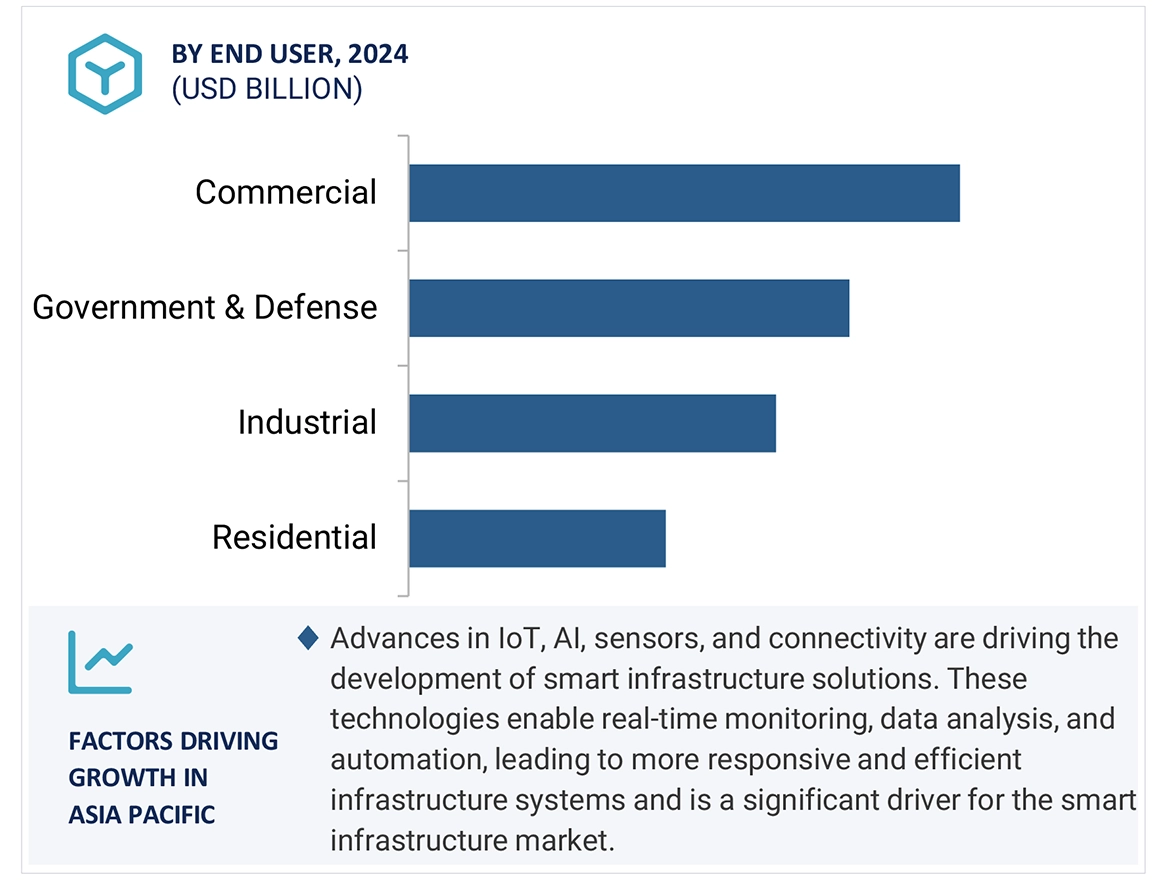
  • To determine, segment, and forecast the global smart infrastructure market based on offering, focus area, end user, and region in terms of value.
  • To forecast the size of the market segments to five main regions: North America, Europe, Asia Pacific, Middle East & Africa, and Latin America.
  • To provide detailed information about the major factors (drivers, opportunities, threats, and challenges) influencing the growth of the smart infrastructure market.
  • To study the complete value chain and related industry segments and perform a value chain analysis of the smart infrastructure market landscape.
  • To strategically analyze the macro and micro markets to individual growth trends, prospects, and contributions to the total smart infrastructure market.
  • To analyze the industry trends, patents, and innovations related to the smart infrastructure market.
  • To analyze the opportunities for stakeholders by identifying the high-growth segments of the smart infrastructure market.
  • To profile the key players in the market and comprehensively analyze their market share/ranking and core competencies.
  • To track and analyze competitive developments, such as mergers & acquisitions, product launches & developments, partnerships, agreements, collaborations, business expansions, and Research & Development (R&D) activities.

Available Customizations

With the given market data, MarketsandMarkets offers customizations as per the company’s specific needs. The following customization options are available for the report:

Company Information

  • Detailed analysis and profiling of an additional two market players
Custom Market Research Services

We will customize the research for you, in case the report listed above does not meet with your exact requirements. Our custom research will comprehensively cover the business information you require to help you arrive at strategic and profitable business decisions.

Request Customization
Report Code
TC 9052
Published ON
Jun, 2024
Choose License Type
BUY NOW
  • SHARE
X
Request Customization
Speak to Analyst
Speak to Analyst
OR FACE-TO-FACE MEETING
PERSONALIZE THIS RESEARCH
  • Triangulate with your Own Data
  • Get Data as per your Format and Definition
  • Gain a Deeper Dive on a Specific Application, Geography, Customer or Competitor
  • Any level of Personalization
REQUEST A FREE CUSTOMIZATION
LET US HELP YOU!
  • What are the Known and Unknown Adjacencies Impacting the Smart Infrastructure Market
  • What will your New Revenue Sources be?
  • Who will be your Top Customer; what will make them switch?
  • Defend your Market Share or Win Competitors
  • Get a Scorecard for Target Partners
CUSTOMIZED WORKSHOP REQUEST
  • Call Us
  • +1-888-600-6441 (Corporate office hours)
  • +1-888-600-6441 (US/Can toll free)
  • +44-800-368-9399 (UK office hours)
CONNECT WITH US
ABOUT TRUST ONLINE
©2024 MarketsandMarkets Research Private Ltd. All rights reserved
DMCA.com Protection Status Website Feedback