2
RESEARCH METHODOLOGY
54
5
MARKET OVERVIEW
Single-use bioprocessing boosts efficiency, cuts costs, and drives sustainable growth in biologics markets.
82
5.2.1.1
GROWING ADOPTION AMONG CDMOS & CMOS
5.2.1.2
INCREASED PRODUCTIVITY AND REDUCED RISK OF CROSS-CONTAMINATION
5.2.1.3
REDUCED CAPITAL INVESTMENT COMPARED TO TRADITIONAL STAINLESS-STEEL SYSTEMS
5.2.1.4
BETTER ENVIRONMENTAL SUSTAINABILITY DUE TO REDUCED WATER AND ENERGY CONSUMPTION
5.2.1.5
GROWING BIOLOGICS & BIOSIMILARS MARKET
5.2.2.1
ISSUES RELATED TO LEACHABLES AND EXTRACTABLES
5.2.2.2
IMPACT OF PFAS RESTRICTIONS ON PRODUCT DEVELOPMENT
5.2.3.1
UNTAPPED MARKET POTENTIAL IN EMERGING ECONOMIES
5.2.3.2
CUSTOMIZATION OPTIONS FOR ENHANCED GROWTH AND INNOVATION
5.2.4.1
LACK OF STANDARDIZATION
5.2.4.2
ENVIRONMENTAL AND LOGISTICAL CHALLENGES IN SINGLE-USE BIOPROCESSING WASTE DISPOSAL
5.2.4.3
POTENTIAL BREAKAGE OF SU BAGS
5.2.4.4
REGULATORY COMPLIANCE ISSUES
6
INDUSTRY TRENDS
Navigate market shifts and leverage technology to outpace competition in bioprocessing.
94
6.1
TRENDS/DISRUPTIONS IMPACTING CUSTOMERS’ BUSINESSES
6.2
PORTER’S FIVE FORCES ANALYSIS
6.2.1
THREAT OF NEW ENTRANTS
6.2.2
THREAT OF SUBSTITUTES
6.2.3
BARGAINING POWER OF BUYERS
6.2.4
BARGAINING POWER OF SUPPLIERS
6.2.5
INTENSITY OF COMPETITIVE RIVALRY
6.3
KEY STAKEHOLDERS & BUYING CRITERIA
6.3.1
KEY STAKEHOLDERS IN BUYING PROCESS
6.3.2
KEY BUYING CRITERIA
6.3.3
ADOPTION BARRIERS & INTERNAL CHALLENGES
6.4.1
INDICATIVE PRICING ANALYSIS OF SINGLE-USE BIOPROCESSING PRODUCTS, BY KEY PLAYER, 2024
6.4.2
INDICATIVE PRICING ANALYSIS OF SINGLE-USE BIOREACTORS, BY REGION, 2024
6.7.2
COMPLEMENTARY TECHNOLOGIES
6.7.2.1
AUTOMATION & CONTROL SYSTEMS
6.7.2.3
CONTINUOUS BIOPROCESSING
6.7.3
ADJACENT TECHNOLOGIES
6.7.3.1
BIOPROCESS MODELING & SIMULATION
6.7.3.2
BIOPROCESS MONITORING & DATA ANALYSIS
6.8.1
TOP APPLICANTS/OWNERS (COMPANIES) FOR SINGLE-USE BIOPROCESSING PATENTS, 2014–2024
6.8.2
INDICATIVE LIST OF PATENTS
6.9
KEY CONFERENCES & EVENTS, 2025–2026
6.10.1
REGULATORY BODIES, GOVERNMENT AGENCIES, AND OTHER ORGANIZATIONS
6.10.2
REGULATORY FRAMEWORK
6.10.3
SUSTAINABILITY INITIATIVES
6.11
INVESTMENT & FUNDING SCENARIO
6.12.1
IMPORT DATA FOR HS CODE 902720 AND 842129, 2020–2024
6.12.2
EXPORT DATA FOR HS CODE 902720 AND 842129, 2020–2024
6.13
SUCCESS STORIES AND REAL-WORLD APPLICATIONS
6.13.1
SARTORIUS: COMMERCIAL BIOMANUFACTURING WITH SINGLE-USE TECHNOLOGIES
6.13.2
REVOLUTIONIZING VACCINES WITH THERMO SCIENTIFIC HYPERFORMA SINGLE-USE FERMENTOR
6.14
TECHNOLOGY/PRODUCT ROADMAP
6.15.1
SINGLE-USE SYSTEMS IN CELL & GENE THERAPY MANUFACTURING
6.15.2
INTEGRATION WITH CONTINUOUS BIOPROCESSING
6.15.3
ADVANCED SINGLE-USE BIOREACTORS FOR PERSONALIZED MEDICINE
6.16.1
STRATEGIC ANALYSIS OF GROWTH OPPORTUNITIES
6.16.2
UNMET NEEDS FROM VARIOUS END-USE INDUSTRIES
6.17
IMPACT OF AI/GENERATIVE AI ON SINGLE-USE BIOPROCESSING MARKET
6.17.1
TOP USE CASES AND MARKET POTENTIAL
6.17.2
CASE STUDIES OF AI IMPLEMENTATION IN SINGLE-USE BIOPROCESSING MARKET
6.17.3
BEST PRACTICES IN SINGLE-USE BIOPROCESSING
6.18
IMPACT OF 2025 US TARIFF ON SINGLE-USE BIOPROCESSING MARKET
6.18.3
PRICE IMPACT ANALYSIS
6.18.4
IMPACT ON COUNTRY/REGION
6.18.5
IMPACT ON END-USE INDUSTRIES
6.18.5.1
PHARMACEUTICAL & BIOTECHNOLOGY COMPANIES
7
SINGLE-USE BIOPROCESSING MARKET, BY PRODUCT
Market Size & Growth Rate Forecast Analysis to 2030 in USD Million | 319 Data Tables
133
7.2.1
SINGLE-USE BIOREACTORS
7.2.1.1
≤10 L BIOREACTORS
7.2.1.2
11–100 L BIOREACTORS
7.2.1.3
101–500 L BIOREACTORS
7.2.1.4
501–1,500 L BIOREACTORS
7.2.1.5
>1,500L BIOREACTORS
7.2.2
SINGLE-USE FILTRATION SYSTEMS
7.2.2.1
MANUFACTURING-SCALE FILTRATION SYSTEMS
7.2.2.2
PILOT-SCALE FILTRATION SYSTEMS
7.2.2.3
R&D-SCALE FILTRATION SYSTEMS
7.2.3
SINGLE-USE MIXING SYSTEMS
7.2.3.1
MANUFACTURING-SCALE MIXING SYSTEMS
7.2.3.2
PILOT-SCALE MIXING SYSTEMS
7.2.3.3
R&D-SCALE MIXING SYSTEMS
7.2.4
SINGLE-USE CHROMATOGRAPHY SYSTEMS
7.2.4.1
REDUCED COST-EFFECTIVENESS AND SLOW ADOPTION IN BIOPHARMACEUTICAL PRODUCTION TO RESTRAIN MARKET GROWTH
7.2.5
OTHER SINGLE-USE EQUIPMENT
7.3.1
SINGLE-USE BAGS & CONTAINERS
7.3.1.1
2D BAGS & CONTAINERS
7.3.1.2
3D BAGS & CONTAINERS
7.3.2.1
SINGLE-USE FILTERS TO BE COST-EFFECTIVE AND HELP IN CONTAMINATION CONTROL AND OPERATIONAL EFFICIENCY
7.3.3
SINGLE-USE ASSEMBLIES
7.3.3.2
FILTRATION ASSEMBLIES
7.3.3.3
BOTTLE ASSEMBLIES
7.3.3.4
MIXING SYSTEM ASSEMBLIES
7.3.4
SINGLE-USE CHROMATOGRAPHY COLUMNS
7.3.4.1
REPRODUCIBILITY, SCALABILITY, SPEED, EASE OF USE, AND OPERATIONAL SAFETY OF CHROMATOGRAPHY COLUMNS TO BOOST DEMAND
7.3.5.4
TEMPERATURE SENSORS
7.3.5.5
CONDUCTIVITY SENSORS
7.3.6
OTHER SINGLE-USE CONSUMABLES
7.3.6.6
OTHER CONSUMABLES
8
SINGLE-USE BIOPROCESSING MARKET, BY APPLICATION
Market Size & Growth Rate Forecast Analysis to 2030 in USD Million | 43 Data Tables
281
8.2.1
FILTRATION TO BE USEFUL IN CLARIFICATION, STERILIZATION, AND VIRUS-REMOVAL OPERATIONS IN BIOPHARMACEUTICAL SECTOR
8.3.1
REDUCED RISK OF CONTAMINATION AND FOCUS ON COST EFFICIENCY TO SUPPORT MARKET GROWTH
8.4.1
COST-EFFICTIVENESS AND ADVANCEMENTS IN SINGLE-USE MIXER DESIGNS TO DRIVE DEMAND FOR DISPOSABLE MIXING SYSTEMS
8.5.1
BENEFITS OF ADVANCED SINGLE-USE PURIFICATION TECHNOLOGIES IN MAB AND CELL & GENE THERAPY TO AID MARKET GROWTH
8.6.1
RISING COMPLEXITY AND VOLUME OF CELL & GENE THERAPIES TO INCREASE DEMAND FOR SINGLE-USE CONTAINERS
9
SINGLE-USE BIOPROCESSING MARKET, BY WORKFLOW
Market Size & Growth Rate Forecast Analysis to 2030 in USD Million | 15 Data Tables
304
9.2
UPSTREAM BIOPROCESSING
9.2.1
REDUCED RISK OF CONTAMINATION AND COST EFFICIENCY TO SUPPORT MARKET GROWTH
9.3
DOWNSTREAM BIOPROCESSING
9.3.1
ADVANCEMENTS IN DISPOSABLE CHROMATOGRAPHY, FILTRATION, AND VIRUS CLEARANCE SYSTEMS TO DRIVE MARKET
10
SINGLE-USE BIOPROCESSING MARKET, BY MOLECULE TYPE
Market Size & Growth Rate Forecast Analysis to 2030 in USD Million | 35 Data Tables
313
10.2
MONOCLONAL ANTIBODIES
10.2.1
EXPANDING THERAPEUTIC LANDSCAPE AND GROWING PIPELINE DIVERSIFICATION TO DRIVE MARKET
10.2.2
SINGLE-USE BIOPROCESSING MARKET FOR MONOCLONAL ANTIBODIES, BY PRODUCT
10.3.1
HIGHER IMMUNIZATION PROGRAMS AND CONTINUED SUCCESS OF MRNA AND VIRAL VECTOR-BASED TECHNOLOGIES TO AID MARKET
10.3.2
SINGLE-USE BIOPROCESSING MARKET FOR VACCINES, BY PRODUCT
10.4
THERAPEUTIC PROTEINS & PEPTIDES
10.4.1
RISING DEMAND FOR COMPLEX BIOLOGICS AND FLEXIBLE MANUFACTURING TO AUGMENT SINGLE-USE ADOPTION
10.4.2
SINGLE-USE BIOPROCESSING MARKET FOR THERAPEUTIC PROTEINS & PEPTIDES, BY PRODUCT
10.5
CELL & GENE THERAPIES
10.5.1
RISING R&D INITIATIVES AND FUNDS FOR CELL & GENE THERAPY DEVELOPMENT TO DRIVE MARKET
10.5.2
SINGLE-USE BIOPROCESSING MARKET FOR CELL & GENE THERAPIES, BY PRODUCT
11
SINGLE-USE BIOPROCESSING MARKET, BY END USER
Market Size & Growth Rate Forecast Analysis to 2030 in USD Million | 22 Data Tables
333
11.2
PHARMACEUTICAL & BIOTECHNOLOGY COMPANIES
11.2.1
INCREASE IN R&D EXPENDITURE AND PIPELINE EXPANSION TO SUSTAIN MARKET GROWTH
11.3.1
RISING OUTSOURCING OF CLINICAL DEVELOPMENT AND GMP MANUFACTURING TO AUGMENT MARKET GROWTH
12
SINGLE-USE BIOPROCESSING MARKET, BY REGION
Comprehensive coverage of 7 Regions with country-level deep-dive of 16 Countries | 209 Data Tables.
346
12.2.1
MACROECONOMIC OUTLOOK FOR NORTH AMERICA
12.2.2.1
US TO DOMINATE NORTH AMERICAN SINGLE-USE BIOPROCESSING MARKET DURING FORECAST PERIOD
12.2.3.1
INCREASING DEMAND FOR BIOPHARMACEUTICALS & BIOLOGICS AND RISING GOVERNMENT INVESTMENTS TO DRIVE MARKET
12.3.1
MACROECONOMIC OUTLOOK FOR EUROPE
12.3.2.1
STRONG BIOPHARMACEUTICAL MANUFACTURING BASE AND ADVANCED R&D INFRASTRUCTURE TO SUPPORT MARKET GROWTH
12.3.3.1
STRONG GOVERNMENT SUPPORT FOR BIOMANUFACTURING INNOVATION AND DYNAMIC BIOTECHNOLOGY ECOSYSTEM TO BOOST MARKET GROWTH
12.3.4.1
HIGH BIOMANUFACTURING INVESTMENTS AND GOVERNMENT-BACKED INNOVATION PROGRAMS TO FUEL MARKET GROWTH
12.3.5.1
INCREASING GOVERNMENT FUNDING FOR BIOPHARMACEUTICAL RESEARCH TO SPUR MARKET GROWTH
12.3.6.1
RISING FOCUS ON DEVELOPING PERSONALIZED MEDICINES TO SUPPORT MARKET GROWTH
12.4.1
MACROECONOMIC OUTLOOK FOR ASIA PACIFIC
12.4.2.1
LOW MANUFACTURING COSTS AND HUGE DEMAND FOR PERSONALIZED MEDICINES TO PROPEL MARKET GROWTH
12.4.3.1
INCREASED FOCUS ON QUALITY MANUFACTURING PRACTICES TO SUPPORT MARKET GROWTH
12.4.4.1
RISING COLLABORATIONS AMONG BIOTECHNOLOGY COMPANIES TO DRIVE MARKET
12.4.5.1
FAVORABLE SCENARIO FOR FOREIGN DIRECT INVESTMENT TO PROPEL MARKET GROWTH
12.4.6.1
INCREASING DEMAND FOR INNOVATIVE RESEARCH SOLUTIONS TO PROPEL MARKET
12.4.7
REST OF ASIA PACIFIC
12.5.1
MACROECONOMIC OUTLOOK FOR LATIN AMERICA
12.5.2.1
INCREASED BIOMANUFACTURING OF BIOLOGICS AND PHARMACEUTICAL R&D TO FOSTER MARKET GROWTH
12.5.3.1
RISING DEMAND FOR CHRONIC DISEASE TREATMENT TO SUPPORT MARKET GROWTH
12.5.4
REST OF LATIN AMERICA
12.6.1
MACROECONOMIC OUTLOOK FOR MIDDLE EAST
12.6.2.1
KINGDOM OF SAUDI ARABIA
12.6.2.3
REST OF GCC COUNTRIES
12.6.3
REST OF MIDDLE EAST
12.7.1
GROWING MARKET FOR PHARMACEUTICALS AND INCREASING DEMAND FOR DRUGS TO PROPEL MARKET
12.7.2
MACROECONOMIC OUTLOOK FOR AFRICA
13
COMPETITIVE LANDSCAPE
Discover strategic maneuvers and market positions of key players in single-use bioprocessing.
450
13.2
KEY PLAYER STRATEGY/RIGHT TO WIN
13.2.1
OVERVIEW OF STRATEGIES ADOPTED BY KEY PLAYERS IN SINGLE-USE BIOPROCESSING MARKET
13.3
REVENUE ANALYSIS, 2020–2024
13.4
MARKET SHARE ANALYSIS, 2024
13.5
COMPANY EVALUATION MATRIX: KEY PLAYERS, 2024
13.5.5
COMPANY FOOTPRINT: KEY PLAYERS, 2024
13.5.5.1
COMPANY FOOTPRINT
13.5.5.2
REGION FOOTPRINT
13.5.5.3
PRODUCT FOOTPRINT
13.5.5.4
APPLICATION FOOTPRINT
13.5.5.5
WORKFLOW FOOTPRINT
13.6
COMPANY EVALUATION MATRIX: STARTUPS/SMES, 2024
13.6.1
PROGRESSIVE COMPANIES
13.6.2
RESPONSIVE COMPANIES
13.6.5
COMPETITIVE BENCHMARKING: STARTUPS/SMES, 2024
13.6.5.1
DETAILED LIST OF KEY STARTUPS/SMES
13.6.5.2
COMPETITIVE BENCHMARKING OF KEY STARTUPS/SMES
13.7
COMPANY VALUATION & FINANCIAL METRICS
13.8
BRAND/PRODUCT COMPARISION
13.9
COMPETITIVE SCENARIO
14
COMPANY PROFILES
In-depth Company Profiles of Leading Market Players with detailed Business Overview, Product and Service Portfolio, Recent Developments, and Unique Analyst Perspective (MnM View)
473
14.2.1.1
BUSINESS OVERVIEW
14.2.1.2
PRODUCTS OFFERED
14.2.1.3
RECENT DEVELOPMENTS
14.2.2
DANAHER CORPORATION
14.2.3
THERMO FISHER SCIENTIFIC INC.
14.2.7
REPLIGEN CORPORATION
14.2.10
PARKER HANNIFIN CORP.
14.2.14
CORNING INCORPORATED
14.3.2
SINGLE USE SUPPORT
14.3.4
BROADLEY-JAMES CORPORATION
14.3.6
SENTINEL PROCESS SYSTEMS INC.
14.3.7
MEISSNER FILTRATION PRODUCTS, INC.
14.3.8
SATAKE MULTIMIX CORPORATION
14.3.10
MEMBRANE SOLUTIONS
14.3.11
ANTYLIA SCIENTIFIC
14.3.13
ESCO LIFESCIENCES GROUP
15.2
KNOWLEDGESTORE: MARKETSANDMARKETS’ SUBSCRIPTION PORTAL
15.3
CUSTOMIZATION OPTIONS
TABLE 1
SINGLE–USE BIOPROCESSING MARKET: INCLUSIONS & EXCLUSIONS
TABLE 2
IMPACT ANALYSIS OF SUPPLY– AND DEMAND–SIDE FACTORS
TABLE 3
SINGLE–USE BIOPROCESSING MARKET: RISK ANALYSIS
TABLE 4
SINGLE-USE BIOPROCESSING MARKET: EMERGING BUSINESS MODELS & TARGET SEGMENTS
TABLE 5
SINGLE-USE BIOPROCESSING MARKET: STRATEGIC ANALYSIS OF GROWTH OPPORTUNITIES
TABLE 6
SINGLE-USE BIOPROCESSING MARKET: IMPACT ANALYSIS
TABLE 7
WATER AND ENERGY CONSUMPTION FOR COMMERCIAL MAB PRODUCTION AT 3 X 2,000 L SCALE
TABLE 8
EXAMPLES OF ORGANIZATIONS INVOLVED IN SU STANDARDS
TABLE 9
COMPARISON OF SINGLE-USE BIOPROCESS SYSTEM DISPOSAL OPTIONS
TABLE 10
SINGLE-USE BIOPROCESSING MARKET: PORTER’S FIVE FORCES
TABLE 11
BUYING CRITERIA FOR SINGLE-USE BIOPROCESSING PRODUCTS, BY END USER
TABLE 12
INDICATIVE PRICING ANALYSIS OF SINGLE-USE BIOPROCESSING PRODUCTS, BY KEY PLAYER, 2024
TABLE 13
INDICATIVE PRICING ANALYSIS OF SINGLE-USE BIOREACTORS, BY REGION, 2024
TABLE 14
SINGLE-USE BIOPROCESSING MARKET: ROLE IN ECOSYSTEM
TABLE 15
SINGLE-USE BIOPROCESSING MARKET: INDICATIVE LIST OF PATENTS, 2024–2025
TABLE 16
SINGLE-USE BIOPROCESSING MARKET: LIST OF CONFERENCES & EVENTS, JANUARY 2025–DECEMBER 2026
TABLE 17
NORTH AMERICA: REGULATORY BODIES, GOVERNMENT AGENCIES, AND OTHER ORGANIZATIONS
TABLE 18
EUROPE: REGULATORY BODIES, GOVERNMENT AGENCIES, AND OTHER ORGANIZATIONS
TABLE 19
ASIA PACIFIC: REGULATORY BODIES, GOVERNMENT AGENCIES, AND OTHER ORGANIZATIONS
TABLE 20
LATIN AMERICA: REGULATORY BODIES, GOVERNMENT AGENCIES, AND OTHER ORGANIZATIONS
TABLE 21
MIDDLE EAST & AFRICA: REGULATORY BODIES, GOVERNMENT AGENCIES, AND OTHER ORGANIZATIONS
TABLE 22
IMPORT VALUE FOR HS CODE 902720, 2020–2024 (USD THOUSAND)
TABLE 23
IMPORT VOLUME FOR HS CODE 902720, 2020–2024 (TONS)
TABLE 24
IMPORT VALUE FOR HS CODE 842129, 2020–2024 (USD THOUSAND)
TABLE 25
IMPORT VOLUME FOR HS CODE 842129, 2020–2024 (TONS)
TABLE 26
EXPORT VALUE FOR HS CODE 902720, 2020–2024 (USD THOUSAND)
TABLE 27
EXPORT VOLUME FOR HS CODE 902720, 2020–2024 (TONS)
TABLE 28
EXPORT VALUE FOR HS CODE 842129, 2020–2024 (USD THOUSAND)
TABLE 29
EXPORT VOLUME FOR HS CODE 842129, 2020–2024 (TONS)
TABLE 30
CASE STUDIES OF AI IMPLEMENTATION IN SINGLE-USE BIOPROCESSING MARKET
TABLE 31
US-ADJUSTED RECIPROCAL TARIFF RATES
TABLE 32
SINGLE-USE BIOPROCESSING MARKET, BY PRODUCT, 2023–2030 (USD MILLION)
TABLE 33
SINGLE-USE BIOPROCESSING EQUIPMENT MARKET, BY TYPE, 2023–2030 (USD MILLION)
TABLE 34
SINGLE-USE BIOPROCESSING EQUIPMENT MARKET, BY REGION, 2023–2030 (USD MILLION)
TABLE 35
NORTH AMERICA: SINGLE-USE BIOPROCESSING EQUIPMENT MARKET, BY COUNTRY, 2023–2030 (USD MILLION)
TABLE 36
EUROPE: SINGLE-USE BIOPROCESSING EQUIPMENT MARKET, BY COUNTRY, 2023–2030 (USD MILLION)
TABLE 37
ASIA PACIFIC: SINGLE-USE BIOPROCESSING EQUIPMENT MARKET, BY COUNTRY, 2023–2030 (USD MILLION)
TABLE 38
LATIN AMERICA: SINGLE-USE BIOPROCESSING EQUIPMENT MARKET, BY COUNTRY, 2023–2030 (USD MILLION)
TABLE 39
MIDDLE EAST: SINGLE-USE BIOPROCESSING EQUIPMENT MARKET, BY REGION, 2023–2030 (USD MILLION)
TABLE 40
GCC COUNTRIES: SINGLE-USE BIOPROCESSING EQUIPMENT MARKET, BY COUNTRY, 2023–2030 (USD MILLION)
TABLE 41
COMPARISON OF SINGLE-USE AND MULTIUSE BIOREACTORS
TABLE 42
SINGLE-USE BIOREACTORS MARKET, BY REGION, 2023–2030 (USD MILLION)
TABLE 43
NORTH AMERICA: SINGLE-USE BIOREACTORS MARKET, BY COUNTRY, 2023–2030 (USD MILLION)
TABLE 44
EUROPE: SINGLE-USE BIOREACTORS MARKET, BY COUNTRY, 2023–2030 (USD MILLION)
TABLE 45
ASIA PACIFIC: SINGLE-USE BIOREACTORS MARKET, BY COUNTRY, 2023–2030 (USD MILLION)
TABLE 46
LATIN AMERICA: SINGLE-USE BIOREACTORS MARKET, BY COUNTRY, 2023–2030 (USD MILLION)
TABLE 47
MIDDLE EAST: SINGLE-USE BIOREACTORS MARKET, BY REGION, 2023–2030 (USD MILLION)
TABLE 48
GCC COUNTRIES: SINGLE-USE BIOREACTORS MARKET, BY COUNTRY, 2023–2030 (USD MILLION)
TABLE 49
SINGLE-USE BIOREACTORS MARKET, BY SCALE RANGE, 2023–2030 (USD MILLION)
TABLE 50
≤10 L SINGLE-USE BIOREACTORS MARKET, BY REGION, 2023–2030 (USD MILLION)
TABLE 51
NORTH AMERICA: ≤10 L SINGLE-USE BIOREACTORS MARKET, BY COUNTRY, 2023–2030 (USD MILLION)
TABLE 52
EUROPE: ≤10 L SINGLE-USE BIOREACTORS MARKET, BY COUNTRY, 2023–2030 (USD MILLION)
TABLE 53
ASIA PACIFIC: ≤10 L SINGLE-USE BIOREACTORS MARKET, BY COUNTRY, 2023–2030 (USD MILLION)
TABLE 54
LATIN AMERICA: ≤10 L SINGLE-USE BIOREACTORS MARKET, BY COUNTRY, 2023–2030 (USD MILLION)
TABLE 55
MIDDLE EAST: ≤10 L SINGLE-USE BIOREACTORS MARKET, BY REGION, 2023–2030 (USD MILLION)
TABLE 56
GCC COUNTRIES: ≤10 L SINGLE-USE BIOREACTORS MARKET, BY COUNTRY, 2023–2030 (USD MILLION)
TABLE 57
11–100 L SINGLE-USE BIOREACTORS MARKET, BY REGION, 2023–2030 (USD MILLION)
TABLE 58
NORTH AMERICA: 11–100 L SINGLE-USE BIOREACTORS MARKET, BY COUNTRY, 2023–2030 (USD MILLION)
TABLE 59
EUROPE: 11–100 L SINGLE-USE BIOREACTORS MARKET, BY COUNTRY, 2023–2030 (USD MILLION)
TABLE 60
ASIA PACIFIC: 11–100 L SINGLE-USE BIOREACTORS MARKET, BY COUNTRY, 2023–2030 (USD MILLION)
TABLE 61
LATIN AMERICA: 11–100 L SINGLE-USE BIOREACTORS MARKET, BY COUNTRY, 2023–2030 (USD MILLION)
TABLE 62
MIDDLE EAST: 11–100 L SINGLE-USE BIOREACTORS MARKET, BY REGION, 2023–2030 (USD MILLION)
TABLE 63
GCC COUNTRIES: 11–100 L SINGLE-USE BIOREACTORS MARKET, BY COUNTRY, 2023–2030 (USD MILLION)
TABLE 64
101–500 L SINGLE-USE BIOREACTORS MARKET, BY REGION, 2023–2030 (USD MILLION)
TABLE 65
NORTH AMERICA: 101–500 L SINGLE-USE BIOREACTORS MARKET, BY COUNTRY, 2023–2030 (USD MILLION)
TABLE 66
EUROPE: 101–500 L SINGLE-USE BIOREACTORS MARKET, BY COUNTRY, 2023–2030 (USD MILLION)
TABLE 67
ASIA PACIFIC: 101–500 L SINGLE-USE BIOREACTORS MARKET, BY COUNTRY, 2023–2030 (USD MILLION)
TABLE 68
LATIN AMERICA: 101–500 L SINGLE-USE BIOREACTORS MARKET, BY COUNTRY, 2023–2030 (USD MILLION)
TABLE 69
MIDDLE EAST: 101–500 L SINGLE-USE BIOREACTORS MARKET, BY REGION, 2023–2030 (USD MILLION)
TABLE 70
GCC COUNTRIES: 101–500 L SINGLE-USE BIOREACTORS MARKET, BY COUNTRY, 2023–2030 (USD MILLION)
TABLE 71
501–1,500 L SINGLE-USE BIOREACTORS MARKET, BY REGION, 2023–2030 (USD MILLION)
TABLE 72
NORTH AMERICA: 501–1,500 L SINGLE-USE BIOREACTORS MARKET, BY COUNTRY, 2023–2030 (USD MILLION)
TABLE 73
EUROPE: 501–1,500 L SINGLE-USE BIOREACTORS MARKET, BY COUNTRY, 2023–2030 (USD MILLION)
TABLE 74
ASIA PACIFIC: 501–1,500 L SINGLE-USE BIOREACTORS MARKET, BY COUNTRY, 2023–2030 (USD MILLION)
TABLE 75
LATIN AMERICA: 501–1,500 L SINGLE-USE BIOREACTORS MARKET, BY COUNTRY, 2023–2030 (USD MILLION)
TABLE 76
MIDDLE EAST: 501–1,500 L SINGLE-USE BIOREACTORS MARKET, BY REGION, 2023–2030 (USD MILLION)
TABLE 77
GCC COUNTRIES: 501–1,500 L SINGLE-USE BIOREACTORS MARKET, BY COUNTRY, 2023–2030 (USD MILLION)
TABLE 78
>1,500 L SINGLE-USE BIOREACTORS MARKET, BY REGION, 2023–2030 (USD MILLION)
TABLE 79
NORTH AMERICA: >1,500 L SINGLE-USE BIOREACTORS MARKET, BY COUNTRY, 2023–2030 (USD MILLION)
TABLE 80
EUROPE: >1,500 L SINGLE-USE BIOREACTORS MARKET, BY COUNTRY, 2023–2030 (USD MILLION)
TABLE 81
ASIA PACIFIC: >1,500 L SINGLE-USE BIOREACTORS MARKET, BY COUNTRY, 2023–2030 (USD MILLION)
TABLE 82
LATIN AMERICA: >1,500 L SINGLE-USE BIOREACTORS MARKET, BY COUNTRY, 2023–2030 (USD MILLION)
TABLE 83
MIDDLE EAST: >1,500 L SINGLE-USE BIOREACTORS MARKET, BY REGION, 2023–2030 (USD MILLION)
TABLE 84
GCC COUNTRIES: >1,500 L SINGLE-USE BIOREACTORS MARKET, BY COUNTRY, 2023–2030 (USD MILLION)
TABLE 85
SINGLE-USE FILTRATION SYSTEMS MARKET, BY SCALE, 2023–2030 (USD MILLION)
TABLE 86
SINGLE-USE FILTRATION SYSTEMS MARKET, BY REGION, 2023–2030 (USD MILLION)
TABLE 87
NORTH AMERICA: SINGLE-USE FILTRATION SYSTEMS MARKET, BY COUNTRY, 2023–2030 (USD MILLION)
TABLE 88
EUROPE: SINGLE-USE FILTRATION SYSTEMS MARKET, BY COUNTRY, 2023–2030 (USD MILLION)
TABLE 89
ASIA PACIFIC: SINGLE-USE FILTRATION SYSTEMS MARKET, BY COUNTRY, 2023–2030 (USD MILLION)
TABLE 90
LATIN AMERICA: SINGLE-USE FILTRATION SYSTEMS MARKET, BY COUNTRY, 2023–2030 (USD MILLION)
TABLE 91
MIDDLE EAST: SINGLE-USE FILTRATION SYSTEMS MARKET, BY REGION, 2023–2030 (USD MILLION)
TABLE 92
GCC COUNTRIES: SINGLE-USE FILTRATION SYSTEMS MARKET, BY COUNTRY, 2023–2030 (USD MILLION)
TABLE 93
MANUFACTURING-SCALE SINGLE-USE FILTRATION SYSTEMS MARKET, BY REGION, 2023–2030 (USD MILLION)
TABLE 94
NORTH AMERICA: MANUFACTURING-SCALE SINGLE-USE FILTRATION SYSTEMS MARKET, BY COUNTRY, 2023–2030 (USD MILLION)
TABLE 95
EUROPE: MANUFACTURING-SCALE SINGLE-USE FILTRATION SYSTEMS MARKET, BY COUNTRY, 2023–2030 (USD MILLION)
TABLE 96
ASIA PACIFIC: MANUFACTURING-SCALE SINGLE-USE FILTRATION SYSTEMS MARKET, BY COUNTRY, 2023–2030 (USD MILLION)
TABLE 97
LATIN AMERICA: MANUFACTURING-SCALE SINGLE-USE FILTRATION SYSTEMS MARKET, BY COUNTRY, 2023–2030 (USD MILLION)
TABLE 98
MIDDLE EAST: MANUFACTURING-SCALE SINGLE-USE FILTRATION SYSTEMS MARKET, BY REGION, 2023–2030 (USD MILLION)
TABLE 99
GCC COUNTRIES: MANUFACTURING-SCALE SINGLE-USE FILTRATION SYSTEMS MARKET, BY COUNTRY, 2023–2030 (USD MILLION)
TABLE 100
PILOT-SCALE SINGLE-USE FILTRATION SYSTEMS MARKET, BY REGION, 2023–2030 (USD MILLION)
TABLE 101
NORTH AMERICA: PILOT-SCALE SINGLE-USE FILTRATION SYSTEMS MARKET, BY COUNTRY, 2023–2030 (USD MILLION)
TABLE 102
EUROPE: PILOT-SCALE SINGLE-USE FILTRATION SYSTEMS MARKET, BY COUNTRY, 2023–2030 (USD MILLION)
TABLE 103
ASIA PACIFIC: PILOT-SCALE SINGLE-USE FILTRATION SYSTEMS MARKET, BY COUNTRY, 2023–2030 (USD MILLION)
TABLE 104
LATIN AMERICA: PILOT-SCALE SINGLE-USE FILTRATION SYSTEMS MARKET, BY COUNTRY, 2023–2030 (USD MILLION)
TABLE 105
MIDDLE EAST: PILOT-SCALE SINGLE-USE FILTRATION SYSTEMS MARKET, BY REGION, 2023–2030 (USD MILLION)
TABLE 106
GCC COUNTRIES: PILOT-SCALE SINGLE-USE FILTRATION SYSTEMS MARKET, BY COUNTRY, 2023–2030 (USD MILLION)
TABLE 107
R&D-SCALE SINGLE-USE FILTRATION SYSTEMS MARKET, BY REGION, 2023–2030 (USD MILLION)
TABLE 108
NORTH AMERICA: R&D-SCALE SINGLE-USE FILTRATION SYSTEMS MARKET, BY COUNTRY, 2023–2030 (USD MILLION)
TABLE 109
EUROPE: R&D-SCALE SINGLE-USE FILTRATION SYSTEMS MARKET, BY COUNTRY, 2023–2030 (USD MILLION)
TABLE 110
ASIA PACIFIC: R&D-SCALE SINGLE-USE FILTRATION SYSTEMS MARKET, BY COUNTRY, 2023–2030 (USD MILLION)
TABLE 111
LATIN AMERICA: R&D-SCALE SINGLE-USE FILTRATION SYSTEMS MARKET, BY COUNTRY, 2023–2030 (USD MILLION)
TABLE 112
MIDDLE EAST: R&D-SCALE SINGLE-USE FILTRATION SYSTEMS MARKET, BY REGION, 2023–2030 (USD MILLION)
TABLE 113
GCC COUNTRIES: R&D-SCALE SINGLE-USE FILTRATION SYSTEMS MARKET, BY COUNTRY, 2023–2030 (USD MILLION)
TABLE 114
SINGLE-USE MIXING SYSTEMS MARKET, BY SCALE, 2023–2030 (USD MILLION)
TABLE 115
SINGLE-USE MIXING SYSTEMS MARKET, BY REGION, 2023–2030 (USD MILLION)
TABLE 116
NORTH AMERICA: SINGLE-USE MIXING SYSTEMS MARKET, BY COUNTRY, 2023–2030 (USD MILLION)
TABLE 117
EUROPE: SINGLE-USE MIXING SYSTEMS MARKET, BY COUNTRY, 2023–2030 (USD MILLION)
TABLE 118
ASIA PACIFIC: SINGLE-USE MIXING SYSTEMS MARKET, BY COUNTRY, 2023–2030 (USD MILLION)
TABLE 119
LATIN AMERICA: SINGLE-USE MIXING SYSTEMS MARKET, BY COUNTRY, 2023–2030 (USD MILLION)
TABLE 120
MIDDLE EAST: SINGLE-USE MIXING SYSTEMS MARKET, BY REGION, 2023–2030 (USD MILLION)
TABLE 121
GCC COUNTRIES: SINGLE-USE MIXING SYSTEMS MARKET, BY COUNTRY, 2023–2030 (USD MILLION)
TABLE 122
MANUFACTURING-SCALE SINGLE-USE MIXING SYSTEMS MARKET, BY REGION, 2023–2030 (USD MILLION)
TABLE 123
NORTH AMERICA: MANUFACTURING-SCALE SINGLE-USE MIXING SYSTEMS MARKET, BY COUNTRY, 2023–2030 (USD MILLION)
TABLE 124
EUROPE: MANUFACTURING-SCALE SINGLE-USE MIXING SYSTEMS MARKET, BY COUNTRY, 2023–2030 (USD MILLION)
TABLE 125
ASIA PACIFIC: MANUFACTURING-SCALE SINGLE-USE MIXING SYSTEMS MARKET, BY COUNTRY, 2023–2030 (USD MILLION)
TABLE 126
LATIN AMERICA: MANUFACTURING-SCALE SINGLE-USE MIXING SYSTEMS MARKET, BY COUNTRY, 2023–2030 (USD MILLION)
TABLE 127
MIDDLE EAST: MANUFACTURING-SCALE SINGLE-USE MIXING SYSTEMS MARKET, BY REGION, 2023–2030 (USD MILLION)
TABLE 128
GCC COUNTRIES: MANUFACTURING-SCALE SINGLE-USE MIXING SYSTEMS MARKET, BY COUNTRY, 2023–2030 (USD MILLION)
TABLE 129
PILOT-SCALE SINGLE-USE MIXING SYSTEMS MARKET, BY REGION, 2023–2030 (USD MILLION)
TABLE 130
NORTH AMERICA: PILOT-SCALE SINGLE-USE MIXING SYSTEMS MARKET, BY COUNTRY, 2023–2030 (USD MILLION)
TABLE 131
EUROPE: PILOT-SCALE SINGLE-USE MIXING SYSTEMS MARKET, BY COUNTRY, 2023–2030 (USD MILLION)
TABLE 132
ASIA PACIFIC: PILOT-SCALE SINGLE-USE MIXING SYSTEMS MARKET, BY COUNTRY, 2023–2030 (USD MILLION)
TABLE 133
LATIN AMERICA: PILOT-SCALE SINGLE-USE MIXING SYSTEMS MARKET, BY COUNTRY, 2023–2030 (USD MILLION)
TABLE 134
MIDDLE EAST: PILOT-SCALE SINGLE-USE MIXING SYSTEMS MARKET, BY REGION, 2023–2030 (USD MILLION)
TABLE 135
GCC COUNTRIES: PILOT-SCALE SINGLE-USE MIXING SYSTEMS MARKET, BY COUNTRY, 2023–2030 (USD MILLION)
TABLE 136
R&D-SCALE SINGLE-USE MIXING SYSTEMS MARKET, BY REGION, 2023–2030 (USD MILLION)
TABLE 137
NORTH AMERICA: R&D-SCALE SINGLE-USE MIXING SYSTEMS MARKET, BY COUNTRY, 2023–2030 (USD MILLION)
TABLE 138
EUROPE: R&D-SCALE SINGLE-USE MIXING SYSTEMS MARKET, BY COUNTRY, 2023–2030 (USD MILLION)
TABLE 139
ASIA PACIFIC: R&D-SCALE SINGLE-USE MIXING SYSTEMS MARKET, BY COUNTRY, 2023–2030 (USD MILLION)
TABLE 140
LATIN AMERICA: R&D-SCALE SINGLE-USE MIXING SYSTEMS MARKET, BY COUNTRY, 2023–2030 (USD MILLION)
TABLE 141
MIDDLE EAST: R&D-SCALE SINGLE-USE MIXING SYSTEMS MARKET, BY REGION, 2023–2030 (USD MILLION)
TABLE 142
GCC COUNTRIES: R&D-SCALE SINGLE-USE MIXING SYSTEMS MARKET, BY COUNTRY, 2023–2030 (USD MILLION)
TABLE 143
SINGLE-USE CHROMATOGRAPHY SYSTEMS MARKET, BY REGION, 2023–2030 (USD MILLION)
TABLE 144
NORTH AMERICA: SINGLE-USE CHROMATOGRAPHY SYSTEMS MARKET, BY COUNTRY, 2023–2030 (USD MILLION)
TABLE 145
EUROPE: SINGLE-USE CHROMATOGRAPHY SYSTEMS MARKET, BY COUNTRY, 2023–2030 (USD MILLION)
TABLE 146
ASIA PACIFIC: SINGLE-USE CHROMATOGRAPHY SYSTEMS MARKET, BY COUNTRY, 2023–2030 (USD MILLION)
TABLE 147
LATIN AMERICA: SINGLE-USE CHROMATOGRAPHY SYSTEMS MARKET, BY COUNTRY, 2023–2030 (USD MILLION)
TABLE 148
MIDDLE EAST: SINGLE-USE CHROMATOGRAPHY SYSTEMS MARKET, BY REGION, 2023–2030 (USD MILLION)
TABLE 149
GCC COUNTRIES: SINGLE-USE CHROMATOGRAPHY SYSTEMS MARKET, BY COUNTRY, 2023–2030 (USD MILLION)
TABLE 150
OTHER SINGLE-USE EQUIPMENT MARKET, BY REGION, 2023–2030 (USD MILLION)
TABLE 151
NORTH AMERICA: OTHER SINGLE-USE EQUIPMENT MARKET, BY COUNTRY, 2023–2030 (USD MILLION)
TABLE 152
EUROPE: OTHER SINGLE-USE EQUIPMENT MARKET, BY COUNTRY, 2023–2030 (USD MILLION)
TABLE 153
ASIA PACIFIC: OTHER SINGLE-USE EQUIPMENT MARKET, BY COUNTRY, 2023–2030 (USD MILLION)
TABLE 154
LATIN AMERICA: OTHER SINGLE-USE EQUIPMENT MARKET, BY COUNTRY, 2023–2030 (USD MILLION)
TABLE 155
MIDDLE EAST: OTHER SINGLE-USE EQUIPMENT MARKET, BY REGION, 2023–2030 (USD MILLION)
TABLE 156
GCC COUNTRIES: OTHER SINGLE-USE EQUIPMENT MARKET, BY COUNTRY, 2023–2030 (USD MILLION)
TABLE 157
SINGLE-USE BIOPROCESSING CONSUMABLES MARKET, BY TYPE, 2023–2030 (USD MILLION)
TABLE 158
SINGLE-USE BIOPROCESSING CONSUMABLES MARKET, BY REGION, 2023–2030 (USD MILLION)
TABLE 159
NORTH AMERICA: SINGLE-USE BIOPROCESSING CONSUMABLES MARKET, BY COUNTRY, 2023–2030 (USD MILLION)
TABLE 160
EUROPE: SINGLE-USE BIOPROCESSING CONSUMABLES MARKET, BY COUNTRY, 2023–2030 (USD MILLION)
TABLE 161
ASIA PACIFIC: SINGLE-USE BIOPROCESSING CONSUMABLES MARKET, BY COUNTRY, 2023–2030 (USD MILLION)
TABLE 162
LATIN AMERICA: SINGLE-USE BIOPROCESSING CONSUMABLES MARKET, BY COUNTRY, 2023–2030 (USD MILLION)
TABLE 163
MIDDLE EAST: SINGLE-USE BIOPROCESSING CONSUMABLES MARKET, BY REGION, 2023–2030 (USD MILLION)
TABLE 164
GCC COUNTRIES: SINGLE-USE BIOPROCESSING CONSUMABLES MARKET, BY COUNTRY, 2023–2030 (USD MILLION)
TABLE 165
SINGLE-USE BAGS & CONTAINERS MARKET, BY TYPE, 2023–2030 (USD MILLION)
TABLE 166
SINGLE-USE BAGS & CONTAINERS MARKET, BY REGION, 2023–2030 (USD MILLION)
TABLE 167
NORTH AMERICA: SINGLE-USE BAGS & CONTAINERS MARKET, BY COUNTRY, 2023–2030 (USD MILLION)
TABLE 168
EUROPE: SINGLE-USE BAGS & CONTAINERS MARKET, BY COUNTRY, 2023–2030 (USD MILLION)
TABLE 169
ASIA PACIFIC: SINGLE-USE BAGS & CONTAINERS MARKET, BY COUNTRY, 2023–2030 (USD MILLION)
TABLE 170
LATIN AMERICA: SINGLE-USE BAGS & CONTAINERS MARKET, BY COUNTRY, 2023–2030 (USD MILLION)
TABLE 171
MIDDLE EAST: SINGLE-USE BAGS & CONTAINERS MARKET, BY REGION, 2023–2030 (USD MILLION)
TABLE 172
GCC COUNTRIES: SINGLE-USE BAGS & CONTAINERS MARKET, BY COUNTRY, 2023–2030 (USD MILLION)
TABLE 173
2D SINGLE-USE BAGS & CONTAINERS MARKET, BY REGION, 2023–2030 (USD MILLION)
TABLE 174
NORTH AMERICA: 2D SINGLE-USE BAGS & CONTAINERS MARKET, BY COUNTRY, 2023–2030 (USD MILLION)
TABLE 175
EUROPE: 2D SINGLE-USE BAGS & CONTAINERS MARKET, BY COUNTRY, 2023–2030 (USD MILLION)
TABLE 176
ASIA PACIFIC: 2D SINGLE-USE BAGS & CONTAINERS MARKET, BY COUNTRY, 2023–2030 (USD MILLION)
TABLE 177
LATIN AMERICA: 2D SINGLE-USE BAGS & CONTAINERS MARKET, BY COUNTRY, 2023–2030 (USD MILLION)
TABLE 178
MIDDLE EAST: 2D SINGLE-USE BAGS & CONTAINERS MARKET, BY REGION, 2023–2030 (USD MILLION)
TABLE 179
GCC COUNTRIES: 2D SINGLE-USE BAGS & CONTAINERS MARKET, BY COUNTRY, 2023–2030 (USD MILLION)
TABLE 180
3D SINGLE-USE BAGS & CONTAINERS MARKET, BY REGION, 2023–2030 (USD MILLION)
TABLE 181
NORTH AMERICA: 3D SINGLE-USE BAGS & CONTAINERS MARKET, BY COUNTRY, 2023–2030 (USD MILLION)
TABLE 182
EUROPE: 3D SINGLE-USE BAGS & CONTAINERS MARKET, BY COUNTRY, 2023–2030 (USD MILLION)
TABLE 183
ASIA PACIFIC: 3D SINGLE-USE BAGS & CONTAINERS MARKET, BY COUNTRY, 2023–2030 (USD MILLION)
TABLE 184
LATIN AMERICA: 3D SINGLE-USE BAGS & CONTAINERS MARKET, BY COUNTRY, 2023–2030 (USD MILLION)
TABLE 185
MIDDLE EAST: 3D SINGLE-USE BAGS & CONTAINERS MARKET, BY REGION, 2023–2030 (USD MILLION)
TABLE 186
GCC COUNTRIES: 3D SINGLE-USE BAGS & CONTAINERS MARKET, BY COUNTRY, 2023–2030 (USD MILLION)
TABLE 187
SINGLE-USE FILTERS MARKET, BY REGION, 2023–2030 (USD MILLION)
TABLE 188
NORTH AMERICA: SINGLE-USE FILTERS MARKET, BY COUNTRY, 2023–2030 (USD MILLION)
TABLE 189
EUROPE: SINGLE-USE FILTERS MARKET, BY COUNTRY, 2023–2030 (USD MILLION)
TABLE 190
ASIA PACIFIC: SINGLE-USE FILTERS MARKET, BY COUNTRY, 2023–2030 (USD MILLION)
TABLE 191
LATIN AMERICA: SINGLE-USE FILTERS MARKET, BY COUNTRY, 2023–2030 (USD MILLION)
TABLE 192
MIDDLE EAST: SINGLE-USE FILTERS MARKET, BY REGION, 2023–2030 (USD MILLION)
TABLE 193
GCC COUNTRIES: SINGLE-USE FILTERS MARKET, BY COUNTRY, 2023–2030 (USD MILLION)
TABLE 194
SINGLE-USE ASSEMBLIES MARKET, BY TYPE, 2023–2030 (USD MILLION)
TABLE 195
SINGLE-USE ASSEMBLIES MARKET, BY REGION, 2023–2030 (USD MILLION)
TABLE 196
NORTH AMERICA: SINGLE-USE ASSEMBLIES MARKET, BY COUNTRY, 2023–2030 (USD MILLION)
TABLE 197
EUROPE: SINGLE-USE ASSEMBLIES MARKET, BY COUNTRY, 2023–2030 (USD MILLION)
TABLE 198
ASIA PACIFIC: SINGLE-USE ASSEMBLIES MARKET, BY COUNTRY, 2023–2030 (USD MILLION)
TABLE 199
LATIN AMERICA: SINGLE-USE ASSEMBLIES MARKET, BY COUNTRY, 2023–2030 (USD MILLION)
TABLE 200
MIDDLE EAST: SINGLE-USE ASSEMBLIES MARKET, BY REGION, 2023–2030 (USD MILLION)
TABLE 201
GCC COUNTRIES: SINGLE-USE ASSEMBLIES MARKET, BY COUNTRY, 2023–2030 (USD MILLION)
TABLE 202
SINGLE-USE BAG ASSEMBLIES MARKET, BY REGION, 2023–2030 (USD MILLION)
TABLE 203
NORTH AMERICA: SINGLE-USE BAG ASSEMBLIES MARKET, BY COUNTRY, 2023–2030 (USD MILLION)
TABLE 204
EUROPE: SINGLE-USE BAG ASSEMBLIES MARKET, BY COUNTRY, 2023–2030 (USD MILLION)
TABLE 205
ASIA PACIFIC: SINGLE-USE BAG ASSEMBLIES MARKET, BY COUNTRY, 2023–2030 (USD MILLION)
TABLE 206
LATIN AMERICA: SINGLE-USE BAG ASSEMBLIES MARKET, BY COUNTRY, 2023–2030 (USD MILLION)
TABLE 207
MIDDLE EAST: SINGLE-USE BAG ASSEMBLIES MARKET, BY REGION, 2023–2030 (USD MILLION)
TABLE 208
GCC COUNTRIES: SINGLE-USE BAG ASSEMBLIES MARKET, BY COUNTRY, 2023–2030 (USD MILLION)
TABLE 209
SINGLE-USE FILTRATION ASSEMBLIES MARKET, BY REGION, 2023–2030 (USD MILLION)
TABLE 210
NORTH AMERICA: SINGLE-USE FILTRATION ASSEMBLIES MARKET, BY COUNTRY, 2023–2030 (USD MILLION)
TABLE 211
EUROPE: SINGLE-USE FILTRATION ASSEMBLIES MARKET, BY COUNTRY, 2023–2030 (USD MILLION)
TABLE 212
ASIA PACIFIC: SINGLE-USE FILTRATION ASSEMBLIES MARKET, BY COUNTRY, 2023–2030 (USD MILLION)
TABLE 213
LATIN AMERICA: SINGLE-USE FILTRATION ASSEMBLIES MARKET, BY COUNTRY, 2023–2030 (USD MILLION)
TABLE 214
MIDDLE EAST: SINGLE-USE FILTRATION ASSEMBLIES MARKET, BY REGION, 2023–2030 (USD MILLION)
TABLE 215
GCC COUNTRIES: SINGLE-USE FILTRATION ASSEMBLIES MARKET, BY COUNTRY, 2023–2030 (USD MILLION)
TABLE 216
SINGLE-USE BOTTLE ASSEMBLIES MARKET, BY REGION, 2023–2030 (USD MILLION)
TABLE 217
NORTH AMERICA: SINGLE-USE BOTTLE ASSEMBLIES MARKET, BY COUNTRY, 2023–2030 (USD MILLION)
TABLE 218
EUROPE: SINGLE-USE BOTTLE ASSEMBLIES MARKET, BY COUNTRY, 2023–2030 (USD MILLION)
TABLE 219
ASIA PACIFIC: SINGLE-USE BOTTLE ASSEMBLIES MARKET, BY COUNTRY, 2023–2030 (USD MILLION)
TABLE 220
LATIN AMERICA: SINGLE-USE BOTTLE ASSEMBLIES MARKET, BY COUNTRY, 2023–2030 (USD MILLION)
TABLE 221
MIDDLE EAST: SINGLE-USE BOTTLE ASSEMBLIES MARKET, BY REGION, 2023–2030 (USD MILLION)
TABLE 222
GCC COUNTRIES: SINGLE-USE BOTTLE ASSEMBLIES MARKET, BY COUNTRY, 2023–2030 (USD MILLION)
TABLE 223
SINGLE-USE MIXING SYSTEM ASSEMBLIES MARKET, BY REGION, 2023–2030 (USD MILLION)
TABLE 224
NORTH AMERICA: SINGLE-USE MIXING SYSTEM ASSEMBLIES MARKET, BY COUNTRY, 2023–2030 (USD MILLION)
TABLE 225
EUROPE: SINGLE-USE MIXING SYSTEM ASSEMBLIES MARKET, BY COUNTRY, 2023–2030 (USD MILLION)
TABLE 226
ASIA PACIFIC: SINGLE-USE MIXING SYSTEM ASSEMBLIES MARKET, BY COUNTRY, 2023–2030 (USD MILLION)
TABLE 227
LATIN AMERICA: SINGLE-USE MIXING SYSTEM ASSEMBLIES MARKET, BY COUNTRY, 2023–2030 (USD MILLION)
TABLE 228
MIDDLE EAST: SINGLE-USE MIXING SYSTEM ASSEMBLIES MARKET, BY REGION, 2023–2030 (USD MILLION)
TABLE 229
GCC COUNTRIES: SINGLE-USE MIXING SYSTEM ASSEMBLIES MARKET, BY COUNTRY, 2023–2030 (USD MILLION)
TABLE 230
OTHER SINGLE-USE ASSEMBLIES MARKET, BY REGION, 2023–2030 (USD MILLION)
TABLE 231
NORTH AMERICA: OTHER SINGLE-USE ASSEMBLIES MARKET, BY COUNTRY, 2023–2030 (USD MILLION)
TABLE 232
EUROPE: OTHER SINGLE-USE ASSEMBLIES MARKET, BY COUNTRY, 2023–2030 (USD MILLION)
TABLE 233
ASIA PACIFIC: OTHER SINGLE-USE ASSEMBLIES MARKET, BY COUNTRY, 2023–2030 (USD MILLION)
TABLE 234
LATIN AMERICA: OTHER SINGLE-USE ASSEMBLIES MARKET, BY COUNTRY, 2023–2030 (USD MILLION)
TABLE 235
MIDDLE EAST: OTHER SINGLE-USE ASSEMBLIES MARKET, BY REGION, 2023–2030 (USD MILLION)
TABLE 236
GCC COUNTRIES: OTHER SINGLE-USE ASSEMBLIES MARKET, BY COUNTRY, 2023–2030 (USD MILLION)
TABLE 237
SINGLE-USE CHROMATOGRAPHY COLUMNS MARKET, BY REGION, 2023–2030 (USD MILLION)
TABLE 238
NORTH AMERICA: SINGLE-USE CHROMATOGRAPHY COLUMNS MARKET, BY COUNTRY, 2023–2030 (USD MILLION)
TABLE 239
EUROPE: SINGLE-USE CHROMATOGRAPHY COLUMNS MARKET, BY COUNTRY, 2023–2030 (USD MILLION)
TABLE 240
ASIA PACIFIC: SINGLE-USE CHROMATOGRAPHY COLUMNS MARKET, BY COUNTRY, 2023–2030 (USD MILLION)
TABLE 241
LATIN AMERICA: SINGLE-USE CHROMATOGRAPHY COLUMNS MARKET, BY COUNTRY, 2023–2030 (USD MILLION)
TABLE 242
MIDDLE EAST: SINGLE-USE CHROMATOGRAPHY COLUMNS MARKET, BY REGION, 2023–2030 (USD MILLION)
TABLE 243
GCC COUNTRIES: SINGLE-USE CHROMATOGRAPHY COLUMNS MARKET, BY COUNTRY, 2023–2030 (USD MILLION)
TABLE 244
SINGLE-USE SENSORS MARKET, BY TYPE, 2023–2030 (USD MILLION)
TABLE 245
SINGLE-USE SENSORS MARKET, BY REGION, 2023–2030 (USD MILLION)
TABLE 246
NORTH AMERICA: SINGLE-USE SENSORS MARKET, BY COUNTRY, 2023–2030 (USD MILLION)
TABLE 247
EUROPE: SINGLE-USE SENSORS MARKET, BY COUNTRY, 2023–2030 (USD MILLION)
TABLE 248
ASIA PACIFIC: SINGLE-USE SENSORS MARKET, BY COUNTRY, 2023–2030 (USD MILLION)
TABLE 249
LATIN AMERICA: SINGLE-USE SENSORS MARKET, BY COUNTRY, 2023–2030 (USD MILLION)
TABLE 250
MIDDLE EAST: SINGLE-USE SENSORS MARKET, BY REGION, 2023–2030 (USD MILLION)
TABLE 251
GCC COUNTRIES: SINGLE-USE SENSORS MARKET, BY COUNTRY, 2023–2030 (USD MILLION)
TABLE 252
SINGLE-USE PH SENSORS MARKET, BY REGION, 2023–2030 (USD MILLION)
TABLE 253
NORTH AMERICA: SINGLE-USE PH SENSORS MARKET, BY COUNTRY, 2023–2030 (USD MILLION)
TABLE 254
EUROPE: SINGLE-USE PH SENSORS MARKET, BY COUNTRY, 2023–2030 (USD MILLION)
TABLE 255
ASIA PACIFIC: SINGLE-USE PH SENSORS MARKET, BY COUNTRY, 2023–2030 (USD MILLION)
TABLE 256
LATIN AMERICA: SINGLE-USE PH SENSORS MARKET, BY COUNTRY, 2023–2030 (USD MILLION)
TABLE 257
MIDDLE EAST: SINGLE-USE PH SENSORS MARKET, BY REGION, 2023–2030 (USD MILLION)
TABLE 258
GCC COUNTRIES: SINGLE-USE PH SENSORS MARKET, BY COUNTRY, 2023–2030 (USD MILLION)
TABLE 259
SINGLE-USE OXYGEN SENSORS MARKET, BY REGION, 2023–2030 (USD MILLION)
TABLE 260
NORTH AMERICA: SINGLE-USE OXYGEN SENSORS MARKET, BY COUNTRY, 2023–2030 (USD MILLION)
TABLE 261
EUROPE: SINGLE-USE OXYGEN SENSORS MARKET, BY COUNTRY, 2023–2030 (USD MILLION)
TABLE 262
ASIA PACIFIC: SINGLE-USE OXYGEN SENSORS MARKET, BY COUNTRY, 2023–2030 (USD MILLION)
TABLE 263
LATIN AMERICA: SINGLE-USE OXYGEN SENSORS MARKET, BY COUNTRY, 2023–2030 (USD MILLION)
TABLE 264
MIDDLE EAST: SINGLE-USE OXYGEN SENSORS MARKET, BY REGION, 2023–2030 (USD MILLION)
TABLE 265
GCC COUNTRIES: SINGLE-USE OXYGEN SENSORS MARKET, BY COUNTRY, 2023–2030 (USD MILLION)
TABLE 266
SINGLE-USE PRESSURE SENSORS MARKET, BY REGION, 2023–2030 (USD MILLION)
TABLE 267
NORTH AMERICA: SINGLE-USE PRESSURE SENSORS MARKET, BY COUNTRY, 2023–2030 (USD MILLION)
TABLE 268
EUROPE: SINGLE-USE PRESSURE SENSORS MARKET, BY COUNTRY, 2023–2030 (USD MILLION)
TABLE 269
ASIA PACIFIC: SINGLE-USE PRESSURE SENSORS MARKET, BY COUNTRY, 2023–2030 (USD MILLION)
TABLE 270
LATIN AMERICA: SINGLE-USE PRESSURE SENSORS MARKET, BY COUNTRY, 2023–2030 (USD MILLION)
TABLE 271
MIDDLE EAST: SINGLE-USE PRESSURE SENSORS MARKET, BY REGION, 2023–2030 (USD MILLION)
TABLE 272
GCC COUNTRIES: SINGLE-USE PRESSURE SENSORS MARKET, BY COUNTRY, 2023–2030 (USD MILLION)
TABLE 273
SINGLE-USE TEMPERATURE SENSORS MARKET, BY REGION, 2023–2030 (USD MILLION)
TABLE 274
NORTH AMERICA: SINGLE-USE TEMPERATURE SENSORS MARKET, BY COUNTRY, 2023–2030 (USD MILLION)
TABLE 275
EUROPE: SINGLE-USE TEMPERATURE SENSORS MARKET, BY COUNTRY, 2023–2030 (USD MILLION)
TABLE 276
ASIA PACIFIC: SINGLE-USE TEMPERATURE SENSORS MARKET, BY COUNTRY, 2023–2030 (USD MILLION)
TABLE 277
LATIN AMERICA: SINGLE-USE TEMPERATURE SENSORS MARKET, BY COUNTRY, 2023–2030 (USD MILLION)
TABLE 278
MIDDLE EAST: SINGLE-USE TEMPERATURE SENSORS MARKET, BY REGION, 2023–2030 (USD MILLION)
TABLE 279
GCC COUNTRIES: SINGLE-USE TEMPERATURE SENSORS MARKET, BY COUNTRY, 2023–2030 (USD MILLION)
TABLE 280
SINGLE-USE CONDUCTIVITY SENSORS MARKET, BY REGION, 2023–2030 (USD MILLION)
TABLE 281
NORTH AMERICA: SINGLE-USE CONDUCTIVITY SENSORS MARKET, BY COUNTRY, 2023–2030 (USD MILLION)
TABLE 282
EUROPE: SINGLE-USE CONDUCTIVITY SENSORS MARKET, BY COUNTRY, 2023–2030 (USD MILLION)
TABLE 283
ASIA PACIFIC: SINGLE-USE CONDUCTIVITY SENSORS MARKET, BY COUNTRY, 2023–2030 (USD MILLION)
TABLE 284
LATIN AMERICA: SINGLE-USE CONDUCTIVITY SENSORS MARKET, BY COUNTRY, 2023–2030 (USD MILLION)
TABLE 285
MIDDLE EAST: SINGLE-USE CONDUCTIVITY SENSORS MARKET, BY REGION, 2023–2030 (USD MILLION)
TABLE 286
GCC COUNTRIES: SINGLE-USE CONDUCTIVITY SENSORS MARKET, BY COUNTRY, 2023–2030 (USD MILLION)
TABLE 287
SINGLE-USE FLOW SENSORS MARKET, BY REGION, 2023–2030 (USD MILLION)
TABLE 288
NORTH AMERICA: SINGLE-USE FLOW SENSORS MARKET, BY COUNTRY, 2023–2030 (USD MILLION)
TABLE 289
EUROPE: SINGLE-USE FLOW SENSORS MARKET, BY COUNTRY, 2023–2030 (USD MILLION)
TABLE 290
ASIA PACIFIC: SINGLE-USE FLOW SENSORS MARKET, BY COUNTRY, 2023–2030 (USD MILLION)
TABLE 291
LATIN AMERICA: SINGLE-USE FLOW SENSORS MARKET, BY COUNTRY, 2023–2030 (USD MILLION)
TABLE 292
MIDDLE EAST: SINGLE-USE FLOW SENSORS MARKET, BY REGION, 2023–2030 (USD MILLION)
TABLE 293
GCC COUNTRIES: SINGLE-USE FLOW SENSORS MARKET, BY COUNTRY, 2023–2030 (USD MILLION)
TABLE 294
OTHER SINGLE-USE SENSORS MARKET, BY REGION, 2023–2030 (USD MILLION)
TABLE 295
NORTH AMERICA: OTHER SINGLE-USE SENSORS MARKET, BY COUNTRY, 2023–2030 (USD MILLION)
TABLE 296
EUROPE: OTHER SINGLE-USE SENSORS MARKET, BY COUNTRY, 2023–2030 (USD MILLION)
TABLE 297
ASIA PACIFIC: OTHER SINGLE-USE SENSORS MARKET, BY COUNTRY, 2023–2030 (USD MILLION)
TABLE 298
LATIN AMERICA: OTHER SINGLE-USE SENSORS MARKET, BY COUNTRY, 2023–2030 (USD MILLION)
TABLE 299
MIDDLE EAST: OTHER SINGLE-USE SENSORS MARKET, BY REGION, 2023–2030 (USD MILLION)
TABLE 300
GCC COUNTRIES: OTHER SINGLE-USE SENSORS MARKET, BY COUNTRY, 2023–2030 (USD MILLION)
TABLE 301
OTHER SINGLE-USE CONSUMABLES MARKET, BY TYPE, 2023–2030 (USD MILLION)
TABLE 302
OTHER SINGLE-USE CONSUMABLES MARKET, BY REGION, 2023–2030 (USD MILLION)
TABLE 303
NORTH AMERICA: OTHER SINGLE-USE CONSUMABLES MARKET, BY COUNTRY, 2023–2030 (USD MILLION)
TABLE 304
EUROPE: OTHER SINGLE-USE CONSUMABLES MARKET, BY COUNTRY, 2023–2030 (USD MILLION)
TABLE 305
ASIA PACIFIC: OTHER SINGLE-USE CONSUMABLES MARKET, BY COUNTRY, 2023–2030 (USD MILLION)
TABLE 306
LATIN AMERICA: OTHER SINGLE-USE CONSUMABLES MARKET, BY COUNTRY, 2023–2030 (USD MILLION)
TABLE 307
MIDDLE EAST: OTHER SINGLE-USE CONSUMABLES MARKET, BY REGION, 2023–2030 (USD MILLION)
TABLE 308
GCC COUNTRIES: OTHER SINGLE-USE CONSUMABLES MARKET, BY COUNTRY, 2023–2030 (USD MILLION)
TABLE 309
SINGLE-USE TUBING MARKET, BY REGION, 2023–2030 (USD MILLION)
TABLE 310
NORTH AMERICA: SINGLE-USE TUBING MARKET, BY COUNTRY, 2023–2030 (USD MILLION)
TABLE 311
EUROPE: SINGLE-USE TUBING MARKET, BY COUNTRY, 2023–2030 (USD MILLION)
TABLE 312
ASIA PACIFIC: SINGLE-USE TUBING MARKET, BY COUNTRY, 2023–2030 (USD MILLION)
TABLE 313
LATIN AMERICA: SINGLE-USE TUBING MARKET, BY COUNTRY, 2023–2030 (USD MILLION)
TABLE 314
MIDDLE EAST: SINGLE-USE TUBING MARKET, BY REGION, 2023–2030 (USD MILLION)
TABLE 315
GCC COUNTRIES: SINGLE-USE TUBING MARKET, BY COUNTRY, 2023–2030 (USD MILLION)
TABLE 316
SINGLE-USE CONNECTORS MARKET, BY REGION, 2023–2030 (USD MILLION)
TABLE 317
NORTH AMERICA: SINGLE-USE CONNECTORS MARKET, BY COUNTRY, 2023–2030 (USD MILLION)
TABLE 318
EUROPE: SINGLE-USE CONNECTORS MARKET, BY COUNTRY, 2023–2030 (USD MILLION)
TABLE 319
ASIA PACIFIC: SINGLE-USE CONNECTORS MARKET, BY COUNTRY, 2023–2030 (USD MILLION)
TABLE 320
LATIN AMERICA: SINGLE-USE CONNECTORS MARKET, BY COUNTRY, 2023–2030 (USD MILLION)
TABLE 321
MIDDLE EAST: SINGLE-USE CONNECTORS MARKET, BY REGION, 2023–2030 (USD MILLION)
TABLE 322
GCC COUNTRIES: SINGLE-USE CONNECTORS MARKET, BY COUNTRY, 2023–2030 (USD MILLION)
TABLE 323
SINGLE-USE DISCONNECTORS MARKET, BY REGION, 2023–2030 (USD MILLION)
TABLE 324
NORTH AMERICA: SINGLE-USE DISCONNECTORS MARKET, BY COUNTRY, 2023–2030 (USD MILLION)
TABLE 325
EUROPE: SINGLE-USE DISCONNECTORS MARKET, BY COUNTRY, 2023–2030 (USD MILLION)
TABLE 326
ASIA PACIFIC: SINGLE-USE DISCONNECTORS MARKET, BY COUNTRY, 2023–2030 (USD MILLION)
TABLE 327
LATIN AMERICA: SINGLE-USE DISCONNECTORS MARKET, BY COUNTRY, 2023–2030 (USD MILLION)
TABLE 328
MIDDLE EAST: SINGLE-USE DISCONNECTORS MARKET, BY REGION, 2023–2030 (USD MILLION)
TABLE 329
GCC COUNTRIES: SINGLE-USE DISCONNECTORS MARKET, BY COUNTRY, 2023–2030 (USD MILLION)
TABLE 330
SINGLE-USE ADAPTORS MARKET, BY REGION, 2023–2030 (USD MILLION)
TABLE 331
NORTH AMERICA: SINGLE-USE ADAPTORS MARKET, BY COUNTRY, 2023–2030 (USD MILLION)
TABLE 332
EUROPE: SINGLE-USE ADAPTORS MARKET, BY COUNTRY, 2023–2030 (USD MILLION)
TABLE 333
ASIA PACIFIC: SINGLE-USE ADAPTORS MARKET, BY COUNTRY, 2023–2030 (USD MILLION)
TABLE 334
LATIN AMERICA: SINGLE-USE ADAPTORS MARKET, BY COUNTRY, 2023–2030 (USD MILLION)
TABLE 335
MIDDLE EAST: SINGLE-USE ADAPTORS MARKET, BY REGION, 2023–2030 (USD MILLION)
TABLE 336
GCC COUNTRIES: SINGLE-USE ADAPTORS MARKET, BY COUNTRY, 2023–2030 (USD MILLION)
TABLE 337
SINGLE-USE VALVES MARKET, BY REGION, 2023–2030 (USD MILLION)
TABLE 338
NORTH AMERICA: SINGLE-USE VALVES MARKET, BY COUNTRY, 2023–2030 (USD MILLION)
TABLE 339
EUROPE: SINGLE-USE VALVES MARKET, BY COUNTRY, 2023–2030 (USD MILLION)
TABLE 340
ASIA PACIFIC: SINGLE-USE VALVES MARKET, BY COUNTRY, 2023–2030 (USD MILLION)
TABLE 341
LATIN AMERICA: SINGLE-USE VALVES MARKET, BY COUNTRY, 2023–2030 (USD MILLION)
TABLE 342
MIDDLE EAST: SINGLE-USE VALVES MARKET, BY REGION, 2023–2030 (USD MILLION)
TABLE 343
GCC COUNTRIES: SINGLE-USE VALVES MARKET, BY COUNTRY, 2023–2030 (USD MILLION)
TABLE 344
OTHER CONSUMABLES MARKET, BY REGION, 2023–2030 (USD MILLION)
TABLE 345
NORTH AMERICA: OTHER CONSUMABLES MARKET, BY COUNTRY, 2023–2030 (USD MILLION)
TABLE 346
EUROPE: OTHER CONSUMABLES MARKET, BY COUNTRY, 2023–2030 (USD MILLION)
TABLE 347
ASIA PACIFIC: OTHER CONSUMABLES MARKET, BY COUNTRY, 2023–2030 (USD MILLION)
TABLE 348
LATIN AMERICA: OTHER CONSUMABLES MARKET, BY COUNTRY, 2023–2030 (USD MILLION)
TABLE 349
MIDDLE EAST: OTHER CONSUMABLES MARKET, BY REGION, 2023–2030 (USD MILLION)
TABLE 350
GCC COUNTRIES: OTHER CONSUMABLES MARKET, BY COUNTRY, 2023–2030 (USD MILLION)
TABLE 351
SINGLE-USE BIOPROCESSING MARKET, BY APPLICATION, 2023–2030 (USD MILLION)
TABLE 352
SINGLE-USE BIOPROCESSING MARKET FOR FILTRATION, BY REGION, 2023–2030 (USD MILLION)
TABLE 353
NORTH AMERICA: SINGLE-USE BIOPROCESSING MARKET FOR FILTRATION, BY COUNTRY, 2023–2030 (USD MILLION)
TABLE 354
EUROPE: SINGLE-USE BIOPROCESSING MARKET FOR FILTRATION, BY COUNTRY, 2023–2030 (USD MILLION)
TABLE 355
ASIA PACIFIC: SINGLE-USE BIOPROCESSING MARKET FOR FILTRATION, BY COUNTRY, 2023–2030 (USD MILLION)
TABLE 356
LATIN AMERICA: SINGLE-USE BIOPROCESSING MARKET FOR FILTRATION, BY COUNTRY, 2023–2030 (USD MILLION)
TABLE 357
MIDDLE EAST: SINGLE-USE BIOPROCESSING MARKET FOR FILTRATION, BY REGION, 2023–2030 (USD MILLION)
TABLE 358
GCC COUNTRIES: SINGLE-USE BIOPROCESSING MARKET FOR FILTRATION, BY COUNTRY, 2023–2030 (USD MILLION)
TABLE 359
SINGLE-USE BIOPROCESSING MARKET FOR CELL CULTURE, BY REGION, 2023–2030 (USD MILLION)
TABLE 360
NORTH AMERICA: SINGLE-USE BIOPROCESSING MARKET FOR CELL CULTURE, BY COUNTRY, 2023–2030 (USD MILLION)
TABLE 361
EUROPE: SINGLE-USE BIOPROCESSING MARKET FOR CELL CULTURE, BY COUNTRY, 2023–2030 (USD MILLION)
TABLE 362
ASIA PACIFIC: SINGLE-USE BIOPROCESSING MARKET FOR CELL CULTURE, BY COUNTRY, 2023–2030 (USD MILLION)
TABLE 363
LATIN AMERICA: SINGLE-USE BIOPROCESSING MARKET FOR CELL CULTURE, BY COUNTRY, 2023–2030 (USD MILLION)
TABLE 364
MIDDLE EAST: SINGLE-USE BIOPROCESSING MARKET FOR CELL CULTURE, BY REGION, 2023–2030 (USD MILLION)
TABLE 365
GCC COUNTRIES: SINGLE-USE BIOPROCESSING MARKET FOR CELL CULTURE, BY COUNTRY, 2023–2030 (USD MILLION)
TABLE 366
SINGLE-USE BIOPROCESSING MARKET FOR MIXING, BY REGION, 2023–2030 (USD MILLION)
TABLE 367
NORTH AMERICA: SINGLE-USE BIOPROCESSING MARKET FOR MIXING, BY COUNTRY, 2023–2030 (USD MILLION)
TABLE 368
EUROPE: SINGLE-USE BIOPROCESSING MARKET FOR MIXING, BY COUNTRY, 2023–2030 (USD MILLION)
TABLE 369
ASIA PACIFIC: SINGLE-USE BIOPROCESSING MARKET FOR MIXING, BY COUNTRY, 2023–2030 (USD MILLION)
TABLE 370
LATIN AMERICA: SINGLE-USE BIOPROCESSING MARKET FOR MIXING, BY COUNTRY, 2023–2030 (USD MILLION)
TABLE 371
MIDDLE EAST: SINGLE-USE BIOPROCESSING MARKET FOR MIXING, BY REGION, 2023–2030 (USD MILLION)
TABLE 372
GCC COUNTRIES: SINGLE-USE BIOPROCESSING MARKET FOR MIXING, BY COUNTRY, 2023–2030 (USD MILLION)
TABLE 373
SINGLE-USE BIOPROCESSING MARKET FOR PURIFICATION, BY REGION, 2023–2030 (USD MILLION)
TABLE 374
NORTH AMERICA: SINGLE-USE BIOPROCESSING MARKET FOR PURIFICATION, BY COUNTRY, 2023–2030 (USD MILLION)
TABLE 375
EUROPE: SINGLE-USE BIOPROCESSING MARKET FOR PURIFICATION, BY COUNTRY, 2023–2030 (USD MILLION)
TABLE 376
ASIA PACIFIC: SINGLE-USE BIOPROCESSING MARKET FOR PURIFICATION, BY COUNTRY, 2023–2030 (USD MILLION)
TABLE 377
LATIN AMERICA: SINGLE-USE BIOPROCESSING MARKET FOR PURIFICATION, BY COUNTRY, 2023–2030 (USD MILLION)
TABLE 378
MIDDLE EAST: SINGLE-USE BIOPROCESSING MARKET FOR PURIFICATION, BY REGION, 2023–2030 (USD MILLION)
TABLE 379
GCC COUNTRIES: SINGLE-USE BIOPROCESSING MARKET FOR PURIFICATION, BY COUNTRY, 2023–2030 (USD MILLION)
TABLE 380
SINGLE-USE BIOPROCESSING MARKET FOR STORAGE & TRANSFER, BY REGION, 2023–2030 (USD MILLION)
TABLE 381
NORTH AMERICA: SINGLE-USE BIOPROCESSING MARKET FOR STORAGE & TRANSFER, BY COUNTRY, 2023–2030 (USD MILLION)
TABLE 382
EUROPE: SINGLE-USE BIOPROCESSING MARKET FOR STORAGE & TRANSFER, BY COUNTRY, 2023–2030 (USD MILLION)
TABLE 383
ASIA PACIFIC: SINGLE-USE BIOPROCESSING MARKET FOR STORAGE & TRANSFER, BY COUNTRY, 2023–2030 (USD MILLION)
TABLE 384
LATIN AMERICA: SINGLE-USE BIOPROCESSING MARKET FOR STORAGE & TRANSFER, BY COUNTRY, 2023–2030 (USD MILLION)
TABLE 385
MIDDLE EAST: SINGLE-USE BIOPROCESSING MARKET FOR STORAGE & TRANSFER, BY REGION, 2023–2030 (USD MILLION)
TABLE 386
GCC COUNTRIES: SINGLE-USE BIOPROCESSING MARKET FOR STORAGE & TRANSFER, BY COUNTRY, 2023–2030 (USD MILLION)
TABLE 387
SINGLE-USE BIOPROCESSING MARKET FOR OTHER APPLICATIONS, BY REGION, 2023–2030 (USD MILLION)
TABLE 388
NORTH AMERICA: SINGLE-USE BIOPROCESSING MARKET FOR OTHER APPLICATIONS, BY COUNTRY, 2023–2030 (USD MILLION)
TABLE 389
EUROPE: SINGLE-USE BIOPROCESSING MARKET FOR OTHER APPLICATIONS, BY COUNTRY, 2023–2030 (USD MILLION)
TABLE 390
ASIA PACIFIC: SINGLE-USE BIOPROCESSING MARKET FOR OTHER APPLICATIONS, BY COUNTRY, 2023–2030 (USD MILLION)
TABLE 391
LATIN AMERICA: SINGLE-USE BIOPROCESSING MARKET FOR OTHER APPLICATIONS, BY COUNTRY, 2023–2030 (USD MILLION)
TABLE 392
MIDDLE EAST: SINGLE-USE BIOPROCESSING MARKET FOR OTHER APPLICATIONS, BY REGION, 2023–2030 (USD MILLION)
TABLE 393
GCC COUNTRIES: SINGLE-USE BIOPROCESSING MARKET FOR OTHER APPLICATIONS, BY COUNTRY, 2023–2030 (USD MILLION)
TABLE 394
SINGLE-USE BIOPROCESSING MARKET, BY WORKFLOW, 2023–2030 (USD MILLION)
TABLE 395
SINGLE-USE UPSTREAM BIOPROCESSING MARKET, BY REGION, 2023–2030 (USD MILLION)
TABLE 396
NORTH AMERICA: SINGLE-USE UPSTREAM BIOPROCESSING MARKET, BY COUNTRY, 2023–2030 (USD MILLION)
TABLE 397
EUROPE: SINGLE-USE UPSTREAM BIOPROCESSING MARKET, BY COUNTRY, 2023–2030 (USD MILLION)
TABLE 398
ASIA PACIFIC: SINGLE-USE UPSTREAM BIOPROCESSING MARKET, BY COUNTRY, 2023–2030 (USD MILLION)
TABLE 399
LATIN AMERICA: SINGLE-USE UPSTREAM BIOPROCESSING MARKET, BY COUNTRY, 2023–2030 (USD MILLION)
TABLE 400
MIDDLE EAST: SINGLE-USE UPSTREAM BIOPROCESSING MARKET, BY REGION, 2023–2030 (USD MILLION)
TABLE 401
GCC COUNTRIES: SINGLE-USE UPSTREAM BIOPROCESSING MARKET, BY COUNTRY, 2023–2030 (USD MILLION)
TABLE 402
SINGLE-USE DOWNSTREAM BIOPROCESSING MARKET, BY REGION, 2023–2030 (USD MILLION)
TABLE 403
NORTH AMERICA: SINGLE-USE DOWNSTREAM BIOPROCESSING MARKET, BY COUNTRY, 2023–2030 (USD MILLION)
TABLE 404
EUROPE: SINGLE-USE DOWNSTREAM BIOPROCESSING MARKET, BY COUNTRY, 2023–2030 (USD MILLION)
TABLE 405
ASIA PACIFIC: SINGLE-USE DOWNSTREAM BIOPROCESSING MARKET, BY COUNTRY, 2023–2030 (USD MILLION)
TABLE 406
LATIN AMERICA: SINGLE-USE DOWNSTREAM BIOPROCESSING MARKET, BY COUNTRY, 2023–2030 (USD MILLION)
TABLE 407
MIDDLE EAST: SINGLE-USE DOWNSTREAM BIOPROCESSING MARKET, BY REGION, 2023–2030 (USD MILLION)
TABLE 408
GCC COUNTRIES: SINGLE-USE DOWNSTREAM BIOPROCESSING MARKET, BY COUNTRY, 2023–2030 (USD MILLION)
TABLE 409
SINGLE-USE BIOPROCESSING MARKET, BY MOLECULE TYPE, 2023–2030 (USD MILLION)
TABLE 410
LIST OF MONOCLONAL ANTIBODIES APPROVED BY FDA IN 2024
TABLE 411
SINGLE-USE BIOPROCESSING MARKET FOR MONOCLONAL ANTIBODIES, BY REGION, 2023–2030 (USD MILLION)
TABLE 412
NORTH AMERICA: SINGLE-USE BIOPROCESSING MARKET FOR MONOCLONAL ANTIBODIES, BY COUNTRY, 2023–2030 (USD MILLION)
TABLE 413
EUROPE: SINGLE-USE BIOPROCESSING MARKET FOR MONOCLONAL ANTIBODIES, BY COUNTRY, 2023–2030 (USD MILLION)
TABLE 414
ASIA PACIFIC: SINGLE-USE BIOPROCESSING MARKET FOR MONOCLONAL ANTIBODIES, BY COUNTRY, 2023–2030 (USD MILLION)
TABLE 415
LATIN AMERICA: SINGLE-USE BIOPROCESSING MARKET FOR MONOCLONAL ANTIBODIES, BY COUNTRY, 2023–2030 (USD MILLION)
TABLE 416
MIDDLE EAST: SINGLE-USE BIOPROCESSING MARKET FOR MONOCLONAL ANTIBODIES, BY REGION, 2023–2030 (USD MILLION)
TABLE 417
GCC COUNTRIES: SINGLE-USE BIOPROCESSING MARKET FOR MONOCLONAL ANTIBODIES, BY COUNTRY, 2023–2030 (USD MILLION)
TABLE 418
SINGLE-USE BIOPROCESSING MARKET FOR MONOCLONAL ANTIBODIES, BY PRODUCT, 2023–2030 (USD MILLION)
TABLE 419
SINGLE-USE BIOPROCESSING MARKET FOR VACCINES, BY REGION, 2023–2030 (USD MILLION)
TABLE 420
NORTH AMERICA: SINGLE-USE BIOPROCESSING MARKET FOR VACCINES, BY COUNTRY, 2023–2030 (USD MILLION)
TABLE 421
EUROPE: SINGLE-USE BIOPROCESSING MARKET FOR VACCINES, BY COUNTRY, 2023–2030 (USD MILLION)
TABLE 422
ASIA PACIFIC: SINGLE-USE BIOPROCESSING MARKET FOR VACCINES, BY COUNTRY, 2023–2030 (USD MILLION)
TABLE 423
LATIN AMERICA: SINGLE-USE BIOPROCESSING MARKET VACCINES, BY COUNTRY, 2023–2030 (USD MILLION)
TABLE 424
MIDDLE EAST: SINGLE-USE BIOPROCESSING MARKET FOR VACCINES, BY REGION, 2023–2030 (USD MILLION)
TABLE 425
GCC COUNTRIES: SINGLE-USE BIOPROCESSING MARKET FOR VACCINES, BY COUNTRY, 2023–2030 (USD MILLION)
TABLE 426
SINGLE-USE BIOPROCESSING MARKET FOR VACCINES, BY PRODUCT, 2023–2030 (USD MILLION)
TABLE 427
SINGLE-USE BIOPROCESSING MARKET FOR THERAPEUTIC PROTEINS & PEPTIDES, BY REGION, 2023–2030 (USD MILLION)
TABLE 428
NORTH AMERICA: SINGLE-USE BIOPROCESSING MARKET FOR THERAPEUTIC PROTEINS & PEPTIDES, BY COUNTRY, 2023–2030 (USD MILLION)
TABLE 429
EUROPE: SINGLE-USE BIOPROCESSING MARKET FOR THERAPEUTIC PROTEINS & PEPTIDES, BY COUNTRY, 2023–2030 (USD MILLION)
TABLE 430
ASIA PACIFIC: SINGLE-USE BIOPROCESSING MARKET FOR THERAPEUTIC PROTEINS & PEPTIDES, BY COUNTRY, 2023–2030 (USD MILLION)
TABLE 431
LATIN AMERICA: SINGLE-USE BIOPROCESSING MARKET FOR THERAPEUTIC PROTEINS & PEPTIDES, BY COUNTRY, 2023–2030 (USD MILLION)
TABLE 432
MIDDLE EAST: SINGLE-USE BIOPROCESSING MARKET FOR THERAPEUTIC PROTEINS & PEPTIDES, BY REGION, 2023–2030 (USD MILLION)
TABLE 433
GCC COUNTRIES: SINGLE-USE BIOPROCESSING MARKET FOR THERAPEUTIC PROTEINS & PEPTIDES, BY COUNTRY, 2023–2030 (USD MILLION)
TABLE 434
SINGLE-USE BIOPROCESSING MARKET FOR THERAPEUTIC PROTEINS & PEPTIDES, BY PRODUCT, 2023–2030 (USD MILLION)
TABLE 435
NATIONAL INSTITUTES OF HEALTH FUNDING FOR STEM CELL-BASED RESEARCH, 2020–2024 (USD MILLION)
TABLE 436
SINGLE-USE BIOPROCESSING MARKET FOR CELL & GENE THERAPIES, BY REGION, 2023–2030 (USD MILLION)
TABLE 437
NORTH AMERICA: SINGLE-USE BIOPROCESSING MARKET FOR CELL & GENE THERAPIES, BY COUNTRY, 2023–2030 (USD MILLION)
TABLE 438
EUROPE: SINGLE-USE BIOPROCESSING MARKET FOR CELL & GENE THERAPIES, BY COUNTRY, 2023–2030 (USD MILLION)
TABLE 439
ASIA PACIFIC: SINGLE-USE BIOPROCESSING MARKET FOR CELL & GENE THERAPIES, BY COUNTRY, 2023–2030 (USD MILLION)
TABLE 440
LATIN AMERICA: SINGLE-USE BIOPROCESSING MARKET CELL & GENE THERAPIES, BY COUNTRY, 2023–2030 (USD MILLION)
TABLE 441
MIDDLE EAST: SINGLE-USE BIOPROCESSING MARKET FOR CELL & GENE THERAPIES, BY REGION, 2023–2030 (USD MILLION)
TABLE 442
GCC COUNTRIES: SINGLE-USE BIOPROCESSING MARKET FOR CELL & GENE THERAPIES, BY COUNTRY, 2023–2030 (USD MILLION)
TABLE 443
SINGLE-USE BIOPROCESSING MARKET FOR CELL & GENE THERAPIES, BY PRODUCT, 2023–2030 (USD MILLION)
TABLE 444
SINGLE-USE BIOPROCESSING MARKET, BY END USER, 2023–2030 (USD MILLION)
TABLE 445
SINGLE-USE BIOPROCESSING MARKET FOR PHARMACEUTICAL & BIOTECHNOLOGY COMPANIES, BY REGION, 2023–2030 (USD MILLION)
TABLE 446
NORTH AMERICA: SINGLE-USE BIOPROCESSING MARKET FOR PHARMACEUTICAL & BIOTECHNOLOGY COMPANIES, BY COUNTRY, 2023–2030 (USD MILLION)
TABLE 447
EUROPE: SINGLE-USE BIOPROCESSING MARKET FOR PHARMACEUTICAL & BIOTECHNOLOGY COMPANIES, BY COUNTRY, 2023–2030 (USD MILLION)
TABLE 448
ASIA PACIFIC: SINGLE-USE BIOPROCESSING MARKET FOR PHARMACEUTICAL & BIOTECHNOLOGY COMPANIES, BY COUNTRY, 2023–2030 (USD MILLION)
TABLE 449
LATIN AMERICA: SINGLE-USE BIOPROCESSING MARKET FOR PHARMACEUTICAL & BIOTECHNOLOGY COMPANIES, BY COUNTRY, 2023–2030 (USD MILLION)
TABLE 450
MIDDLE EAST: SINGLE-USE BIOPROCESSING MARKET FOR PHARMACEUTICAL & BIOTECHNOLOGY COMPANIES, BY REGION, 2023–2030 (USD MILLION)
TABLE 451
GCC COUNTRIES: SINGLE-USE BIOPROCESSING MARKET FOR PHARMACEUTICAL & BIOTECHNOLOGY COMPANIES, BY COUNTRY, 2023–2030 (USD MILLION)
TABLE 452
SINGLE-USE BIOPROCESSING MARKET FOR CROS & CMOS, BY REGION, 2023–2030 (USD MILLION)
TABLE 453
NORTH AMERICA: SINGLE-USE BIOPROCESSING MARKET FOR CROS & CMOS, BY COUNTRY, 2023–2030 (USD MILLION)
TABLE 454
EUROPE: SINGLE-USE BIOPROCESSING MARKET FOR CROS & CMOS, BY COUNTRY, 2023–2030 (USD MILLION)
TABLE 455
ASIA PACIFIC: SINGLE-USE BIOPROCESSING MARKET FOR CROS & CMOS, BY COUNTRY, 2023–2030 (USD MILLION)
TABLE 456
LATIN AMERICA: SINGLE-USE BIOPROCESSING MARKET CROS & CMOS, BY COUNTRY, 2023–2030 (USD MILLION)
TABLE 457
MIDDLE EAST: SINGLE-USE BIOPROCESSING MARKET FOR CROS & CMOS, BY REGION, 2023–2030 (USD MILLION)
TABLE 458
GCC COUNTRIES: SINGLE-USE BIOPROCESSING MARKET FOR CROS & CMOS, BY COUNTRY, 2023–2030 (USD MILLION)
TABLE 459
SINGLE-USE BIOPROCESSING MARKET FOR OTHER END USERS, BY REGION, 2023–2030 (USD MILLION)
TABLE 460
NORTH AMERICA: SINGLE-USE BIOPROCESSING MARKET FOR OTHER END USERS, BY COUNTRY, 2023–2030 (USD MILLION)
TABLE 461
EUROPE: SINGLE-USE BIOPROCESSING MARKET FOR OTHER END USERS, BY COUNTRY, 2023–2030 (USD MILLION)
TABLE 462
ASIA PACIFIC: SINGLE-USE BIOPROCESSING MARKET FOR OTHER END USERS, BY COUNTRY, 2023–2030 (USD MILLION)
TABLE 463
LATIN AMERICA: SINGLE-USE BIOPROCESSING MARKET FOR OTHER END USERS, BY COUNTRY, 2023–2030 (USD MILLION)
TABLE 464
MIDDLE EAST: SINGLE-USE BIOPROCESSING MARKET FOR OTHER END USERS, BY REGION, 2023–2030 (USD MILLION)
TABLE 465
GCC COUNTRIES: SINGLE-USE BIOPROCESSING MARKET FOR OTHER END USERS, BY COUNTRY, 2023–2030 (USD MILLION)
TABLE 466
SINGLE-USE BIOPROCESSING MARKET, BY REGION, 2023–2030 (USD MILLION)
TABLE 467
NORTH AMERICA: KEY MACROINDICATORS
TABLE 468
NORTH AMERICA: SINGLE-USE BIOPROCESSING MARKET, BY COUNTRY, 2023–2030 (USD MILLION)
TABLE 469
NORTH AMERICA: SINGLE-USE BIOPROCESSING MARKET, BY PRODUCT, 2023–2030 (USD MILLION)
TABLE 470
NORTH AMERICA: SINGLE-USE BIOPROCESSING EQUIPMENT MARKET, BY TYPE, 2023–2030 (USD MILLION)
TABLE 471
NORTH AMERICA: SINGLE-USE BIOPROCESSING CONSUMABLES MARKET, BY TYPE, 2023–2030 (USD MILLION)
TABLE 472
NORTH AMERICA: SINGLE-USE BIOPROCESSING MARKET, BY APPLICATION, 2023–2030 (USD MILLION)
TABLE 473
NORTH AMERICA: SINGLE-USE BIOPROCESSING MARKET, BY WORKFLOW, 2023–2030 (USD MILLION)
TABLE 474
NORTH AMERICA: SINGLE-USE BIOPROCESSING MARKET, BY MOLECULE TYPE, 2023–2030 (USD MILLION)
TABLE 475
NORTH AMERICA: SINGLE-USE BIOPROCESSING MARKET, BY END USER, 2023–2030 (USD MILLION)
TABLE 476
US: SINGLE-USE BIOPROCESSING MARKET, BY PRODUCT, 2023–2030 (USD MILLION)
TABLE 477
US: SINGLE-USE BIOPROCESSING EQUIPMENT MARKET, BY TYPE, 2023–2030 (USD MILLION)
TABLE 478
US: SINGLE-USE BIOPROCESSING CONSUMABLES MARKET, BY TYPE, 2023–2030 (USD MILLION)
TABLE 479
US: SINGLE-USE BIOPROCESSING MARKET, BY APPLICATION, 2023–2030 (USD MILLION)
TABLE 480
US: SINGLE-USE BIOPROCESSING MARKET, BY WORKFLOW, 2023–2030 (USD MILLION)
TABLE 481
US: SINGLE-USE BIOPROCESSING MARKET, BY MOLECULE TYPE, 2023–2030 (USD MILLION)
TABLE 482
US: SINGLE-USE BIOPROCESSING MARKET, BY END USER, 2023–2030 (USD MILLION)
TABLE 483
CANADA: SINGLE-USE BIOPROCESSING MARKET, BY PRODUCT, 2023–2030 (USD MILLION)
TABLE 484
CANADA: SINGLE-USE BIOPROCESSING EQUIPMENT MARKET, BY TYPE, 2023–2030 (USD MILLION)
TABLE 485
CANADA: SINGLE-USE BIOPROCESSING CONSUMABLES MARKET, BY TYPE, 2023–2030 (USD MILLION)
TABLE 486
CANADA: SINGLE-USE BIOPROCESSING MARKET, BY APPLICATION, 2023–2030 (USD MILLION)
TABLE 487
CANADA: SINGLE-USE BIOPROCESSING MARKET, BY WORKFLOW, 2023–2030 (USD MILLION)
TABLE 488
CANADA: SINGLE-USE BIOPROCESSING MARKET, BY MOLECULE TYPE, 2023–2030 (USD MILLION)
TABLE 489
CANADA: SINGLE-USE BIOPROCESSING MARKET, BY END USER, 2023–2030 (USD MILLION)
TABLE 490
EUROPE: KEY MACROINDICATORS
TABLE 491
EUROPE: SINGLE-USE BIOPROCESSING MARKET, BY COUNTRY, 2023–2030 (USD MILLION)
TABLE 492
EUROPE: SINGLE-USE BIOPROCESSING MARKET, BY PRODUCT, 2023–2030 (USD MILLION)
TABLE 493
EUROPE: SINGLE-USE BIOPROCESSING EQUIPMENT MARKET, BY TYPE, 2023–2030 (USD MILLION)
TABLE 494
EUROPE: SINGLE-USE BIOPROCESSING CONSUMABLES MARKET, BY TYPE, 2023–2030 (USD MILLION)
TABLE 495
EUROPE: SINGLE-USE BIOPROCESSING MARKET, BY APPLICATION, 2023–2030 (USD MILLION)
TABLE 496
EUROPE: SINGLE-USE BIOPROCESSING MARKET, BY WORKFLOW, 2023–2030 (USD MILLION)
TABLE 497
EUROPE: SINGLE-USE BIOPROCESSING MARKET, BY MOLECULE TYPE, 2023–2030 (USD MILLION)
TABLE 498
EUROPE: SINGLE-USE BIOPROCESSING MARKET, BY END USER, 2023–2030 (USD MILLION)
TABLE 499
GERMANY: SINGLE-USE BIOPROCESSING MARKET, BY PRODUCT, 2023–2030 (USD MILLION)
TABLE 500
GERMANY: SINGLE-USE BIOPROCESSING EQUIPMENT MARKET, BY TYPE, 2023–2030 (USD MILLION)
TABLE 501
GERMANY: SINGLE-USE BIOPROCESSING CONSUMABLES MARKET, BY TYPE, 2023–2030 (USD MILLION)
TABLE 502
GERMANY: SINGLE-USE BIOPROCESSING MARKET, BY APPLICATION, 2023–2030 (USD MILLION)
TABLE 503
GERMANY: SINGLE-USE BIOPROCESSING MARKET, BY WORKFLOW, 2023–2030 (USD MILLION)
TABLE 504
GERMANY: SINGLE-USE BIOPROCESSING MARKET, BY MOLECULE TYPE, 2023–2030 (USD MILLION)
TABLE 505
GERMANY: SINGLE-USE BIOPROCESSING MARKET, BY END USER, 2023–2030 (USD MILLION)
TABLE 506
UK: SINGLE-USE BIOPROCESSING MARKET, BY PRODUCT, 2023–2030 (USD MILLION)
TABLE 507
UK: SINGLE-USE BIOPROCESSING EQUIPMENT MARKET, BY TYPE, 2023–2030 (USD MILLION)
TABLE 508
UK: SINGLE-USE BIOPROCESSING CONSUMABLES MARKET, BY TYPE, 2023–2030 (USD MILLION)
TABLE 509
UK: SINGLE-USE BIOPROCESSING MARKET, BY APPLICATION, 2023–2030 (USD MILLION)
TABLE 510
UK: SINGLE-USE BIOPROCESSING MARKET, BY WORKFLOW, 2023–2030 (USD MILLION)
TABLE 511
UK: SINGLE-USE BIOPROCESSING MARKET, BY MOLECULE TYPE, 2023–2030 (USD MILLION)
TABLE 512
UK: SINGLE-USE BIOPROCESSING MARKET, BY END USER, 2023–2030 (USD MILLION)
TABLE 513
FRANCE: SINGLE-USE BIOPROCESSING MARKET, BY PRODUCT, 2023–2030 (USD MILLION)
TABLE 514
FRANCE: SINGLE-USE BIOPROCESSING EQUIPMENT MARKET, BY TYPE, 2023–2030 (USD MILLION)
TABLE 515
FRANCE: SINGLE-USE BIOPROCESSING CONSUMABLES MARKET, BY TYPE, 2023–2030 (USD MILLION)
TABLE 516
FRANCE: SINGLE-USE BIOPROCESSING MARKET, BY APPLICATION, 2023–2030 (USD MILLION)
TABLE 517
FRANCE: SINGLE-USE BIOPROCESSING MARKET, BY WORKFLOW, 2023–2030 (USD MILLION)
TABLE 518
FRANCE: SINGLE-USE BIOPROCESSING MARKET, BY MOLECULE TYPE, 2023–2030 (USD MILLION)
TABLE 519
FRANCE: SINGLE-USE BIOPROCESSING MARKET, BY END USER, 2023–2030 (USD MILLION)
TABLE 520
ITALY: SINGLE-USE BIOPROCESSING MARKET, BY PRODUCT, 2023–2030 (USD MILLION)
TABLE 521
ITALY: SINGLE-USE BIOPROCESSING EQUIPMENT MARKET, BY TYPE, 2023–2030 (USD MILLION)
TABLE 522
ITALY: SINGLE-USE BIOPROCESSING CONSUMABLES MARKET, BY TYPE, 2023–2030 (USD MILLION)
TABLE 523
ITALY: SINGLE-USE BIOPROCESSING MARKET, BY APPLICATION, 2023–2030 (USD MILLION)
TABLE 524
ITALY: SINGLE-USE BIOPROCESSING MARKET, BY WORKFLOW, 2023–2030 (USD MILLION)
TABLE 525
ITALY: SINGLE-USE BIOPROCESSING MARKET, BY MOLECULE TYPE, 2023–2030 (USD MILLION)
TABLE 526
ITALY: SINGLE-USE BIOPROCESSING MARKET, BY END USER, 2023–2030 (USD MILLION)
TABLE 527
SPAIN: SINGLE-USE BIOPROCESSING MARKET, BY PRODUCT, 2023–2030 (USD MILLION)
TABLE 528
SPAIN: SINGLE-USE BIOPROCESSING EQUIPMENT MARKET, BY TYPE, 2023–2030 (USD MILLION)
TABLE 529
SPAIN: SINGLE-USE BIOPROCESSING CONSUMABLES MARKET, BY TYPE, 2023–2030 (USD MILLION)
TABLE 530
SPAIN: SINGLE-USE BIOPROCESSING MARKET, BY APPLICATION, 2023–2030 (USD MILLION)
TABLE 531
SPAIN: SINGLE-USE BIOPROCESSING MARKET, BY WORKFLOW, 2023–2030 (USD MILLION)
TABLE 532
SPAIN: SINGLE-USE BIOPROCESSING MARKET, BY MOLECULE TYPE, 2023–2030 (USD MILLION)
TABLE 533
SPAIN: SINGLE-USE BIOPROCESSING MARKET, BY END USER, 2023–2030 (USD MILLION)
TABLE 534
REST OF EUROPE: SINGLE-USE BIOPROCESSING MARKET, BY PRODUCT, 2023–2030 (USD MILLION)
TABLE 535
REST OF EUROPE: SINGLE-USE BIOPROCESSING EQUIPMENT MARKET, BY TYPE, 2023–2030 (USD MILLION)
TABLE 536
REST OF EUROPE: SINGLE-USE BIOPROCESSING CONSUMABLES MARKET, BY TYPE, 2023–2030 (USD MILLION)
TABLE 537
REST OF EUROPE: SINGLE-USE BIOPROCESSING MARKET, BY APPLICATION, 2023–2030 (USD MILLION)
TABLE 538
REST OF EUROPE: SINGLE-USE BIOPROCESSING MARKET, BY WORKFLOW, 2023–2030 (USD MILLION)
TABLE 539
REST OF EUROPE: SINGLE-USE BIOPROCESSING MARKET, BY MOLECULE TYPE, 2023–2030 (USD MILLION)
TABLE 540
REST OF EUROPE: SINGLE-USE BIOPROCESSING MARKET, BY END USER, 2023–2030 (USD MILLION)
TABLE 541
ASIA PACIFIC: KEY MACROINDICATORS
TABLE 542
ASIA PACIFIC: SINGLE-USE BIOPROCESSING MARKET, BY COUNTRY, 2023–2030 (USD MILLION)
TABLE 543
ASIA PACIFIC: SINGLE-USE BIOPROCESSING MARKET, BY PRODUCT, 2023–2030 (USD MILLION)
TABLE 544
ASIA PACIFIC: SINGLE-USE BIOPROCESSING EQUIPMENT MARKET, BY TYPE, 2023–2030 (USD MILLION)
TABLE 545
ASIA PACIFIC: SINGLE-USE BIOPROCESSING CONSUMABLES MARKET, BY TYPE, 2023–2030 (USD MILLION)
TABLE 546
ASIA PACIFIC: SINGLE-USE BIOPROCESSING MARKET, BY APPLICATION, 2023–2030 (USD MILLION)
TABLE 547
ASIA PACIFIC: SINGLE-USE BIOPROCESSING MARKET, BY WORKFLOW, 2023–2030 (USD MILLION)
TABLE 548
ASIA PACIFIC: SINGLE-USE BIOPROCESSING MARKET, BY MOLECULE TYPE, 2023–2030 (USD MILLION)
TABLE 549
ASIA PACIFIC: SINGLE-USE BIOPROCESSING MARKET, BY END USER, 2023–2030 (USD MILLION)
TABLE 550
CHINA: SINGLE-USE BIOPROCESSING MARKET, BY PRODUCT, 2023–2030 (USD MILLION)
TABLE 551
CHINA: SINGLE-USE BIOPROCESSING EQUIPMENT MARKET, BY TYPE, 2023–2030 (USD MILLION)
TABLE 552
CHINA: SINGLE-USE BIOPROCESSING CONSUMABLES MARKET, BY TYPE, 2023–2030 (USD MILLION)
TABLE 553
CHINA: SINGLE-USE BIOPROCESSING MARKET, BY APPLICATION, 2023–2030 (USD MILLION)
TABLE 554
CHINA: SINGLE-USE BIOPROCESSING MARKET, BY WORKFLOW, 2023–2030 (USD MILLION)
TABLE 555
CHINA: SINGLE-USE BIOPROCESSING MARKET, BY MOLECULE TYPE, 2023–2030 (USD MILLION)
TABLE 556
CHINA: SINGLE-USE BIOPROCESSING MARKET, BY END USER, 2023–2030 (USD MILLION)
TABLE 557
SOUTH KOREA: SINGLE-USE BIOPROCESSING MARKET, BY PRODUCT, 2023–2030 (USD MILLION)
TABLE 558
SOUTH KOREA: SINGLE-USE BIOPROCESSING EQUIPMENT MARKET, BY TYPE, 2023–2030 (USD MILLION)
TABLE 559
SOUTH KOREA: SINGLE-USE BIOPROCESSING CONSUMABLES MARKET, BY TYPE, 2023–2030 (USD MILLION)
TABLE 560
SOUTH KOREA: SINGLE-USE BIOPROCESSING MARKET, BY APPLICATION, 2023–2030 (USD MILLION)
TABLE 561
SOUTH KOREA: SINGLE-USE BIOPROCESSING MARKET, BY WORKFLOW, 2023–2030 (USD MILLION)
TABLE 562
SOUTH KOREA: SINGLE-USE BIOPROCESSING MARKET, BY MOLECULE TYPE, 2023–2030 (USD MILLION)
TABLE 563
SOUTH KOREA: SINGLE-USE BIOPROCESSING MARKET, BY END USER, 2023–2030 (USD MILLION)
TABLE 564
JAPAN: SINGLE-USE BIOPROCESSING MARKET, BY PRODUCT, 2023–2030 (USD MILLION)
TABLE 565
JAPAN: SINGLE-USE BIOPROCESSING EQUIPMENT MARKET, BY TYPE, 2023–2030 (USD MILLION)
TABLE 566
JAPAN: SINGLE-USE BIOPROCESSING CONSUMABLES MARKET, BY TYPE, 2023–2030 (USD MILLION)
TABLE 567
JAPAN: SINGLE-USE BIOPROCESSING MARKET, BY APPLICATION, 2023–2030 (USD MILLION)
TABLE 568
JAPAN: SINGLE-USE BIOPROCESSING MARKET, BY WORKFLOW, 2023–2030 (USD MILLION)
TABLE 569
JAPAN: SINGLE-USE BIOPROCESSING MARKET, BY MOLECULE TYPE, 2023–2030 (USD MILLION)
TABLE 570
JAPAN: SINGLE-USE BIOPROCESSING MARKET, BY END USER, 2023–2030 (USD MILLION)
TABLE 571
INDIA: SINGLE-USE BIOPROCESSING MARKET, BY PRODUCT, 2023–2030 (USD MILLION)
TABLE 572
INDIA: SINGLE-USE BIOPROCESSING EQUIPMENT MARKET, BY TYPE, 2023–2030 (USD MILLION)
TABLE 573
INDIA: SINGLE-USE BIOPROCESSING CONSUMABLES MARKET, BY TYPE, 2023–2030 (USD MILLION)
TABLE 574
INDIA: SINGLE-USE BIOPROCESSING MARKET, BY APPLICATION, 2023–2030 (USD MILLION)
TABLE 575
INDIA: SINGLE-USE BIOPROCESSING MARKET, BY WORKFLOW, 2023–2030 (USD MILLION)
TABLE 576
INDIA: SINGLE-USE BIOPROCESSING MARKET, BY MOLECULE TYPE, 2023–2030 (USD MILLION)
TABLE 577
INDIA: SINGLE-USE BIOPROCESSING MARKET, BY END USER, 2023–2030 (USD MILLION)
TABLE 578
AUSTRALIA: SINGLE-USE BIOPROCESSING MARKET, BY PRODUCT, 2023–2030 (USD MILLION)
TABLE 579
AUSTRALIA: SINGLE-USE BIOPROCESSING EQUIPMENT MARKET, BY TYPE, 2023–2030 (USD MILLION)
TABLE 580
AUSTRALIA: SINGLE-USE BIOPROCESSING CONSUMABLES MARKET, BY TYPE, 2023–2030 (USD MILLION)
TABLE 581
AUSTRALIA: SINGLE-USE BIOPROCESSING MARKET, BY APPLICATION, 2023–2030 (USD MILLION)
TABLE 582
AUSTRALIA: SINGLE-USE BIOPROCESSING MARKET, BY WORKFLOW, 2023–2030 (USD MILLION)
TABLE 583
AUSTRALIA: SINGLE-USE BIOPROCESSING MARKET, BY MOLECULE TYPE, 2023–2030 (USD MILLION)
TABLE 584
AUSTRALIA: SINGLE-USE BIOPROCESSING MARKET, BY END USER, 2023–2030 (USD MILLION)
TABLE 585
REST OF ASIA PACIFIC: SINGLE-USE BIOPROCESSING MARKET, BY PRODUCT, 2023–2030 (USD MILLION)
TABLE 586
REST OF ASIA PACIFIC: SINGLE-USE BIOPROCESSING EQUIPMENT MARKET, BY TYPE, 2023–2030 (USD MILLION)
TABLE 587
REST OF ASIA PACIFIC: SINGLE-USE BIOPROCESSING CONSUMABLES MARKET, BY TYPE, 2023–2030 (USD MILLION)
TABLE 588
REST OF ASIA PACIFIC: SINGLE-USE BIOPROCESSING MARKET, BY APPLICATION, 2023–2030 (USD MILLION)
TABLE 589
REST OF ASIA PACIFIC: SINGLE-USE BIOPROCESSING MARKET, BY WORKFLOW, 2023–2030 (USD MILLION)
TABLE 590
REST OF ASIA PACIFIC: SINGLE-USE BIOPROCESSING MARKET, BY MOLECULE TYPE, 2023–2030 (USD MILLION)
TABLE 591
REST OF ASIA PACIFIC: SINGLE-USE BIOPROCESSING MARKET, BY END USER, 2023–2030 (USD MILLION)
TABLE 592
LATIN AMERICA: KEY MACROINDICATORS
TABLE 593
LATIN AMERICA: SINGLE-USE BIOPROCESSING MARKET, BY COUNTRY, 2023–2030 (USD MILLION)
TABLE 594
LATIN AMERICA: SINGLE-USE BIOPROCESSING MARKET, BY PRODUCT, 2023–2030 (USD MILLION)
TABLE 595
LATIN AMERICA: SINGLE-USE BIOPROCESSING EQUIPMENT MARKET, BY TYPE, 2023–2030 (USD MILLION)
TABLE 596
LATIN AMERICA: SINGLE-USE BIOPROCESSING CONSUMABLES MARKET, BY TYPE, 2023–2030 (USD MILLION)
TABLE 597
LATIN AMERICA: SINGLE-USE BIOPROCESSING MARKET, BY APPLICATION, 2023–2030 (USD MILLION)
TABLE 598
LATIN AMERICA: SINGLE-USE BIOPROCESSING MARKET, BY WORKFLOW, 2023–2030 (USD MILLION)
TABLE 599
LATIN AMERICA: SINGLE-USE BIOPROCESSING MARKET, BY MOLECULE TYPE, 2023–2030 (USD MILLION)
TABLE 600
LATIN AMERICA: SINGLE-USE BIOPROCESSING MARKET, BY END USER, 2023–2030 (USD MILLION)
TABLE 601
BRAZIL: SINGLE-USE BIOPROCESSING MARKET, BY PRODUCT, 2023–2030 (USD MILLION)
TABLE 602
BRAZIL: SINGLE-USE BIOPROCESSING EQUIPMENT MARKET, BY TYPE, 2023–2030 (USD MILLION)
TABLE 603
BRAZIL: SINGLE-USE BIOPROCESSING CONSUMABLES MARKET, BY TYPE, 2023–2030 (USD MILLION)
TABLE 604
BRAZIL: SINGLE-USE BIOPROCESSING MARKET, BY APPLICATION, 2023–2030 (USD MILLION)
TABLE 605
BRAZIL: SINGLE-USE BIOPROCESSING MARKET, BY WORKFLOW, 2023–2030 (USD MILLION)
TABLE 606
BRAZIL: SINGLE-USE BIOPROCESSING MARKET, BY MOLECULE TYPE, 2023–2030 (USD MILLION)
TABLE 607
BRAZIL: SINGLE-USE BIOPROCESSING MARKET, BY END USER, 2023–2030 (USD MILLION)
TABLE 608
MEXICO: SINGLE-USE BIOPROCESSING MARKET, BY PRODUCT, 2023–2030 (USD MILLION)
TABLE 609
MEXICO: SINGLE-USE BIOPROCESSING EQUIPMENT MARKET, BY TYPE, 2023–2030 (USD MILLION)
TABLE 610
MEXICO: SINGLE-USE BIOPROCESSING CONSUMABLES MARKET, BY TYPE, 2023–2030 (USD MILLION)
TABLE 611
MEXICO: SINGLE-USE BIOPROCESSING MARKET, BY APPLICATION, 2023–2030 (USD MILLION)
TABLE 612
MEXICO: SINGLE-USE BIOPROCESSING MARKET, BY WORKFLOW, 2023–2030 (USD MILLION)
TABLE 613
MEXICO: SINGLE-USE BIOPROCESSING MARKET, BY MOLECULE TYPE, 2023–2030 (USD MILLION)
TABLE 614
MEXICO: SINGLE-USE BIOPROCESSING MARKET, BY END USER, 2023–2030 (USD MILLION)
TABLE 615
REST OF LATIN AMERICA: SINGLE-USE BIOPROCESSING MARKET, BY PRODUCT, 2023–2030 (USD MILLION)
TABLE 616
REST OF LATIN AMERICA: SINGLE-USE BIOPROCESSING EQUIPMENT MARKET, BY TYPE, 2023–2030 (USD MILLION)
TABLE 617
REST OF LATIN AMERICA: SINGLE-USE BIOPROCESSING CONSUMABLES MARKET, BY TYPE, 2023–2030 (USD MILLION)
TABLE 618
REST OF LATIN AMERICA: SINGLE-USE BIOPROCESSING MARKET, BY APPLICATION, 2023–2030 (USD MILLION)
TABLE 619
REST OF LATIN AMERICA: SINGLE-USE BIOPROCESSING MARKET, BY WORKFLOW, 2023–2030 (USD MILLION)
TABLE 620
REST OF LATIN AMERICA: SINGLE-USE BIOPROCESSING MARKET, BY MOLECULE TYPE, 2023–2030 (USD MILLION)
TABLE 621
REST OF LATIN AMERICA: SINGLE-USE BIOPROCESSING MARKET, BY END USER, 2023–2030 (USD MILLION)
TABLE 622
MIDDLE EAST: KEY MACROINDICATORS
TABLE 623
MIDDLE EAST: SINGLE-USE BIOPROCESSING MARKET, BY REGION, 2023–2030 (USD MILLION)
TABLE 624
MIDDLE EAST: SINGLE-USE BIOPROCESSING MARKET, BY PRODUCT, 2023–2030 (USD MILLION)
TABLE 625
MIDDLE EAST: SINGLE-USE BIOPROCESSING EQUIPMENT MARKET, BY TYPE, 2023–2030 (USD MILLION)
TABLE 626
MIDDLE EAST: SINGLE-USE BIOPROCESSING CONSUMABLES MARKET, BY TYPE, 2023–2030 (USD MILLION)
TABLE 627
MIDDLE EAST: SINGLE-USE BIOPROCESSING MARKET, BY APPLICATION, 2023–2030 (USD MILLION)
TABLE 628
MIDDLE EAST: SINGLE-USE BIOPROCESSING MARKET, BY WORKFLOW, 2023–2030 (USD MILLION)
TABLE 629
MIDDLE EAST: SINGLE-USE BIOPROCESSING MARKET, BY MOLECULE TYPE, 2023–2030 (USD MILLION)
TABLE 630
MIDDLE EAST: SINGLE-USE BIOPROCESSING MARKET, BY END USER, 2023–2030 (USD MILLION)
TABLE 631
GCC COUNTRIES: SINGLE-USE BIOPROCESSING MARKET, BY COUNTRY, 2023–2030 (USD MILLION)
TABLE 632
GCC COUNTRIES: SINGLE-USE BIOPROCESSING MARKET, BY PRODUCT, 2023–2030 (USD MILLION)
TABLE 633
GCC COUNTRIES: SINGLE-USE BIOPROCESSING EQUIPMENT MARKET, BY TYPE, 2023–2030 (USD MILLION)
TABLE 634
GCC COUNTRIES: SINGLE-USE BIOPROCESSING CONSUMABLES MARKET, BY TYPE, 2023–2030 (USD MILLION)
TABLE 635
GCC COUNTRIES: SINGLE-USE BIOPROCESSING MARKET, BY APPLICATION, 2023–2030 (USD MILLION)
TABLE 636
GCC COUNTRIES: SINGLE-USE BIOPROCESSING MARKET, BY WORKFLOW, 2023–2030 (USD MILLION)
TABLE 637
GCC COUNTRIES: SINGLE-USE BIOPROCESSING MARKET, BY MOLECULE TYPE, 2023–2030 (USD MILLION)
TABLE 638
GCC COUNTRIES: SINGLE-USE BIOPROCESSING MARKET, BY END USER, 2023–2030 (USD MILLION)
TABLE 639
KINGDOM OF SAUDI ARABIA: SINGLE-USE BIOPROCESSING MARKET, BY PRODUCT, 2023–2030 (USD MILLION)
TABLE 640
KINGDOM OF SAUDI ARABIA: SINGLE-USE BIOPROCESSING EQUIPMENT MARKET, BY TYPE, 2023–2030 (USD MILLION)
TABLE 641
KINGDOM OF SAUDI ARABIA: SINGLE-USE BIOPROCESSING CONSUMABLES MARKET, BY TYPE, 2023–2030 (USD MILLION)
TABLE 642
KINGDOM OF SAUDI ARABIA: SINGLE-USE BIOPROCESSING MARKET, BY APPLICATION, 2023–2030 (USD MILLION)
TABLE 643
KINGDOM OF SAUDI ARABIA: SINGLE-USE BIOPROCESSING MARKET, BY WORKFLOW, 2023–2030 (USD MILLION)
TABLE 644
KINGDOM OF SAUDI ARABIA: SINGLE-USE BIOPROCESSING MARKET, BY MOLECULE TYPE, 2023–2030 (USD MILLION)
TABLE 645
KINGDOM OF SAUDI ARABIA: SINGLE-USE BIOPROCESSING MARKET, BY END USER, 2023–2030 (USD MILLION)
TABLE 646
UAE: SINGLE-USE BIOPROCESSING MARKET, BY PRODUCT, 2023–2030 (USD MILLION)
TABLE 647
UAE: SINGLE-USE BIOPROCESSING EQUIPMENT MARKET, BY TYPE, 2023–2030 (USD MILLION)
TABLE 648
UAE: SINGLE-USE BIOPROCESSING CONSUMABLES MARKET, BY TYPE, 2023–2030 (USD MILLION)
TABLE 649
UAE: SINGLE-USE BIOPROCESSING MARKET, BY APPLICATION, 2023–2030 (USD MILLION)
TABLE 650
UAE: SINGLE-USE BIOPROCESSING MARKET, BY WORKFLOW, 2023–2030 (USD MILLION)
TABLE 651
UAE: SINGLE-USE BIOPROCESSING MARKET, BY MOLECULE TYPE, 2023–2030 (USD MILLION)
TABLE 652
UAE: SINGLE-USE BIOPROCESSING MARKET, BY END USER, 2023–2030 (USD MILLION)
TABLE 653
REST OF GCC COUNTRIES: SINGLE-USE BIOPROCESSING MARKET, BY PRODUCT, 2023–2030 (USD MILLION)
TABLE 654
REST OF GCC COUNTRIES: SINGLE-USE BIOPROCESSING EQUIPMENT MARKET, BY TYPE, 2023–2030 (USD MILLION)
TABLE 655
REST OF GCC COUNTRIES: SINGLE-USE BIOPROCESSING CONSUMABLES MARKET, BY TYPE, 2023–2030 (USD MILLION)
TABLE 656
REST OF GCC COUNTRIES: SINGLE-USE BIOPROCESSING MARKET, BY APPLICATION, 2023–2030 (USD MILLION)
TABLE 657
REST OF GCC COUNTRIES: SINGLE-USE BIOPROCESSING MARKET, BY WORKFLOW, 2023–2030 (USD MILLION)
TABLE 658
REST OF GCC COUNTRIES: SINGLE-USE BIOPROCESSING MARKET, BY MOLECULE TYPE, 2023–2030 (USD MILLION)
TABLE 659
REST OF GCC COUNTRIES: SINGLE-USE BIOPROCESSING MARKET, BY END USER, 2023–2030 (USD MILLION)
TABLE 660
REST OF MIDDLE EAST: SINGLE-USE BIOPROCESSING MARKET, BY PRODUCT, 2023–2030 (USD MILLION)
TABLE 661
REST OF MIDDLE EAST: SINGLE-USE BIOPROCESSING EQUIPMENT MARKET, BY TYPE, 2023–2030 (USD MILLION)
TABLE 662
REST OF MIDDLE EAST: SINGLE-USE BIOPROCESSING CONSUMABLES MARKET, BY TYPE, 2023–2030 (USD MILLION)
TABLE 663
REST OF MIDDLE EAST: SINGLE-USE BIOPROCESSING MARKET, BY APPLICATION, 2023–2030 (USD MILLION)
TABLE 664
REST OF MIDDLE EAST: SINGLE-USE BIOPROCESSING MARKET, BY WORKFLOW, 2023–2030 (USD MILLION)
TABLE 665
REST OF MIDDLE EAST: SINGLE-USE BIOPROCESSING MARKET, BY MOLECULE TYPE, 2023–2030 (USD MILLION)
TABLE 666
REST OF MIDDLE EAST: SINGLE-USE BIOPROCESSING MARKET, BY END USER, 2023–2030 (USD MILLION)
TABLE 667
AFRICA: KEY MACROINDICATORS
TABLE 668
AFRICA: SINGLE-USE BIOPROCESSING MARKET, BY PRODUCT, 2023–2030 (USD MILLION)
TABLE 669
AFRICA: SINGLE-USE BIOPROCESSING EQUIPMENT MARKET, BY TYPE, 2023–2030 (USD MILLION)
TABLE 670
AFRICA: SINGLE-USE BIOPROCESSING CONSUMABLES MARKET, BY TYPE, 2023–2030 (USD MILLION)
TABLE 671
AFRICA: SINGLE-USE BIOPROCESSING MARKET, BY APPLICATION, 2023–2030 (USD MILLION)
TABLE 672
AFRICA: SINGLE-USE BIOPROCESSING MARKET, BY WORKFLOW, 2023–2030 (USD MILLION)
TABLE 673
AFRICA: SINGLE-USE BIOPROCESSING MARKET, BY MOLECULE TYPE, 2023–2030 (USD MILLION)
TABLE 674
AFRICA: SINGLE-USE BIOPROCESSING MARKET, BY END USER, 2023–2030 (USD MILLION)
TABLE 675
OVERVIEW OF STRATEGIES DEPLOYED BY KEY PLAYERS IN SINGLE-USE BIOPROCESSING MARKET, JANUARY 2022−SEPTEMBER 2025
TABLE 676
SINGLE-USE BIOPROCESSING MARKET: DEGREE OF COMPETITION
TABLE 677
SINGLE-USE BIOPROCESSING MARKET: REGION FOOTPRINT
TABLE 678
SINGLE-USE BIOPROCESSING MARKET: PRODUCT FOOTPRINT
TABLE 679
SINGLE-USE BIOPROCESSING MARKET: APPLICATION FOOTPRINT
TABLE 680
SINGLE-USE BIOPROCESSING MARKET: WORKFLOW FOOTPRINT
TABLE 681
SINGLE-USE BIOPROCESSING MARKET: DETAILED LIST OF KEY STARTUP/SME PLAYERS
TABLE 682
SINGLE-USE BIOPROCESSING MARKET: COMPETITIVE BENCHMARKING OF STARTUPS/SME PLAYERS, BY PRODUCT AND REGION
TABLE 683
SINGLE-USE BIOPROCESSING MARKET: PRODUCT LAUNCHES, JANUARY 2022 TO SEPTEMBER 2025
TABLE 684
SINGLE-USE BIOPROCESSING MARKET: DEALS, JANUARY 2022 TO SEPTEMBER 2025
TABLE 685
SINGLE-USE BIOPROCESSING MARKET: EXPANSIONS, JANUARY 2022 TO SEPTEMBER 2025
TABLE 686
SARTORIUS AG: COMPANY OVERVIEW
TABLE 687
SARTORIUS AG: PRODUCTS OFFERED
TABLE 688
SARTORIUS AG: PRODUCT LAUNCHES, JANUARY 2022–SEPTEMBER 2025
TABLE 689
SARTORIUS AG: DEALS, JANUARY 2022–SEPTEMBER 2025
TABLE 690
SARTORIUS AG: EXPANSIONS, JANUARY 2022–SEPTEMBER 2025
TABLE 691
DANAHER CORPORATION: COMPANY OVERVIEW
TABLE 692
DANAHER CORPORATION: PRODUCTS OFFERED
TABLE 693
DANAHER CORPORATION: PRODUCT LAUNCHES, JANUARY 2022–SEPTEMBER 2025
TABLE 694
DANAHER CORPORATION: DEALS, JANUARY 2022–SEPTEMBER 2025
TABLE 695
DANAHER CORPORATION: EXPANSIONS, JANUARY 2022–SEPTEMBER 2025
TABLE 696
THERMO FISHER SCIENTIFIC INC.: COMPANY OVERVIEW
TABLE 697
THERMO FISHER SCIENTIFIC INC.: PRODUCTS OFFERED
TABLE 698
THERMO FISHER SCIENTIFIC INC.: PRODUCT LAUNCHES, JANUARY 2022–SEPTEMBER 2025
TABLE 699
THERMO FISHER SCIENTIFIC INC.: DEALS, JANUARY 2022–SEPTEMBER 2025
TABLE 700
THERMO FISHER SCIENTIFIC INC.: EXPANSIONS, JANUARY 2022–SEPTEMBER 2025
TABLE 701
MERCK KGAA: COMPANY OVERVIEW
TABLE 702
MERCK KGAA: PRODUCTS OFFERED
TABLE 703
MERCK KGAA: PRODUCT LAUNCHES, JANUARY 2022–SEPTEMBER 2025
TABLE 704
MERCK KGAA: DEALS, JANUARY 2022–SEPTEMBER 2025
TABLE 705
MERCK KGAA: EXPANSIONS, JANUARY 2022–SEPTEMBER 2025
TABLE 706
AVANTOR, INC.: COMPANY OVERVIEW
TABLE 707
AVANTOR, INC.: PRODUCTS OFFERED
TABLE 708
AVANTOR, INC.: DEALS, JANUARY 2022–SEPTEMBER 2025
TABLE 709
AVANTOR, INC.: EXPANSIONS, JANUARY 2022–SEPTEMBER 2025
TABLE 710
SOLVENTUM: COMPANY OVERVIEW
TABLE 711
SOLVENTUM: PRODUCTS OFFERED
TABLE 712
REPLIGEN CORPORATION: COMPANY OVERVIEW
TABLE 713
REPLIGEN CORPORATION: PRODUCTS OFFERED
TABLE 714
REPLIGEN CORPORATION: PRODUCT LAUNCHES, JANUARY 2022–SEPTEMBER 2025
TABLE 715
REPLIGEN CORPORATION: DEALS, JANUARY 2022–SEPTEMBER 2025
TABLE 716
REPLIGEN CORPORATION: EXPANSION, JANUARY 2022–SEPTEMBER 2025
TABLE 717
ENTEGRIS: COMPANY OVERVIEW
TABLE 718
ENTEGRIS: PRODUCTS OFFERED
TABLE 719
ENTEGRIS: EXPANSIONS, JANUARY 2022–SEPTEMBER 2025
TABLE 720
GETINGE: COMPANY OVERVIEW
TABLE 721
GETINGE: PRODUCTS OFFERED
TABLE 722
GETINGE: PRODUCT LAUNCHES, JANUARY 2022–SEPTEMBER 2025
TABLE 723
GETINGE: DEALS, JANUARY 2022–SEPTEMBER 2025
TABLE 724
PARKER HANNIFIN CORP.: COMPANY OVERVIEW
TABLE 725
PARKER HANNIFIN CORP.: PRODUCTS OFFERED
TABLE 726
ALFA LAVAL: COMPANY OVERVIEW
TABLE 727
ALFA LAVAL: PRODUCTS OFFERED
TABLE 728
ALFA LAVAL: PRODUCT LAUNCHES, JANUARY 2022–SEPTEMBER 2025
TABLE 729
SAINT-GOBAIN: COMPANY OVERVIEW
TABLE 730
SAINT-GOBAIN: PRODUCTS OFFERED
TABLE 731
SAINT-GOBAIN: PRODUCT LAUNCHES, JANUARY 2022–SEPTEMBER 2025
TABLE 732
SAINT-GOBAIN: EXPANSIONS, JANUARY 2022–SEPTEMBER 2025
TABLE 733
EPPENDORF SE: COMPANY OVERVIEW
TABLE 734
EPPENDORF SE: PRODUCTS OFFERED
TABLE 735
EPPENDORF SE: DEALS, JANUARY 2022–SEPTEMBER 2025
TABLE 736
EPPENDORF SE: EXPANSIONS, JANUARY 2022–SEPTEMBER 2025
TABLE 737
CORNING INCORPORATED: COMPANY OVERVIEW
TABLE 738
CORNING INCORPORATED: PRODUCTS OFFERED
TABLE 739
EATON: COMPANY OVERVIEW
TABLE 740
EATON: PRODUCTS OFFERED
TABLE 741
METTLER TOLEDO: COMPANY OVERVIEW
TABLE 742
METTLER TOLEDO: PRODUCTS OFFERED
TABLE 743
METTLER TOLEDO: PRODUCT LAUNCHES, JANUARY 2022–SEPTEMBER 2025
TABLE 744
PORVAIR: COMPANY OVERVIEW
TABLE 745
PORVAIR: PRODUCTS OFFERED
TABLE 746
LONZA: COMPANY OVERVIEW
TABLE 747
LONZA: PRODUCTS OFFERED
TABLE 748
ABEC: COMPANY OVERVIEW
TABLE 749
SINGLE USE SUPPORT: COMPANY OVERVIEW
TABLE 750
NEWAGE INDUSTRIES: COMPANY OVERVIEW
TABLE 751
BROADLEY-JAMES CORPORATION: COMPANY OVERVIEW
TABLE 752
PBS BIOTECH, INC.: COMPANY OVERVIEW
TABLE 753
SENTINEL PROCESS SYSTEMS INC.: COMPANY OVERVIEW
TABLE 754
MEISSNER FILTRATION PRODUCTS, INC.: COMPANY OVERVIEW
TABLE 755
SATAKE MULTIMIX CORPORATION: COMPANY OVERVIEW
TABLE 756
HAMILTON COMPANY: COMPANY OVERVIEW
TABLE 757
MEMBRANE SOLUTIONS: COMPANY OVERVIEW
TABLE 758
ANTYLIA SCIENTIFIC: COMPANY OVERVIEW
TABLE 759
DISTEK, INC.: COMPANY OVERVIEW
TABLE 760
ESCO LIFESCIENCES GROUP: COMPANY OVERVIEW
TABLE 761
TECNIC: COMPANY OVERVIEW
FIGURE 1
SINGLE–USE BIOPROCESSING MARKET SEGMENTATION & REGIONAL SCOPE
FIGURE 2
SINGLE–USE BIOPROCESSING MARKET: YEARS CONSIDERED
FIGURE 3
SINGLE-USE BIOPROCESSING MARKET: RESEARCH DESIGN
FIGURE 4
SINGLE-USE BIOPROCESSING MARKET: BREAKDOWN OF PRIMARIES (DEMAND- AND SUPPLY-SIDE PARTICIPANTS)
FIGURE 5
GLOBAL SINGLE-USE BIOPROCESSING MARKET SIZE ESTIMATION (SUPPLY-SIDE ANALYSIS), 2024
FIGURE 6
GLOBAL SINGLE–USE BIOPROCESSING MARKET SIZE ESTIMATION: COMPANY REVENUE ANALYSIS (BOTTOM–UP APPROACH), 2024
FIGURE 7
GLOBAL MARKET SIZE ESTIMATION: COMPANY REVENUE ANALYSIS (BOTTOM–UP APPROACH) AT PRODUCT LEVEL, 2024
FIGURE 8
ILLUSTRATIVE EXAMPLE: SINGLE-USE MIXERS MARKET SIZE ESTIMATION: COMPANY REVENUE ANALYSIS (BOTTOM–UP APPROACH), 2024
FIGURE 9
SINGLE–USE BIOPROCESSING MARKET SIZE VALIDATION FROM INDUSTRY EXPERTS
FIGURE 10
SEGMENTAL MARKET SIZE ESTIMATION: TOP–DOWN APPROACH
FIGURE 11
GLOBAL SINGLE–USE BIOPROCESSING MARKET: CAGR PROJECTIONS (2025–2030)
FIGURE 12
SINGLE–USE BIOPROCESSING MARKET: DATA TRIANGULATION METHODOLOGY
FIGURE 13
SINGLE-USE BIOPROCESSING MARKET, BY PRODUCT, 2025 VS. 2030 (USD MILLION)
FIGURE 14
SINGLE-USE BIOPROCESSING MARKET, BY APPLICATION, 2025 VS. 2030 (USD MILLION)
FIGURE 15
SINGLE-USE BIOPROCESSING MARKET, BY WORKFLOW, 2025 VS. 2030 (USD MILLION)
FIGURE 16
SINGLE-USE BIOPROCESSING MARKET, BY MOLECULE TYPE, 2025 VS. 2030 (USD MILLION)
FIGURE 17
SINGLE-USE BIOPROCESSING MARKET, BY END USER, 2025 VS. 2030 (USD MILLION)
FIGURE 18
REGIONAL SNAPSHOT OF SINGLE-USE BIOPROCESSING MARKET
FIGURE 19
RISING ADOPTION AMONG CDMOS & CMOS TO PROPEL MARKET GROWTH
FIGURE 20
US AND FILTRATION COMMANDED LARGEST MARKET SHARES IN 2024
FIGURE 21
CHINA TO REGISTER HIGHEST CAGR DURING STUDY PERIOD
FIGURE 22
EARLY-STAGE BIOPHARMA VENTURE ACTIVITY, 2020–2025 (USD BILLION)
FIGURE 23
SINGLE-USE BIOPROCESSING MARKET: DRIVERS, RESTRAINTS, OPPORTUNITIES, AND CHALLENGES
FIGURE 24
ANNUAL PRODUCTION CAPACITY: SINGLE-PRODUCT FACILITY VS. MULTI-PRODUCT FACILITY
FIGURE 25
ADVANTAGES OF SINGLE-USE PRODUCTS OVER CONVENTIONAL STAINLESS-STEEL DEVICES
FIGURE 26
NUMBER OF BIOSIMILAR APPROVALS AND LAUNCHES (2015–2024)
FIGURE 27
SINGLE-USE BIOPROCESSING MARKET: TRENDS/DISRUPTIONS IMPACTING CUSTOMERS’ BUSINESSES
FIGURE 28
SINGLE-USE BIOPROCESSING MARKET: PORTER’S FIVE FORCES ANALYSIS
FIGURE 29
INFLUENCE OF KEY STAKEHOLDERS ON BUYING PROCESS OF SINGLE-USE BIOPROCESSING PRODUCTS
FIGURE 30
KEY BUYING CRITERIA FOR SINGLE-USE BIOPROCESSING PRODUCTS, BY END USER
FIGURE 31
SINGLE-USE BIOPROCESSING MARKET: VALUE CHAIN ANALYSIS
FIGURE 32
SINGLE-USE BIOPROCESSING MARKET: ECOSYSTEM ANALYSIS
FIGURE 33
TOP APPLICANTS/OWNERS (COMPANIES) FOR SINGLE-USE BIOPROCESSING PATENTS, 2014–2024
FIGURE 34
SINGLE-USE BIOPROCESSING MARKET: INVESTMENT & FUNDING SCENARIO, 2020–2024
FIGURE 35
AI USE CASES IN SINGLE-USE BIOPROCESSING MARKET ECOSYSTEM
FIGURE 36
VACCINE CLINICAL TRIALS, BY PHASE
FIGURE 37
NORTH AMERICA: SINGLE-USE BIOPROCESSING MARKET SNAPSHOT
FIGURE 38
US: NIH PROGRAM-LEVEL FUNDING, 2015–2025 (USD BILLION)
FIGURE 39
ASIA PACIFIC: SINGLE-USE BIOPROCESSING MARKET SNAPSHOT
FIGURE 40
REVENUE ANALYSIS OF KEY PLAYERS IN SINGLE-USE BIOPROCESSING MARKET, 2020–2024 (USD BILLION)
FIGURE 41
MARKET SHARE ANALYSIS OF KEY PLAYERS IN SINGLE-USE BIOPROCESSING MARKET (2024)
FIGURE 42
SINGLE-USE BIOPROCESSING MARKET: COMPANY EVALUATION MATRIX (KEY PLAYERS), 2024
FIGURE 43
SINGLE-USE BIOPROCESSING MARKET: COMPANY FOOTPRINT
FIGURE 44
SINGLE-USE BIOPROCESSING MARKET: COMPANY EVALUATION MATRIX (STARTUPS/SMES), 2024
FIGURE 45
EV/EBITDA OF KEY VENDORS
FIGURE 46
YEAR-TO-DATE (YTD) PRICE TOTAL RETURN AND 5-YEAR STOCK BETA OF KEY VENDORS
FIGURE 47
SINGLE-USE BIOPROCESSING MARKET: BRAND/PRODUCT COMPARATIVE ANALYSIS
FIGURE 48
SARTORIUS AG: COMPANY SNAPSHOT
FIGURE 49
DANAHER CORPORATION: COMPANY SNAPSHOT
FIGURE 50
THERMO FISHER SCIENTIFIC INC.: COMPANY SNAPSHOT
FIGURE 51
MERCK KGAA: COMPANY SNAPSHOT
FIGURE 52
AVANTOR, INC.: COMPANY SNAPSHOT
FIGURE 53
SOLVENTUM: COMPANY SNAPSHOT
FIGURE 54
REPLIGEN CORPORATION: COMPANY SNAPSHOT
FIGURE 55
ENTEGRIS: COMPANY SNAPSHOT
FIGURE 56
GETINGE: COMPANY SNAPSHOT
FIGURE 57
PARKER HANNIFIN CORP.: COMPANY SNAPSHOT
FIGURE 58
ALFA LAVAL: COMPANY SNAPSHOT
FIGURE 59
SAINT-GOBAIN: COMPANY SNAPSHOT
FIGURE 60
EPPENDORF SE: COMPANY SNAPSHOT
FIGURE 61
CORNING INCORPORATED: COMPANY SNAPSHOT
FIGURE 62
EATON: COMPANY SNAPSHOT
FIGURE 63
METTLER TOLEDO: COMPANY SNAPSHOT
FIGURE 64
PORVAIR: COMPANY SNAPSHOT
FIGURE 65
LONZA: COMPANY SNAPSHOT


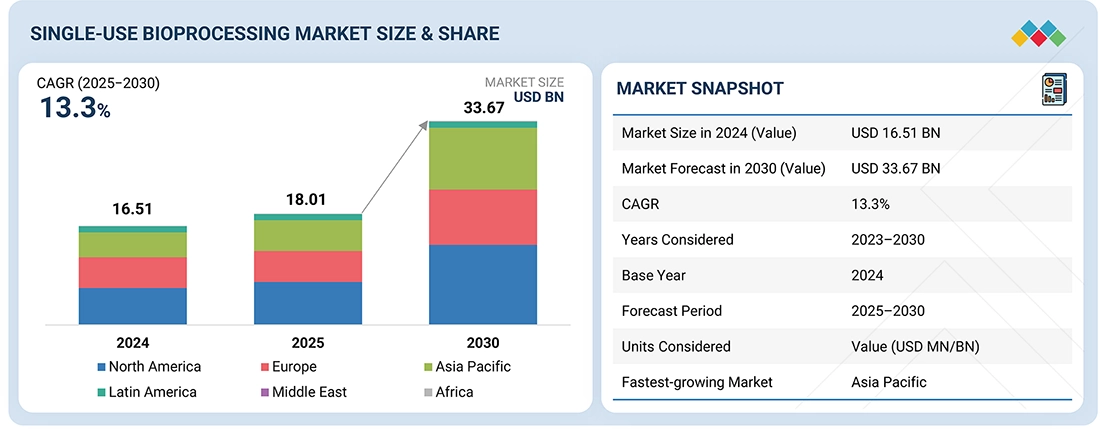
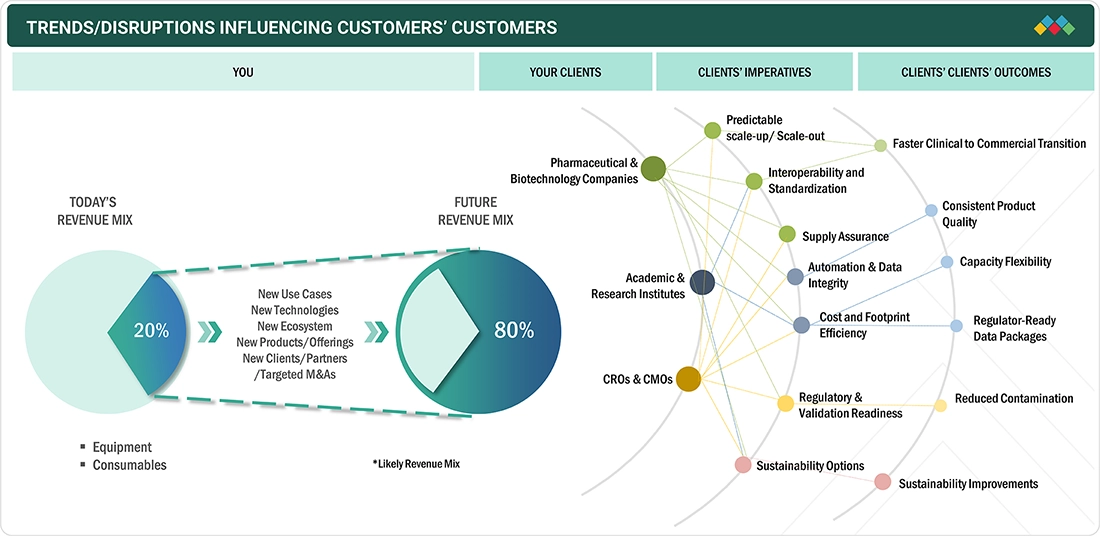


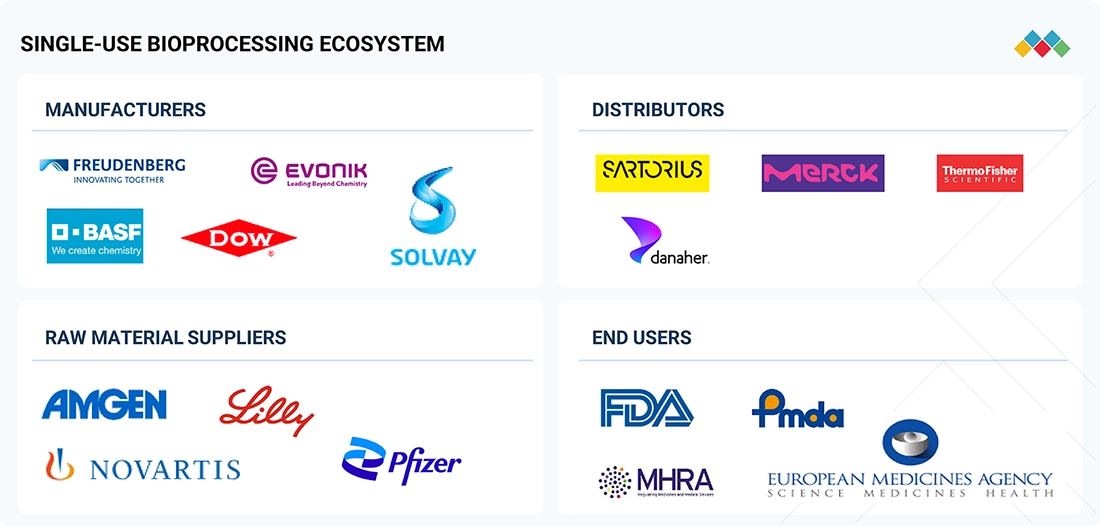
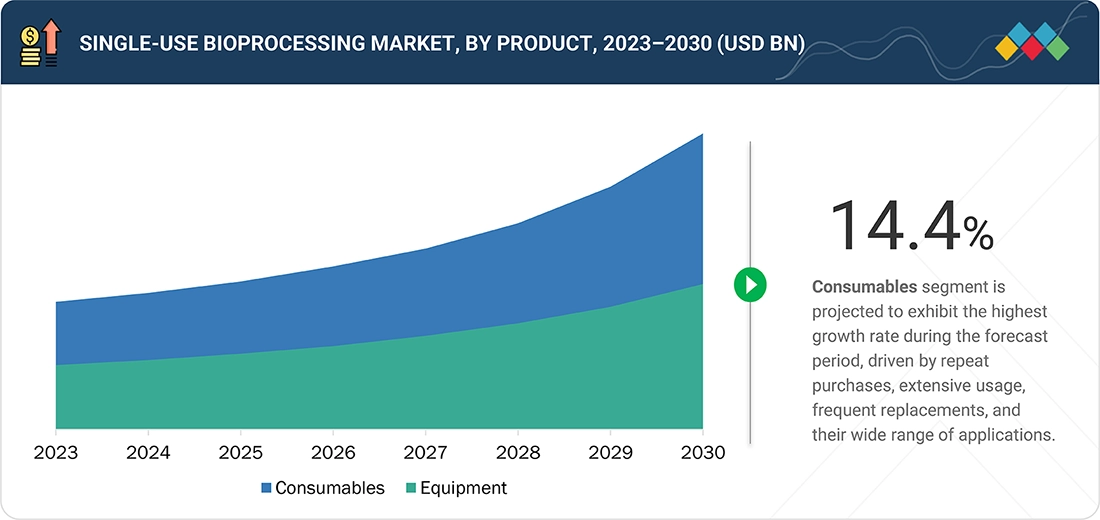
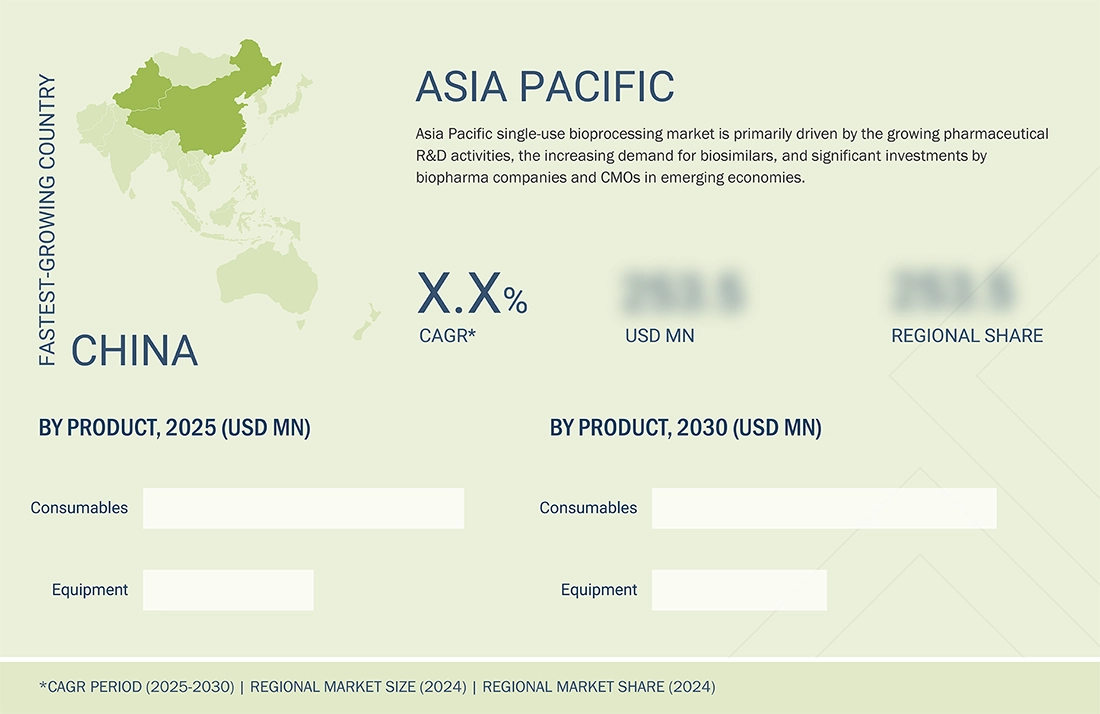
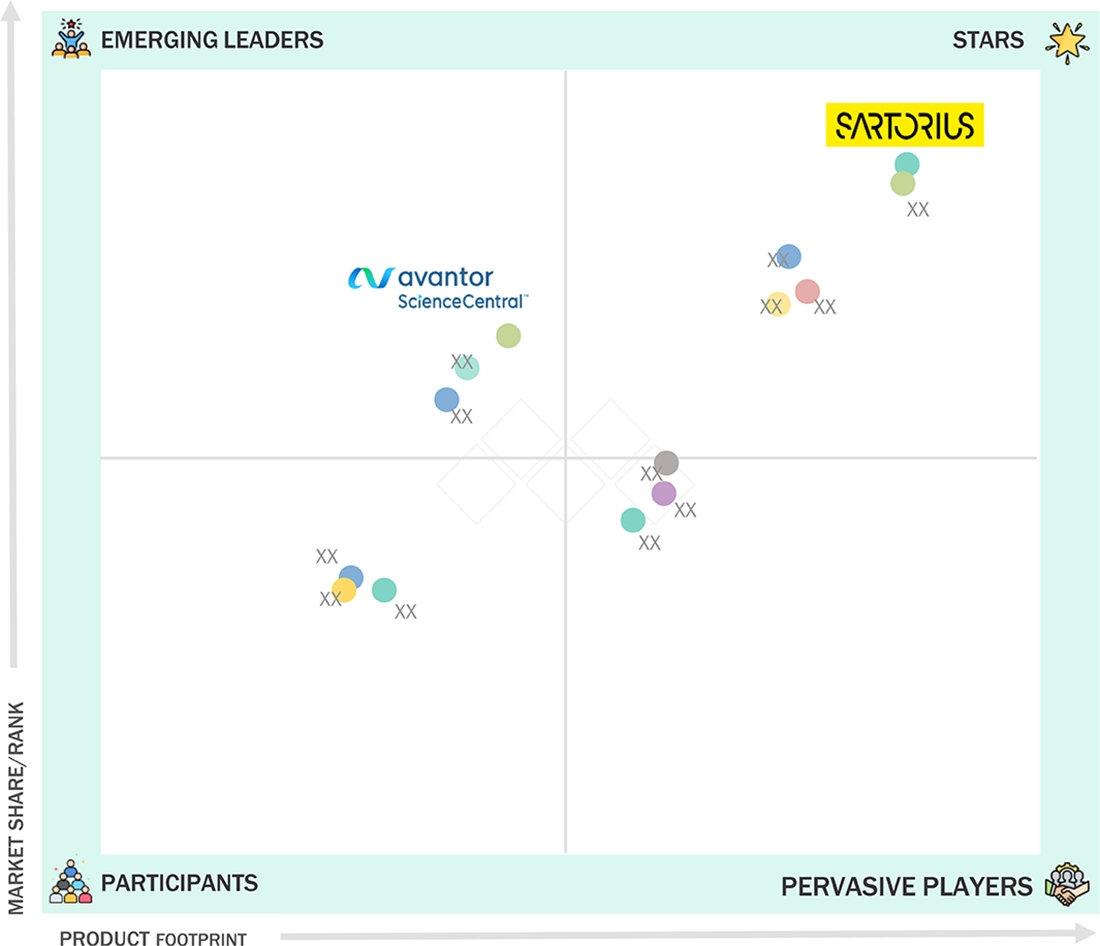
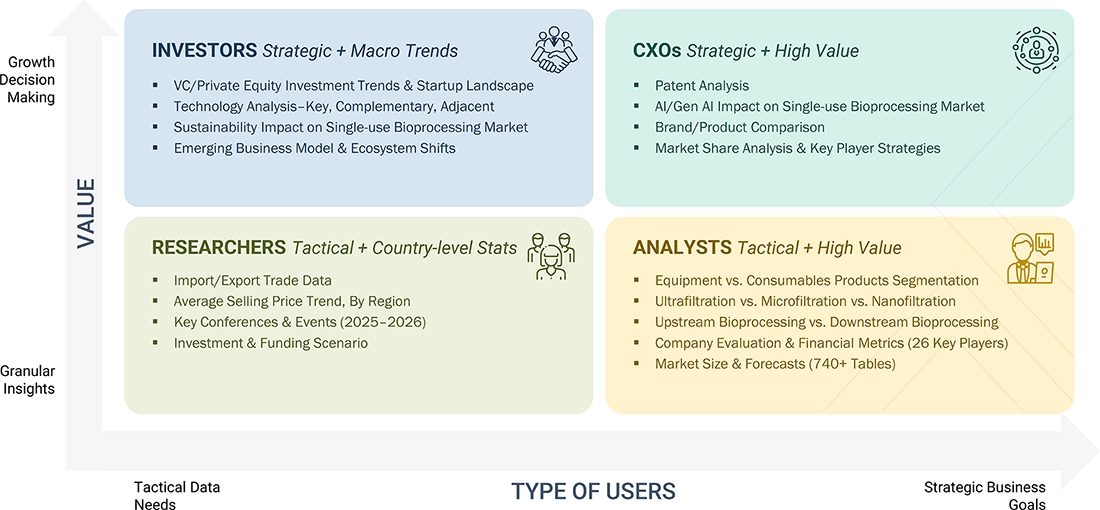
 Exclusive indicates content/data unique to MarketsandMarkets and not available with any competitors.


Richard
Mar, 2022
Which is the fastest growing market of Single use Bioprocessing Market?.
Joseph
Mar, 2022
Cen you enlighten us with your market intelligence to grow and sustain in Single use Bioprocessing Market?.
Thomas
Mar, 2022
What are the growth estimates for Single use Bioprocessing Market till 2026?.