We use cookies to enhance your experience. By continuing to visit this site you agree to our use of cookies . More info . X close

Silanes Market

Report Code CH 4004
Published in Oct, 2024, By MarketsandMarkets™
Download PDF

Choose License Type

Buy Report Now Inquire Before Buying

Silanes Market by Type (Functional Silanes & Mono/Chloro Silanes), Application (Rubber & Plastic, Fiber Treatment, Adhesive & Sealants, Paints & Coatings) End-Use (Building & Constructions, Electrical & Electronics, Automotive) - Global Forecast to 2029

Overview

The global silane market size is projected to grow from USD 3.62 billion in 2024 to USD 5.20 billion by 2029, at a CAGR of 7.5% during the forecast period.

The silanes market is growing due to its multiple applications in end-use industries such as building & construction, electrical & electronics, automotive, and others. As the global population expands and countries undergo rapid urbanization, there is an increasing demand for housing, automobile, and electricals & electronics, which will drive the demand for silanes.

Attractive Opportunities in the Silanes Market

Asia Pacific

Market growth in the Asia Pacific can be attributed to growing automotive and construction industry. The adhesives & sealants, paints & coatings, semiconductors, and fiber glass applications are also driving demand for silanes in the Asia Pacific region

Demand for silanes is expected to rise, given their critical applications in various aspects of automobile manufacturing, such as in adhesives, sealants, and composite materials.

The growth of semiconductor industry has significantly increased the demand for silanes which are vital in a manufacturing of semiconductors and electronics

The Asia Pacific silanes market is expected to be worth USD 2426.30 million by 2029, growing at CAGR of 9.4% during the forecast period.

The production of silanes is associated with the emission of volatile organic compounds (VOCs), which poses a significant challenge for the silanes market.

Global Silanes Market Dynamics

Driver: Surge in Automotive Investment

In 2023, the automotive sector saw significant investments that have notably increased the demand for automobiles, subsequently boosting the need for silane, a key material in tire manufacturing and other automotive components. According to the International Energy Agency (IEA), nearly 14 million electric cars were sold globally in 2023, marking a 35% increase from the previous year. This surge in electric vehicle (EV) sales, particularly in major markets like China, Europe, and the United States, has driven the overall growth in the automotive industry.

As the automotive industry expands, the demand for silanes is expected to rise, given their critical applications in various aspects of automobile manufacturing, such as in adhesives, sealants, and composite materials.

Restraint: VOC Emission during Silanes production

The production of silanes is associated with the emission of volatile organic compounds (VOCs), which poses a significant challenge for the silanes market. VOC emissions occur during various stages of silane manufacturing, particularly in processes involving the use of solvents and chemical reactions. These emissions can contribute to air pollution and have adverse effects on human health and the environment. Regulatory agencies, such as the Environmental Protection Agency (EPA) in the United States, have established guidelines to monitor and limit VOC emissions, which can complicate compliance for manufacturers. The need to manage and reduce VOC emissions can lead to increased scrutiny from regulatory bodies and may necessitate the implementation of additional control measures.


Opportunity: Emerging Applications in pharmaceutical and cosmetic industry

The pharmaceutical and cosmetic industries are witnessing a surge in the application of silanes, presenting a significant opportunity for manufacturers in the silanes market. Advancements in silane technology have enabled their use as effective coupling agents and surface modifiers, enhancing the stability and efficacy of pharmaceutical formulations and cosmetic products. For instance, silanes are increasingly being utilized in drug delivery systems to improve the bioavailability of active pharmaceutical ingredients. In the cosmetic industry, silanes are being adopted for their ability to enhance the durability and performance of products such as hair care treatments and skin care formulations.

Challenge: High Cost of Production

One of the major challenges faced by manufacturers in the silane market is the high cost of production, primarily driven by the fluctuating prices of raw materials and the substantial investment required for technological advancements. Silane production relies heavily on raw materials such as silicon and hydrogen, whose prices can be volatile due to market demand and supply chain disruptions. Additionally, Manufacturers make significant investments in advanced technologies to remain competitive and comply with stringent environmental regulations. These investments are crucial for meeting the regulatory standards set by various government bodies.

Global Silanes Market Ecosystem Analysis


By Type, functional silanes to account for fastest growing segment

Various properties of functional silanes, owing to their additives, are making them useful in many end-use industries, thus gaining the largest share in the silanes market Functional silanes are used in rubber & plastics, fiber treatment, adhesives & sealants, and paint & coatings applications. The growing end-use industries such as automotive and building & construction are expected to drive the market. The increasing automotive sales in China and India and the recovering demand in the US are also likely to drive the market.

By Application, Rubber & Plastic segment to account for fastest growing segment

The application in Rubber & plastics is projected to capture the largest share of the silanes market, driven by increasing awareness about green tires, as a result of stringent regulations on fuel efficiency, and development of environment-friendly coatings. Additionally, The rapidly growing automotive industry in the developing markets, along with the increasing use of wire & cables, is driving the demand for silanes in this segment.

By End Use Sector, Automotive segment to account for the largest market share during the forecast period

Silane coupling agents have a wide range of applications in the automotive industry, such as automotive coatings, car windshields and roofs, airbags, automotive electronic coatings, and car foam isolation. In addition, silanes are used in the production of cutting-edge, high-performance green tires. The increasing focus on fuel efficiency, safety, and sustainability is driving the demand for silanes in the automotive industry. Their ability to improve tire performance, reduce emissions, and enhance manufacturing efficiency makes them an essential component in modern vehicle production.

By Region, APAC to register the highest growth rate during the forecast period

For silanes, APAC is the leading region. This surge can be attributed to the growing automotive industry and infrastructure development taking place in countries like China, India, and Japan. As these nations invest heavily in building new cities, highways, railways, and other public works projects, the demand for silanes is incerasing rapidly.

HIGHEST CAGR MARKET IN 2023
CHINA FASTEST GROWING MARKET IN THE REGION

Recent Developments of Silanes Market

  • In February 2025, Wacker launched ELASTOSIL eco 7770 P, a sustainable silicone elastomer incorporating a cross-linking agent to enhance durability and performance. Designed for industrial applications, this eco-friendly material improved processing efficiency while reducing environmental impact.
  • In January 2025, Evonik launched Smart Effects, a new entity with 3,500 employees worldwide, formed by merging its Silica and Silanes business lines under the Advanced Technologies division. This strategic integration aims to drive innovation in key markets, including automotive, tires, electronics, consumer health, nutrition, and building protection. The merger strengthens silica-silane applications, particularly in green tire production, enhancing fuel efficiency and safety.
  • In January 2025, Wacker Chemie AG started operations at two new specialty silicone production facilities in Japan and South Korea, reinforcing its presence in the Asian market. The new plants in Tsukuba and Jincheon were established to meet the increasing demand from the automotive and construction industries.
  • In June 2024, Wacker Chemie AG announced the opening of a new production site in Karlovy Vary, Czech Republic, aimed at strengthening its focus on silicone specialties in Europe. The facility will produce room-temperature-curing specialty silicones, with operations expected to start by the end of 2025
  • In May 2024, Shin-Etsu Chemical Co., Ltd. announced the establishment of a new company, Shin-Etsu Silicone (Pinghu) Co., Ltd., in Zhejiang Province, China
  • In May 2024, KCC Corporation announced the acquisition of Momentive Performance Materials, a global leader in high-performance silicones and specialty solutions.

Key Market Players

KEY PLAYERS IN THE SILANES MARKET INCLUDE

  • Evonik Industries AG (Germany)
  • Shin-Etsu chemical Co., LTD. (Japan)
  • KCC Corporation (South Korea)
  • Dow (US)
  • Waker Chemie AG (Germany)
  • Gelest, Inc. (US)
  • W WD Silicon Co., LTD (China)
  • Nanjing Shuguang Chemical Group Co., Ltd. (China)

Want to explore hidden markets that can drive new revenue in Silanes Market?

Scope of the Report

Report Metric Details
Market size available for years 2020-2022
Base Year Considered 2023
Forecast period 2024-2029
Forecast units Value (USD Million) Volume (Thousands Tons)
Segments covered Type, Application, End-use Industry, and Region
Geographies covered North America, Europe, Asia Pacific, Middle East and Africa, Latin America


Key Questions Addressed by the Report

What are the major drivers influencing the growth of the silanes market?
The major factor driving silanes growth are the its multiple applications in end-use industries such as automotive, building & construction, electrical & electronics, and others.
What are the major challenges in the silanes market?
The silanes market's main obstacles is VOC emission during silane production.
What are the different applications of silanes?
Silanes are used in many different end-use sectors, including building & construction, electricals & electronics, automotive and others. They are used as high-quality cross-linking agents in sealants, adhesives, and coatings, enhancing the durability and longevity of construction materials.
What are the industry trends in silanes?
The silanes market is witnessing a significant trend towards emerging applications in pharmaceutical and cosmetic industries presenting a significant opportunity for manufacturers in the silanes market.

Personalize This Research

  • Triangulate with your Own Data
  • Get Data as per your Format and Definition
  • Gain a Deeper Dive on a Specific Application, Geography, Customer or Competitor
  • Any level of Personalization
Request A Free Customisation

Let Us Help You

  • What are the Known and Unknown Adjacencies Impacting the Silanes Market
  • What will your New Revenue Sources be?
  • Who will be your Top Customer; what will make them switch?
  • Defend your Market Share or Win Competitors
  • Get a Scorecard for Target Partners
Customized Workshop Request

Table of Contents

Exclusive indicates content/data unique to MarketsandMarkets and not available with any competitors.

TITLE
PAGE NO
INTRODUCTION
30
RESEARCH METHODOLOGY
35
EXECUTIVE SUMMARY
44
PREMIUM INSIGHTS
48
MARKET OVERVIEW
51
  • 5.1 INTRODUCTION
  • 5.2 MARKET DYNAMICS
    DRIVERS
    - Increasing investments in automotive industry
    - Heavy investments in construction activities
    - Rising demand from paints & coatings industry
    - Growing semiconductor industry
    RESTRAINTS
    - VOC emissions during production of silanes
    - Fluctuations in raw material prices
    OPPORTUNITIES
    - Emerging applications in pharmaceutical and cosmetics industries
    - Rapidly growing economies in Asia Pacific
    - Increasing applications in renewable energy
    CHALLENGES
    - Regulatory compliances across regions
    - High cost of production
INDUSTRY TRENDS
56
  • 6.1 PORTER’S FIVE FORCES ANALYSIS
    THREAT OF NEW ENTRANTS
    THREAT OF SUBSTITUTES
    BARGAINING POWER OF SUPPLIERS
    BARGAINING POWER OF BUYERS
    INTENSITY OF COMPETITIVE RIVALRY
  • 6.2 KEY STAKEHOLDERS & BUYING CRITERIA
    KEY STAKEHOLDERS IN BUYING PROCESS
    BUYING CRITERIA
  • 6.3 VALUE CHAIN ANALYSIS
    RAW MATERIAL SUPPLIERS
    MANUFACTURERS
    DISTRIBUTORS
    END-USE INDUSTRIES
  • 6.4 ECOSYSTEM ANALYSIS
  • 6.5 PRICING ANALYSIS
    AVERAGE SELLING PRICE TREND, BY REGION, 2021–2029
    AVERAGE SELLING PRICE TREND OF KEY PLAYERS, BY TYPE, 2023
  • 6.6 TRADE ANALYSIS
    EXPORT SCENARIO (HS CODE 293190)
    IMPORT SCENARIO (HS CODE 293190)
  • 6.7 REGULATORY BODIES, GOVERNMENT AGENCIES, AND OTHER ORGANIZATIONS
  • 6.8 KEY CONFERENCES & EVENTS, 2024–2025
  • 6.9 PATENT ANALYSIS
    METHODOLOGY
    PATENT ANALYSIS, 2014–2024
  • 6.10 TECHNOLOGY ANALYSIS
    KEY TECHNOLOGIES
    - Silica-silane technology for tires
    - Water-based silane systems
    COMPLEMENTARY TECHNOLOGIES
    - Nano silanes
    - Smart coatings
  • 6.11 IMPACT OF GEN AI ON SILANES MARKET
  • 6.12 TRENDS/DISRUPTIONS IMPACTING CUSTOMER BUSINESS
  • 6.13 CASE STUDY ANALYSIS
    SILANES FOR BUILDING PROTECTION
    SILANE-OXYGEN-DILUENT MIXTURES IN COMBUSTION SYSTEMS
    ONED BATTERY SCIENCES AND KOCH MODULAR PROCESS SYSTEMS
  • 6.14 MACROECONOMIC OUTLOOK
    INTRODUCTION
    GDP TRENDS AND FORECAST
    GROWING POPULATION AND URBANIZATION
  • 6.15 INVESTMENT & FUNDING SCENARIO
    INVESTOR DEALS AND FUNDING IN ELECTRIC VEHICLE (EV) SECTOR SOARED IN 2024
SILANES MARKET, BY APPLICATION
81
  • 7.1 INTRODUCTION
  • 7.2 RUBBER & PLASTICS
    ADVANCEMENTS IN GREEN TIRE TECHNOLOGY TO PROPEL MARKET
  • 7.3 FIBER TREATMENT
    AUTOMOTIVE, AEROSPACE, BUILDING & CONSTRUCTION, AND ELECTRICAL & ELECTRONICS SECTORS TO DRIVE MARKET
  • 7.4 ADHESIVES & SEALANTS
    SUPERIOR MOISTURE RESISTANCE, TEMPERATURE STABILITY, AND CHEMICAL DURABILITY TO SPUR MARKET GROWTH
  • 7.5 PAINTS & COATINGS
    ENHANCED UV AND THERMAL STABILITY, SURFACE ACTIVITY, CHEMICAL RESISTANCE, AND CORROSION PROTECTION TO DRIVE MARKET
  • 7.6 OTHER APPLICATIONS
SILANES MARKET, BY END-USE INDUSTRY
87
  • 8.1 INTRODUCTION
  • 8.2 BUILDING & CONSTRUCTION
    RISING DEMAND FOR PAINTS & COATINGS TO BOOST MARKET
  • 8.3 ELECTRICAL & ELECTRONICS
    VITAL ROLE IN SEMICONDUCTORS AND ELECTRICAL APPLICATIONS TO DRIVE MARKET
  • 8.4 AUTOMOTIVE
    PRODUCTION OF GREEN TIRES TO FAVOR MARKET GROWTH
  • 8.5 OTHER END-USE INDUSTRIES
SILANES MARKET, BY TYPE
92
  • 9.1 INTRODUCTION
  • 9.2 FUNCTIONAL SILANES
    DEMAND FROM AUTOMOTIVE AND BUILDING & CONSTRUCTION INDUSTRIES TO DRIVE MARKET
    SULFUR SILANES
    VINYL SILANES
    AMINO SILANES
    EPOXY SILANES
    ALKYL SILANES
    METHACRYLOXY SILANES
    OTHER FUNCTIONAL SILANES
  • 9.3 MONO/CHLORO SILANES
    INNOVATIONS AND APPLICATIONS IN ADVANCED MATERIALS TO DRIVE MARKET
SILANES MARKET, BY REGION
99
  • 10.1 INTRODUCTION
  • 10.2 NORTH AMERICA
    US
    - Innovations and growing applications in automotive sector to drive market
    CANADA
    - Substantial investments in infrastructure projects to drive demand
    MEXICO
    - Significant growth of electrical & electronics sector to drive market
  • 10.3 EUROPE
    GERMANY
    - Focus on green tire production to boost market
    FRANCE
    - Rising focus on renewable energy sector to support market
    UK
    - Growing demand for EVs to drive market
    ITALY
    - Increasing demand for silane-based coatings in construction sector to propel market
    SPAIN
    - Rising construction activities to boost market
    REST OF EUROPE
  • 10.4 ASIA PACIFIC
    CHINA
    - Significant increase in semiconductor production to drive market
    JAPAN
    - Robust electrical & electronics industry to drive market
    INDIA
    - Growth of construction and automotive sectors to drive market
    SOUTH KOREA
    - Significant growth of automotive industry to boost market
    REST OF ASIA PACIFIC
  • 10.5 SOUTH AMERICA
    BRAZIL
    - Advancements in solar energy sector to drive market
    ARGENTINA
    - Automotive sector to fuel market growth
    REST OF SOUTH AMERICA
  • 10.6 MIDDLE EAST & AFRICA
    GCC COUNTRIES
    SAUDI ARABIA
    - Growing building & construction industry to drive market
    UAE
    - Significant investments in infrastructure and real estate projects to drive market
    REST OF GCC COUNTRIES
    SOUTH AFRICA
    - Focus on public infrastructure development to fuel demand
    REST OF MIDDLE EAST & AFRICA
COMPETITIVE LANDSCAPE
235
  • 11.1 OVERVIEW
  • 11.2 KEY PLAYER STRATEGIES/RIGHT TO WIN
  • 11.3 REVENUE ANALYSIS, 2019−2023
  • 11.4 MARKET SHARE ANALYSIS, 2023
  • 11.5 COMPANY VALUATION AND FINANCIAL MATRIX
    COMPANY VALUATION
    FINANCIAL METRICS
  • 11.6 BRAND/PRODUCT COMPARISON
  • 11.7 COMPANY EVALUATION MATRIX: KEY PLAYERS, 2023
    STARS
    EMERGING LEADERS
    PERVASIVE PLAYERS
    PARTICIPANTS
    COMPANY FOOTPRINT: KEY PLAYERS, 2023
    - Type footprint
    - Application footprint
    - End-use industry footprint
    - Region footprint
  • 11.8 COMPANY EVALUATION MATRIX: STARTUPS/SMES, 2023
    PROGRESSIVE COMPANIES
    RESPONSIVE COMPANIES
    DYNAMIC COMPANIES
    STARTING BLOCKS
    COMPETITIVE BENCHMARKING OF KEY PLAYERS, 2023
    - Detailed list of key startups/SMEs
    - Competitive benchmarking of key startups/SMEs, by type
    - Competitive benchmarking of key startups/SMEs, by application
    - Competitive benchmarking of key startups/SMEs, by end-use industry
    - Competitive benchmarking of key startups/SMEs, by region
  • 11.9 COMPETITIVE SCENARIO
    PRODUCT LAUNCHES/DEVELOPMENTS
    DEALS
    EXPANSIONS
    OTHER DEVELOPMENTS
COMPANY PROFILES
262
  • 12.1 KEY PLAYERS
    EVONIK INDUSTRIES AG
    - Business overview
    - Products/Solutions/Services offered
    - Recent developments
    - MnM view
    SHIN-ETSU CHEMICAL CO., LTD.
    - Business overview
    - Products/Solutions/Services offered
    - Recent developments
    - MnM view
    KCC CORPORATION
    - Business overview
    - Products/Solutions/Services offered
    - Recent developments
    - MnM view
    DOW
    - Business overview
    - Products/Solutions/Services offered
    - Recent developments
    - MnM view
    WACKER CHEMIE AG
    - Business overview
    - Products/Solutions/Services offered
    - Recent developments
    - MnM view
    GELEST, INC.
    - Business overview
    - Products/Solutions/Services offered
    - Recent developments
    - MnM view
    WD SILICONE CO., LTD.
    - Business overview
    - Products/Solutions/Services offered
    - MnM view
    NANJING SHUGUANG CHEMICAL GROUP CO., LTD.
    - Business overview
    - Products/Solutions/Services offered
    - MnM view
    CHINA NATIONAL BLUESTAR (GROUP) CO, LTD.
    - Business overview
    - Products/Solutions/Services offered
    - Recent developments
    - MnM view
    NANJING UNION SILICON CHEMICAL CO., LTD.
    - Business overview
    - Products/Solutions/Services offered
    - MnM view
  • 12.2 OTHER PLAYERS
    NANJING CAPATUE CHEMICAL CO., LTD.
    NANJING LANYA CHEMICAL CO., LTD.
    HUBEI BLUESKY NEW MATERIAL INC.
    SK MATERIALS CO., LTD.
    SUPREME SILICONES INDIA PVT. LTD.
    CHT GERMANY GMBH
    TOKYO CHEMICAL INDUSTRY CO., LTD. (TCI)
    SHANGHAI XINDA CHEMICAL INDUSTRY CO., LTD.
    HENAN DAKEN CHEMICAL CO., LTD
    SCHILL+SEILACHER "STRUKTOL" GMBH
    MILLIKEN & COMPANY
    PCC SE
    ENTEGRIS, INC.
    KETTLITZ-CHEMIE GMBH & CO. KG
    HANGZHOU RUIJIANG CHEMICAL CO. LTD,
ADJACENT AND RELATED MARKETS
315
  • 13.1 INTRODUCTION
  • 13.2 LIMITATIONS
    ELECTRONIC CHEMICALS AND MATERIALS MARKET
    - Market definition
    - Electronic chemicals and materials market, by type
    - Electronic chemicals and materials market, by application
    - Electronic chemicals and materials market, by region
    PAINTS & COATINGS MARKET
    - Market definition
    - Paints & coatings market, by technology
    - Paints & coatings market, by resin type
    - Paints & coatings market, by end-use industry
    - Paints & coatings market, by region
APPENDIX
325
  • 14.1 DISCUSSION GUIDE
  • 14.2 KNOWLEDGESTORE: MARKETSANDMARKETS’ SUBSCRIPTION PORTAL
  • 14.3 CUSTOMIZATION OPTIONS
  • 14.4 RELATED REPORTS
  • 14.5 AUTHOR DETAILS
LIST OF TABLES
 
  • TABLE 1 SILANES MARKET: PORTER’S FIVE FORCES ANALYSIS
  • TABLE 2 INFLUENCE OF STAKEHOLDERS ON BUYING PROCESS FOR TOP THREE APPLICATIONS
  • TABLE 3 KEY BUYING CRITERIA FOR TOP THREE APPLICATIONS
  • TABLE 4 INDICATIVE PRICING OF KEY PLAYERS, BY TYPE, 2023 (USD/TON)
  • TABLE 5 EXPORT DATA FOR HS CODE 293190, BY COUNTRY, 2019–2023
  • TABLE 6 IMPORT DATA FOR HS CODE 293190, BY COUNTRY, 2019–2023
  • TABLE 7 NORTH AMERICA: LIST OF REGULATORY BODIES, GOVERNMENT AGENCIES, AND OTHER ORGANIZATIONS
  • TABLE 8 EUROPE: LIST OF REGULATORY BODIES, GOVERNMENT AGENCIES, AND OTHER ORGANIZATIONS
  • TABLE 9 ASIA PACIFIC: LIST OF REGULATORY BODIES, GOVERNMENT AGENCIES, AND OTHER ORGANIZATIONS
  • TABLE 10 MIDDLE EAST & AFRICA: LIST OF REGULATORY BODIES, GOVERNMENT AGENCIES, AND OTHER ORGANIZATIONS
  • TABLE 11 SOUTH AMERICA: LIST OF REGULATORY BODIES, GOVERNMENT AGENCIES, AND OTHER ORGANIZATIONS
  • TABLE 12 DETAILED LIST OF CONFERENCES & EVENTS, 2024–2025
  • TABLE 13 LIST OF PATENTS FOR SILANES
  • TABLE 14 WORLD GDP GROWTH PROJECTION, 2021–2028 (USD TRILLION)
  • TABLE 15 WORLD POPULATION AND URBANIZATION, BY REGION, 2021 VS. 2050 (MILLION)
  • TABLE 16 POPULATION GROWTH, BY REGION, 2022 VS. 2030 VS. 2050 (MILLION)
  • TABLE 17 SILANES MARKET, BY APPLICATION, 2020–2022 (USD MILLION)
  • TABLE 18 SILANES MARKET, BY APPLICATION, 2023–2029 (USD MILLION)
  • TABLE 19 SILANES MARKET, BY APPLICATION, 2020–2022 (THOUSAND TONS)
  • TABLE 20 SILANES MARKET, BY APPLICATION, 2023–2029 (THOUSAND TONS)
  • TABLE 21 SILANES MARKET, BY END-USE INDUSTRY, 2020–2022 (USD MILLION)
  • TABLE 22 SILANES MARKET, BY END-USE INDUSTRY, 2023–2029 (USD MILLION)
  • TABLE 23 SILANES MARKET, BY END-USE INDUSTRY, 2020–2022 (THOUSAND TONS)
  • TABLE 24 SILANES MARKET, BY END-USE INDUSTRY, 2023–2029 (THOUSAND TONS)
  • TABLE 25 SILANES MARKET, BY TYPE, 2020–2022 (USD MILLION)
  • TABLE 26 SILANES MARKET, BY TYPE, 2023–2029 (USD MILLION)
  • TABLE 27 SILANES MARKET, BY TYPE, 2020–2022 (THOUSAND TONS)
  • TABLE 28 SILANES MARKET, BY TYPE, 2023–2029 (THOUSAND TONS)
  • TABLE 29 SILANES MARKET, BY FUNCTIONAL SILANES TYPE, 2023–2029 (USD MILLION)
  • TABLE 30 SILANES MARKET, BY FUNCTIONAL SILANES TYPE, 2023–2029 (THOUSAND TONS)
  • TABLE 31 GLOBAL SILANES MARKET, BY REGION, 2020–2022 (USD MILLION)
  • TABLE 32 GLOBAL SILANES MARKET, BY REGION, 2023–2029 (USD MILLION)
  • TABLE 33 GLOBAL SILANES MARKET, BY REGION, 2020–2022 (THOUSAND TONS)
  • TABLE 34 GLOBAL SILANES MARKET, BY REGION, 2023–2029 (THOUSAND TONS)
  • TABLE 35 GLOBAL SILANES MARKET, BY TYPE, 2020–2022 (USD MILLION)
  • TABLE 36 GLOBAL SILANES MARKET, BY TYPE, 2023–2029 (USD MILLION)
  • TABLE 37 GLOBAL SILANES MARKET, BY TYPE, 2020–2022 (THOUSAND TONS)
  • TABLE 38 GLOBAL SILANES MARKET, BY TYPE, 2023–2029 (THOUSAND TONS)
  • TABLE 39 GLOBAL SILANES MARKET, BY APPLICATION, 2020–2022 (USD MILLION)
  • TABLE 40 GLOBAL SILANES MARKET, BY APPLICATION, 2023–2029 (USD MILLION)
  • TABLE 41 GLOBAL SILANES MARKET, BY APPLICATION, 2020–2022 (THOUSAND TONS)
  • TABLE 42 GLOBAL SILANES MARKET, BY APPLICATION, 2023–2029 (THOUSAND TONS)
  • TABLE 43 GLOBAL SILANES MARKET, BY END-USE INDUSTRY, 2020–2022 (USD MILLION)
  • TABLE 44 GLOBAL SILANES MARKET, BY END-USE INDUSTRY, 2023–2029 (USD MILLION)
  • TABLE 45 GLOBAL SILANES MARKET, BY END-USE INDUSTRY, 2020–2022 (THOUSAND TONS)
  • TABLE 46 GLOBAL SILANES MARKET, BY END-USE INDUSTRY, 2023–2029 (THOUSAND TONS)
  • TABLE 47 NORTH AMERICA: SILANES MARKET, BY COUNTRY, 2020–2022 (USD MILLION)
  • TABLE 48 NORTH AMERICA: SILANES MARKET, BY COUNTRY, 2023–2029 (USD MILLION)
  • TABLE 49 NORTH AMERICA: SILANES MARKET, BY COUNTRY, 2020–2022 (THOUSAND TONS)
  • TABLE 50 NORTH AMERICA: SILANES MARKET, BY COUNTRY, 2023–2029 (THOUSAND TONS)
  • TABLE 51 NORTH AMERICA: SILANES MARKET, BY TYPE, 2020–2022 (USD MILLION)
  • TABLE 52 NORTH AMERICA: SILANES MARKET, BY TYPE, 2023–2029 (USD MILLION)
  • TABLE 53 NORTH AMERICA: SILANES MARKET, BY TYPE, 2020–2022 (THOUSAND TONS)
  • TABLE 54 NORTH AMERICA: SILANES MARKET, BY TYPE, 2023–2029 (THOUSAND TONS)
  • TABLE 55 NORTH AMERICA: SILANES MARKET, BY APPLICATION, 2020–2022 (USD MILLION)
  • TABLE 56 NORTH AMERICA: SILANES MARKET, BY APPLICATION, 2023–2029 (USD MILLION)
  • TABLE 57 NORTH AMERICA: SILANES MARKET, BY APPLICATION, 2020–2022 (THOUSAND TONS)
  • TABLE 58 NORTH AMERICA: SILANES MARKET, BY APPLICATION, 2023–2029 (THOUSAND TONS)
  • TABLE 59 NORTH AMERICA: SILANES MARKET, BY END-USE INDUSTRY, 2020–2022 (USD MILLION)
  • TABLE 60 NORTH AMERICA: SILANES MARKET, BY END-USE INDUSTRY, 2023–2029 (USD MILLION)
  • TABLE 61 NORTH AMERICA: SILANES MARKET, BY END-USE INDUSTRY, 2020–2022 (THOUSAND TONS)
  • TABLE 62 NORTH AMERICA: SILANES MARKET, BY END-USE INDUSTRY, 2023–2029 (THOUSAND TONS)
  • TABLE 63 US: SILANES MARKET, BY TYPE, 2020–2022 (USD MILLION)
  • TABLE 64 US: SILANES MARKET, BY TYPE, 2023–2029 (USD MILLION)
  • TABLE 65 US: SILANES MARKET, BY TYPE, 2020–2022 (THOUSAND TONS)
  • TABLE 66 US: SILANES MARKET, BY TYPE, 2023–2029 (THOUSAND TONS)
  • TABLE 67 US: SILANES MARKET, BY APPLICATION, 2020–2022 (USD MILLION)
  • TABLE 68 US: SILANES MARKET, BY APPLICATION, 2023–2029 (USD MILLION)
  • TABLE 69 US: SILANES MARKET, BY APPLICATION, 2020–2022 (THOUSAND TONS)
  • TABLE 70 US: SILANES MARKET, BY APPLICATION, 2023–2029 (THOUSAND TONS)
  • TABLE 71 US: SILANES MARKET, BY END-USE INDUSTRY, 2020–2022 (USD MILLION)
  • TABLE 72 US: SILANES MARKET, BY END-USE INDUSTRY, 2023–2029 (USD MILLION)
  • TABLE 73 US: SILANES MARKET, BY END-USE INDUSTRY, 2020–2022 (THOUSAND TONS)
  • TABLE 74 US: SILANES MARKET, BY END-USE INDUSTRY, 2023–2029 (THOUSAND TONS)
  • TABLE 75 CANADA: SILANES MARKET, BY TYPE, 2020–2022 (USD MILLION)
  • TABLE 76 CANADA: SILANES MARKET, BY TYPE, 2023–2029 (USD MILLION)
  • TABLE 77 CANADA: SILANES MARKET, BY TYPE, 2020–2022 (THOUSAND TONS)
  • TABLE 78 CANADA: SILANES MARKET, BY TYPE, 2023–2029 (THOUSAND TONS)
  • TABLE 79 CANADA: SILANES MARKET, BY APPLICATION, 2020–2022 (USD MILLION)
  • TABLE 80 CANADA: SILANES MARKET, BY APPLICATION, 2023–2029 (USD MILLION)
  • TABLE 81 CANADA: SILANES MARKET, BY APPLICATION, 2020–2022 (THOUSAND TONS)
  • TABLE 82 CANADA: SILANES MARKET, BY APPLICATION, 2023–2029 (THOUSAND TONS)
  • TABLE 83 CANADA: SILANES MARKET, BY END-USE INDUSTRY, 2020–2022 (USD MILLION)
  • TABLE 84 CANADA: SILANES MARKET, BY END-USE INDUSTRY, 2023–2029 (USD MILLION)
  • TABLE 85 CANADA: SILANES MARKET, BY END-USE INDUSTRY, 2020–2022 (THOUSAND TONS)
  • TABLE 86 CANADA: SILANES MARKET, BY END-USE INDUSTRY, 2023–2029 (THOUSAND TONS)
  • TABLE 87 MEXICO: SILANES MARKET, BY TYPE, 2020–2022 (USD MILLION)
  • TABLE 88 MEXICO: SILANES MARKET, BY TYPE, 2023–2029 (USD MILLION)
  • TABLE 89 MEXICO: SILANES MARKET, BY TYPE, 2020–2022 (THOUSAND TONS)
  • TABLE 90 MEXICO: SILANES MARKET, BY TYPE, 2023–2029 (THOUSAND TONS)
  • TABLE 91 MEXICO: SILANES MARKET, BY APPLICATION, 2020–2022 (USD MILLION)
  • TABLE 92 MEXICO: SILANES MARKET, BY APPLICATION, 2023–2029 (USD MILLION)
  • TABLE 93 MEXICO: SILANES MARKET, BY APPLICATION, 2020–2022 (THOUSAND TONS)
  • TABLE 94 MEXICO: SILANES MARKET, BY APPLICATION, 2023–2029 (THOUSAND TONS)
  • TABLE 95 MEXICO: SILANES MARKET, BY END-USE INDUSTRY, 2020–2022 (USD MILLION)
  • TABLE 96 MEXICO: SILANES MARKET, BY END-USE INDUSTRY, 2023–2029 (USD MILLION)
  • TABLE 97 MEXICO: SILANES MARKET, BY END-USE INDUSTRY, 2020–2022 (THOUSAND TONS)
  • TABLE 98 MEXICO: SILANES MARKET, BY END-USE INDUSTRY, 2023–2029 (THOUSAND TONS)
  • TABLE 99 EUROPE: SILANES MARKET, BY COUNTRY, 2020–2023 (USD MILLION)
  • TABLE 100 EUROPE: SILANES MARKET, BY COUNTRY, 2023–2029 (USD MILLION)
  • TABLE 101 EUROPE: SILANES MARKET, BY COUNTRY, 2020–2023 (THOUSAND TONS)
  • TABLE 102 EUROPE: SILANES MARKET, BY COUNTRY, 2023–2029 (THOUSAND TONS)
  • TABLE 103 EUROPE: SILANES MARKET, BY TYPE, 2020–2022 (USD MILLION)
  • TABLE 104 EUROPE: SILANES MARKET, BY TYPE, 2023–2029 (USD MILLION)
  • TABLE 105 EUROPE: SILANES MARKET, BY TYPE, 2020–2022 (THOUSAND TONS)
  • TABLE 106 EUROPE: SILANES MARKET, BY TYPE, 2023–2029 (THOUSAND TONS)
  • TABLE 107 EUROPE: SILANES MARKET, BY APPLICATION, 2020–2022 (USD MILLION)
  • TABLE 108 EUROPE: SILANES MARKET, BY APPLICATION, 2023–2029 (USD MILLION)
  • TABLE 109 EUROPE: SILANES MARKET, BY APPLICATION, 2020–2022 (THOUSAND TONS)
  • TABLE 110 EUROPE: SILANES MARKET, BY APPLICATION, 2023–2029 (THOUSAND TONS)
  • TABLE 111 EUROPE: SILANES MARKET, BY END-USE INDUSTRY, 2020–2022 (USD MILLION)
  • TABLE 112 EUROPE: SILANES MARKET, BY END-USE INDUSTRY, 2023–2029 (USD MILLION)
  • TABLE 113 EUROPE: SILANES MARKET, BY END-USE INDUSTRY, 2020–2022 (THOUSAND TONS)
  • TABLE 114 EUROPE: SILANES MARKET, BY END-USE INDUSTRY, 2023–2029 (THOUSAND TONS)
  • TABLE 115 GERMANY: SILANES MARKET, BY TYPE, 2020–2022 (USD MILLION)
  • TABLE 116 GERMANY: SILANES MARKET, BY TYPE, 2023–2029 (USD MILLION)
  • TABLE 117 GERMANY: SILANES MARKET, BY TYPE, 2020–2022 (THOUSAND TONS)
  • TABLE 118 GERMANY: SILANES MARKET, BY TYPE, 2023-2029 (THOUSAND TONS)
  • TABLE 119 GERMANY: SILANES MARKET, BY APPLICATION, 2020–2022 (USD MILLION)
  • TABLE 120 GERMANY: SILANES MARKET, BY APPLICATION, 2023–2029 (USD MILLION)
  • TABLE 121 GERMANY: SILANES MARKET, BY APPLICATION, 2020–2022 (THOUSAND TONS)
  • TABLE 122 GERMANY: SILANES MARKET, BY APPLICATION, 2023–2029 (THOUSAND TONS)
  • TABLE 123 GERMANY: SILANES MARKET, BY END-USE INDUSTRY, 2020–2022 (USD MILLION)
  • TABLE 124 GERMANY: SILANES MARKET, BY END-USE INDUSTRY, 2023–2029 (USD MILLION)
  • TABLE 125 GERMANY: SILANES MARKET, BY END-USE INDUSTRY, 2020–2022 (THOUSAND TONS)
  • TABLE 126 GERMANY: SILANES MARKET, BY END-USE INDUSTRY, 2023–2029 (THOUSAND TONS)
  • TABLE 127 FRANCE: SILANES MARKET, BY TYPE, 2020–2022 (USD MILLION)
  • TABLE 128 FRANCE: SILANES MARKET, BY TYPE, 2023–2029 (USD MILLION)
  • TABLE 129 FRANCE: SILANES MARKET, BY TYPE, 2020–2022 (THOUSAND TONS)
  • TABLE 130 FRANCE: SILANES MARKET, BY TYPE, 2023–2029 (THOUSAND TONS)
  • TABLE 131 FRANCE: SILANES MARKET, BY APPLICATION, 2020–2022 (USD MILLION)
  • TABLE 132 FRANCE: SILANES MARKET, BY APPLICATION, 2023–2029 (USD MILLION)
  • TABLE 133 FRANCE: SILANES MARKET, BY APPLICATION, 2020–2022 (THOUSAND TONS)
  • TABLE 134 FRANCE: SILANES MARKET, BY APPLICATION, 2023–2029 (THOUSAND TONS)
  • TABLE 135 FRANCE: SILANES MARKET, BY END-USE INDUSTRY, 2020–2022 (USD MILLION)
  • TABLE 136 FRANCE: SILANES MARKET, BY END-USE INDUSTRY, 2023–2029 (USD MILLION)
  • TABLE 137 FRANCE: SILANES MARKET, BY END-USE INDUSTRY, 2020–2022 (THOUSAND TONS)
  • TABLE 138 FRANCE: SILANES MARKET, BY END-USE INDUSTRY, 2023–2029 (THOUSAND TONS)
  • TABLE 139 UK: SILANES MARKET, BY TYPE, 2020–2022 (USD MILLION)
  • TABLE 140 UK: SILANES MARKET, BY TYPE, 2023–2029 (USD MILLION)
  • TABLE 141 UK: SILANES MARKET, BY TYPE, 2020–2022 (THOUSAND TONS)
  • TABLE 142 UK: SILANES MARKET, BY TYPE, 2023–2029 (THOUSAND TONS)
  • TABLE 143 UK: SILANES MARKET, BY APPLICATION, 2020–2022 (USD MILLION)
  • TABLE 144 UK: SILANES MARKET, BY APPLICATION, 2023–2029 (USD MILLION)
  • TABLE 145 UK: SILANES MARKET, BY APPLICATION, 2020–2022 (THOUSAND TONS)
  • TABLE 146 UK: SILANES MARKET, BY APPLICATION, 2023–2029 (THOUSAND TONS)
  • TABLE 147 UK: SILANES MARKET, BY END-USE INDUSTRY, 2020–2022 (USD MILLION)
  • TABLE 148 UK: SILANES MARKET, BY END-USE INDUSTRY, 2023–2029 (USD MILLION)
  • TABLE 149 UK: SILANES MARKET, BY END-USE INDUSTRY, 2020–2022 (THOUSAND TONS)
  • TABLE 150 UK: SILANES MARKET, BY END-USE INDUSTRY, 2023–2029 (THOUSAND TONS)
  • TABLE 151 ITALY: SILANES MARKET, BY TYPE, 2020–2022 (USD MILLION)
  • TABLE 152 ITALY: SILANES MARKET, BY TYPE, 2023–2029 (USD MILLION)
  • TABLE 153 ITALY: SILANES MARKET, BY TYPE, 2020–2022 (THOUSAND TONS)
  • TABLE 154 ITALY: SILANES MARKET, BY TYPE, 2023–2029 (THOUSAND TONS)
  • TABLE 155 ITALY: SILANES MARKET, BY APPLICATION, 2020–2022 (USD MILLION)
  • TABLE 156 ITALY: SILANES MARKET, BY APPLICATION, 2023–2029 (USD MILLION)
  • TABLE 157 ITALY: SILANES MARKET, BY APPLICATION, 2020–2022 (THOUSAND TONS)
  • TABLE 158 ITALY: SILANES MARKET, BY APPLICATION, 2023–2029 (THOUSAND TONS)
  • TABLE 159 ITALY: SILANES MARKET, BY END-USE INDUSTRY, 2020–2022 (USD MILLION)
  • TABLE 160 ITALY: SILANES MARKET, BY END-USE INDUSTRY, 2023–2029 (USD MILLION)
  • TABLE 161 ITALY: SILANES MARKET, BY END-USE INDUSTRY, 2020–2022 (THOUSAND TONS)
  • TABLE 162 ITALY: SILANES MARKET, BY END-USE INDUSTRY, 2023–2029 (THOUSAND TONS)
  • TABLE 163 SPAIN: SILANES MARKET, BY TYPE, 2020–2022 (USD MILLION)
  • TABLE 164 SPAIN: SILANES MARKET, BY TYPE, 2023–2029 (USD MILLION)
  • TABLE 165 SPAIN: SILANES MARKET, BY TYPE, 2020–2022 (THOUSAND TONS)
  • TABLE 166 SPAIN: SILANES MARKET, BY TYPE, 2023–2029 (THOUSAND TONS)
  • TABLE 167 SPAIN: SILANES MARKET, BY APPLICATION, 2020–2022 (USD MILLION)
  • TABLE 168 SPAIN: SILANES MARKET, BY APPLICATION, 2023–2029 (USD MILLION)
  • TABLE 169 SPAIN: SILANES MARKET, BY APPLICATION, 2020–2022 (THOUSAND TONS)
  • TABLE 170 SPAIN: SILANES MARKET, BY APPLICATION, 2023–2029 (THOUSAND TONS)
  • TABLE 171 SPAIN: SILANES MARKET, BY END-USE INDUSTRY, 2020–2022 (USD MILLION)
  • TABLE 172 SPAIN: SILANES MARKET, BY END-USE INDUSTRY, 2023–2029 (USD MILLION)
  • TABLE 173 SPAIN: SILANES MARKET, BY END-USE INDUSTRY, 2020–2022 (THOUSAND TONS)
  • TABLE 174 SPAIN: SILANES MARKET, BY END-USE INDUSTRY, 2023–2029 (THOUSAND TONS)
  • TABLE 175 REST OF EUROPE: SILANES MARKET, BY TYPE, 2020–2022 (USD MILLION)
  • TABLE 176 REST OF EUROPE: SILANES MARKET, BY TYPE, 2023–2029 (USD MILLION)
  • TABLE 177 REST OF EUROPE: SILANES MARKET, BY TYPE, 2020–2022 (THOUSAND TONS)
  • TABLE 178 REST OF EUROPE: SILANES MARKET, BY TYPE, 2023–2029 (THOUSAND TONS)
  • TABLE 179 REST OF EUROPE: SILANES MARKET, BY APPLICATION, 2020–2022 (USD MILLION)
  • TABLE 180 REST OF EUROPE: SILANES MARKET, BY APPLICATION, 2023–2029 (USD MILLION)
  • TABLE 181 REST OF EUROPE: SILANES MARKET, BY APPLICATION, 2020–2022 (THOUSAND TONS)
  • TABLE 182 REST OF EUROPE: SILANES MARKET, BY APPLICATION, 2023–2029 (THOUSAND TONS)
  • TABLE 183 REST OF EUROPE: SILANES MARKET, BY END-USE INDUSTRY, 2020–2022 (USD MILLION)
  • TABLE 184 REST OF EUROPE: SILANES MARKET, BY END-USE INDUSTRY, 2023–2029 (USD MILLION)
  • TABLE 185 REST OF EUROPE: SILANES MARKET, BY END-USE INDUSTRY, 2020–2022 (THOUSAND TONS)
  • TABLE 186 REST OF EUROPE: SILANES MARKET, BY END-USE INDUSTRY, 2023–2029 (THOUSAND TONS)
  • TABLE 187 ASIA PACIFIC: SILANES MARKET, BY COUNTRY, 2020–2022 (USD MILLION)
  • TABLE 188 ASIA PACIFIC: SILANES MARKET, BY COUNTRY, 2023–2029 (USD MILLION)
  • TABLE 189 ASIA PACIFIC: SILANES MARKET, BY COUNTRY, 2020–2022 (THOUSAND TONS)
  • TABLE 190 ASIA PACIFIC: SILANES MARKET, BY COUNTRY, 2023–2029 (THOUSAND TONS)
  • TABLE 191 ASIA PACIFIC: SILANES MARKET, BY TYPE, 2020–2022 (USD MILLION)
  • TABLE 192 ASIA PACIFIC: SILANES MARKET, BY TYPE, 2023–2029 (USD MILLION)
  • TABLE 193 ASIA PACIFIC: SILANES MARKET, BY TYPE, 2020–2022 (THOUSAND TONS)
  • TABLE 194 ASIA PACIFIC: SILANES MARKET, BY TYPE, 2023–2029 (THOUSAND TONS)
  • TABLE 195 ASIA PACIFIC: SILANES MARKET, BY APPLICATION, 2020–2022 (USD MILLION)
  • TABLE 196 ASIA PACIFIC: SILANES MARKET, BY APPLICATION, 2023–2029 (USD MILLION)
  • TABLE 197 ASIA PACIFIC: SILANES MARKET, BY APPLICATION, 2020–2022 (THOUSAND TONS)
  • TABLE 198 ASIA PACIFIC: SILANES MARKET, BY APPLICATION, 2023–2029 (THOUSAND TONS)
  • TABLE 199 ASIA PACIFIC: SILANES MARKET, BY END-USE INDUSTRY, 2020–2022 (USD MILLION)
  • TABLE 200 ASIA PACIFIC: SILANES MARKET, BY END-USE INDUSTRY, 2023–2029 (USD MILLION)
  • TABLE 201 ASIA PACIFIC: SILANES MARKET, BY END-USE INDUSTRY, 2020–2022 (THOUSAND TONS)
  • TABLE 202 ASIA PACIFIC: SILANES MARKET, BY END-USE INDUSTRY, 2023–2029 (THOUSAND TONS)
  • TABLE 203 CHINA: SILANES MARKET, BY TYPE, 2020–2022 (USD MILLION)
  • TABLE 204 CHINA: SILANES MARKET, BY TYPE, 2023–2029 (USD MILLION)
  • TABLE 205 CHINA: SILANES MARKET, BY TYPE, 2020–2022 (THOUSAND TONS)
  • TABLE 206 CHINA: SILANES MARKET, BY TYPE, 2023–2029 (THOUSAND TONS)
  • TABLE 207 CHINA: SILANES MARKET, BY APPLICATION, 2020–2022 (USD MILLION)
  • TABLE 208 CHINA: SILANES MARKET, BY APPLICATION, 2023–2029 (USD MILLION)
  • TABLE 209 CHINA: SILANES MARKET, BY APPLICATION, 2020–2022 (THOUSAND TONS)
  • TABLE 210 CHINA: SILANES MARKET, BY APPLICATION, 2023–2029 (THOUSAND TONS)
  • TABLE 211 CHINA: SILANES MARKET, BY END-USE INDUSTRY, 2020–2022 (USD MILLION)
  • TABLE 212 CHINA: SILANES MARKET, BY END-USE INDUSTRY, 2023–2029 (USD MILLION)
  • TABLE 213 CHINA: SILANES MARKET, BY END-USE INDUSTRY, 2020–2022 (THOUSAND TONS)
  • TABLE 214 CHINA: SILANES MARKET, BY END-USE INDUSTRY, 2023–2029 (THOUSAND TONS)
  • TABLE 215 PRODUCTION VALUE OF ELECTRONICS ITEMS, APRIL 2023
  • TABLE 216 JAPAN: SILANES MARKET, BY TYPE, 2020–2022 (USD MILLION)
  • TABLE 217 JAPAN: SILANES MARKET, BY TYPE, 2023–2029 (USD MILLION)
  • TABLE 218 JAPAN: SILANES MARKET, BY TYPE, 2020–2022 (THOUSAND TONS)
  • TABLE 219 JAPAN: SILANES MARKET, BY TYPE, 2023–2029 (THOUSAND TONS)
  • TABLE 220 JAPAN: SILANES MARKET, BY APPLICATION, 2020–2022 (USD MILLION)
  • TABLE 221 JAPAN: SILANES MARKET, BY APPLICATION, 2023–2029 (USD MILLION)
  • TABLE 222 JAPAN: SILANES MARKET, BY APPLICATION, 2020–2022 (THOUSAND TONS)
  • TABLE 223 JAPAN: SILANES MARKET, BY APPLICATION, 2023–2029 (THOUSAND TONS)
  • TABLE 224 JAPAN: SILANES MARKET, BY END-USE INDUSTRY, 2020–2022 (USD MILLION)
  • TABLE 225 JAPAN: SILANES MARKET, BY END-USE INDUSTRY, 2023–2029 (USD MILLION)
  • TABLE 226 JAPAN: SILANES MARKET, BY END-USE INDUSTRY, 2020–2022 (THOUSAND TONS)
  • TABLE 227 JAPAN: SILANES MARKET, BY END-USE INDUSTRY, 2023–2029 (THOUSAND TONS)
  • TABLE 228 INDIA: SILANES MARKET, BY TYPE, 2020–2022 (USD MILLION)
  • TABLE 229 INDIA: SILANES MARKET, BY TYPE, 2023–2029 (USD MILLION)
  • TABLE 230 INDIA: SILANES MARKET, BY TYPE, 2020–2022 (THOUSAND TONS)
  • TABLE 231 INDIA: SILANES MARKET, BY TYPE, 2023–2029 (THOUSAND TONS)
  • TABLE 232 INDIA: SILANES MARKET, BY APPLICATION, 2020–2022 (USD MILLION)
  • TABLE 233 INDIA: SILANES MARKET, BY APPLICATION, 2023–2029 (USD MILLION)
  • TABLE 234 INDIA: SILANES MARKET, BY APPLICATION, 2020–2022 (THOUSAND TONS)
  • TABLE 235 INDIA: SILANES MARKET, BY APPLICATION, 2023–2029 (THOUSAND TONS)
  • TABLE 236 INDIA: SILANES MARKET, BY END-USE INDUSTRY, 2020–2022 (USD MILLION)
  • TABLE 237 INDIA: SILANES MARKET, BY END-USE INDUSTRY, 2023–2029 (USD MILLION)
  • TABLE 238 INDIA: SILANES MARKET, BY END-USE INDUSTRY, 2020–2022 (THOUSAND TONS)
  • TABLE 239 INDIA: SILANES MARKET, BY END-USE INDUSTRY, 2023–2029 (THOUSAND TONS)
  • TABLE 240 SOUTH KOREA: SILANES MARKET, BY TYPE, 2020–2022 (USD MILLION)
  • TABLE 241 SOUTH KOREA: SILANES MARKET, BY TYPE, 2023–2029 (USD MILLION)
  • TABLE 242 SOUTH KOREA: SILANES MARKET, BY TYPE, 2020–2022 (THOUSAND TONS)
  • TABLE 243 SOUTH KOREA: SILANES MARKET, BY TYPE, 2023–2029 (THOUSAND TONS)
  • TABLE 244 SOUTH KOREA: SILANES MARKET, BY APPLICATION, 2020–2022 (USD MILLION)
  • TABLE 245 SOUTH KOREA: SILANES MARKET, BY APPLICATION, 2023–2029 (USD MILLION)
  • TABLE 246 SOUTH KOREA: SILANES MARKET, BY APPLICATION, 2020–2022 (THOUSAND TONS)
  • TABLE 247 SOUTH KOREA: SILANES MARKET, BY APPLICATION, 2023–2029 (THOUSAND TONS)
  • TABLE 248 SOUTH KOREA: SILANES MARKET, BY END-USE INDUSTRY, 2020–2022 (USD MILLION)
  • TABLE 249 SOUTH KOREA: SILANES MARKET, BY END-USE INDUSTRY, 2023–2029 (USD MILLION)
  • TABLE 250 SOUTH KOREA: ASIA PACIFIC: SILANES MARKET, BY END-USE INDUSTRY, 2020–2022 (THOUSAND TONS)
  • TABLE 251 SOUTH KOREA: SILANES MARKET, BY END-USE INDUSTRY, 2023–2029 (THOUSAND TONS)
  • TABLE 252 REST OF ASIA PACIFIC: SILANES MARKET, BY TYPE, 2020–2022 (USD MILLION)
  • TABLE 253 REST OF ASIA PACIFIC: SILANES MARKET, BY TYPE, 2023–2029 (USD MILLION)
  • TABLE 254 REST OF ASIA PACIFIC: SILANES MARKET, BY TYPE, 2020–2022 (THOUSAND TONS)
  • TABLE 255 REST OF ASIA PACIFIC: SILANES MARKET, BY TYPE, 2023–2029 (THOUSAND TONS)
  • TABLE 256 REST OF ASIA PACIFIC: SILANES MARKET, BY APPLICATION, 2020–2022 (USD MILLION)
  • TABLE 257 REST OF ASIA PACIFIC: SILANES MARKET, BY APPLICATION, 2023–2029 (USD MILLION)
  • TABLE 258 REST OF ASIA PACIFIC: SILANES MARKET, BY APPLICATION, 2020–2022 (THOUSAND TONS)
  • TABLE 259 REST OF ASIA PACIFIC: SILANES MARKET, BY APPLICATION, 2023–2029 (THOUSAND TONS)
  • TABLE 260 REST OF ASIA PACIFIC: SILANES MARKET, BY END-USE INDUSTRY, 2020–2022 (USD MILLION)
  • TABLE 261 REST OF ASIA PACIFIC: SILANES MARKET, BY END-USE INDUSTRY, 2023–2029 (USD MILLION)
  • TABLE 262 REST OF ASIA PACIFIC: SILANES MARKET, BY END-USE INDUSTRY, 2020–2022 (THOUSAND TONS)
  • TABLE 263 REST OF ASIA PACIFIC: SILANES MARKET, BY END-USE INDUSTRY, 2023–2029 (THOUSAND TONS)
  • TABLE 264 SOUTH AMERICA: SILANES MARKET, BY COUNTRY, 2020–2022 (USD MILLION)
  • TABLE 265 SOUTH AMERICA: SILANES MARKET, BY COUNTRY, 2023–2029 (USD MILLION)
  • TABLE 266 SOUTH AMERICA: SILANES MARKET, BY COUNTRY, 2020–2022 (THOUSAND TONS)
  • TABLE 267 SOUTH AMERICA: SILANES MARKET, BY COUNTRY, 2023–2029 (THOUSAND TONS)
  • TABLE 268 SOUTH AMERICA: SILANES MARKET, BY TYPE, 2020–2022 (USD MILLION)
  • TABLE 269 SOUTH AMERICA: SILANES MARKET, BY TYPE, 2023–2029 (USD MILLION)
  • TABLE 270 SOUTH AMERICA: SILANES MARKET, BY TYPE, 2020–2022 (THOUSAND TONS)
  • TABLE 271 SOUTH AMERICA: SILANES MARKET, BY TYPE, 2023–2029 (THOUSAND TONS)
  • TABLE 272 SOUTH AMERICA: SILANES MARKET, BY APPLICATION, 2020–2022 (USD MILLION)
  • TABLE 273 SOUTH AMERICA: SILANES MARKET, BY APPLICATION, 2023–2029 (USD MILLION)
  • TABLE 274 SOUTH AMERICA: SILANES MARKET, BY APPLICATION, 2020–2022 (THOUSAND TONS)
  • TABLE 275 SOUTH AMERICA: SILANES MARKET, BY APPLICATION, 2023–2029 (THOUSAND TONS)
  • TABLE 276 SOUTH AMERICA: SILANES MARKET, BY END-USE INDUSTRY, 2020–2022 (USD MILLION)
  • TABLE 277 SOUTH AMERICA: SILANES MARKET, BY END-USE INDUSTRY, 2023–2029 (USD MILLION)
  • TABLE 278 SOUTH AMERICA: SILANES MARKET, BY END-USE INDUSTRY, 2020–2022 (THOUSAND TONS)
  • TABLE 279 SOUTH AMERICA: SILANES MARKET, BY END-USE INDUSTRY, 2023–2029 (THOUSAND TONS)
  • TABLE 280 BRAZIL: SILANES MARKET, BY TYPE, 2020–2022 (USD MILLION)
  • TABLE 281 BRAZIL: SILANES MARKET, BY TYPE, 2023–2029 (USD MILLION)
  • TABLE 282 BRAZIL: SILANES MARKET, BY TYPE, 2020–2022 (THOUSAND TONS)
  • TABLE 283 BRAZIL: SILANES MARKET, BY TYPE, 2023–2029 (THOUSAND TONS)
  • TABLE 284 BRAZIL: SILANES MARKET, BY APPLICATION, 2020–2022 (USD MILLION)
  • TABLE 285 BRAZIL: SILANES MARKET, BY APPLICATION, 2023–2029 (USD MILLION)
  • TABLE 286 BRAZIL: SILANES MARKET, BY APPLICATION, 2020–2022 (THOUSAND TONS)
  • TABLE 287 BRAZIL: SILANES MARKET, BY APPLICATION, 2023–2029 (THOUSAND TONS)
  • TABLE 288 BRAZIL: SILANES MARKET, BY END-USE INDUSTRY, 2020–2022 (USD MILLION)
  • TABLE 289 BRAZIL: SILANES MARKET, BY END-USE INDUSTRY, 2023–2029 (USD MILLION)
  • TABLE 290 BRAZIL: SILANES MARKET, BY END-USE INDUSTRY, 2020–2022 (THOUSAND TONS)
  • TABLE 291 BRAZIL: SILANES MARKET, BY END-USE INDUSTRY, 2023–2029 (THOUSAND TONS)
  • TABLE 292 ARGENTINA: SILANES MARKET, BY TYPE, 2020–2022 (USD MILLION)
  • TABLE 293 ARGENTINA: SILANES MARKET, BY TYPE, 2023–2029 (USD MILLION)
  • TABLE 294 ARGENTINA: SILANES MARKET, BY TYPE, 2020–2022 (THOUSAND TONS)
  • TABLE 295 ARGENTINA: SILANES MARKET, BY TYPE, 2023–2029 (THOUSAND TONS)
  • TABLE 296 ARGENTINA: SILANES MARKET, BY APPLICATION, 2020–2022 (USD MILLION)
  • TABLE 297 ARGENTINA: SILANES MARKET, BY APPLICATION, 2023–2029 (USD MILLION)
  • TABLE 298 ARGENTINA: SILANES MARKET, BY APPLICATION, 2020–2022 (THOUSAND TONS)
  • TABLE 299 ARGENTINA: SILANES MARKET, BY APPLICATION, 2023–2029 (THOUSAND TONS)
  • TABLE 300 ARGENTINA: SILANES MARKET, BY END-USE INDUSTRY, 2020–2022 (USD MILLION)
  • TABLE 301 ARGENTINA: SILANES MARKET, BY END-USE INDUSTRY, 2023–2029 (USD MILLION)
  • TABLE 302 ARGENTINA: SILANES MARKET, BY END-USE INDUSTRY, 2020–2022 (THOUSAND TONS)
  • TABLE 303 ARGENTINA: SILANES MARKET, BY END-USE INDUSTRY, 2023–2029 (THOUSAND TONS)
  • TABLE 304 REST OF SOUTH AMERICA: SILANES MARKET, BY TYPE, 2020–2022 (USD MILLION)
  • TABLE 305 REST OF SOUTH AMERICA: SILANES MARKET, BY TYPE, 2023–2029 (USD MILLION)
  • TABLE 306 REST OF SOUTH AMERICA: SILANES MARKET, BY TYPE, 2020–2022 (THOUSAND TONS)
  • TABLE 307 REST OF SOUTH AMERICA: SILANES MARKET, BY TYPE, 2023–2029 (THOUSAND TONS)
  • TABLE 308 REST OF SOUTH AMERICA: SILANES MARKET, BY APPLICATION, 2020–2022 (USD MILLION)
  • TABLE 309 REST OF SOUTH AMERICA: SILANES MARKET, BY APPLICATION, 2023–2029 (USD MILLION)
  • TABLE 310 REST OF SOUTH AMERICA: SILANES MARKET, BY APPLICATION, 2020–2022 (THOUSAND TONS)
  • TABLE 311 REST OF SOUTH AMERICA: SILANES MARKET, BY APPLICATION, 2023–2029 (THOUSAND TONS)
  • TABLE 312 REST OF SOUTH AMERICA: SILANES MARKET, BY END-USE INDUSTRY, 2020–2022 (USD MILLION)
  • TABLE 313 REST OF SOUTH AMERICA: SILANES MARKET, BY END-USE INDUSTRY, 2023–2029 (USD MILLION)
  • TABLE 314 REST OF SOUTH AMERICA: SILANES MARKET, BY END-USE INDUSTRY, 2020–2022 (THOUSAND TONS)
  • TABLE 315 REST OF SOUTH AMERICA: SILANES MARKET, BY END-USE INDUSTRY, 2023–2029 (THOUSAND TONS)
  • TABLE 316 MIDDLE EAST & AFRICA: SILANES MARKET, BY COUNTRY, 2020–2022 (USD MILLION)
  • TABLE 317 MIDDLE EAST & AFRICA: SILANES MARKET, BY COUNTRY, 2023–2029 (USD MILLION)
  • TABLE 318 MIDDLE EAST & AFRICA: SILANES MARKET, BY COUNTRY, 2020–2022 (THOUSAND TONS)
  • TABLE 319 MIDDLE EAST & AFRICA: SILANES MARKET, BY COUNTRY, 2023–2029 (THOUSAND TONS)
  • TABLE 320 MIDDLE EAST & AFRICA: SILANES MARKET, BY TYPE, 2020–2022 (USD MILLION)
  • TABLE 321 MIDDLE EAST & AFRICA: SILANES MARKET, BY TYPE, 2023–2029 (USD MILLION)
  • TABLE 322 MIDDLE EAST & AFRICA: SILANES MARKET, BY TYPE, 2020–2022 (THOUSAND TONS)
  • TABLE 323 MIDDLE EAST & AFRICA: SILANES MARKET, BY TYPE, 2023–2029 (THOUSAND TONS)
  • TABLE 324 MIDDLE EAST & AFRICA: SILANES MARKET, BY APPLICATION, 2020–2022 (USD MILLION)
  • TABLE 325 MIDDLE EAST & AFRICA: SILANES MARKET, BY APPLICATION, 2023–2029 (USD MILLION)
  • TABLE 326 MIDDLE EAST & AFRICA: SILANES MARKET, BY APPLICATION, 2020–2022 (THOUSAND TONS)
  • TABLE 327 MIDDLE EAST & AFRICA: SILANES MARKET, BY APPLICATION, 2023–2029 (THOUSAND TONS)
  • TABLE 328 MIDDLE EAST & AFRICA: SILANES MARKET, BY END-USE INDUSTRY, 2020–2022 (USD MILLION)
  • TABLE 329 MIDDLE EAST & AFRICA: SILANES MARKET, BY END-USE INDUSTRY, 2023–2029 (USD MILLION)
  • TABLE 330 MIDDLE EAST & AFRICA: SILANES MARKET, BY END-USE INDUSTRY, 2020–2022 (THOUSAND TONS)
  • TABLE 331 MIDDLE EAST & AFRICA: SILANES MARKET, BY END-USE INDUSTRY, 2023–2029 (THOUSAND TONS)
  • TABLE 332 GCC COUNTRIES: SILANES MARKET, BY TYPE, 2020–2022 (USD MILLION)
  • TABLE 333 GCC COUNTRIES: SILANES MARKET, BY TYPE, 2023–2029 (USD MILLION)
  • TABLE 334 GCC COUNTRIES: SILANES MARKET, BY TYPE, 2020–2022 (THOUSAND TONS)
  • TABLE 335 GCC COUNTRIES: SILANES MARKET, BY TYPE, 2023–2029 (THOUSAND TONS)
  • TABLE 336 GCC COUNTRIES: SILANES MARKET, BY APPLICATION, 2020–2022 (USD MILLION)
  • TABLE 337 GCC COUNTRIES: SILANES MARKET, BY APPLICATION, 2023–2029 (USD MILLION)
  • TABLE 338 GCC COUNTRIES: SILANES MARKET, BY APPLICATION, 2020–2022 (THOUSAND TONS)
  • TABLE 339 GCC COUNTRIES: SILANES MARKET, BY APPLICATION, 2023–2029 (THOUSAND TONS)
  • TABLE 340 GCC COUNTRIES: SILANES MARKET, BY END-USE INDUSTRY, 2020–2022 (USD MILLION)
  • TABLE 341 GCC COUNTRIES: SILANES MARKET, BY END-USE INDUSTRY, 2023–2029 (USD MILLION)
  • TABLE 342 GCC COUNTRIES: SILANES MARKET, BY END-USE INDUSTRY, 2020–2022 (THOUSAND TONS)
  • TABLE 343 GCC COUNTRIES: SILANES MARKET, BY END-USE INDUSTRY, 2023–2029 (THOUSAND TONS)
  • TABLE 344 SAUDI ARABIA: SILANES MARKET, BY TYPE, 2020–2022 (USD MILLION)
  • TABLE 345 SAUDI ARABIA: SILANES MARKET, BY TYPE, 2023–2029 (USD MILLION)
  • TABLE 346 SAUDI ARABIA: SILANES MARKET, BY TYPE, 2020–2022 (THOUSAND TONS)
  • TABLE 347 SAUDI ARABIA: SILANES MARKET, BY TYPE, 2023–2029 (THOUSAND TONS)
  • TABLE 348 SAUDI ARABIA: SILANES MARKET, BY APPLICATION, 2020–2022 (USD MILLION)
  • TABLE 349 SAUDI ARABIA: SILANES MARKET, BY APPLICATION, 2023–2029 (USD MILLION)
  • TABLE 350 SAUDI ARABIA: SILANES MARKET, BY APPLICATION, 2020–2022 (THOUSAND TONS)
  • TABLE 351 SAUDI ARABIA: SILANES MARKET, BY APPLICATION, 2023–2029 (THOUSAND TONS)
  • TABLE 352 SAUDI ARABIA: SILANES MARKET, BY END-USE INDUSTRY, 2020–2022 (USD MILLION)
  • TABLE 353 SAUDI ARABIA: SILANES MARKET, BY END-USE INDUSTRY, 2023–2029 (USD MILLION)
  • TABLE 354 SAUDI ARABIA: SILANES MARKET, BY END-USE INDUSTRY, 2020–2022 (THOUSAND TONS)
  • TABLE 355 SAUDI ARABIA: SILANES MARKET, BY END-USE INDUSTRY, 2023–2029 (THOUSAND TONS)
  • TABLE 356 UAE: SILANES MARKET, BY TYPE, 2020–2022 (USD MILLION)
  • TABLE 357 UAE: SILANES MARKET, BY TYPE, 2023–2029 (USD MILLION)
  • TABLE 358 UAE: SILANES MARKET, BY TYPE, 2020–2022 (THOUSAND TONS)
  • TABLE 359 UAE: SILANES MARKET, BY TYPE, 2023–2029 (THOUSAND TONS)
  • TABLE 360 UAE: SILANES MARKET, BY APPLICATION, 2020–2022 (USD MILLION)
  • TABLE 361 UAE: SILANES MARKET, BY APPLICATION, 2023–2029 (USD MILLION)
  • TABLE 362 UAE: SILANES MARKET, BY APPLICATION, 2020–2022 (THOUSAND TONS)
  • TABLE 363 UAE: SILANES MARKET, BY APPLICATION, 2023–2029 (THOUSAND TONS)
  • TABLE 364 UAE: SILANES MARKET, BY END-USE INDUSTRY, 2020–2022 (USD MILLION)
  • TABLE 365 UAE: SILANES MARKET, BY END-USE INDUSTRY, 2023–2029 (USD MILLION)
  • TABLE 366 UAE: SILANES MARKET, BY END-USE INDUSTRY, 2020–2022 (THOUSAND TONS)
  • TABLE 367 UAE: SILANES MARKET, BY END-USE INDUSTRY, 2023–2029 (THOUSAND TONS)
  • TABLE 368 REST OF GCC: SILANES MARKET, BY TYPE, 2020–2022 (USD MILLION)
  • TABLE 369 REST OF GCC: SILANES MARKET, BY TYPE, 2023–2029 (USD MILLION)
  • TABLE 370 REST OF GCC: SILANES MARKET, BY TYPE, 2020–2022 (THOUSAND TONS)
  • TABLE 371 REST OF GCC: SILANES MARKET, BY TYPE, 2023–2029 (THOUSAND TONS)
  • TABLE 372 REST OF GCC: SILANES MARKET, BY APPLICATION, 2020–2022 (USD MILLION)
  • TABLE 373 REST OF GCC: SILANES MARKET, BY APPLICATION, 2023–2029 (USD MILLION)
  • TABLE 374 REST OF GCC: SILANES MARKET, BY APPLICATION, 2020–2022 (THOUSAND TONS)
  • TABLE 375 REST OF GCC: SILANES MARKET, BY APPLICATION, 2023–2029 (THOUSAND TONS)
  • TABLE 376 REST OF GCC: SILANES MARKET, BY END-USE INDUSTRY, 2020–2022 (USD MILLION)
  • TABLE 377 REST OF GCC: SILANES MARKET, BY END-USE INDUSTRY, 2023–2029 (USD MILLION)
  • TABLE 378 REST OF GCC: SILANES MARKET, BY END-USE INDUSTRY, 2020–2022 (THOUSAND TONS)
  • TABLE 379 REST OF GCC: SILANES MARKET, BY END-USE INDUSTRY, 2023–2029 (THOUSAND TONS)
  • TABLE 380 SOUTH AFRICA: SILANES MARKET, BY TYPE, 2020–2022 (USD MILLION)
  • TABLE 381 SOUTH AFRICA: SILANES MARKET, BY TYPE, 2023–2029 (USD MILLION)
  • TABLE 382 SOUTH AFRICA: SILANES MARKET, BY TYPE, 2020–2022 (THOUSAND TONS)
  • TABLE 383 SOUTH AFRICA: SILANES MARKET, BY TYPE, 2023–2029 (THOUSAND TONS)
  • TABLE 384 SOUTH AFRICA: SILANES MARKET, BY APPLICATION, 2020–2022 (USD MILLION)
  • TABLE 385 SOUTH AFRICA: SILANES MARKET, BY APPLICATION, 2023–2029 (USD MILLION)
  • TABLE 386 SOUTH AFRICA: SILANES MARKET, BY APPLICATION, 2020–2022 (THOUSAND TONS)
  • TABLE 387 SOUTH AFRICA: SILANES MARKET, BY APPLICATION, 2023–2029 (THOUSAND TONS)
  • TABLE 388 SOUTH AFRICA: SILANES MARKET, BY END-USE INDUSTRY, 2020–2022 (USD MILLION)
  • TABLE 389 SOUTH AFRICA: SILANES MARKET, BY END-USE INDUSTRY, 2023–2029 (USD MILLION)
  • TABLE 390 SOUTH AFRICA: SILANES MARKET, BY END-USE INDUSTRY, 2020–2022 (THOUSAND TONS)
  • TABLE 391 SOUTH AFRICA: SILANES MARKET, BY END-USE INDUSTRY, 2023–2029 (THOUSAND TONS)
  • TABLE 392 REST OF MIDDLE EAST & AFRICA: SILANES MARKET, BY TYPE, 2020–2022 (USD MILLION)
  • TABLE 393 REST OF MIDDLE EAST & AFRICA: SILANES MARKET, BY TYPE, 2023–2029 (USD MILLION)
  • TABLE 394 REST OF MIDDLE EAST & AFRICA: SILANES MARKET, BY TYPE, 2020–2022 (THOUSAND TONS)
  • TABLE 395 REST OF MIDDLE EAST & AFRICA: SILANES MARKET, BY TYPE, 2023–2029 (THOUSAND TONS)
  • TABLE 396 REST OF MIDDLE EAST & AFRICA: SILANES MARKET, BY APPLICATION, 2020–2022 (USD MILLION)
  • TABLE 397 REST OF MIDDLE EAST & AFRICA: SILANES MARKET, BY APPLICATION, 2023–2029 (USD MILLION)
  • TABLE 398 REST OF MIDDLE EAST & AFRICA: SILANES MARKET, BY APPLICATION, 2020–2022 (THOUSAND TONS)
  • TABLE 399 REST OF MIDDLE EAST & AFRICA: SILANES MARKET, BY APPLICATION, 2023–2029 (THOUSAND TONS)
  • TABLE 400 REST OF MIDDLE EAST & AFRICA: SILANES MARKET, BY END-USE INDUSTRY, 2020–2022 (USD MILLION)
  • TABLE 401 REST OF MIDDLE EAST & AFRICA: SILANES MARKET, BY END-USE INDUSTRY, 2023–2029 (USD MILLION)
  • TABLE 402 REST OF MIDDLE EAST & AFRICA: SILANES MARKET, BY END-USE INDUSTRY, 2020–2022 (THOUSAND TONS)
  • TABLE 403 REST OF MIDDLE EAST & AFRICA: SILANES MARKET, BY END-USE INDUSTRY, 2023–2029 (THOUSAND TONS)
  • TABLE 404 OVERVIEW OF STRATEGIES ADOPTED BY KEY PLAYERS IN SILANES MARKET
  • TABLE 405 SILANES MARKET: DEGREE OF COMPETITION
  • TABLE 406 SILANES MARKET: TYPE FOOTPRINT
  • TABLE 407 SILANES MARKET: APPLICATION FOOTPRINT
  • TABLE 408 SILANES MARKET: END-USE INDUSTRY FOOTPRINT
  • TABLE 409 SILANES MARKET: REGION FOOTPRINT
  • TABLE 410 COMPETITIVE BENCHMARKING OF KEY STARTUPS/SMES, BY TYPE
  • TABLE 411 COMPETITIVE BENCHMARKING OF KEY STARTUPS/SMES, BY APPLICATION
  • TABLE 412 COMPETITIVE BENCHMARKING OF KEY STARTUPS/SMES, BY END-USE INDUSTRY
  • TABLE 413 COMPETITIVE BENCHMARKING OF KEY STARTUPS/SMES, BY REGION
  • TABLE 414 SILANES MARKET: PRODUCT LAUNCHES/DEVELOPMENTS, JANUARY 2021– FEBRUARY 2025
  • TABLE 415 SILANES MARKET: DEALS, JANUARY 2021– FEBRUARY 2025
  • TABLE 416 SILANES MARKET: EXPANSIONS, JANUARY 2021– FEBRUARY 2025
  • TABLE 417 SILANES MARKET: OTHER DEVELOPMENTS, JANUARY 2021– FEBRUARY 2025
  • TABLE 418 EVONIK INDUSTRIES AG: COMPANY OVERVIEW
  • TABLE 419 EVONIK INDUSTRIES AG: PRODUCTS/SOLUTIONS/SERVICES OFFERED
  • TABLE 420 EVONIK INDUSTRIES AG: EXPANSIONS, JANUARY 2021−FEBRUARY 2025
  • TABLE 421 EVONIK INDUSTRIES AG: OTHER DEVELOPMENTS, JANUARY 2021− FEBRUARY 2025
  • TABLE 422 SHIN-ETSU CHEMICAL CO., LTD.: COMPANY OVERVIEW
  • TABLE 423 SHIN-ETSU CHEMICAL CO., LTD.: PRODUCTS/SOLUTIONS/SERVICES OFFERED
  • TABLE 424 SHIN-ETSU CHEMICAL CO., LTD.: PRODUCT LAUNCHES, JANUARY 2021− FEBRUARY 2025
  • TABLE 425 SHIN-ETSU CHEMICAL CO., LTD.: DEALS, JANUARY 2021– FEBRUARY 2025
  • TABLE 426 SHIN-ETSU CHEMICAL CO., LTD.: EXPANSIONS, JANUARY 2021− FEBRUARY 2025
  • TABLE 427 SHIN-ETSU CHEMICAL CO., LTD.: OTHER DEVELOPMENTS, JANUARY 2021− FEBRUARY 2025
  • TABLE 428 KCC CORPORATION: COMPANY OVERVIEW
  • TABLE 429 KCC CORPORATION: PRODUCTS/SOLUTIONS/SERVICES OFFERED
  • TABLE 430 KCC CORPORATION: PRODUCT LAUNCHES, JANUARY 2021− FEBRUARY 2025
  • TABLE 431 KCC CORPORATION: DEALS, JANUARY 2021– FEBRUARY 2025
  • TABLE 432 KCC CORPORATION: EXPANSIONS, JANUARY 2021− FEBRUARY 2025
  • TABLE 433 DOW: COMPANY OVERVIEW
  • TABLE 434 DOW: PRODUCTS/SOLUTIONS/SERVICES OFFERED
  • TABLE 435 DOW: PRODUCT LAUNCHES, JANUARY 2021− FEBRUARY 2025
  • TABLE 436 DOW: EXPANSIONS, JANUARY 2021− FEBRUARY 2025
  • TABLE 437 WACKER CHEMIE AG: COMPANY OVERVIEW
  • TABLE 438 WACKER CHEMIE AG: PRODUCTS/SOLUTIONS/SERVICES OFFERED
  • TABLE 439 WACKER CHEMIE AG: PRODUCT LAUNCHES, JANUARY 2021− FEBRUARY 2025
  • TABLE 440 WACKER CHEMIE AG: EXPANSIONS, JANUARY 2021− FEBRUARY 2025
  • TABLE 441 GELEST, INC.: COMPANY OVERVIEW
  • TABLE 442 GELEST, INC.: PRODUCTS/SOLUTIONS/SERVICES OFFERED
  • TABLE 443 GELEST, INC.: PRODUCT LAUNCHES, JANUARY 2021− FEBRUARY 2025
  • TABLE 444 GELEST, INC.: DEALS, JANUARY 2021 – FEBRUARY 2025
  • TABLE 445 GELEST, INC.: EXPANSIONS, JANUARY 2021− FEBRUARY 2025
  • TABLE 446 WD SILICONE CO., LTD: COMPANY OVERVIEW
  • TABLE 447 WD SILICONE CO., LTD: PRODUCTS/SOLUTIONS/SERVICES OFFERED
  • TABLE 448 NANJING SHUGUANG CHEMICAL GROUP CO., LTD.: COMPANY OVERVIEW
  • TABLE 449 NANJING SHUGUANG CHEMICAL GROUP CO., LTD.: PRODUCTS/SOLUTIONS/SERVICES OFFERED
  • TABLE 450 CHINA NATIONAL BLUESTAR (GROUP) CO., LTD.: COMPANY OVERVIEW
  • TABLE 451 CHINA NATIONAL BLUESTAR (GROUP) CO., LTD.: PRODUCTS/SOLUTIONS/ SERVICES OFFERED
  • TABLE 452 CHINA NATIONAL BLUESTAR (GROUP) CO., LTD.: PRODUCT LAUNCHES, JANUARY 2021− FEBRUARY 2025
  • TABLE 453 CHINA NATIONAL BLUESTAR (GROUP) CO., LTD.: DEALS, JANUARY 2021– FEBRUARY 2025
  • TABLE 454 CHINA NATIONAL BLUESTAR (GROUP) CO., LTD.: EXPANSIONS, JANUARY 2021− FEBRUARY 2025
  • TABLE 455 NANJING UNION SILICON CHEMICAL CO., LTD.: COMPANY OVERVIEW
  • TABLE 456 NANJING UNION SILICON CHEMICAL CO., LTD.: PRODUCTS/SOLUTIONS/ SERVICES OFFERED
  • TABLE 457 ELECTRONIC CHEMICALS AND MATERIALS MARKET, BY TYPE, 2019–2021 (USD MILLION)
  • TABLE 458 ELECTRONIC CHEMICALS AND MATERIALS MARKET, BY TYPE, 2022–2028 (USD MILLION)
  • TABLE 459 ELECTRONIC CHEMICALS AND MATERIALS MARKET, BY APPLICATION, 2019–2021 (USD MILLION)
  • TABLE 460 ELECTRONIC CHEMICALS AND MATERIALS MARKET, BY APPLICATION, 2022–2028 (USD MILLION)
  • TABLE 461 ELECTRONIC CHEMICALS AND MATERIALS MARKET, BY REGION, 2019–2021 (USD MILLION)
  • TABLE 462 ELECTRONIC CHEMICALS AND MATERIALS MARKET, BY REGION, 2022–2028 (USD MILLION)
  • TABLE 463 PAINTS & COATINGS MARKET, BY TECHNOLOGY, 2018–2023 (USD MILLION)
  • TABLE 464 PAINTS & COATINGS MARKET, BY TECHNOLOGY, 2024–2029 (USD MILLION)
  • TABLE 465 PAINTS & COATINGS MARKET, BY TECHNOLOGY, 2018–2023 (KILOTON)
  • TABLE 466 PAINTS & COATINGS MARKET, BY TECHNOLOGY, 2024–2029 (KILOTON)
  • TABLE 467 PAINTS & COATINGS MARKET, BY RESIN TYPE, 2018–2023 (USD MILLION)
  • TABLE 468 PAINTS & COATINGS MARKET, BY RESIN TYPE, 2024–2029 (USD MILLION)
  • TABLE 469 PAINTS & COATINGS MARKET, BY RESIN TYPE, 2018–2023 (KILOTON)
  • TABLE 470 PAINTS & COATINGS MARKET, BY RESIN TYPE, 2024–2029 (KILOTON)
  • TABLE 471 PAINTS & COATINGS MARKET, BY END-USE INDUSTRY, 2018–2023 (USD MILLION)
  • TABLE 472 PAINTS & COATINGS MARKET, BY END-USE INDUSTRY, 2024–2029 (USD MILLION)
  • TABLE 473 PAINTS & COATINGS MARKET, BY END-USE INDUSTRY, 2018–2023 (KILOTON)
  • TABLE 474 PAINTS & COATINGS MARKET, BY END-USE INDUSTRY, 2024–2029 (KILOTON)
  • TABLE 475 PAINTS & COATINGS MARKET, BY REGION, 2018–2023 (USD MILLION)
  • TABLE 476 PAINTS & COATINGS MARKET, BY REGION, 2024–2029 (USD MILLION)
  • TABLE 477 PAINTS & COATINGS MARKET, BY REGION, 2018–2023 (KILOTON)
  • TABLE 478 PAINTS & COATINGS MARKET, BY REGION, 2024–2029 (KILOTON)
LIST OF FIGURES
 
  • FIGURE 1 SILANES MARKET: SEGMENTATION AND REGIONAL SCOPE
  • FIGURE 2 SILANES MARKET: RESEARCH DESIGN
  • FIGURE 3 KEY DATA FROM SECONDARY SOURCES
  • FIGURE 4 KEY DATA FROM PRIMARY SOURCES
  • FIGURE 5 KEY INDUSTRY INSIGHTS
  • FIGURE 6 BREAKDOWN OF INTERVIEWS WITH EXPERTS
  • FIGURE 7 SILANES MARKET SIZE ESTIMATION: BOTTOM-UP APPROACH
  • FIGURE 8 SILANES MARKET SIZE ESTIMATION: TOP-DOWN APPROACH
  • FIGURE 9 SILANES MARKET SIZE ESTIMATION: APPROACH (SUPPLY SIDE)
  • FIGURE 10 SILANES MARKET SIZE ESTIMATION: APPROACH (SUPPLY SIDE)
  • FIGURE 11 SILANES MARKET: DATA TRIANGULATION
  • FIGURE 12 FUNCTIONAL SILANES SEGMENT TO DOMINATE DURING FORECAST PERIOD
  • FIGURE 13 RUBBER & PLASTICS SEGMENT TO GROW AT HIGHEST CAGR DURING FORECAST PERIOD
  • FIGURE 14 BUILDING & CONSTRUCTION SEGMENT TO DOMINATE MARKET DURING FORECAST PERIOD
  • FIGURE 15 ASIA PACIFIC LARGEST MARKET FOR SILANES IN 2023
  • FIGURE 16 ASIA PACIFIC TO BE FASTEST-GROWING SILANES MARKET DURING FORECAST PERIOD
  • FIGURE 17 FUNCTIONAL SILANES SEGMENT TO LEAD MARKET DURING FORECAST PERIOD
  • FIGURE 18 RUBBER & PLASTICS TO BE LARGEST APPLICATION SEGMENT OF MARKET DURING FORECAST PERIOD
  • FIGURE 19 BUILDING & CONSTRUCTION TO BE LARGEST END-USE INDUSTRY DURING FORECAST PERIOD
  • FIGURE 20 CHINA ACCOUNTED FOR LARGEST MARKET SHARE IN ASIA PACIFIC IN 2023
  • FIGURE 21 CHINA TO REGISTER HIGHEST GROWTH RATE DURING FORECAST PERIOD
  • FIGURE 22 DRIVERS, RESTRAINTS, OPPORTUNITIES, AND CHALLENGES IN SILANES MARKET
  • FIGURE 23 SILANES MARKET: PORTER’S FIVE FORCES ANALYSIS
  • FIGURE 24 INFLUENCE OF STAKEHOLDERS ON BUYING PROCESS FOR TOP THREE APPLICATIONS
  • FIGURE 25 KEY BUYING CRITERIA FOR TOP THREE APPLICATIONS
  • FIGURE 26 SILANES MARKET: ECOSYSTEM
  • FIGURE 27 AVERAGE SELLING PRICE TREND OF SILANES, BY REGION (USD/TON), 2021–2029
  • FIGURE 28 AVERAGE SELLING PRICE TREND OF KEY PLAYERS, BY TYPE, 2023
  • FIGURE 29 COUNTRY-WISE EXPORT DATA FOR HS CODE 293190, 2019–2023
  • FIGURE 30 COUNTRY-WISE IMPORT DATA FOR HS CODE 293190, 2019–2023
  • FIGURE 31 LIST OF MAJOR PATENTS, 2014–2024
  • FIGURE 32 TRENDS/DISRUPTIONS IMPACTING CUSTOMER BUSINESS
  • FIGURE 33 INVESTMENT AND FUNDING SCENARIO, 2018–2024
  • FIGURE 34 RUBBER & PLASTICS SEGMENT TO ACCOUNT FOR LARGEST MARKET SHARE DURING FORECAST PERIOD
  • FIGURE 35 BUILDING & CONSTRUCTION END-USE INDUSTRY TO DOMINATE MARKET DURING FORECAST PERIOD
  • FIGURE 36 FUNCTIONAL SILANES SEGMENT TO DOMINATE MARKET DURING FORECAST PERIOD
  • FIGURE 37 CHINA TO RECORD HIGHEST CAGR IN SILANES MARKET DURING FORECAST PERIOD
  • FIGURE 38 EUROPE: SILANES MARKET SNAPSHOT
  • FIGURE 39 ASIA PACIFIC: SILANES MARKET SNAPSHOT
  • FIGURE 40 REVENUE ANALYSIS OF KEY PLAYERS IN SILANES MARKET, 2019−2023
  • FIGURE 41 SHARE OF KEY PLAYERS IN SILANES MARKET, 2023
  • FIGURE 42 COMPANY VALUATION (USD MILLION)
  • FIGURE 43 FINANCIAL MATRIX: EV/EBITDA RATIO
  • FIGURE 44 SILANES MARKET: BRAND/PRODUCT COMPARATIVE ANALYSIS
  • FIGURE 45 SILANES MARKET: COMPANY EVALUATION MATRIX, KEY PLAYERS, 2023
  • FIGURE 46 SILANES MARKET: COMPANY FOOTPRINT
  • FIGURE 47 SILANES MARKET: COMPANY EVALUATION MATRIX (STARTUPS/SMES), 2023
  • FIGURE 48 EVONIK INDUSTRIES AG: COMPANY SNAPSHOT (2023)
  • FIGURE 49 SHIN-ETSU CHEMICAL CO., LTD.: COMPANY SNAPSHOT (2023)
  • FIGURE 50 KCC CORPORATION: COMPANY SNAPSHOT (2023)
  • FIGURE 51 DOW: COMPANY SNAPSHOT (2023)
  • FIGURE 52 WACKER CHEMIE AG: COMPANY SNAPSHOT (2023)


The study involved four major activities for estimating the current global size of the silanes market. Exhaustive secondary research was conducted to gather information on the market, the peer market, and the parent market. The next step was to validate these findings, assumptions, and sizes with the industry experts across the value chain of silanes through primary research. Both the top-down and bottom-up approaches were employed to estimate the overall size of the silanes market. After that, market breakdown and data triangulation procedures were used to determine the size of different segments and sub-segments of the market.

Secondary Research

In the secondary research process, various secondary sources such as Business Standard, Bloomberg, World Bank, and Factiva were referred to, to identify and collect information for this study on the silanes market. These secondary sources included annual reports, press releases & investor presentations of companies, white papers, certified publications, articles by recognized authors, regulatory bodies, trade directories, and databases.

Primary Research

Various primary sources from both the supply and demand sides of the silanes market were interviewed to obtain qualitative and quantitative information. The primary sources from the supply side included industry experts, such as Chief Executive Officers (CEOs), vice presidents, marketing directors, sales professionals, and related key executives from various leading companies and organizations operating in the silanes industry. The breakdown of the profiles of primary respondents is as follows:

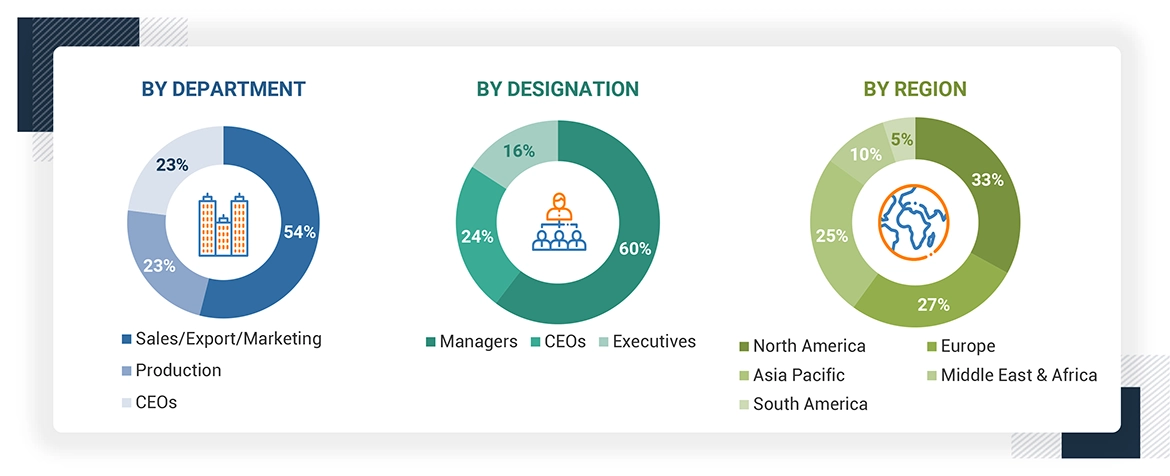
Notes: Companies are classified based on their revenue–Tier 1 = >USD 7 billion, Tier 2 = USD 500 million to USD 7 billion, and Tier 3 = < USD 500 million.

Others include sales, marketing, and product managers.

To know about the assumptions considered for the study, download the pdf brochure

Market Size Estimation

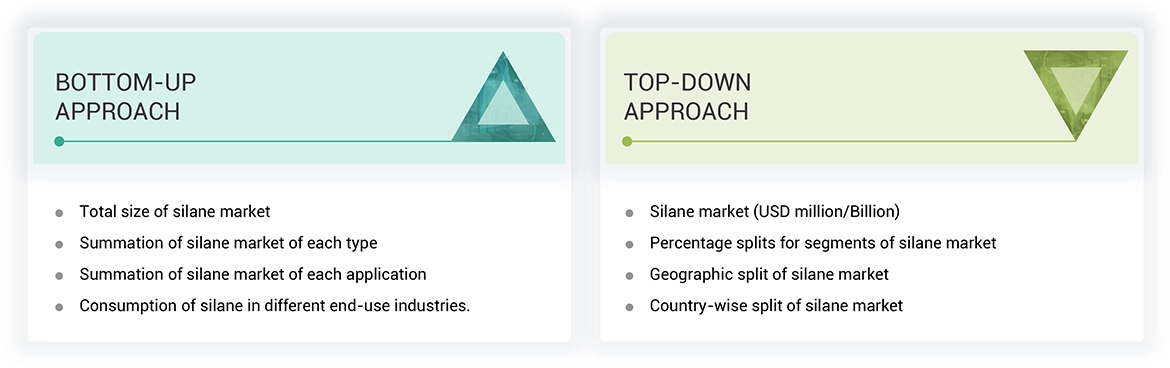
Both the top-down and bottom-up approaches were used to estimate and validate the global size of the silanes market. These approaches were also used extensively to estimate the size of various dependent segments of the market. The research methodology used to estimate the market size included the following details:

  • The key players were identified through extensive secondary research.
  • The industry’s supply chain and market size, in terms of value, were determined through primary and secondary research processes.
  • All percentage shares, splits, and breakdowns were determined using secondary sources and verified through primary sources.
  • All possible parameters that affect the markets covered in this research study were accounted for, viewed in extensive detail, verified through primary research, and analyzed to obtain the final quantitative and qualitative data.
  • The research includes the study of reports, reviews, and newsletters of key industry players, along with extensive interviews with key officials, such as directors and marketing executives.

Data Triangulation

After arriving at the overall market size from the estimation process explained above, the total market was split into several segments and sub-segments. The data triangulation and market breakdown procedures were employed, wherever applicable, to complete the overall market engineering process and arrive at the exact statistics for all segments and sub-segments of the silanes market. The data was triangulated by studying various factors and trends from both the demand- and supply-side.

In addition, the market size was validated by using both the top-down and bottom-up approaches. Then, it was verified through primary interviews. Hence, for every data segment, there are three sources—top-down approach, bottom-up approach, and expert interviews. The data were assumed to be correct when the values arrived at from the three sources matched.

Market Definition

Silanes, also known as silicon hydrides, are compounds made up of silicon and hydrogen through covalent bonds. They can be produced by reacting magnesium silicide with acids or by reducing silicon chlorides with lithium aluminum hydride. Silanes come in two types: functional and non-functional. Functional silanes are useful when reactions with both inorganic and organic substances are needed, while non-functional silanes are effective with only inorganic materials. They serve various roles such as crosslinking agents, adhesion promoters, surface modifiers, coupling agents, and dispersing agents.

Stakeholders

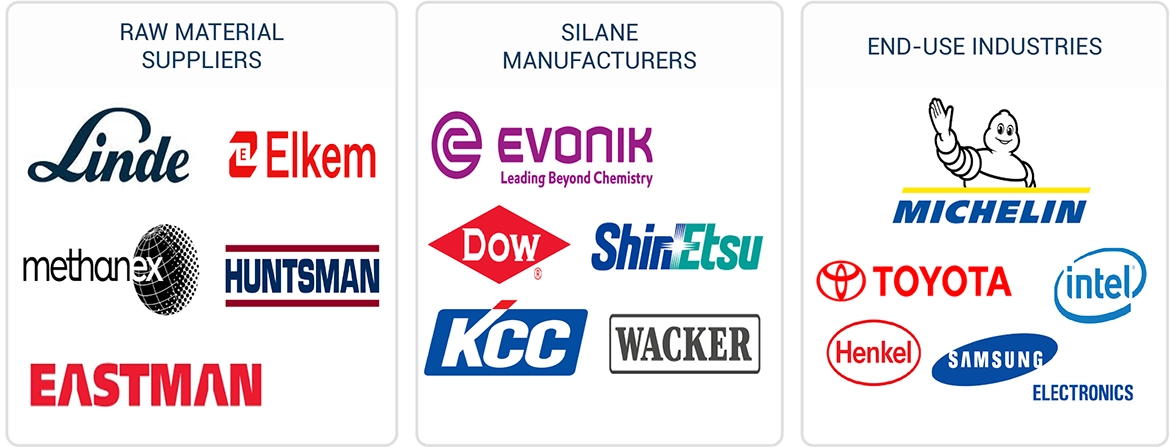
  • Silanes Manufacturers
  • Silanes Suppliers
  • Raw Material Suppliers
  • Research & development entities
  • Industry associations and regulatory bodies
  • End Users

Report Objectives

  • To estimate and forecast the silanes market, in terms of value and volume
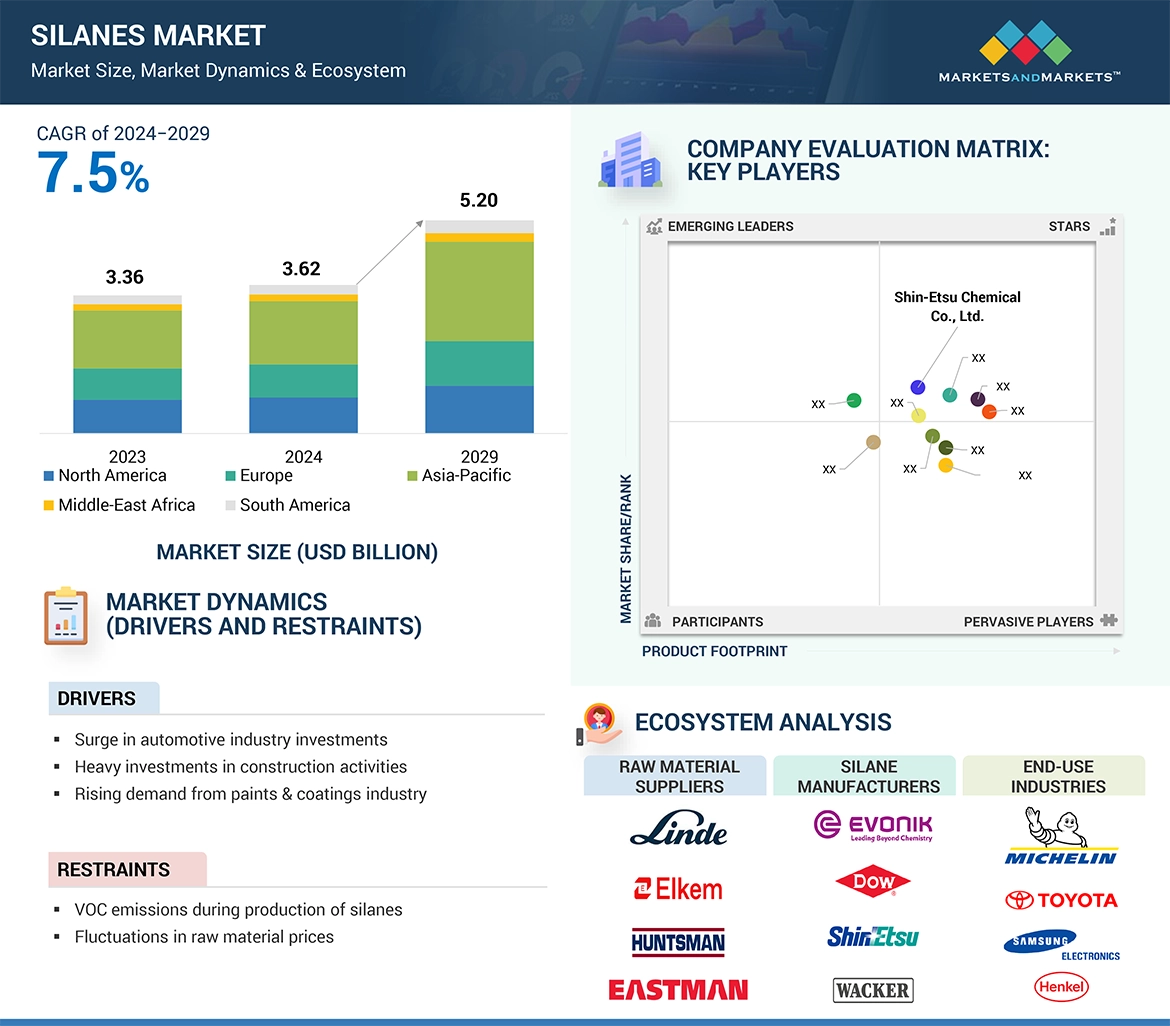
  • To provide detailed information about the major factors (drivers, restraints, opportunities, and challenges) influencing the market growth
  • To define, describe, and forecast the market size, based on type, application, end-use industry, and region
  • To forecast the market size along with segments and submarkets, in key regions: North America, Europe, Asia Pacific (APAC), Middle East & Africa (MEA), and South America along with their key countries
  • To strategically analyze micro markets, for individual growth trends, prospects, and their contribution to the total market
  • To analyze growth opportunities in the market for stakeholders and provide details on the competitive landscape for market leaders
  • To strategically profile key players and comprehensively analyze their market shares and core competencies
  • To analyze competitive developments, such as merger & acquisition, expansion & investment, and agreements in the silanes  market

Previous Versions of this Report

Silanes Market by Type (Functional Silanes (Sulfur, Vinyl, Amino, Epoxy, Methacryloxy), Application (Rubber & Plastics, Fiber Treatment, Adhesives & Sealants, Paints & Coatings)), and Region - Global Forecast to 2021

Report Code CH 4004
Published in Feb, 2023, By MarketsandMarkets™

Silanes Market by Type (Functional Silanes (Sulfur, Vinyl, Amino, Epoxy, Methacryloxy), Application (Rubber & Plastics, Fiber Treatment, Adhesives & Sealants, Paints & Coatings)), and Region - Global Forecast to 2021

Report Code CH 4004
Published in Feb, 2017, By MarketsandMarkets™

Silane Market by Type (Organo-functional Silane, Mono/Chloro Silane), by Application (Rubber & Plastics, Fiber Treatment, Adhesives & Sealants, Paint and Coatings, and others) - Global Forecasts to 2020

Report Code CH 4004
Published in Jan, 2016, By MarketsandMarkets™
"Our USP is "providing game-changing business opportunities reports with free customization" - so please feel free to provide us with your specific areas of interest / business challenges in much greater detail !!"

We appreciate your interest in this report. Once you fill out the form, you'll be immediately directed to an exclusive solution tailored to your needs. This high-value offering can help boost your revenue by 30% - a must-see opportunity for anyone looking to maximize growth.


By clicking the "Submit" button, you are agreeing to the Terms of Use and Privacy Policy.

Custom Market Research Services

We Will Customise The Research For You, In Case The Report Listed Above Does Not Meet With Your Requirements

Get 10% Free Customisation

Growth opportunities and latent adjacency in Silanes Market

Maureen

Dec, 2017

Silanes market report and in-depth information on production volume.

Andres

Nov, 2015

Canadian Silanes market size, segments etc..

Candela

Apr, 2019

Report on silanes.

Roberto

Aug, 2017

Detailed market view of Europe..

DMCA.com Protection Status