TABLE OF CONTENTS
1 INTRODUCTION (Page No. - 27)
1.1 STUDY OBJECTIVES
1.2 MARKET DEFINITION
1.2.1 INCLUSIONS AND EXCLUSIONS
1.3 MARKET SCOPE
1.3.1 MARKET SEGMENTATION
1.3.2 YEARS CONSIDERED
1.4 CURRENCY CONSIDERED
1.5 STAKEHOLDERS
2 RESEARCH METHODOLOGY (Page No. - 32)
2.1 RESEARCH APPROACH
2.1.1 SECONDARY DATA
2.1.2 PRIMARY DATA
2.1.2.1 Breakup of primary profiles
2.1.2.2 Key industry insights
2.2 MARKET BREAKUP AND DATA TRIANGULATION
2.3 MARKET SIZE ESTIMATION
2.4 MARKET FORECAST
2.5 RESEARCH ASSUMPTIONS
2.6 RESEARCH LIMITATIONS
3 EXECUTIVE SUMMARY (Page No. - 45)
4 PREMIUM INSIGHTS (Page No. - 49)
4.1 ATTRACTIVE GROWTH OPPORTUNITIES FOR PLAYERS IN SERVERLESS COMPUTING MARKET
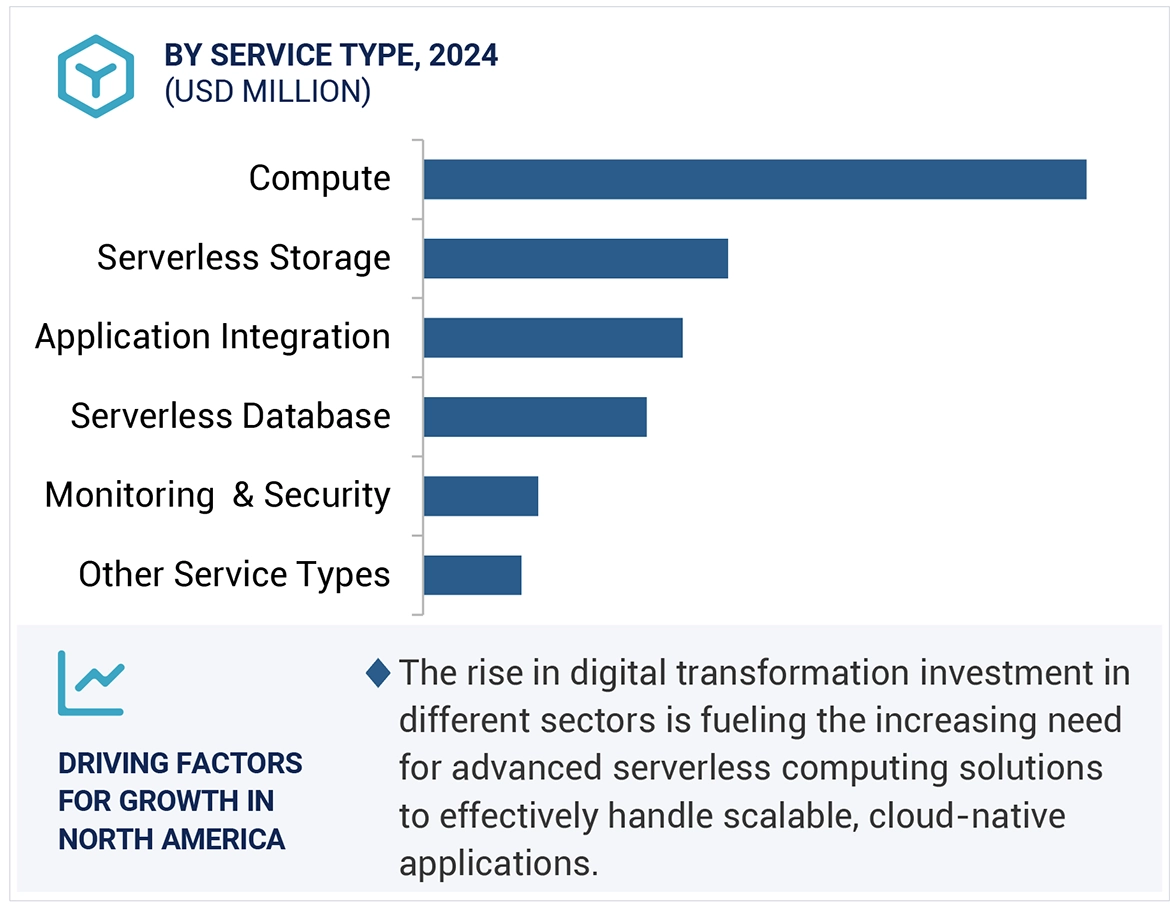
4.2 MARKET, BY SERVICE TYPE, 2024 VS. 2029
4.3 MARKET, BY SERVICE MODEL, 2024 VS. 2029
4.4 MARKET, BY DEPLOYMENT MODEL, 2024 VS. 2029
4.5 MARKET, BY ORGANIZATION SIZE, 2024 VS. 2029
4.6 MARKET, BY VERTICAL, 2024 VS. 2029
4.7 MARKET, BY REGION, 2024 VS. 2029
5 MARKET OVERVIEW AND INDUSTRY TRENDS (Page No. - 53)
5.1 INTRODUCTION
5.2 MARKET DYNAMICS
5.2.1 DRIVERS
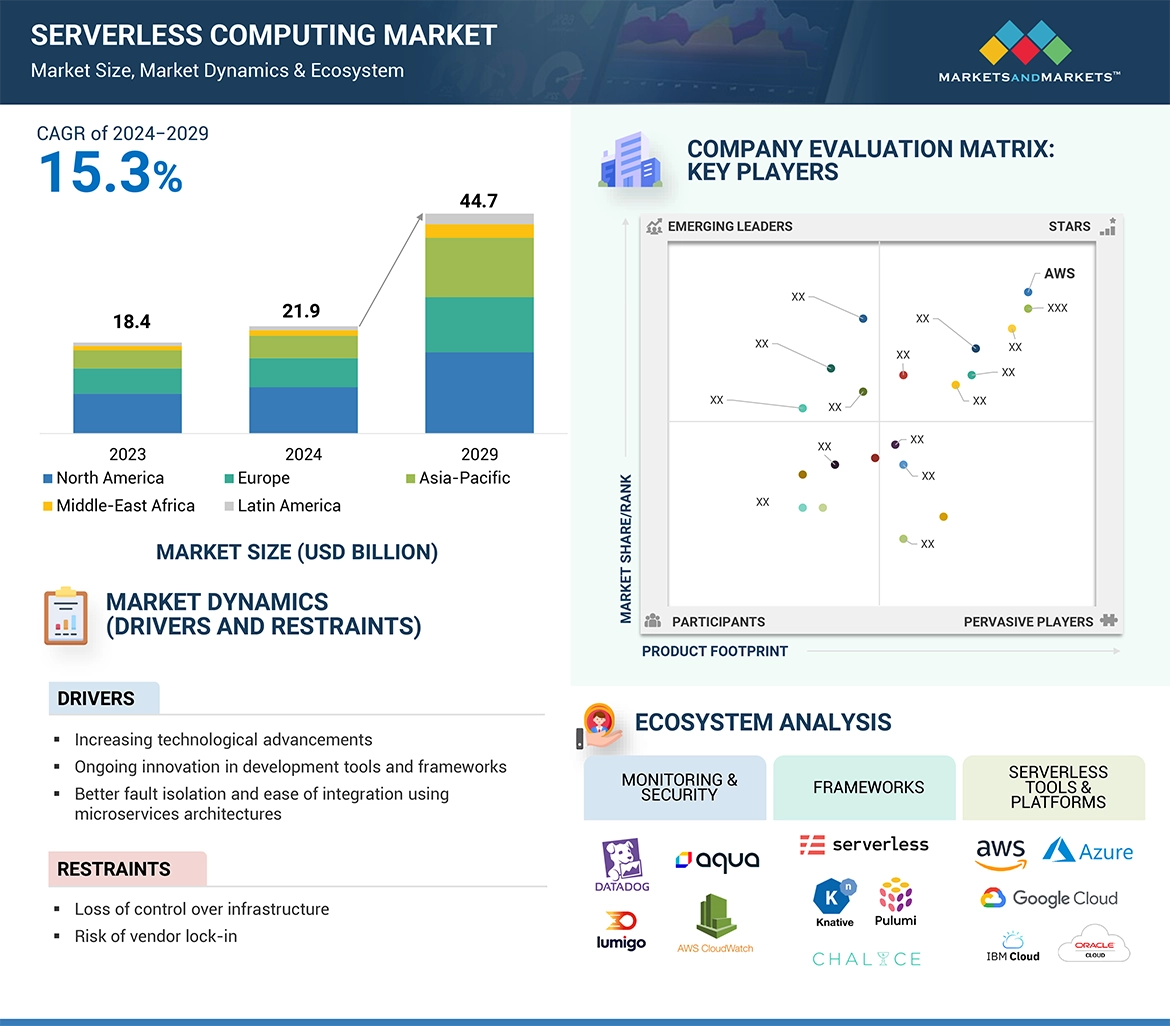
5.2.1.1 Increasing technological advancements
5.2.1.2 Ongoing innovation in development tools and frameworks
5.2.1.3 Better fault isolation and ease of integration using microservices architectures
5.2.1.4 Shift from DevOps to serverless computing
5.2.2 RESTRAINTS
5.2.2.1 Loss of control over infrastructure
5.2.2.2 Risk of vendor lock-in
5.2.3 OPPORTUNITIES
5.2.3.1 Microservice-based deployment
5.2.3.2 Serverless backends in mobile and web development
5.2.3.3 Increasing number of verticals utilizing distributed workloads
5.2.4 CHALLENGES
5.2.4.1 Issues with third-party services
5.2.4.2 Architectural and operational complexity
5.2.4.3 Cost-efficiency for long-running computation
5.3 CASE STUDY ANALYSIS
5.3.1 PLEXURE USES AZURE SERVERLESS TECHNOLOGIES TO SUPPORT HIGH PERFORMANCE & MINIMUM LATENCY REQUIREMENTS
5.3.2 AWS LAMBDA HELPED FINANCIAL ENGINES REDUCE ITS ADMINISTRATIVE BURDEN
5.3.3 IROBOT USED AWS’ SERVICES TO CONTROL HEAVY TRAFFIC
5.3.4 AWS HELPED NETFLIX IN ESTABLISHING SERVERLESS ARCHITECTURE
5.3.5 SERVERLESS FRAMEWORK HELPED JOOT ACCELERATE DEVELOPMENT OF ITS SOCIAL MEDIA IMAGE OPTIMIZATION TOOL
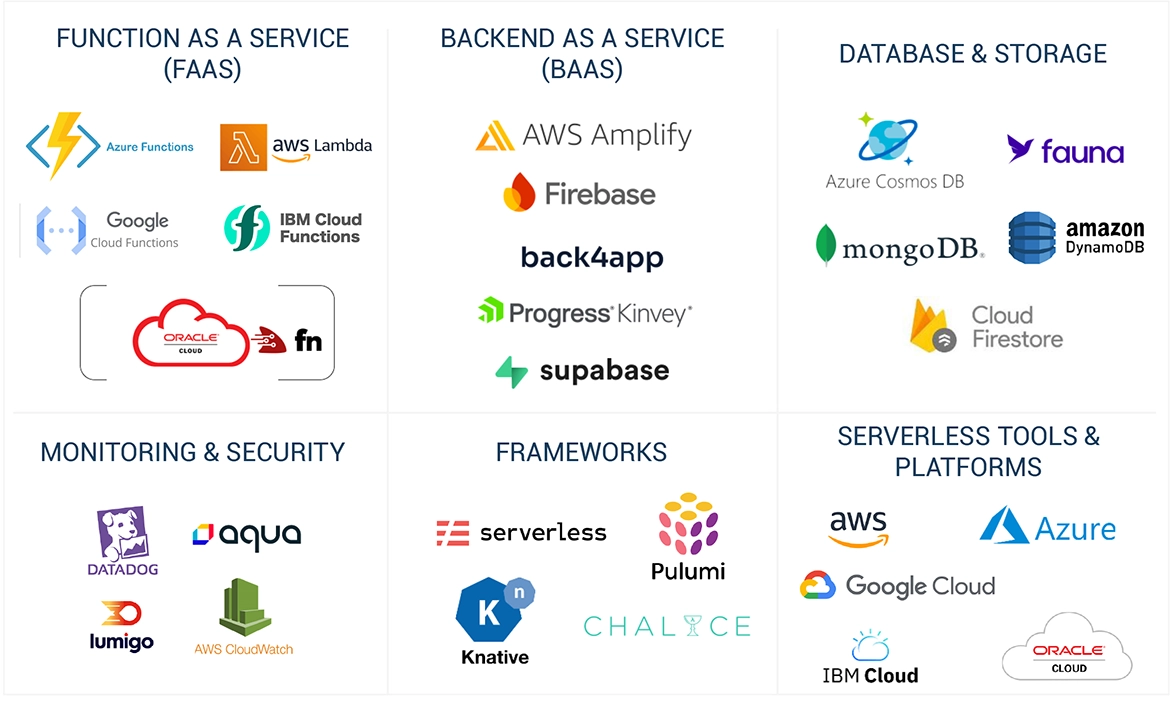
5.4 ECOSYSTEM ANALYSIS
5.5 SUPPLY CHAIN ANALYSIS
5.6 PRICING ANALYSIS
5.6.1 AVERAGE SELLING PRICE TREND OF KEY PLAYERS, BY SOLUTION
5.6.2 AVERAGE SELLING PRICE TREND, BY REGION
5.6.3 AVERAGE SELLING PRICE TRENDS
5.7 PATENT ANALYSIS
5.8 TECHNOLOGY ANALYSIS
5.8.1 KEY TECHNOLOGIES
5.8.1.1 Event-driven programming
5.8.1.2 Trigger-based tasks
5.8.1.3 Microservices
5.8.1.4 Runtime environments
5.8.1.5 Stateless computing
5.8.2 COMPLEMENTARY TECHNOLOGIES
5.8.2.1 Asynchronous programming
5.8.2.2 RESTful APIs
5.8.2.3 DevOps
5.8.2.4 Auto-scaling
5.8.2.5 Infrastructure as Code (IaC)
5.8.3 ADJACENT TECHNOLOGIES
5.8.3.1 Containerization
5.8.3.2 Kubernetes
5.8.3.3 Edge computing
5.8.3.4 Distributed tracing
5.8.3.5 Self-healing
5.9 REGULATORY LANDSCAPE
5.9.1 REGULATORY BODIES, GOVERNMENT AGENCIES, AND OTHER ORGANIZATIONS
5.9.2 REGULATIONS, BY REGION
5.9.2.1 North America
5.9.2.2 Europe
5.9.2.3 Asia Pacific
5.9.2.4 Middle East & South Africa
5.9.2.5 Latin America
5.9.3 REGULATORY IMPLICATIONS AND INDUSTRY STANDARDS
5.9.3.1 General Data Protection Regulation (GDPR)
5.9.3.2 SEC Rule 17a-4
5.9.3.3 ISO/IEC 27001
5.9.3.4 System and Organization Controls 2 Type II Compliance
5.9.3.5 Financial Industry Regulatory Authority (FINRA)
5.9.3.6 Freedom of Information Act (FOIA)
5.9.3.7 Health Insurance Portability and Accountability Act (HIPAA)
5.1 PORTER’S FIVE FORCES ANALYSIS
5.10.1 THREAT OF NEW ENTRANTS
5.10.2 THREAT OF SUBSTITUTES
5.10.3 BARGAINING POWER OF SUPPLIERS
5.10.4 BARGAINING POWER OF BUYERS
5.10.5 INTENSITY OF COMPETITIVE RIVALRY
5.11 KEY CONFERENCES AND EVENTS IN 2024–2025
5.12 TRENDS/DISRUPTIONS IMPACTING CUSTOMERS’ BUSINESSES
5.13 KEY STAKEHOLDERS AND BUYING CRITERIA
5.13.1 KEY STAKEHOLDERS IN BUYING PROCESS
5.13.2 BUYING CRITERIA
5.14 BUSINESS MODEL ANALYSIS
5.15 INVESTMENT AND FUNDING SCENARIO
5.16 IMPACT OF AI/GEN AI ON SERVERLESS COMPUTING MARKET
5.16.1 INDUSTRY TRENDS: USE CASES
5.16.1.1 Healthcare & life sciences industry
5.16.1.2 Retail industry
5.16.2 TOP VENDORS ADAPTING TO GEN AI
5.16.2.1 AWS
5.16.2.2 Microsoft Azure
6 SERVERLESS COMPUTING MARKET, BY SERVICE TYPE (Page No. - 89)
6.1 INTRODUCTION
6.1.1 SERVICE TYPE: MARKET DRIVERS
6.2 COMPUTE
6.2.1 STREAMLINING CODE EXECUTION AND APPLICATION DEPLOYMENT WITH SERVERLESS FUNCTIONS AND CONTAINERS
6.2.2 SERVERLESS FUNCTIONS
6.2.3 SERVERLESS CONTAINERS
6.3 SERVERLESS STORAGE
6.3.1 SCALABLE AND ON-DEMAND DATA STORAGE SOLUTIONS WITHOUT NEED FOR INFRASTRUCTURE MANAGEMENT
6.3.2 OBJECT STORAGE
6.3.3 BLOCK STORAGE
6.3.4 FILE STORAGE
6.4 SERVERLESS DATABASE
6.4.1 SERVERLESS DATABASE TO OFFER FULLY MANAGED, SCALABLE DATABASE SOLUTIONS THAT AUTOMATICALLY HANDLE INFRASTRUCTURE TASKS
6.4.2 RELATIONAL DATABASES
6.4.3 NON-RELATIONAL DATABASES
6.5 APPLICATION INTEGRATION
6.5.1 SEAMLESS INTERACTION BETWEEN DISPARATE SYSTEMS AND APPLICATIONS USING APPLICATION INTEGRATION SERVICE
6.5.2 EVENT-DRIVEN SERVICES
6.5.3 MESSAGING SERVICES
6.5.4 API MANAGEMENT
6.6 MONITORING & SECURITY
6.6.1 SERVERLESS MONITORING TO PROVIDE REAL-TIME INSIGHTS INTO APPLICATION PERFORMANCE, RESOURCE UTILIZATION, AND OPERATIONAL METRICS
6.6.2 SERVERLESS MONITORING
6.6.3 SECURITY MANAGEMENT
6.7 OTHER SERVICE TYPES
7 SERVERLESS COMPUTING MARKET, BY SERVICE MODEL (Page No. - 101)
7.1 INTRODUCTION
7.1.1 SERVICE MODEL: MARKET DRIVERS
7.2 FUNCTION-AS-A-SERVICE
7.2.1 FAAS TO ENABLE DEPLOYMENT AND EXECUTION OF SPECIFIC FUNCTIONS IN REACTION TO EVENTS WITHOUT HANDLING SERVER INFRASTRUCTURE
7.2.2 STREAM & BATCH PROCESSING
7.2.3 REAL-TIME ANALYTICS
7.2.4 MICROSERVICES ARCHITECTURE
7.2.5 AUTOMATION & INTEGRATION
7.2.6 OTHER FAAS MODELS
7.3 BACKEND-AS-A-SERVICE
7.3.1 BACKEND-AS-A-SERVICE MODEL TO INCREASE FLEXIBILITY AND STREAMLINE BACKEND OPERATIONS IN SERVERLESS COMPUTING
7.3.2 FILE STORAGE & MANAGEMENT
7.3.3 USER AUTHENTICATION & MANAGEMENT
7.3.4 DATABASE MANAGEMENT
7.3.5 PUSH NOTIFICATIONS
7.3.6 OTHER BAAS MODELS
8 SERVERLESS COMPUTING MARKET, BY DEPLOYMENT MODEL (Page No. - 108)
8.1 INTRODUCTION
8.1.1 DEPLOYMENT MODEL: MARKET DRIVERS
8.2 PUBLIC CLOUD
8.2.1 PUBLIC CLOUD DEPLOYMENT TO HELP IN QUICK DEPLOYMENT AND EXPANSION OF APPLICATIONS
8.3 PRIVATE CLOUD
8.3.1 PRIVATE CLOUD TO CUSTOMIZE SERVERLESS ENVIRONMENTS WITH ENHANCED SECURITY AND INTEGRATION
8.4 HYBRID CLOUD
8.4.1 HYBRID CLOUD MODEL TO OFFER BETTER DISASTER RECOVERY AND COMPLIANCE MANAGEMENT
9 SERVERLESS COMPUTING MARKET, BY ORGANIZATION SIZE (Page No. - 114)
9.1 INTRODUCTION
9.1.1 ORGANIZATION SIZE: MARKET DRIVERS
9.2 SMALL ENTERPRISES
9.2.1 SERVERLESS COMPUTING TO HELP REDUCE COSTS AND SCALE APPLICATIONS WITHOUT INFRASTRUCTURE HASSLES
9.3 MEDIUM ENTERPRISES
9.3.1 SERVERLESS COMPUTING TO HANDLE FLUCTUATING WORKLOADS AND OPTIMIZE COSTS WITH RAPID DEPLOYMENT AND INTEGRATED SECURITY
9.4 LARGE ENTERPRISES
9.4.1 SERVERLESS SOLUTIONS TO SCALE AND MANAGE HIGH-VOLUME OPERATIONS WITH MINIMAL INFRASTRUCTURE OVERHEAD
10 SERVERLESS COMPUTING MARKET, BY VERTICAL (Page No. - 120)
10.1 INTRODUCTION
10.1.1 VERTICAL: MARKET DRIVERS
10.2 IT & TELECOM
10.2.1 SERVERLESS COMPUTING TO OPTIMIZE OPERATIONS BY MINIMIZING INFRASTRUCTURE MANAGEMENT AND SCALING DYNAMICALLY
10.2.2 IT & TELECOM: USE CASES
10.2.2.1 Network function virtualization
10.2.2.2 Real-time data processing
10.2.2.3 Content delivery networks (CDNs)
10.3 BFSI
10.3.1 SERVERLESS COMPUTING TO ENHANCE OPERATIONAL EFFICIENCY, AGILITY, AND INNOVATION
10.3.2 BFSI: USE CASES
10.3.2.1 Fraud detection
10.3.2.2 Payment processing
10.3.2.3 Customer data analytics
10.4 RETAIL & CONSUMER GOODS
10.4.1 DYNAMIC SCALING OF ECOMMERCE PLATFORMS WITH SERVERLESS COMPUTING TO OPTIMIZE REAL-TIME TRAFFIC HANDLING DURING PEAK SALES
10.4.2 RETAIL & CONSUMER GOODS: USE CASES
10.4.2.1 Personalized marketing
10.4.2.2 Inventory management
10.4.2.3 eCommerce platforms
10.5 HEALTHCARE & LIFE SCIENCES
10.5.1 SERVERLESS ARCHITECTURES TO FACILITATE SEAMLESS INTEGRATION AND SCALING OF SERVICES
10.5.2 HEALTHCARE & LIFE SCIENCES: USE CASES
10.5.2.1 Telemedicine
10.5.2.2 Patient data management
10.5.2.3 Genomic data processing
10.6 GOVERNMENT & DEFENSE
10.6.1 SERVERLESS COMPUTING TO OPTIMIZE REAL-TIME COMMUNICATION AND RESOURCE MANAGEMENT IN DISASTER RESPONSE OPERATIONS
10.6.2 GOVERNMENT & DEFENSE: USE CASES
10.6.2.1 Smart city initiatives
10.6.2.2 Citizen services portals
10.6.2.3 Disaster response coordination
10.7 TRANSPORTATION & LOGISTICS
10.7.1 SERVERLESS COMPUTING TO OFFER SCALABLE AND COST-EFFECTIVE SOLUTIONS TAILORED TO COMPLEX LOGISTICS NEEDS
10.7.2 TRANSPORTATION & LOGISTICS
10.7.2.1 Transportation & logistics: Use cases
10.7.2.1.1 Fleet management
10.7.2.1.2 Route optimization
10.7.2.1.3 Shipment tracking
10.8 MANUFACTURING
10.8.1 LEVERAGING SERVERLESS COMPUTING TO HELP IMPROVE PRODUCTIVITY, REDUCE DOWNTIME, AND MAINTAIN HIGH PRODUCT QUALITY STANDARDS
10.8.2 MANUFACTURING: USE CASES
10.8.2.1 Predictive analytics
10.8.2.2 IoT integration
10.8.2.3 Quality control
10.9 OTHER VERTICALS
11 SERVERLESS COMPUTING MARKET, BY REGION (Page No. - 137)
11.1 INTRODUCTION
11.2 NORTH AMERICA
11.2.1 NORTH AMERICA: MARKET DRIVERS
11.2.2 NORTH AMERICA: MACROECONOMIC OUTLOOK
11.2.3 US
11.2.3.1 Robust digital infrastructure and supportive regulatory environment to boost market
11.2.4 CANADA
11.2.4.1 Cross-border trade and collaboration to accelerate adoption of serverless technologies
11.3 EUROPE
11.3.1 EUROPE: MARKET DRIVERS
11.3.2 EUROPE: MACROECONOMIC OUTLOOK
11.3.3 UK
11.3.3.1 Advanced digital economy, strong technology sector, and proactive approach to cloud adoption to bolster market growth
11.3.4 GERMANY
11.3.4.1 Strategic interest in bolstering digital autonomy and competitiveness on global scale to drive market
11.3.5 FRANCE
11.3.5.1 Increasing adoption of innovative cloud solutions to propel market growth
11.3.6 ITALY
11.3.6.1 Country's trade relations and supply chain dynamics to aid market growth
11.3.7 REST OF EUROPE
11.4 ASIA PACIFIC
11.4.1 ASIA PACIFIC: SERVERLESS COMPUTING MARKET DRIVERS
11.4.2 ASIA PACIFIC: MACROECONOMIC OUTLOOK
11.4.3 CHINA
11.4.3.1 Spike in demand for enhanced scalability and reduced operational costs to drive market
11.4.4 INDIA
11.4.4.1 Rapid digitization and government initiatives to fuel market growth
11.4.5 JAPAN
11.4.5.1 Robust cloud infrastructure, supported by skilled IT workforce to boost market growth
11.4.6 REST OF ASIA PACIFIC
11.5 MIDDLE EAST & AFRICA
11.5.1 MIDDLE EAST & AFRICA: MARKET DRIVERS
11.5.2 MIDDLE EAST & AFRICA: MACROECONOMIC OUTLOOK
11.5.3 GCC
11.5.3.1 Saudi Arabia
11.5.3.1.1 Substantial investments in smart cities, data centers, and AI-driven solutions to accelerate market growth
11.5.3.2 UAE
11.5.3.2.1 Government policies that promote digital transformation, AI adoption, and IoT integration to drive market
11.5.3.3 Rest of GCC countries
11.5.4 SOUTH AFRICA
11.5.4.1 Growing digital economy and increasing cloud adoption to foster market growth
11.5.5 REST OF MIDDLE EAST & AFRICA
11.6 LATIN AMERICA
11.6.1 LATIN AMERICA: SERVERLESS COMPUTING MARKET DRIVERS
11.6.2 LATIN AMERICA: MACROECONOMIC OUTLOOK
11.6.3 BRAZIL
11.6.3.1 Significant global investment and strategic policy shifts to accelerate market growth
11.6.4 MEXICO
11.6.4.1 Spike in demand for digital transformation across various sectors to bolster market growth
11.6.5 REST OF LATIN AMERICA
12 COMPETITIVE LANDSCAPE (Page No. - 182)
12.1 INTRODUCTION
12.2 KEY PLAYER STRATEGIES/RIGHT TO WIN
12.3 MARKET SHARE ANALYSIS
12.4 SERVERLESS COMPUTING MARKET: VENDOR BRAND/ PRODUCT COMPARISON
12.4.1 FUNCTION-AS-A-SERVICE
12.4.1.1 AWS Lambda
12.4.1.2 Azure Functions
12.4.1.3 Google Cloud Functions
12.4.1.4 IBM Cloud Functions
12.4.1.5 Oracle Cloud Functions
12.4.2 BACKEND-AS-A-SERVICE
12.4.2.1 AWS DynamoDB
12.4.2.2 Azure Cosmos DB
12.4.2.3 Google Firestore
12.4.2.4 MongoDB
12.4.2.5 FaunaDB
12.5 REVENUE ANALYSIS
12.6 COMPANY EVALUATION MATRIX: KEY PLAYERS, 2023
12.6.1 STARS
12.6.2 EMERGING LEADERS
12.6.3 PERVASIVE PLAYERS
12.6.4 PARTICIPANTS
12.6.5 COMPANY FOOTPRINT: KEY PLAYERS, 2023
12.7 COMPANY EVALUATION MATRIX: STARTUPS/SMES, 2023
12.7.1 PROGRESSIVE COMPANIES
12.7.2 RESPONSIVE COMPANIES
12.7.3 DYNAMIC COMPANIES
12.7.4 STARTING BLOCKS
12.7.5 COMPETITIVE BENCHMARKING: STARTUPS/SMES, 2023
12.7.5.1 Detailed list of key startups/SMEs
12.7.5.2 Competitive benchmarking of startups/SMEs
12.8 COMPANY VALUATION AND FINANCIAL METRICS OF KEY VENDORS
12.9 COMPETITIVE SCENARIO AND TRENDS
12.9.1 PRODUCT LAUNCHES & ENHANCEMENTS
12.9.2 DEALS
13 COMPANY PROFILES (Page No. - 212)
13.1 INTRODUCTION
13.2 MAJOR PLAYERS
13.2.1 AWS
13.2.1.1 Business overview
13.2.1.2 Products/Solutions/Services offered
13.2.1.3 Recent developments
13.2.1.3.1 Product launches & enhancements
13.2.1.4 MnM view
13.2.1.4.1 Right to win
13.2.1.4.2 Strategic choices
13.2.1.4.3 Weaknesses and competitive threats
13.2.2 MICROSOFT
13.2.2.1 Business overview
13.2.2.2 Products/Solutions/Services offered
13.2.2.3 Recent developments
13.2.2.3.1 Product launches & enhancements
13.2.2.4 MnM view
13.2.2.4.1 Right to win
13.2.2.4.2 Strategic choices
13.2.2.4.3 Weaknesses and competitive threats
13.2.3 IBM
13.2.3.1 Business overview
13.2.3.2 Products/Solutions/Services offered
13.2.3.3 Recent developments
13.2.3.3.1 Product launches & enhancements
13.2.3.4 MnM view
13.2.3.4.1 Right to win
13.2.3.4.2 Strategic choices
13.2.3.4.3 Weaknesses and competitive threats
13.2.4 GOOGLE
13.2.4.1 Business overview
13.2.4.2 Products/Solutions/Services offered
13.2.4.3 Recent developments
13.2.4.3.1 Product launches & enhancements
13.2.4.3.2 Deals
13.2.4.4 MnM view
13.2.4.4.1 Right to win
13.2.4.4.2 Strategic choices
13.2.4.4.3 Weaknesses and competitive threats
13.2.5 ORACLE
13.2.5.1 Business overview
13.2.5.2 Products/Solutions/Services offered
13.2.5.3 Recent developments
13.2.5.3.1 Product launches & enhancements
13.2.5.4 MnM view
13.2.5.4.1 Right to win
13.2.5.4.2 Strategic choices
13.2.5.4.3 Weaknesses and competitive threats
13.2.6 ALIBABA CLOUD
13.2.6.1 Business overview
13.2.6.2 Products/Solutions/Services offered
13.2.6.3 Recent developments
13.2.6.3.1 Product launches & enhancements
13.2.7 TENCENT CLOUD
13.2.7.1 Business overview
13.2.7.2 Products/Solutions/Services offered
13.2.8 TWILIO
13.2.8.1 Business overview
13.2.8.2 Products/Solutions/Services offered
13.2.9 CLOUDFLARE
13.2.9.1 Business overview
13.2.9.2 Products/Solutions/Services offered
13.2.9.3 Recent developments
13.2.9.3.1 Product launches & enhancements
13.2.9.3.2 Deals
13.2.10 MONGODB
13.2.10.1 Business overview
13.2.10.2 Products/Solutions/Services offered
13.2.10.3 Recent developments
13.2.10.3.1 Product launches & enhancements
13.2.10.3.2 Deals
13.2.10.3.3 Expansions
13.3 OTHER PLAYERS
13.3.1 NETLIFY
13.3.2 FASTLY
13.3.3 AKAMAI
13.3.4 DIGITALOCEAN
13.3.5 DATADOG
13.3.6 VERCEL
13.3.7 SPOT BY NETAPP
13.3.8 ELASTIC
13.3.9 VMWARE
13.3.10 BACKENDLESS
13.3.11 FAUNADB
13.3.12 SCALEWAY
13.3.13 8BASE
13.3.14 SUPABASE
13.3.15 APPWRITE
14 ADJACENT AND RELATED MARKETS (Page No. - 269)
14.1 INTRODUCTION
14.1.1 RELATED MARKETS
14.2 CLOUD MOBILE BACKEND AS A SERVICE (BAAS) MARKET
14.3 SERVERLESS ARCHITECTURE MARKET
15 APPENDIX (Page No. - 274)
15.1 DISCUSSION GUIDE
15.2 KNOWLEDGESTORE: MARKETSANDMARKETS’ SUBSCRIPTION PORTAL
15.3 CUSTOMIZATION OPTIONS
15.4 RELATED REPORTS
15.5 AUTHOR DETAILS
LIST OF TABLES (216 TABLES)
TABLE 1 USD EXCHANGE RATES, 2018–2023
TABLE 2 FACTOR ANALYSIS
TABLE 3 INDICATIVE PRICING ANALYSIS OF SERVERLESS COMPUTING MARKET, BY SOLUTION
TABLE 4 PRICING ANALYSIS OF MARKET, BY REGION
TABLE 5 MARKET: AVERAGE PRICING LEVELS (USD)
TABLE 6 TOP PATENT APPLICANTS (US)
TABLE 7 NORTH AMERICA: REGULATORY BODIES, GOVERNMENT AGENCIES, AND OTHER ORGANIZATIONS
TABLE 8 EUROPE: REGULATORY BODIES, GOVERNMENT AGENCIES, AND OTHER ORGANIZATIONS
TABLE 9 ASIA PACIFIC: REGULATORY BODIES, GOVERNMENT AGENCIES, AND OTHER ORGANIZATIONS
TABLE 10 ROW: REGULATORY BODIES, GOVERNMENT AGENCIES, AND OTHER ORGANIZATIONS
TABLE 11 PORTER’S FIVE FORCES' IMPACT ON MARKET
TABLE 12 SERVERLESS COMPUTING MARKET: KEY CONFERENCES AND EVENTS, 2024–2025
TABLE 13 INFLUENCE OF STAKEHOLDERS ON BUYING PROCESS FOR TOP THREE VERTICALS
TABLE 14 KEY BUYING CRITERIA FOR TOP THREE VERTICALS
TABLE 15 MARKET, BY SERVICE TYPE, 2019–2023 (USD MILLION)
TABLE 16 MARKET, BY SERVICE TYPE, 2024–2029 (USD MILLION)
TABLE 17 COMPUTE: MARKET, BY REGION, 2019–2023 (USD MILLION)
TABLE 18 COMPUTE: MARKET, BY REGION, 2024–2029 (USD MILLION)
TABLE 19 SERVERLESS STORAGE: MARKET, BY REGION, 2019–2023 (USD MILLION)
TABLE 20 SERVERLESS STORAGE: MARKET, BY REGION, 2024–2029 (USD MILLION)
TABLE 21 SERVERLESS DATABASE: MARKET, BY REGION, 2019–2023 (USD MILLION)
TABLE 22 SERVERLESS DATABASE: MARKET, BY REGION, 2024–2029 (USD MILLION)
TABLE 23 APPLICATION INTEGRATION: MARKET, BY REGION, 2019–2023 (USD MILLION)
TABLE 24 APPLICATION INTEGRATION: MARKET, BY REGION, 2024–2029 (USD MILLION)
TABLE 25 MONITORING & SECURITY: MARKET, BY REGION, 2019–2023 (USD MILLION)
TABLE 26 MONITORING & SECURITY: MARKET, BY REGION, 2024–2029 (USD MILLION)
TABLE 27 OTHER SERVICE TYPES: MARKET, BY REGION, 2019–2023 (USD MILLION)
TABLE 28 OTHER SERVICE TYPES: MARKET, BY REGION, 2024–2029 (USD MILLION)
TABLE 29 SERVERLESS COMPUTING MARKET, BY SERVICE MODEL, 2019–2023 (USD MILLION)
TABLE 30 MARKET, BY SERVICE MODEL, 2024–2029 (USD MILLION)
TABLE 31 FAAS: MARKET, BY REGION, 2019–2023 (USD MILLION)
TABLE 32 FAAS: MARKET, BY REGION, 2024–2029 (USD MILLION)
TABLE 33 BAAS: MARKET, BY REGION, 2019–2023 (USD MILLION)
TABLE 34 BAAS: MARKET, BY REGION, 2024–2029 (USD MILLION)
TABLE 35 MARKET, BY DEPLOYMENT MODEL, 2019–2023 (USD MILLION)
TABLE 36 SERVERLESS COMPUTING MARKET, BY DEPLOYMENT MODEL, 2024–2029 (USD MILLION)
TABLE 37 PUBLIC CLOUD: MARKET, BY REGION, 2019–2023 (USD MILLION)
TABLE 38 PUBLIC CLOUD: MARKET, BY REGION, 2024–2029 (USD MILLION)
TABLE 39 PRIVATE CLOUD: MARKET, BY REGION, 2019–2023 (USD MILLION)
TABLE 40 PRIVATE CLOUD: MARKET, BY REGION, 2024–2029 (USD MILLION)
TABLE 41 HYBRID CLOUD: MARKET, BY REGION, 2019–2023 (USD MILLION)
TABLE 42 HYBRID CLOUD: MARKET, BY REGION, 2024–2029 (USD MILLION)
TABLE 43 MARKET, BY ORGANIZATION SIZE, 2019–2023 (USD MILLION)
TABLE 44 MARKET, BY ORGANIZATION SIZE, 2024–2029 (USD MILLION)
TABLE 45 SMALL ENTERPRISES: MARKET, BY REGION, 2019–2023 (USD MILLION)
TABLE 46 SMALL ENTERPRISES: MARKET, BY REGION, 2024–2029 (USD MILLION)
TABLE 47 MEDIUM ENTERPRISES: MARKET, BY REGION, 2019–2023 (USD MILLION)
TABLE 48 MEDIUM ENTERPRISE: MARKET, BY REGION, 2024–2029 (USD MILLION)
TABLE 49 LARGE ENTERPRISES: MARKET, BY REGION, 2019–2023 (USD MILLION)
TABLE 50 LARGE ENTERPRISES: MARKET, BY REGION, 2024–2029 (USD MILLION)
TABLE 51 SERVERLESS COMPUTING MARKET, BY VERTICAL, 2019–2023 (USD MILLION)
TABLE 52 MARKET, BY VERTICAL, 2024–2029 (USD MILLION)
TABLE 53 IT & TELECOM: MARKET, BY REGION, 2019–2023 (USD MILLION)
TABLE 54 IT & TELECOM: MARKET, BY REGION, 2024–2029 (USD MILLION)
TABLE 55 BFSI: MARKET, BY REGION, 2019–2023 (USD MILLION)
TABLE 56 BFSI: MARKET, BY REGION, 2024–2029 (USD MILLION)
TABLE 57 RETAIL & CONSUMER GOODS: MARKET, BY REGION, 2019–2023 (USD MILLION)
TABLE 58 RETAIL & CONSUMER GOODS: MARKET, BY REGION, 2024–2029 (USD MILLION)
TABLE 59 HEALTHCARE & LIFE SCIENCES: MARKET, BY REGION, 2019–2023 (USD MILLION)
TABLE 60 HEALTHCARE & LIFE SCIENCES: MARKET, BY REGION, 2024–2029 (USD MILLION)
TABLE 61 GOVERNMENT & DEFENSE: MARKET, BY REGION, 2019–2023 (USD MILLION)
TABLE 62 GOVERNMENT & DEFENSE: MARKET, BY REGION, 2024–2029 (USD MILLION)
TABLE 63 TRANSPORTATION & LOGISTICS: MARKET, BY REGION, 2019–2023 (USD MILLION)
TABLE 64 TRANSPORTATION & LOGISTICS: MARKET, BY REGION, 2024–2029 (USD MILLION)
TABLE 65 MANUFACTURING: MARKET, BY REGION, 2019–2023 (USD MILLION)
TABLE 66 MANUFACTURING: MARKET, BY REGION, 2024–2029 (USD MILLION)
TABLE 67 OTHER VERTICALS: SERVERLESS COMPUTING MARKET, BY REGION, 2019–2023 (USD MILLION)
TABLE 68 OTHER VERTICALS: MARKET, BY REGION, 2024–2029 (USD MILLION)
TABLE 69 MARKET, BY REGION, 2019–2023 (USD MILLION)
TABLE 70 SERVERLESS COMPUTING MARKET, BY REGION, 2024–2029 (USD MILLION)
TABLE 71 NORTH AMERICA: SERVERLESS COMPUTING MARKET, BY SERVICE TYPE, 2019–2023 (USD MILLION)
TABLE 72 NORTH AMERICA: MARKET, BY SERVICE TYPE, 2024–2029 (USD MILLION)
TABLE 73 NORTH AMERICA: MARKET, BY SERVICE MODEL, 2019–2023 (USD MILLION)
TABLE 74 NORTH AMERICA: MARKET, BY SERVICE MODEL, 2024–2029 (USD MILLION)
TABLE 75 NORTH AMERICA: MARKET, BY DEPLOYMENT MODEL, 2019–2023 (USD MILLION)
TABLE 76 NORTH AMERICA: MARKET, BY DEPLOYMENT MODEL, 2024–2029 (USD MILLION)
TABLE 77 NORTH AMERICA: MARKET, BY ORGANIZATION SIZE, 2019–2023 (USD MILLION)
TABLE 78 NORTH AMERICA: MARKET, BY ORGANIZATION SIZE, 2024–2029 (USD MILLION)
TABLE 79 NORTH AMERICA: MARKET, BY VERTICAL, 2019–2023 (USD MILLION)
TABLE 80 NORTH AMERICA: MARKET, BY VERTICAL, 2024–2029 (USD MILLION)
TABLE 81 NORTH AMERICA: MARKET, BY COUNTRY, 2019–2023 (USD MILLION)
TABLE 82 NORTH AMERICA: MARKET, BY COUNTRY, 2024–2029 (USD MILLION)
TABLE 83 US: MARKET, BY SERVICE MODEL, 2019–2023 (USD MILLION)
TABLE 84 US: MARKET, BY SERVICE MODEL, 2024–2029 (USD MILLION)
TABLE 85 CANADA: MARKET, BY SERVICE MODEL, 2019–2023 (USD MILLION)
TABLE 86 CANADA: MARKET, BY SERVICE MODEL, 2024–2029 (USD MILLION)
TABLE 87 EUROPE: MARKET, BY SERVICE TYPE, 2019–2023 (USD MILLION)
TABLE 88 EUROPE: SERVERLESS COMPUTING MARKET, BY SERVICE TYPE, 2024–2029 (USD MILLION)
TABLE 89 EUROPE: MARKET, BY SERVICE MODEL, 2019–2023 (USD MILLION)
TABLE 90 EUROPE: MARKET, BY SERVICE MODEL, 2024–2029 (USD MILLION)
TABLE 91 EUROPE: MARKET, BY DEPLOYMENT MODEL, 2019–2023 (USD MILLION)
TABLE 92 EUROPE: MARKET, BY DEPLOYMENT MODEL, 2024–2029 (USD MILLION)
TABLE 93 EUROPE: MARKET, BY ORGANIZATION SIZE, 2019–2023 (USD MILLION)
TABLE 94 EUROPE: MARKET, BY ORGANIZATION SIZE, 2024–2029 (USD MILLION)
TABLE 95 EUROPE: MARKET, BY VERTICAL, 2019–2023 (USD MILLION)
TABLE 96 EUROPE: MARKET, BY VERTICAL, 2024–2029 (USD MILLION)
TABLE 97 EUROPE: MARKET, BY COUNTRY, 2019–2023 (USD MILLION)
TABLE 98 EUROPE: MARKET, BY COUNTRY, 2024–2029 (USD MILLION)
TABLE 99 UK: MARKET, BY SERVICE MODEL, 2019–2023 (USD MILLION)
TABLE 100 UK: MARKET, BY SERVICE MODEL, 2024–2029 (USD MILLION)
TABLE 101 GERMANY: MARKET, BY SERVICE MODEL, 2019–2023 (USD MILLION)
TABLE 102 GERMANY: MARKET, BY SERVICE MODEL, 2024–2029 (USD MILLION)
TABLE 103 FRANCE: MARKET, BY SERVICE MODEL, 2019–2023 (USD MILLION)
TABLE 104 FRANCE: MARKET, BY SERVICE MODEL, 2024–2029 (USD MILLION)
TABLE 105 ITALY: MARKET, BY SERVICE MODEL, 2019–2023 (USD MILLION)
TABLE 106 ITALY: MARKET, BY SERVICE MODEL, 2024–2029 (USD MILLION)
TABLE 107 REST OF EUROPE: SERVERLESS COMPUTING MARKET, BY SERVICE MODEL, 2019–2023 (USD MILLION)
TABLE 108 REST OF EUROPE: MARKET, BY SERVICE MODEL, 2024–2029 (USD MILLION)
TABLE 109 ASIA PACIFIC: MARKET, BY SERVICE TYPE, 2019–2023 (USD MILLION)
TABLE 110 ASIA PACIFIC: SERVERLESS COMPUTING MARKET, BY SERVICE TYPE, 2024–2029 (USD MILLION)
TABLE 111 ASIA PACIFIC: MARKET, BY SERVICE MODEL, 2019–2023 (USD MILLION)
TABLE 112 ASIA PACIFIC: MARKET, BY SERVICE MODEL, 2024–2029 (USD MILLION)
TABLE 113 ASIA PACIFIC: MARKET, BY DEPLOYMENT MODEL, 2019–2023 (USD MILLION)
TABLE 114 ASIA PACIFIC: MARKET, BY DEPLOYMENT MODEL, 2024–2029 (USD MILLION)
TABLE 115 ASIA PACIFIC: MARKET, BY ORGANIZATION SIZE, 2019–2023 (USD MILLION)
TABLE 116 ASIA PACIFIC: MARKET, BY ORGANIZATION SIZE, 2024–2029 (USD MILLION)
TABLE 117 ASIA PACIFIC: MARKET, BY VERTICAL, 2019–2023 (USD MILLION)
TABLE 118 ASIA PACIFIC: MARKET, BY VERTICAL, 2024–2029 (USD MILLION)
TABLE 119 ASIA PACIFIC: MARKET, BY COUNTRY, 2019–2023 (USD MILLION)
TABLE 120 ASIA PACIFIC: MARKET, BY COUNTRY, 2024–2029 (USD MILLION)
TABLE 121 CHINA: MARKET, BY SERVICE MODEL, 2019–2023 (USD MILLION)
TABLE 122 CHINA: MARKET, BY SERVICE MODEL, 2024–2029 (USD MILLION)
TABLE 123 INDIA: MARKET, BY SERVICE MODEL, 2019–2023 (USD MILLION)
TABLE 124 INDIA: MARKET, BY SERVICE MODEL, 2024–2029 (USD MILLION)
TABLE 125 JAPAN: MARKET, BY SERVICE MODEL, 2019–2023 (USD MILLION)
TABLE 126 JAPAN: MARKET, BY SERVICE MODEL, 2024–2029 (USD MILLION)
TABLE 127 REST OF ASIA PACIFIC: SERVERLESS COMPUTING MARKET, BY SERVICE MODEL, 2019–2023 (USD MILLION)
TABLE 128 REST OF ASIA PACIFIC: MARKET, BY SERVICE MODEL, 2024–2029 (USD MILLION)
TABLE 129 MIDDLE EAST & AFRICA: MARKET, BY SERVICE TYPE, 2019–2023 (USD MILLION)
TABLE 130 MIDDLE EAST & AFRICA: MARKET, BY SERVICE TYPE, 2024–2029 (USD MILLION)
TABLE 131 MIDDLE EAST & AFRICA: MARKET, BY SERVICE MODEL, 2019–2023 (USD MILLION)
TABLE 132 MIDDLE EAST & AFRICA: MARKET, BY SERVICE MODEL, 2024–2029 (USD MILLION)
TABLE 133 MIDDLE EAST & AFRICA: MARKET, BY DEPLOYMENT MODEL, 2019–2023 (USD MILLION)
TABLE 134 MIDDLE EAST & AFRICA: MARKET, BY DEPLOYMENT MODEL, 2024–2029 (USD MILLION)
TABLE 135 MIDDLE EAST & AFRICA: SERVERLESS COMPUTING MARKET, BY ORGANIZATION SIZE, 2019–2023 (USD MILLION)
TABLE 136 MIDDLE EAST & AFRICA: MARKET, BY ORGANIZATION SIZE, 2024–2029 (USD MILLION)
TABLE 137 MIDDLE EAST & AFRICA: MARKET, BY VERTICAL, 2019–2023 (USD MILLION)
TABLE 138 MIDDLE EAST & AFRICA: MARKET, BY VERTICAL, 2024–2029 (USD MILLION)
TABLE 139 MIDDLE EAST & AFRICA: MARKET, BY COUNTRY, 2019–2023 (USD MILLION)
TABLE 140 MIDDLE EAST & AFRICA: MARKET, BY COUNTRY, 2024–2029 (USD MILLION)
TABLE 141 GCC: MARKET, BY SERVICE MODEL, 2019–2023 (USD MILLION)
TABLE 142 GCC: MARKET, BY SERVICE MODEL, 2024–2029 (USD MILLION)
TABLE 143 GCC: MARKET, BY COUNTRY, 2019–2023 (USD MILLION)
TABLE 144 GCC: MARKET, BY COUNTRY, 2024–2029 (USD MILLION)
TABLE 145 SOUTH AFRICA: MARKET, BY SERVICE MODEL, 2019–2023 (USD MILLION)
TABLE 146 SOUTH AFRICA: SERVERLESS COMPUTING MARKET, BY SERVICE MODEL, 2024–2029 (USD MILLION)
TABLE 147 REST OF MIDDLE EAST & AFRICA: MARKET, BY SERVICE MODEL, 2019–2023 (USD MILLION)
TABLE 148 REST OF MIDDLE EAST & AFRICA: MARKET, BY SERVICE MODEL, 2024–2029 (USD MILLION)
TABLE 149 LATIN AMERICA: MARKET, BY SERVICE TYPE, 2019–2023 (USD MILLION)
TABLE 150 LATIN AMERICA: MARKET, BY SERVICE TYPE, 2024–2029 (USD MILLION)
TABLE 151 LATIN AMERICA: MARKET, BY SERVICE MODEL, 2019–2023 (USD MILLION)
TABLE 152 LATIN AMERICA: SERVERLESS COMPUTING MARKET, BY SERVICE MODEL, 2024–2029 (USD MILLION)
TABLE 153 LATIN AMERICA: MARKET, BY DEPLOYMENT MODEL, 2019–2023 (USD MILLION)
TABLE 154 LATIN AMERICA: MARKET, BY DEPLOYMENT MODEL, 2024–2029 (USD MILLION)
TABLE 155 LATIN AMERICA: MARKET, BY ORGANIZATION SIZE, 2019–2023 (USD MILLION)
TABLE 156 LATIN AMERICA: MARKET, BY ORGANIZATION SIZE, 2024–2029 (USD MILLION)
TABLE 157 LATIN AMERICA: MARKET, BY VERTICAL, 2019–2023 (USD MILLION)
TABLE 158 LATIN AMERICA: MARKET, BY VERTICAL, 2024–2029 (USD MILLION)
TABLE 159 LATIN AMERICA: MARKET, BY COUNTRY, 2019–2023 (USD MILLION)
TABLE 160 LATIN AMERICA: MARKET, BY COUNTRY, 2024–2029 (USD MILLION)
TABLE 161 BRAZIL: MARKET, BY SERVICE MODEL, 2019–2023 (USD MILLION)
TABLE 162 BRAZIL: MARKET, BY SERVICE MODEL, 2024–2029 (USD MILLION)
TABLE 163 MEXICO: MARKET, BY SERVICE MODEL, 2019–2023 (USD MILLION)
TABLE 164 MEXICO: MARKET, BY SERVICE MODEL, 2024–2029 (USD MILLION)
TABLE 165 REST OF LATIN AMERICA: MARKET, BY SERVICE MODEL, 2019–2023 (USD MILLION)
TABLE 166 REST OF LATIN AMERICA: SERVERLESS COMPUTING MARKET, BY SERVICE MODEL, 2024–2029 (USD MILLION)
TABLE 167 OVERVIEW OF STRATEGIES ADOPTED BY KEY VENDORS
TABLE 168 MARKET SHARE OF KEY VENDORS, 2023
TABLE 169 MARKET: REGION FOOTPRINT
TABLE 170 MARKET: OFFERING FOOTPRINT
TABLE 171 SERVERLESS COMPUTING MARKET: VERTICAL FOOTPRINT
TABLE 172 OVERALL COMPANY FOOTPRINT FOR STARTUPS/SMES
TABLE 173 PROJECT PORTFOLIO MANAGEMENT MARKET: KEY STARTUPS/SMES
TABLE 174 MARKET: PRODUCT LAUNCHES & ENHANCEMENTS, DECEMBER 2019–AUGUST 2024
TABLE 175 SERVERLESS COMPUTING MARKET: DEALS, FEBRUARY 2021–JUNE 2024
TABLE 176 AWS: COMPANY OVERVIEW
TABLE 177 AWS: PRODUCTS/SOLUTIONS/SERVICES OFFERED
TABLE 178 AWS: PRODUCT LAUNCHES & ENHANCEMENTS
TABLE 179 MICROSOFT: COMPANY OVERVIEW
TABLE 180 MICROSOFT: PRODUCTS/SOLUTIONS/SERVICES OFFERED
TABLE 181 MICROSOFT: PRODUCT LAUNCHES & ENHANCEMENTS
TABLE 182 IBM: COMPANY OVERVIEW
TABLE 183 IBM: PRODUCTS/SOLUTIONS/SERVICES OFFERED
TABLE 184 IBM: PRODUCT LAUNCHES & ENHANCEMENTS
TABLE 185 GOOGLE: COMPANY OVERVIEW
TABLE 186 GOOGLE: PRODUCTS/SOLUTIONS/SERVICES OFFERED
TABLE 187 GOOGLE: PRODUCT LAUNCHES & ENHANCEMENTS
TABLE 188 GOOGLE: DEALS
TABLE 189 ORACLE: COMPANY OVERVIEW
TABLE 190 ORACLE: PRODUCTS/SOLUTIONS/SERVICES OFFERED
TABLE 191 ORACLE: PRODUCT LAUNCHES & ENHANCEMENTS
TABLE 192 ALIBABA CLOUD: COMPANY OVERVIEW
TABLE 193 ALIBABA CLOUD: PRODUCTS/SOLUTIONS/SERVICES OFFERED
TABLE 194 ALIBABA CLOUD: PRODUCT LAUNCHES & ENHANCEMENTS
TABLE 195 TENCENT CLOUD: COMPANY OVERVIEW
TABLE 196 TENCENT CLOUD: PRODUCTS/SOLUTIONS/SERVICES OFFERED
TABLE 197 TWILIO: COMPANY OVERVIEW
TABLE 198 TWILIO: PRODUCTS/SOLUTIONS/SERVICES OFFERED
TABLE 199 CLOUDFLARE: COMPANY OVERVIEW
TABLE 200 CLOUDFLARE: PRODUCTS/SOLUTIONS/SERVICES OFFERED
TABLE 201 CLOUDFLARE: PRODUCT LAUNCHES & ENHANCEMENTS
TABLE 202 CLOUDFLARE: DEALS
TABLE 203 MONGODB: COMPANY OVERVIEW
TABLE 204 MONGODB: PRODUCTS/SOLUTIONS/SERVICES OFFERED
TABLE 205 MONGODB: PRODUCT LAUNCHES & ENHANCEMENTS
TABLE 206 MONGODB: DEALS
TABLE 207 MONGODB: EXPANSIONS
TABLE 208 CLOUD MOBILE BACKEND AS A SERVICE MARKET, BY SERVICE TYPE, 2019–2022 (USD MILLION)
TABLE 209 CLOUD MOBILE BACKEND AS A SERVICE MARKET, BY SERVICE TYPE, 2023–2028 (USD MILLION)
TABLE 210 CLOUD MOBILE BACKEND AS A SERVICE MARKET, BY VERTICAL, 2019–2022 (USD MILLION)
TABLE 211 CLOUD MOBILE BACKEND AS A SERVICE MARKET, BY VERTICAL, 2023–2028 (USD MILLION)
TABLE 212 CLOUD MOBILE BACKEND AS A SERVICE MARKET, BY REGION, 2019–2022 (USD MILLION)
TABLE 213 CLOUD MOBILE BACKEND AS A SERVICE MARKET, BY REGION, 2023–2028 (USD MILLION)
TABLE 214 SERVERLESS ARCHITECTURE MARKET, BY SERVICE TYPE, 2018–2025 (USD MILLION)
TABLE 215 SERVERLESS ARCHITECTURE MARKET, BY VERTICAL, 2018–2025 (USD MILLION)
TABLE 216 SERVERLESS ARCHITECTURE MARKET, BY REGION, 2018–2025 (USD MILLION)
LIST OF FIGURES (58 FIGURES)
FIGURE 1 SERVERLESS COMPUTING MARKET: RESEARCH DESIGN
FIGURE 2 BREAKUP OF PRIMARY INTERVIEWS: BY COMPANY TYPE, DESIGNATION, AND REGION
FIGURE 3 MARKET: TOP-DOWN AND BOTTOM-UP APPROACHES
FIGURE 4 MARKET SIZE ESTIMATION METHODOLOGY: SUPPLY-SIDE ANALYSIS
FIGURE 5 MARKET SIZE ESTIMATION METHODOLOGY - BOTTOM-UP APPROACH (SUPPLY SIDE): COLLECTIVE REVENUE OF SERVERLESS COMPUTING VENDORS
FIGURE 6 MARKET SIZE ESTIMATION METHODOLOGY – (SUPPLY SIDE): ILLUSTRATION OF VENDOR REVENUE ESTIMATION
FIGURE 7 MARKET SIZE ESTIMATION METHODOLOGY – APPROACH 2 (DEMAND SIDE): REVENUE GENERATED FROM SERVICE MODELS
FIGURE 8 MARKET SIZE ESTIMATION METHODOLOGY – APPROACH 2 (DEMAND SIDE): SERVERLESS COMPUTING MARKET
FIGURE 9 MARKET SNAPSHOT, 2019–2029
FIGURE 10 TOP MARKET SEGMENTS IN TERMS OF GROWTH RATE
FIGURE 11 NORTH AMERICA TO ACCOUNT FOR LARGEST SHARE DURING FORECAST PERIOD
FIGURE 12 GROWING DEMAND FOR SCALABLE, COST-EFFICIENT SOLUTIONS AND ADOPTION OF SERVERLESS ARCHITECTURES TO FUEL MARKET GROWTH
FIGURE 13 COMPUTE SEGMENT TO ACCOUNT FOR LARGEST MARKET SHARE IN 2024
FIGURE 14 FUNCTION-AS-A-SERVICE (FAAS) SEGMENT TO ACCOUNT FOR LARGEST MARKET SHARE IN 2024
FIGURE 15 PUBLIC CLOUD TO ACCOUNT FOR LARGEST MARKET SHARE IN 2024
FIGURE 16 LARGE ENTERPRISES TO ACCOUNT FOR LARGEST MARKET SHARE IN 2024
FIGURE 17 IT & TELECOM VERTICAL TO ACCOUNT FOR LARGEST MARKET SHARE IN 2024
FIGURE 18 ASIA PACIFIC TO EMERGE AS BEST MARKET FOR INVESTMENTS IN NEXT FIVE YEARS
FIGURE 19 MARKET: DRIVERS, RESTRAINTS, OPPORTUNITIES, AND CHALLENGES
FIGURE 20 ECOSYSTEM ANALYSIS OF SERVERLESS COMPUTING MARKET
FIGURE 21 MARKET: SUPPLY CHAIN ANALYSIS
FIGURE 22 NUMBER OF PATENTS PUBLISHED, 2013–2023
FIGURE 23 MARKET: TOP FIVE PATENT OWNERS (GLOBAL)
FIGURE 24 MARKET: PORTER’S FIVE FORCES ANALYSIS
FIGURE 25 MARKET: TRENDS/DISRUPTIONS IMPACTING CUSTOMERS’ BUSINESSES
FIGURE 26 INFLUENCE OF STAKEHOLDERS ON BUYING PROCESS FOR TOP THREE VERTICALS
FIGURE 27 KEY BUYING CRITERIA FOR TOP THREE VERTICALS
FIGURE 28 LEADING SERVERLESS COMPUTING MARKET VENDORS, BY NUMBER OF INVESTORS AND FUNDING ROUNDS, 2023
FIGURE 29 IMPACT OF GEN AI ON MARKET, 2023
FIGURE 30 APPLICATION INTEGRATION SEGMENT TO GROW AT HIGHEST CAGR DURING FORECAST PERIOD
FIGURE 31 BAAS SEGMENT TO GROW AT HIGHER CAGR DURING FORECAST PERIOD
FIGURE 32 HYBRID CLOUD TO GROW AT HIGHEST CAGR DURING FORECAST PERIOD
FIGURE 33 MEDIUM ENTERPRISES SEGMENT TO GROW AT HIGHEST CAGR DURING FORECAST PERIOD
FIGURE 34 HEALTHCARE & LIFE SCIENCES SEGMENT TO GROW AT HIGHEST CAGR DURING FORECAST PERIOD
FIGURE 35 NORTH AMERICA TO ACCOUNT FOR LARGEST MARKET BY 2029
FIGURE 36 NORTH AMERICA: MARKET SNAPSHOT
FIGURE 37 ASIA PACIFIC: MARKET SNAPSHOT
FIGURE 38 SERVERLESS COMPUTING MARKET: MARKET SHARE ANALYSIS
FIGURE 39 FAAS: VENDOR PRODUCT/BRAND COMPARISON
FIGURE 40 BAAS: BRAND/PRODUCT COMPARISON
FIGURE 41 HISTORICAL REVENUE ANALYSIS, 2019–2023 (USD MILLION)
FIGURE 42 COMPANY EVALUATION MATRIX FOR KEY PLAYERS: CRITERIA WEIGHTAGE
FIGURE 43 COMPANY EVALUATION MATRIX: KEY PLAYERS, 2023
FIGURE 44 SERVERLESS COMPUTING MARKET: COMPANY FOOTPRINT
FIGURE 45 EVALUATION MATRIX FOR STARTUPS/SMES: CRITERIA WEIGHTAGE
FIGURE 46 COMPANY EVALUATION MATRIX: STARTUPS/SMES, 2023
FIGURE 47 COMPANY VALUATION AND FINANCIAL METRICS OF KEY VENDORS
FIGURE 48 YEAR-TO-DATE (YTD) PRICE TOTAL RETURN AND FIVE-YEAR STOCK BETA OF KEY VENDORS
FIGURE 49 AWS: COMPANY SNAPSHOT
FIGURE 50 MICROSOFT: COMPANY SNAPSHOT
FIGURE 51 IBM: COMPANY SNAPSHOT
FIGURE 52 GOOGLE: COMPANY SNAPSHOT
FIGURE 53 ORACLE: COMPANY SNAPSHOT
FIGURE 54 ALIBABA CLOUD: COMPANY SNAPSHOT
FIGURE 55 TENCENT CLOUD: COMPANY SNAPSHOT
FIGURE 56 TWILIO: COMPANY SNAPSHOT
FIGURE 57 CLOUDFLARE: COMPANY SNAPSHOT
FIGURE 58 MONGODB: COMPANY SNAPSHOT


Growth opportunities and latent adjacency in Serverless Computing Market