Self-Sovereign Identity (SSI) Market by Offering (Solutions and Services), Identity Type (Biometrics and Non-biometrics), Network, Organization Size, Vertical (BFSI, IT & ITES, and Healthcare) and Region - Global Forecast to 2029
[295 Pages Report] The global self-sovereign identity (SSI) market size is projected to grow from USD 1.8 billion in 2024 to USD 47.1 billion by 2029 at a Compound Annual Growth Rate (CAGR) of 90.5% during the forecast period. Growing concerns over identity theft and deepfake fraud trends impacting countries like India, Bangladesh, and Pakistan underscore the urgent need for self-sovereign identity (SSI) solutions. SSI adoption offers crucial security enhancements and personal data control to mitigate cyber risks and safeguard digital identities.
Additionally, government initiatives promoting digital identity frameworks are pivotal in driving widespread SSI adoption, fostering innovation, and ensuring citizens have secure, portable digital identities, prioritizing privacy and security in public services transformation. These combined factors propel the expansion of SSI solutions across diverse sectors and regions.
To know about the assumptions considered for the study, Request for Free Sample Report
To know about the assumptions considered for the study, download the pdf brochure
Self-Sovereign Identity Market Dynamics
Driver: SMEs driving innovation in self-sovereign identity (SSI)
Small and medium-sized enterprises (SMEs) are at the forefront of driving self-sovereign identity (SSI) initiatives through innovative technologies and strategic partnerships, advancing digital identity solutions. These initiatives provide tailored, secure identity management solutions for diverse business needs. For example, Alliance Block's Nexerald platform, endorsed by global consortiums like the World Wide Web Consortium, enables seamless onboarding to Web3 environments while maintaining industry standard compliance. Additionally, Truvity's funding underscores the crucial role of SMEs in developing SSI toolkits, facilitating the establishment of robust digital identity ecosystems. Collaborations between startups and academic institutions address data privacy and security concerns, promoting technological advancement and fostering a more inclusive approach to identity management. As SME-driven initiatives evolve, they are poised to shape the future of self-sovereign identity, empowering individuals with greater control over their digital identities.
Restraint: Legal uncertainty about cloud SSI adoption
Regulatory ambiguity hinders the widespread adoption of self-sovereign identity (SSI) systems due to the absence of clear frameworks and guidelines from governments and regulators. To achieve broad acceptance, regulatory bodies must establish transparent rules addressing data protection, identity verification, and financial compliance in DI. Legal recognition is crucial for the credibility and acceptance of DI, and stringent laws are needed to govern the handling of personal data within DI systems, ensuring individuals maintain control and provide informed consent.
Opportunity: Governments Embrace SSI for Digital Identity
Governments worldwide acknowledge Self-Sovereign Identity's (SSI) transformative potential in modernizing digital identity management systems. Finland's 3 million euro grant to Findynet Cooperative supports establishing a secure SSI network for electronic transactions with a strong emphasis on privacy protection. Similarly, Bhutan has implemented blockchain-based digital IDs to provide citizens with decentralized identity solutions. These initiatives underscore the potential of SSI to reshape digital identities and build trust in online transactions globally. By adopting SSI, governments aim to empower citizens with enhanced control over their data and facilitate seamless access to public and private sector services.
Challenge: Technical complication
Technical complexity presents a formidable challenge to expanding self-sovereign identity (SSI) systems. The intricate nature of SSI solutions, involving cryptographic principles, decentralized architectures, and interoperability protocols, poses significant hurdles for developers and end-users. Implementing robust SSI infrastructures demands expertise in blockchain technology, cryptography, and secure data management. The complexity of these systems may deter organizations lacking specialized technical skills or resources from adopting SSI solutions. Furthermore, ensuring seamless interoperability among diverse SSI platforms adds to the challenge. Standardizing protocols and formats across systems is essential to facilitate interoperability, but achieving consensus on technical standards remains formidable. Addressing technical complexity requires collaborative efforts from industry stakeholders to streamline development processes, improve user interfaces, and advance SSI technologies for enhanced privacy, security, and user-centric control in the digital realm.
Self-Sovereign Identity Market Ecosystem
By vertical, healthcare is expected to grow at the highest CAGR during the forecast period.
The healthcare segment is experiencing the fastest growth in the SSI market due to the transformative impact of SSI on patient data management and access to healthcare services. SSI empowers patients by granting control over their health records, ensuring seamless access to providers regardless of location or specialty. It eliminates risks associated with missing or poorly documented records, enhancing patient safety and reducing liabilities for healthcare professionals. SSI also provides a secure way to manage patient data, consolidating scattered information into unified digital credentials like insurance cards and medical histories. By leveraging SSI-enabled mobile apps, patients can securely identify themselves, sign documents, and disclose data selectively, eliminating third-party processing and prioritizing privacy. This patient-centric approach promises to revolutionize clinical research and patient care practices, driving rapid adoption of SSI in healthcare.
By network, the permissionless is expected to grow at the highest CAGR during the forecast period.
The permissionless network is poised to experience rapid growth, driven by its dynamic and decentralized nature within the self-sovereign identity market. Unlike permissioned networks, permissionless architectures operate without restrictions, enabling unrestricted participation and interaction. This inclusive environment fosters innovation and accessibility, empowering individuals and organizations to engage in the SSI ecosystem freely. For instance, platforms like Ethereum and Algorand showcase the scalability and efficiency of permissionless setups, leveraging smart contracts for verifiable credential issuance and authentication. This unrestricted approach resonates with the ethos of SSI, driving the fastest growth in the market toward a decentralized and accessible future.
By region, North America accounts for the highest market size during the forecast period.
North America is expected to hold the largest market share in the SSI market due to its unique blend of factors driving demand. Identity theft is a significant concern in the region, prompting individuals and businesses to seek effective solutions like SSI that can mitigate fraud risks by decentralizing data storage. Additionally, North America shares data privacy concerns similar to those of Europe, creating a solid market demand for SSI solutions that empower users with data control. The region's stringent regulatory landscape, including requirements like KYC and AML, further accelerates adoption as SSI offers streamlined compliance processes. Moreover, the involvement of major tech players and a thriving startup ecosystem contributes to developing and adopting innovative SSI technologies, solidifying North America's leadership position in the self-sovereign identity market.
Self-Sovereign Identity Companies
The key players in the self-sovereign identity market are Microsoft (US), Ping Identity (US), IDEX Biometrics (Norway), NEC (Japan), Imageware (US), Dock (Switzerland), Metadium (Cayman Islands), Blockchain Helix (Germany), Validated ID (Spain), Wipro (India), Persistent (India), Infopulse (Poland), and others.
Want to explore hidden markets that can drive new revenue in Self-Sovereign Identity (SSI) Market?
Scope of the Report
Want to explore hidden markets that can drive new revenue in Self-Sovereign Identity (SSI) Market?
Report Metrics |
Details |
Market size available for years |
|
Base year considered |
|
Forecast period |
|
Forecast units |
|
Segments Covered |
|
Geographies covered |
|
List of Companies in Self-Sovereign Identity |
|
The study categorizes the self-sovereign identity market by segments - offering, identity type, network, organization size, vertical, and region.
By Offering:
- Solutions
- Services
By Identity Type:
- Non-Biometrics
- Biometrics
By Network:
- Permissioned
- Permissionless
By Organization Size:
- SMEs
- Large Enterprises
Vertical:
- BFSI
- IT and ITeS
- Telecom
- Government
- Real Estate & Construction
- Healthcare
- Retail and E-Commerce
- Media & Entertainment
- Travel & Hospitality
- Other Verticals
By Region:
- North America
- Europe
- Asia Pacific
- Middle East & Africa
- Latin America
Recent Developments
- In November 2023, Ping Identity partnered with ConnectID to simplify integration into existing systems and onboard new customers. The partnership aims to provide a cohesive solution for customers of all sizes, enhancing digital customer experiences and enabling secure online identity verification without unnecessary data sharing.
- In February 2023, Wipro Lab45, the innovation arm of Wipro, introduced DICE ID, a Decentralized Identity and Credential Exchange solution. Built on blockchain, it empowers users with control over personal data, facilitating secure sharing online through self-verifiable digital credentials.
- In October 2022, IDEX Biometrics and TrustSEC, a leading European provider of digital authentication solutions, partnered to bring biometric intelligent card solutions to the cybersecurity market. The partnership combines TrustSEC's smart card module with IDEX Biometrics' TrustedBio fingerprint sensor solution, targeting secure access for digital and cryptocurrency wallets and physical and logical access management.
- In May 2022, Microsoft introduced Microsoft Entra, a product family consisting of identity and access management solutions. It included Azure AD and introduced two new categories: Cloud Infrastructure Entitlement Management (CIEM) and Decentralized Identity. Entra was intended to safeguard user access to apps and resources, enabling security teams to manage permissions in multi-cloud environments and ensure end-to-end digital identity security.
Frequently Asked Questions (FAQ):
What are the opportunities in the global self-sovereign identity market?
Integrating blockchain-based SSI and zero-knowledge proofs (ZKPs), along with biometrics, amplifies secure, user-centric digital identity solutions, fostering growth and opportunities for the SSI market.
What is the definition of the self-sovereign identity market?
Self-sovereign identity (SSI) refers to a digital framework that emphasizes individual ownership and control over one's identity information, free from the oversight of centralized authorities. In an SSI system, individuals manage their identity credentials digitally, enabling them to selectively disclose relevant information to different parties without relying on intermediaries. This approach empowers users to assert their identities with greater autonomy and security, akin to physical interactions.
Which region is expected to show the highest market share in the self-sovereign identity market?
Europe is expected to account for the largest market share during the forecast period.
What are the major market players covered in the report?
Major vendors, namely, include Microsoft (US), Ping Identity (US), IDEX Biometrics (Norway), NEC (Japan), Imageware (US), Dock (Switzerland), Metadium (Cayman Islands), Blockchain Helix (Germany), Validated ID (Spain), Wipro (India), Persistent (India), and Infopulse (Poland).
What is the current size of the global self-sovereign identity market?
The global self-sovereign identity (SSI) market size is projected to grow from USD 1.8 billion in 2024 to USD 47.1 billion by 2029 at a Compound Annual Growth Rate (CAGR) of 90.5% during the forecast period. .
To speak to our analyst for a discussion on the above findings, click Speak to Analyst
Exclusive indicates content/data unique to MarketsandMarkets and not available with any competitors.
- 5.1 INTRODUCTION
-
5.2 MARKET DYNAMICSDRIVERS- Escalating concerns over identity theft and frauds- SME-driven initiatives to fuel SSI market growth- Increasing SSI adoption in healthcare sectorRESTRAINTS- Regulatory ambiguity to cloud SSI adoption- User education and awarenessOPPORTUNITIES- Emergence of self-sovereign identity in biometrics- Integration with advanced technologies- Government initiatives to propel widespread SSI adoptionCHALLENGES- Interoperability challenges- Technical complexity
-
5.3 CASE STUDY ANALYSISCASE STUDY 1: DENTITY PARTNERED WITH TRINSIC FOR DECENTRALIZED IDENTITYCASE STUDY 2: BLUENUMBER FOUNDATION REVOLUTIONIZED SUPPLY CHAINS WITH TRANSPARENT SSICASE STUDY 3: ASSOCIAZIONE BLOCKCHAIN ITALIA TRANSFORMED WORDPRESS LOGIN WITH TRINSIC
-
5.4 VALUE CHAIN ANALYSISCOMPONENTPLANNING AND DESIGNINGINFRASTRUCTURE DEPLOYMENTSYSTEM INTEGRATIONDISTRIBUTORS/RESELLERSEND USERS
- 5.5 ECOSYSTEM
-
5.6 PORTER’S FIVE FORCES ANALYSISTHREAT OF NEW ENTRANTSTHREAT OF SUBSTITUTESBARGAINING POWER OF SUPPLIERSBARGAINING POWER OF BUYERSINTENSITY OF COMPETITIVE RIVALRY
-
5.7 PRICING ANALYSISINDICATIVE PRICING ANALYSIS, BY SELF-SOVEREIGN IDENTITY (SSI) VENDOR
-
5.8 TECHNOLOGY ANALYSISKEY TECHNOLOGIES- Blockchain- Decentralized Identifiers (DIDs)- Verifiable Credentials (VCs)COMPLEMENTARY TECHNOLOGIES- Digital Signatures- Fuzzy Extractors and Biocrypt- Zero-knowledge Proofs (ZKPs)ADJACENT TECHNOLOGIES- Reusable Identity- Internet of Things (IoT)
-
5.9 PATENT ANALYSISLIST OF TOP PATENTS IN SELF-SOVEREIGN IDENTITY (SSI) MARKET, 2023–2024
- 5.10 TRADE ANALYSIS
- 5.11 TRENDS AND DISRUPTIONS IMPACTING CUSTOMER’S BUSINESS
-
5.12 KEY STAKEHOLDERS & BUYING CRITERIAKEY STAKEHOLDERS IN BUYING PROCESSBUYING CRITERIA
-
5.13 TARIFF AND REGULATORY LANDSCAPETARIFF RELATED TO ELECTRICAL MACHINES AND APPARATUS (8543)REGULATORY BODIES, GOVERNMENT AGENCIES, AND OTHER ORGANIZATIONS
- 5.14 KEY CONFERENCES & EVENTS IN 2024–2025
- 5.15 BUSINESS MODEL ANALYSIS
- 5.16 INVESTMENT LANDSCAPE
-
5.17 ORIGIN AND EVOLUTION OF SELF SOVEREIGN IDENTITYEVOLUTION OF DIGITAL IDENTITY MODELS- Centralized Identity (Administrative Control by Single Authority or Hierarchy)- Federated Identity (Administrative Control by Multiple Federated Authorities)- User-centric Identity (Individual or Administrative Control Across Multiple Authorities Without Requiring a Federation)- Self-sovereign Identity (Individuals Have Full Control Across Any Number of Authorities)- Future of SSI
-
6.1 BLOCKCHAIN TECHNOLOGYPUBLIC BLOCKCHAINPRIVATE BLOCKCHAINCONSORTIUM BLOCKCHAIN
- 6.2 CLOUD-BASED SSI
-
7.1 INTRODUCTIONOFFERING: SELF-SOVEREIGN IDENTITY MARKET DRIVERS
-
7.2 SOLUTIONSCONTINUOUS INNOVATION TO DRIVE ADOPTION OF SSI SOLUTIONSIDENTITY MANAGEMENT PLATFORMSVERIFIABLE CREDENTIAL ISSUANCE PLATFORMSDECENTRALIZED IDENTITY WALLETSREGULATORY COMPLIANCE SOLUTIONSINTEROPERABILITY SOLUTIONSSSI ANALYTICS
-
7.3 SERVICESCOMPREHENSIVE SERVICES TO EMPOWER SSI IMPLEMENTATION
-
8.1 INTRODUCTIONIDENTITY TYPE: SELF-SOVEREIGN IDENTITY MARKET DRIVERS
-
8.2 NON-BIOMETRICSVERSATILE NON-BIOMETRIC SSI SOLUTIONS TO DRIVE ADOPTION
-
8.3 BIOMETRICSCONTINUOUS INITIATIVES IN BIOMETRIC INTEGRATION TO DRIVE SSI EVOLUTION
-
9.1 INTRODUCTIONNETWORK: SELF-SOVEREIGN IDENTITY MARKET DRIVERS
-
9.2 PERMISSIONEDPERMISSIONED NETWORK TO STREAMLINE IDENTITY MANAGEMENT PROCESSES
-
9.3 PERMISSIONLESSLEVERAGING BLOCKCHAIN TECHNOLOGY FOR BUILDING PERMISSIONLESS SSI SOLUTIONS
-
10.1 INTRODUCTIONORGANIZATION SIZE: SELF-SOVEREIGN IDENTITY MARKET DRIVERS
-
10.2 SMESSMES EMBRACING SSI FOR OPERATIONAL ENHANCEMENT AND RISK MITIGATION
-
10.3 LARGE ENTERPRISESSTRATEGIC PARTNERSHIPS TO DRIVE SSI ADOPTION IN LARGE ENTERPRISES
-
11.1 INTRODUCTIONVERTICAL: SELF-SOVEREIGN IDENTITY MARKET DRIVERS
-
11.2 BFSISTREAMLINING KYC PROCESSES TO DRIVE SSI ADOPTION IN BFSI
-
11.3 IT & ITESENHANCING IDENTITY VERIFICATION TO PROPEL SSI ADOPTION
-
11.4 TELECOMSSI REVOLUTIONIZING TELECOMS TO COMBAT IDENTITY FRAUD
-
11.5 GOVERNMENTGOVERNMENT SECTOR TO SPEARHEAD SSI INNOVATION FOR ENHANCED CITIZEN SERVICES
-
11.6 REAL ESTATE & CONSTRUCTIONNEED FOR STREAMLINED PROPERTY TRANSACTIONS TO DRIVE SSI ADOPTION
-
11.7 HEALTHCAREPATIENT-CENTRIC SSI TO TRANSFORM HEALTHCARE DATA MANAGEMENT
-
11.8 RETAIL & E-COMMERCEENHANCED SECURITY AND FRICTIONLESS EXPERIENCE TO DRIVE SSI ADOPTION
-
11.9 MEDIA & ENTERTAINMENTENHANCED DATA PRIVACY AND SECURITY TO BOOST ADOPTION OF SSI
-
11.10 TRAVEL & HOSPITALITYSTORING SENSITIVE CUSTOMER DATA AND SIMPLIFYING IDENTITY VERIFICATION PROCESSES TO DRIVE MARKET
- 11.11 OTHER VERTICALS
- 12.1 INTRODUCTION
-
12.2 NORTH AMERICANORTH AMERICA: MARKET DRIVERSNORTH AMERICA: RECESSION IMPACTUS- US to witness exponential growth in SSI market as identity fraud escalatesCANADA- Canada's strategic initiatives in digital identity security to propel market growth
-
12.3 EUROPEEUROPE: MARKET DRIVERSEUROPE: RECESSION IMPACTUK- UK government's leading role in SSI innovation and implementation to drive market growthGERMANY- Germany to lead SSI revolution with innovative digital identity initiativesFRANCE- France's innovative steps in SSI evolution to propel marketITALY- Italy to advance in self-sovereign identity with speedy integration and growthREST OF EUROPE
-
12.4 ASIA PACIFICASIA PACIFIC: MARKET DRIVERSASIA PACIFIC: RECESSION IMPACTCHINA- Launch of RealDID initiative to drive SSI growth in ChinaJAPAN- Advancements in self-sovereign identity to shape Japan's digital identity landscapeINDIA- India's SSI momentum to spur digital identity innovationsSINGAPORE- Singapore to lead secure, user-centric digital identity with Singpass evolutionREST OF APAC
-
12.5 MIDDLE EAST & AFRICAMIDDLE EAST & AFRICA: MARKET DRIVERSMIDDLE EAST & AFRICA: RECESSION IMPACTGULF COOPERATION COUNCIL (GCC)- KSA- UAE- Rest of GCC CountriesSOUTH AFRICA- Introduction of SSDI to propel adoption of SSI in South AfricaREST OF MIDDLE EAST & AFRICA
-
12.6 LATIN AMERICALATIN AMERICA: MARKET DRIVERSLATIN AMERICA: RECESSION IMPACTBRAZIL- Blockchain integration to propel Brazil toward self-sovereign identity adoptionMEXICO- SSI to empower Mexico: Privacy advocacy and financial inclusionREST OF LATIN AMERICA
- 13.1 KEY PLAYERS’ STRATEGIES/RIGHT TO WIN
- 13.2 BRAND COMPARISON
- 13.3 COMPANY VALUATION AND FINANCIAL METRICS
- 13.4 REVENUE ANALYSIS
- 13.5 MARKET SHARE ANALYSIS
-
13.6 COMPANY EVALUATION MATRIX: KEY PLAYERS, 2023STARSEMERGING LEADERSPERVASIVE PLAYERSPARTICIPANTSCOMPANY FOOTPRINT: KEY PLAYERS, 2023- Company Footprint- Offering Footprint- Vertical Footprint- Region Footprint
-
13.7 COMPANY EVALUATION MATRIX: STARTUPS/SMES, 2023PROGRESSIVE COMPANIESRESPONSIVE COMPANIESDYNAMIC COMPANIESSTARTING BLOCKSCOMPETITIVE BENCHMARKING: STARTUPS/SMES, 2023- Detailed list of key startups/SMEs- Competitive benchmarking of key startups/SMEs
-
13.8 COMPETITIVE SCENARIOPRODUCT LAUNCHES/DEVELOPMENTSDEALS
-
14.1 KEY PLAYERSMICROSOFT- Business overview- Products/Solutions/Services offered- Recent developments- MnM viewIDEX BIOMETRICS- Business overview- Products/Solutions/Services offered- Recent developments- MnM viewNEC- Business overview- Products/Solutions/Services offered- MnM viewIMAGEWARE- Business overview- Products/Solutions/Services offered- Recent developments- MnM viewPING IDENTITY- Business overview- Products/Solutions/Services offered- Recent developments- MnM viewDOCK- Business overview- Products/Solutions/Services offered- Recent developmentsWIPRO- Business overview- Products/Solutions/Services offered- Recent developmentsPERSISTENT- Business overview- Products/Solutions/Services offeredINFOPULSE- Business overview- Products/Solutions/Services offeredMETADIUM- Business overview- Products/Solutions/Services offeredVALIDATED ID- Business overview- Products/Solutions/Services offeredBLOCKCHAIN HELIX- Business overview- Products/Solutions/Services offered
-
14.2 OTHER KEY PLAYERS1KOSMOSACCUMULATENUIDKALEIDOTALAOVEREIGNMIDYSELFKEYTRUVITYAFFINIDITRINSICCHEQDFRACTAL IDSOULVERSEFINEMANUGGETSSENTRYSPRINGROLEWALT.IDPROCIVISCIVICGATACAPOLYGON LABSVOYATEK
- 15.1 LIMITATIONS
- 15.2 DECENTRALIZED IDENTITY MARKET
- 15.3 BLOCKCHAIN IDENTITY MANAGEMENT MARKET
- 16.1 DISCUSSION GUIDE
- 16.2 KNOWLEDGESTORE: MARKETSANDMARKETS’ SUBSCRIPTION PORTAL
- 16.3 CUSTOMIZATION OPTIONS
- 16.4 RELATED REPORTS
- 16.5 AUTHOR DETAILS
- TABLE 1 USD EXCHANGE RATES, 2020–2023
- TABLE 2 FACTOR ANALYSIS
- TABLE 3 SELF-SOVEREIGN IDENTITY MARKET AND GROWTH RATE, 2020–2023 (USD MILLION, Y-O-Y %)
- TABLE 4 SELF-SOVEREIGN IDENTITY MARKET AND GROWTH RATE, 2024–2029 (USD MILLION, Y-O-Y %)
- TABLE 5 SELF-SOVEREIGN IDENTITY MARKET: ECOSYSTEM
- TABLE 6 PORTER’S FIVE FORCES’ IMPACT ON SELF-SOVEREIGN IDENTITY (SSI) MARKET
- TABLE 7 PRICING MODELS OF DOCK.IO
- TABLE 8 PRICING MODELS OF KALEIDO
- TABLE 9 PRICING MODELS OF CIVIC TECHNOLOGIES
- TABLE 10 PRICING MODELS OF AFFINIDI
- TABLE 11 PRICING MODELS OF SENTRY ENTERPRISES
- TABLE 12 IMPORT DATA, BY COUNTRY, 2018–2022 (USD MILLION)
- TABLE 13 EXPORT DATA, BY COUNTRY, 2018–2022 (USD MILLION)
- TABLE 14 INFLUENCE OF STAKEHOLDERS ON BUYING PROCESS FOR TOP THREE VERTICALS
- TABLE 15 KEY BUYING CRITERIA FOR TOP THREE VERTICALS
- TABLE 16 TARIFF RELATED TO SSI SOLUTIONS, 2022
- TABLE 17 NORTH AMERICA: LIST OF REGULATORY BODIES, GOVERNMENT AGENCIES, AND OTHER ORGANIZATIONS
- TABLE 18 EUROPE: LIST OF REGULATORY BODIES, GOVERNMENT AGENCIES, AND OTHER ORGANIZATIONS
- TABLE 19 ASIA PACIFIC: LIST OF REGULATORY BODIES, GOVERNMENT AGENCIES, AND OTHER ORGANIZATIONS
- TABLE 20 REST OF THE WORLD: LIST OF REGULATORY BODIES, GOVERNMENT AGENCIES, AND OTHER ORGANIZATIONS
- TABLE 21 SELF-SOVEREIGN IDENTITY (SSI) MARKET: DETAILED LIST OF CONFERENCES & EVENTS
- TABLE 22 BUSINESS MODEL
- TABLE 23 SELF-SOVEREIGN IDENTITY MARKET, BY OFFERING, 2020–2023 (USD MILLION)
- TABLE 24 SELF-SOVEREIGN IDENTITY MARKET, BY OFFERING, 2024–2029 (USD MILLION)
- TABLE 25 SOLUTIONS: SELF-SOVEREIGN IDENTITY MARKET, BY REGION, 2020–2023 (USD MILLION)
- TABLE 26 SOLUTIONS: SELF-SOVEREIGN IDENTITY MARKET, BY REGION, 2024–2029 (USD MILLION)
- TABLE 27 SERVICES: SELF-SOVEREIGN IDENTITY MARKET, BY REGION, 2020–2023 (USD MILLION)
- TABLE 28 SERVICES: SELF-SOVEREIGN IDENTITY MARKET, BY REGION, 2024–2029 (USD MILLION)
- TABLE 29 SELF-SOVEREIGN IDENTITY MARKET, BY IDENTITY TYPE, 2020–2023 (USD MILLION)
- TABLE 30 SELF-SOVEREIGN IDENTITY MARKET, BY IDENTITY TYPE, 2024–2029 (USD MILLION)
- TABLE 31 NON-BIOMETRICS: SELF-SOVEREIGN IDENTITY MARKET, BY REGION, 2020–2023 (USD MILLION)
- TABLE 32 NON-BIOMETRICS: SELF-SOVEREIGN IDENTITY MARKET, BY REGION, 2024–2029 (USD MILLION)
- TABLE 33 BIOMETRICS: SELF-SOVEREIGN IDENTITY MARKET, BY REGION, 2020–2023 (USD MILLION)
- TABLE 34 BIOMETRICS: SELF-SOVEREIGN IDENTITY MARKET, BY REGION, 2024–2029 (USD MILLION)
- TABLE 35 SELF-SOVEREIGN IDENTITY MARKET, BY NETWORK, 2020–2023 (USD MILLION)
- TABLE 36 SELF-SOVEREIGN IDENTITY MARKET, BY NETWORK, 2024–2029 (USD MILLION)
- TABLE 37 PERMISSIONED: SELF-SOVEREIGN IDENTITY MARKET, BY REGION, 2020–2023 (USD MILLION)
- TABLE 38 PERMISSIONED: SELF-SOVEREIGN IDENTITY MARKET, BY REGION, 2024–2029 (USD MILLION)
- TABLE 39 PERMISSIONLESS: SELF-SOVEREIGN IDENTITY MARKET, BY REGION, 2020–2023 (USD MILLION)
- TABLE 40 PERMISSIONLESS: SELF-SOVEREIGN IDENTITY MARKET, BY REGION, 2024–2029 (USD MILLION)
- TABLE 41 SELF-SOVEREIGN IDENTITY MARKET, BY ORGANIZATION SIZE, 2020–2023 (USD MILLION)
- TABLE 42 SELF-SOVEREIGN IDENTITY MARKET, BY ORGANIZATION SIZE, 2024–2029 (USD MILLION)
- TABLE 43 SMES: SELF-SOVEREIGN IDENTITY MARKET, BY REGION, 2020–2023 (USD MILLION)
- TABLE 44 SMES: SELF-SOVEREIGN IDENTITY MARKET, BY REGION, 2024–2029 (USD MILLION)
- TABLE 45 LARGE ENTERPRISES: SELF-SOVEREIGN IDENTITY MARKET, BY REGION, 2020–2023 (USD MILLION)
- TABLE 46 LARGE ENTERPRISES: SELF-SOVEREIGN IDENTITY MARKET, BY REGION, 2024–2029 (USD MILLION)
- TABLE 47 SELF-SOVEREIGN IDENTITY MARKET, BY VERTICAL, 2020–2023 (USD MILLION)
- TABLE 48 SELF-SOVEREIGN IDENTITY MARKET, BY VERTICAL, 2024–2029 (USD MILLION)
- TABLE 49 BFSI: SELF-SOVEREIGN IDENTITY MARKET, BY REGION, 2020–2023 (USD MILLION)
- TABLE 50 BFSI: MARKET, BY REGION, 2024–2029 (USD MILLION)
- TABLE 51 IT & ITES: MARKET, BY REGION, 2020–2023 (USD MILLION)
- TABLE 52 IT & ITES: MARKET, BY REGION, 2024–2029 (USD MILLION)
- TABLE 53 TELECOM: MARKET, BY REGION, 2020–2023 (USD MILLION)
- TABLE 54 TELECOM: MARKET, BY REGION, 2024–2029 (USD MILLION)
- TABLE 55 GOVERNMENT: MARKET, BY REGION, 2020–2023 (USD MILLION)
- TABLE 56 GOVERNMENT: MARKET, BY REGION, 2024–2029 (USD MILLION)
- TABLE 57 REAL ESTATE & CONSTRUCTION: MARKET, BY REGION, 2020–2023 (USD MILLION)
- TABLE 58 REAL ESTATE & CONSTRUCTION: MARKET, BY REGION, 2024–2029 (USD MILLION)
- TABLE 59 HEALTHCARE: MARKET, BY REGION, 2020–2023 (USD MILLION)
- TABLE 60 HEALTHCARE: MARKET, BY REGION, 2024–2029 (USD MILLION)
- TABLE 61 RETAIL & E-COMMERCE: MARKET, BY REGION, 2020–2023 (USD MILLION)
- TABLE 62 RETAIL & E-COMMERCE: MARKET, BY REGION, 2024–2029 (USD MILLION)
- TABLE 63 MEDIA & ENTERTAINMENT: MARKET, BY REGION, 2020–2023 (USD MILLION)
- TABLE 64 MEDIA & ENTERTAINMENT: MARKET, BY REGION, 2024–2029 (USD MILLION)
- TABLE 65 TRAVEL & HOSPITALITY: MARKET, BY REGION, 2020–2023 (USD MILLION)
- TABLE 66 TRAVEL & HOSPITALITY: MARKET, BY REGION, 2024–2029 (USD MILLION)
- TABLE 67 OTHER VERTICALS: MARKET, BY REGION, 2020–2023 (USD MILLION)
- TABLE 68 OTHER VERTICALS: MARKET, BY REGION, 2024–2029 (USD MILLION)
- TABLE 69 MARKET, BY REGION, 2020–2023 (USD MILLION)
- TABLE 70 MARKET, BY REGION, 2024–2029 (USD MILLION)
- TABLE 71 NORTH AMERICA: MARKET, BY OFFERING, 2020–2023 (USD MILLION)
- TABLE 72 NORTH AMERICA: MARKET, BY OFFERING, 2024–2029 (USD MILLION)
- TABLE 73 NORTH AMERICA: MARKET, BY IDENTITY TYPE, 2020–2023 (USD MILLION)
- TABLE 74 NORTH AMERICA: MARKET, BY IDENTITY TYPE, 2024–2029 (USD MILLION)
- TABLE 75 NORTH AMERICA: MARKET, BY NETWORK, 2020–2023 (USD MILLION)
- TABLE 76 NORTH AMERICA: MARKET, BY NETWORK, 2024–2029 (USD MILLION)
- TABLE 77 NORTH AMERICA: MARKET, BY ORGANIZATION SIZE, 2020–2023 (USD MILLION)
- TABLE 78 NORTH AMERICA: MARKET, BY ORGANIZATION SIZE, 2024–2029 (USD MILLION)
- TABLE 79 NORTH AMERICA: MARKET, BY VERTICAL, 2020–2023 (USD MILLION)
- TABLE 80 NORTH AMERICA: MARKET, BY VERTICAL, 2024–2029 (USD MILLION)
- TABLE 81 NORTH AMERICA: MARKET, BY COUNTRY, 2020–2023 (USD MILLION)
- TABLE 82 NORTH AMERICA: MARKET, BY COUNTRY, 2024–2029 (USD MILLION)
- TABLE 83 US: MARKET, BY OFFERING, 2020–2023 (USD MILLION)
- TABLE 84 US: MARKET, BY OFFERING, 2024–2029 (USD MILLION)
- TABLE 85 US: MARKET, BY IDENTITY TYPE, 2020–2023 (USD MILLION)
- TABLE 86 US: MARKET, BY IDENTITY TYPE, 2024–2029 (USD MILLION)
- TABLE 87 US: MARKET, BY NETWORK, 2020–2023 (USD MILLION)
- TABLE 88 US: MARKET, BY NETWORK, 2024–2029 (USD MILLION)
- TABLE 89 US: MARKET, BY ORGANIZATION SIZE, 2020–2023 (USD MILLION)
- TABLE 90 US: MARKET, BY ORGANIZATION SIZE, 2024–2029 (USD MILLION)
- TABLE 91 US: MARKET, BY VERTICAL, 2020–2023 (USD MILLION)
- TABLE 92 US: MARKET, BY VERTICAL, 2024–2029 (USD MILLION)
- TABLE 93 CANADA: MARKET, BY OFFERING, 2020–2023 (USD MILLION)
- TABLE 94 CANADA: MARKET, BY OFFERING, 2024–2029 (USD MILLION)
- TABLE 95 CANADA: MARKET, BY IDENTITY TYPE, 2020–2023 (USD MILLION)
- TABLE 96 CANADA: MARKET, BY IDENTITY TYPE, 2024–2029 (USD MILLION)
- TABLE 97 CANADA: MARKET, BY NETWORK, 2020–2023 (USD MILLION)
- TABLE 98 CANADA: MARKET, BY NETWORK, 2024–2029 (USD MILLION)
- TABLE 99 CANADA: MARKET, BY ORGANIZATION SIZE, 2020–2023 (USD MILLION)
- TABLE 100 CANADA: MARKET, BY ORGANIZATION SIZE, 2024–2029 (USD MILLION)
- TABLE 101 CANADA: MARKET, BY VERTICAL, 2020–2023 (USD MILLION)
- TABLE 102 CANADA: MARKET, BY VERTICAL, 2024–2029 (USD MILLION)
- TABLE 103 EUROPE: MARKET, BY OFFERING, 2020–2023 (USD MILLION)
- TABLE 104 EUROPE: MARKET, BY OFFERING, 2024–2029 (USD MILLION)
- TABLE 105 EUROPE: MARKET, BY IDENTITY TYPE, 2020–2023 (USD MILLION)
- TABLE 106 EUROPE: MARKET, BY IDENTITY TYPE, 2024–2029 (USD MILLION)
- TABLE 107 EUROPE: MARKET, BY NETWORK, 2020–2023 (USD MILLION)
- TABLE 108 EUROPE: MARKET, BY NETWORK, 2024–2029 (USD MILLION)
- TABLE 109 EUROPE: MARKET, BY ORGANIZATION SIZE, 2020–2023 (USD MILLION)
- TABLE 110 EUROPE: MARKET, BY ORGANIZATION SIZE, 2024–2029 (USD MILLION)
- TABLE 111 EUROPE: MARKET, BY VERTICAL, 2020–2023 (USD MILLION)
- TABLE 112 EUROPE: MARKET, BY VERTICAL, 2024–2029 (USD MILLION)
- TABLE 113 EUROPE: MARKET, BY COUNTRY, 2020–2023 (USD MILLION)
- TABLE 114 EUROPE: MARKET, BY COUNTRY, 2024–2029 (USD MILLION)
- TABLE 115 UK: MARKET, BY OFFERING, 2020–2023 (USD MILLION)
- TABLE 116 UK: MARKET, BY OFFERING, 2024–2029 (USD MILLION)
- TABLE 117 UK: MARKET, BY IDENTITY TYPE, 2020–2023 (USD MILLION)
- TABLE 118 UK: MARKET, BY IDENTITY TYPE, 2024–2029 (USD MILLION)
- TABLE 119 UK: MARKET, BY NETWORK, 2020–2023 (USD MILLION)
- TABLE 120 UK: MARKET, BY NETWORK, 2024–2029 (USD MILLION)
- TABLE 121 UK: MARKET, BY ORGANIZATION SIZE, 2020–2023 (USD MILLION)
- TABLE 122 UK: MARKET, BY ORGANIZATION SIZE, 2024–2029 (USD MILLION)
- TABLE 123 UK: MARKET, BY VERTICAL, 2020–2023 (USD MILLION)
- TABLE 124 UK: MARKET, BY VERTICAL, 2024–2029 (USD MILLION)
- TABLE 125 GERMANY: MARKET, BY OFFERING, 2020–2023 (USD MILLION)
- TABLE 126 GERMANY: MARKET, BY OFFERING, 2024–2029 (USD MILLION)
- TABLE 127 GERMANY: MARKET, BY IDENTITY TYPE, 2020–2023 (USD MILLION)
- TABLE 128 GERMANY: MARKET, BY IDENTITY TYPE, 2024–2029 (USD MILLION)
- TABLE 129 GERMANY: MARKET, BY NETWORK, 2020–2023 (USD MILLION)
- TABLE 130 GERMANY: MARKET, BY NETWORK, 2024–2029 (USD MILLION)
- TABLE 131 GERMANY: MARKET, BY ORGANIZATION SIZE, 2020–2023 (USD MILLION)
- TABLE 132 GERMANY: MARKET, BY ORGANIZATION SIZE, 2024–2029 (USD MILLION)
- TABLE 133 GERMANY: MARKET, BY VERTICAL, 2020–2023 (USD MILLION)
- TABLE 134 GERMANY: MARKET, BY VERTICAL, 2024–2029 (USD MILLION)
- TABLE 135 FRANCE: MARKET, BY OFFERING, 2020–2023 (USD MILLION)
- TABLE 136 FRANCE: MARKET, BY OFFERING, 2024–2029 (USD MILLION)
- TABLE 137 FRANCE: MARKET, BY IDENTITY TYPE, 2020–2023 (USD MILLION)
- TABLE 138 FRANCE: MARKET, BY IDENTITY TYPE, 2024–2029 (USD MILLION)
- TABLE 139 FRANCE: MARKET, BY NETWORK, 2020–2023 (USD MILLION)
- TABLE 140 FRANCE: MARKET, BY NETWORK, 2024–2029 (USD MILLION)
- TABLE 141 FRANCE: MARKET, BY ORGANIZATION SIZE, 2020–2023 (USD MILLION)
- TABLE 142 FRANCE: MARKET, BY ORGANIZATION SIZE, 2024–2029 (USD MILLION)
- TABLE 143 FRANCE: MARKET, BY VERTICAL, 2020–2023 (USD MILLION)
- TABLE 144 FRANCE: MARKET, BY VERTICAL, 2024–2029 (USD MILLION)
- TABLE 145 ITALY: MARKET, BY OFFERING, 2020–2023 (USD MILLION)
- TABLE 146 ITALY: MARKET, BY OFFERING, 2024–2029 (USD MILLION)
- TABLE 147 ITALY: MARKET, BY IDENTITY TYPE, 2020–2023 (USD MILLION)
- TABLE 148 ITALY: MARKET, BY IDENTITY TYPE, 2024–2029 (USD MILLION)
- TABLE 149 ITALY: MARKET, BY NETWORK, 2020–2023 (USD MILLION)
- TABLE 150 ITALY: MARKET, BY NETWORK, 2024–2029 (USD MILLION)
- TABLE 151 ITALY: MARKET, BY ORGANIZATION SIZE, 2020–2023 (USD MILLION)
- TABLE 152 ITALY: MARKET, BY ORGANIZATION SIZE, 2024–2029 (USD MILLION)
- TABLE 153 ITALY: MARKET, BY VERTICAL, 2020–2023 (USD MILLION)
- TABLE 154 ITALY: MARKET, BY VERTICAL, 2024–2029 (USD MILLION)
- TABLE 155 REST OF EUROPE: MARKET, BY OFFERING, 2020–2023 (USD MILLION)
- TABLE 156 REST OF EUROPE: MARKET, BY OFFERING, 2024–2029 (USD MILLION)
- TABLE 157 REST OF EUROPE: MARKET, BY IDENTITY TYPE, 2020–2023 (USD MILLION)
- TABLE 158 REST OF EUROPE: MARKET, BY IDENTITY TYPE, 2024–2029 (USD MILLION)
- TABLE 159 REST OF EUROPE: MARKET, BY NETWORK, 2020–2023 (USD MILLION)
- TABLE 160 REST OF EUROPE: MARKET, BY NETWORK, 2024–2029 (USD MILLION)
- TABLE 161 REST OF EUROPE: MARKET, BY ORGANIZATION SIZE, 2020–2023 (USD MILLION)
- TABLE 162 REST OF EUROPE: MARKET, BY ORGANIZATION SIZE, 2024–2029 (USD MILLION)
- TABLE 163 REST OF EUROPE: MARKET, BY VERTICAL, 2020–2023 (USD MILLION)
- TABLE 164 REST OF EUROPE: MARKET, BY VERTICAL, 2024–2029 (USD MILLION)
- TABLE 165 ASIA PACIFIC: MARKET, BY OFFERING, 2020–2023 (USD MILLION)
- TABLE 166 ASIA PACIFIC: MARKET, BY OFFERING, 2024–2029 (USD MILLION)
- TABLE 167 ASIA PACIFIC: MARKET, BY IDENTITY TYPE, 2020–2023 (USD MILLION)
- TABLE 168 ASIA PACIFIC: MARKET, BY IDENTITY TYPE, 2024–2029 (USD MILLION)
- TABLE 169 ASIA PACIFIC: MARKET, BY NETWORK, 2020–2023 (USD MILLION)
- TABLE 170 ASIA PACIFIC: MARKET, BY NETWORK, 2024–2029 (USD MILLION)
- TABLE 171 ASIA PACIFIC: MARKET, BY ORGANIZATION SIZE, 2020–2023 (USD MILLION)
- TABLE 172 ASIA PACIFIC: MARKET, BY ORGANIZATION SIZE, 2024–2029 (USD MILLION)
- TABLE 173 ASIA PACIFIC: MARKET, BY VERTICAL, 2020–2023 (USD MILLION)
- TABLE 174 ASIA PACIFIC: MARKET, BY VERTICAL, 2024–2029 (USD MILLION)
- TABLE 175 ASIA PACIFIC: MARKET, BY COUNTRY, 2020–2023 (USD MILLION)
- TABLE 176 ASIA PACIFIC: MARKET, BY COUNTRY, 2024–2029 (USD MILLION)
- TABLE 177 CHINA: MARKET, BY OFFERING, 2020–2023 (USD MILLION)
- TABLE 178 CHINA: MARKET, BY OFFERING, 2024–2029 (USD MILLION)
- TABLE 179 CHINA: MARKET, BY IDENTITY TYPE, 2020–2023 (USD MILLION)
- TABLE 180 CHINA: MARKET, BY IDENTITY TYPE, 2024–2029 (USD MILLION)
- TABLE 181 CHINA: MARKET, BY NETWORK, 2020–2023 (USD MILLION)
- TABLE 182 CHINA: MARKET, BY NETWORK, 2024–2029 (USD MILLION)
- TABLE 183 CHINA: MARKET, BY ORGANIZATION SIZE, 2020–2023 (USD MILLION)
- TABLE 184 CHINA: MARKET, BY ORGANIZATION SIZE, 2024–2029 (USD MILLION)
- TABLE 185 CHINA: MARKET, BY VERTICAL, 2020–2023 (USD MILLION)
- TABLE 186 CHINA: MARKET, BY VERTICAL, 2024–2029 (USD MILLION)
- TABLE 187 JAPAN: MARKET, BY OFFERING, 2020–2023 (USD MILLION)
- TABLE 188 JAPAN: MARKET, BY OFFERING, 2024–2029 (USD MILLION)
- TABLE 189 JAPAN: MARKET, BY IDENTITY TYPE, 2020–2023 (USD MILLION)
- TABLE 190 JAPAN: MARKET, BY IDENTITY TYPE, 2024–2029 (USD MILLION)
- TABLE 191 JAPAN: MARKET, BY NETWORK, 2020–2023 (USD MILLION)
- TABLE 192 JAPAN: MARKET, BY NETWORK, 2024–2029 (USD MILLION)
- TABLE 193 JAPAN: MARKET, BY ORGANIZATION SIZE, 2020–2023 (USD MILLION)
- TABLE 194 JAPAN: MARKET, BY ORGANIZATION SIZE, 2024–2029 (USD MILLION)
- TABLE 195 JAPAN: MARKET, BY VERTICAL, 2020–2023 (USD MILLION)
- TABLE 196 JAPAN: MARKET, BY VERTICAL, 2024–2029 (USD MILLION)
- TABLE 197 INDIA: MARKET, BY OFFERING, 2020–2023 (USD MILLION)
- TABLE 198 INDIA: MARKET, BY OFFERING, 2024–2029 (USD MILLION)
- TABLE 199 INDIA: MARKET, BY IDENTITY TYPE, 2020–2023 (USD MILLION)
- TABLE 200 INDIA: MARKET, BY IDENTITY TYPE, 2024–2029 (USD MILLION)
- TABLE 201 INDIA: MARKET, BY NETWORK, 2020–2023 (USD MILLION)
- TABLE 202 INDIA: MARKET, BY NETWORK, 2024–2029 (USD MILLION)
- TABLE 203 INDIA: MARKET, BY ORGANIZATION SIZE, 2020–2023 (USD MILLION)
- TABLE 204 INDIA: MARKET, BY ORGANIZATION SIZE, 2024–2029 (USD MILLION)
- TABLE 205 INDIA: MARKET, BY VERTICAL, 2020–2023 (USD MILLION)
- TABLE 206 INDIA: MARKET, BY VERTICAL, 2024–2029 (USD MILLION)
- TABLE 207 SINGAPORE: MARKET, BY OFFERING, 2020–2023 (USD MILLION)
- TABLE 208 SINGAPORE: MARKET, BY OFFERING, 2024–2029 (USD MILLION)
- TABLE 209 SINGAPORE: MARKET, BY IDENTITY TYPE, 2020–2023 (USD MILLION)
- TABLE 210 SINGAPORE: MARKET, BY IDENTITY TYPE, 2024–2029 (USD MILLION)
- TABLE 211 SINGAPORE: MARKET, BY NETWORK, 2020–2023 (USD MILLION)
- TABLE 212 SINGAPORE: MARKET, BY NETWORK, 2024–2029 (USD MILLION)
- TABLE 213 SINGAPORE: MARKET, BY ORGANIZATION SIZE, 2020–2023 (USD MILLION)
- TABLE 214 SINGAPORE: MARKET, BY ORGANIZATION SIZE, 2024–2029 (USD MILLION)
- TABLE 215 SINGAPORE: MARKET, BY VERTICAL, 2020–2023 (USD MILLION)
- TABLE 216 SINGAPORE: MARKET, BY VERTICAL, 2024–2029 (USD MILLION)
- TABLE 217 REST OF APAC: MARKET, BY OFFERING, 2020–2023 (USD MILLION)
- TABLE 218 REST OF APAC: MARKET, BY OFFERING, 2024–2029 (USD MILLION)
- TABLE 219 REST OF APAC: MARKET, BY IDENTITY TYPE, 2020–2023 (USD MILLION)
- TABLE 220 REST OF APAC: MARKET, BY IDENTITY TYPE, 2024–2029 (USD MILLION)
- TABLE 221 REST OF APAC: MARKET, BY NETWORK, 2020–2023 (USD MILLION)
- TABLE 222 REST OF APAC: MARKET, BY NETWORK, 2024–2029 (USD MILLION)
- TABLE 223 REST OF APAC: MARKET, BY ORGANIZATION SIZE, 2020–2023 (USD MILLION)
- TABLE 224 REST OF APAC: MARKET, BY ORGANIZATION SIZE, 2024–2029 (USD MILLION)
- TABLE 225 REST OF APAC: MARKET, BY VERTICAL, 2020–2023 (USD MILLION)
- TABLE 226 REST OF APAC: MARKET, BY VERTICAL, 2024–2029 (USD MILLION)
- TABLE 227 MIDDLE EAST & AFRICA: MARKET, BY OFFERING, 2020–2023 (USD MILLION)
- TABLE 228 MIDDLE EAST & AFRICA: MARKET, BY OFFERING, 2024–2029 (USD MILLION)
- TABLE 229 MIDDLE EAST & AFRICA: MARKET, BY IDENTITY TYPE, 2020–2023 (USD MILLION)
- TABLE 230 MIDDLE EAST & AFRICA: MARKET, BY IDENTITY TYPE, 2024–2029 (USD MILLION)
- TABLE 231 MIDDLE EAST & AFRICA: MARKET, BY NETWORK, 2020–2023 (USD MILLION)
- TABLE 232 MIDDLE EAST & AFRICA: MARKET, BY NETWORK, 2024–2029 (USD MILLION)
- TABLE 233 MIDDLE EAST & AFRICA: MARKET, BY ORGANIZATION SIZE, 2020–2023 (USD MILLION)
- TABLE 234 MIDDLE EAST & AFRICA: MARKET, BY ORGANIZATION SIZE, 2024–2029 (USD MILLION)
- TABLE 235 MIDDLE EAST & AFRICA: MARKET, BY VERTICAL, 2020–2023 (USD MILLION)
- TABLE 236 MIDDLE EAST & AFRICA: MARKET, BY VERTICAL, 2024–2029 (USD MILLION)
- TABLE 237 MIDDLE EAST & AFRICA: MARKET, BY REGION/COUNTRY, 2020–2023 (USD MILLION)
- TABLE 238 MIDDLE EAST & AFRICA: MARKET, BY REGION/COUNTRY, 2024–2029 (USD MILLION)
- TABLE 239 GCC: MARKET, BY OFFERING, 2020–2023 (USD MILLION)
- TABLE 240 GCC: MARKET, BY OFFERING, 2024–2029 (USD MILLION)
- TABLE 241 GCC: MARKET, BY IDENTITY TYPE, 2020–2023 (USD MILLION)
- TABLE 242 GCC: MARKET, BY IDENTITY TYPE, 2024–2029 (USD MILLION)
- TABLE 243 GCC: MARKET, BY NETWORK, 2020–2023 (USD MILLION)
- TABLE 244 GCC: MARKET, BY NETWORK, 2024–2029 (USD MILLION)
- TABLE 245 GCC: MARKET, BY ORGANIZATION SIZE, 2020–2023 (USD MILLION)
- TABLE 246 GCC: MARKET, BY ORGANIZATION SIZE, 2024–2029 (USD MILLION)
- TABLE 247 GCC: MARKET, BY VERTICAL, 2020–2023 (USD MILLION)
- TABLE 248 GCC: MARKET, BY VERTICAL, 2024–2029 (USD MILLION)
- TABLE 249 GCC: MARKET, BY COUNTRY, 2020–2023 (USD MILLION)
- TABLE 250 GCC: MARKET, BY COUNTRY, 2024–2029 (USD MILLION)
- TABLE 251 KSA: MARKET, BY OFFERING, 2020–2023 (USD MILLION)
- TABLE 252 KSA: MARKET, BY OFFERING, 2024–2029 (USD MILLION)
- TABLE 253 KSA: MARKET, BY IDENTITY TYPE, 2020–2023 (USD MILLION)
- TABLE 254 KSA: MARKET, BY IDENTITY TYPE, 2024–2029 (USD MILLION)
- TABLE 255 KSA: MARKET, BY NETWORK, 2020–2023 (USD MILLION)
- TABLE 256 KSA: MARKET, BY NETWORK, 2024–2029 (USD MILLION)
- TABLE 257 KSA: MARKET, BY ORGANIZATION SIZE, 2020–2023 (USD MILLION)
- TABLE 258 KSA: MARKET, BY ORGANIZATION SIZE, 2024–2029 (USD MILLION)
- TABLE 259 KSA: MARKET, BY VERTICAL, 2020–2023 (USD MILLION)
- TABLE 260 KSA: MARKET, BY VERTICAL, 2024–2029 (USD MILLION)
- TABLE 261 UAE: MARKET, BY OFFERING, 2020–2023 (USD MILLION)
- TABLE 262 UAE: MARKET, BY OFFERING, 2024–2029 (USD MILLION)
- TABLE 263 UAE: MARKET, BY IDENTITY TYPE, 2020–2023 (USD MILLION)
- TABLE 264 UAE: MARKET, BY IDENTITY TYPE, 2024–2029 (USD MILLION)
- TABLE 265 UAE: MARKET, BY NETWORK, 2020–2023 (USD MILLION)
- TABLE 266 UAE: MARKET, BY NETWORK, 2024–2029 (USD MILLION)
- TABLE 267 UAE: MARKET, BY ORGANIZATION SIZE, 2020–2023 (USD MILLION)
- TABLE 268 UAE: MARKET, BY ORGANIZATION SIZE, 2024–2029 (USD MILLION)
- TABLE 269 UAE: MARKET, BY VERTICAL, 2020–2023 (USD MILLION)
- TABLE 270 UAE: MARKET, BY VERTICAL, 2024–2029 (USD MILLION)
- TABLE 271 REST OF GCC COUNTRIES: MARKET, BY OFFERING, 2020–2023 (USD MILLION)
- TABLE 272 REST OF GCC COUNTRIES: MARKET, BY OFFERING, 2024–2029 (USD MILLION)
- TABLE 273 REST OF GCC COUNTRIES: MARKET, BY IDENTITY TYPE, 2020–2023 (USD MILLION)
- TABLE 274 REST OF GCC COUNTRIES: MARKET, BY IDENTITY TYPE, 2024–2029 (USD MILLION)
- TABLE 275 REST OF GCC COUNTRIES: MARKET, BY NETWORK, 2020–2023 (USD MILLION)
- TABLE 276 REST OF GCC COUNTRIES: MARKET, BY NETWORK, 2024–2029 (USD MILLION)
- TABLE 277 REST OF GCC COUNTRIES: MARKET, BY ORGANIZATION SIZE, 2020–2023 (USD MILLION)
- TABLE 278 REST OF GCC COUNTRIES: MARKET, BY ORGANIZATION SIZE, 2024–2029 (USD MILLION)
- TABLE 279 REST OF GCC COUNTRIES: MARKET, BY VERTICAL, 2020–2023 (USD MILLION)
- TABLE 280 REST OF GCC COUNTRIES: MARKET, BY VERTICAL, 2024–2029 (USD MILLION)
- TABLE 281 SOUTH AFRICA: MARKET, BY OFFERING, 2020–2023 (USD MILLION)
- TABLE 282 SOUTH AFRICA: MARKET, BY OFFERING, 2024–2029 (USD MILLION)
- TABLE 283 SOUTH AFRICA: MARKET, BY IDENTITY TYPE, 2020–2023 (USD MILLION)
- TABLE 284 SOUTH AFRICA: MARKET, BY IDENTITY TYPE, 2024–2029 (USD MILLION)
- TABLE 285 SOUTH AFRICA: MARKET, BY NETWORK, 2020–2023 (USD MILLION)
- TABLE 286 SOUTH AFRICA: MARKET, BY NETWORK, 2024–2029 (USD MILLION)
- TABLE 287 SOUTH AFRICA: MARKET, BY ORGANIZATION SIZE, 2020–2023 (USD MILLION)
- TABLE 288 SOUTH AFRICA: MARKET, BY ORGANIZATION SIZE, 2024–2029 (USD MILLION)
- TABLE 289 SOUTH AFRICA: MARKET, BY VERTICAL, 2020–2023 (USD MILLION)
- TABLE 290 SOUTH AFRICA: MARKET, BY VERTICAL, 2024–2029 (USD MILLION)
- TABLE 291 REST OF MIDDLE EAST & AFRICA: MARKET, BY OFFERING, 2020–2023 (USD MILLION)
- TABLE 292 REST OF MIDDLE EAST & AFRICA: MARKET, BY OFFERING, 2024–2029 (USD MILLION)
- TABLE 293 REST OF MIDDLE EAST & AFRICA: MARKET, BY IDENTITY TYPE, 2020–2023 (USD MILLION)
- TABLE 294 REST OF MIDDLE EAST & AFRICA: MARKET, BY IDENTITY TYPE, 2024–2029 (USD MILLION)
- TABLE 295 REST OF MIDDLE EAST & AFRICA: MARKET, BY NETWORK, 2020–2023 (USD MILLION)
- TABLE 296 REST OF MIDDLE EAST & AFRICA: MARKET, BY NETWORK, 2024–2029 (USD MILLION)
- TABLE 297 REST OF MIDDLE EAST & AFRICA: MARKET, BY ORGANIZATION SIZE, 2020–2023 (USD MILLION)
- TABLE 298 REST OF MIDDLE EAST & AFRICA: MARKET, BY ORGANIZATION SIZE, 2024–2029 (USD MILLION)
- TABLE 299 REST OF MIDDLE EAST & AFRICA: MARKET, BY VERTICAL, 2020–2023 (USD MILLION)
- TABLE 300 REST OF MIDDLE EAST & AFRICA: MARKET, BY VERTICAL, 2024–2029 (USD MILLION)
- TABLE 301 LATIN AMERICA: MARKET, BY OFFERING, 2020–2023 (USD MILLION)
- TABLE 302 LATIN AMERICA: MARKET, BY OFFERING, 2024–2029 (USD MILLION)
- TABLE 303 LATIN AMERICA: MARKET, BY IDENTITY TYPE, 2020–2023 (USD MILLION)
- TABLE 304 LATIN AMERICA: MARKET, BY IDENTITY TYPE, 2024–2029 (USD MILLION)
- TABLE 305 LATIN AMERICA: MARKET, BY NETWORK, 2020–2023 (USD MILLION)
- TABLE 306 LATIN AMERICA: MARKET, BY NETWORK, 2024–2029 (USD MILLION)
- TABLE 307 LATIN AMERICA: MARKET, BY ORGANIZATION SIZE, 2020–2023 (USD MILLION)
- TABLE 308 LATIN AMERICA: MARKET, BY ORGANIZATION SIZE, 2024–2029 (USD MILLION)
- TABLE 309 LATIN AMERICA: MARKET, BY VERTICAL, 2020–2023 (USD MILLION)
- TABLE 310 LATIN AMERICA: MARKET, BY VERTICAL, 2024–2029 (USD MILLION)
- TABLE 311 LATIN AMERICA: MARKET, BY COUNTRY, 2020–2023 (USD MILLION)
- TABLE 312 LATIN AMERICA: MARKET, BY COUNTRY, 2024–2029 (USD MILLION)
- TABLE 313 BRAZIL: MARKET, BY OFFERING, 2020–2023 (USD MILLION)
- TABLE 314 BRAZIL: MARKET, BY OFFERING, 2024–2029 (USD MILLION)
- TABLE 315 BRAZIL: MARKET, BY IDENTITY TYPE, 2020–2023 (USD MILLION)
- TABLE 316 BRAZIL: MARKET, BY IDENTITY TYPE, 2024–2029 (USD MILLION)
- TABLE 317 BRAZIL: MARKET, BY NETWORK, 2020–2023 (USD MILLION)
- TABLE 318 BRAZIL: MARKET, BY NETWORK, 2024–2029 (USD MILLION)
- TABLE 319 BRAZIL: MARKET, BY ORGANIZATION SIZE, 2020–2023 (USD MILLION)
- TABLE 320 BRAZIL: MARKET, BY ORGANIZATION SIZE, 2024–2029 (USD MILLION)
- TABLE 321 BRAZIL: MARKET, BY VERTICAL, 2020–2023 (USD MILLION)
- TABLE 322 BRAZIL: MARKET, BY VERTICAL, 2024–2029 (USD MILLION)
- TABLE 323 MEXICO: MARKET, BY OFFERING, 2020–2023 (USD MILLION)
- TABLE 324 MEXICO: MARKET, BY OFFERING, 2024–2029 (USD MILLION)
- TABLE 325 MEXICO: MARKET, BY IDENTITY TYPE, 2020–2023 (USD MILLION)
- TABLE 326 MEXICO: MARKET, BY IDENTITY TYPE, 2024–2029 (USD MILLION)
- TABLE 327 MEXICO: MARKET, BY NETWORK, 2020–2023 (USD MILLION)
- TABLE 328 MEXICO: MARKET, BY NETWORK, 2024–2029 (USD MILLION)
- TABLE 329 MEXICO: MARKET, BY ORGANIZATION SIZE, 2020–2023 (USD MILLION)
- TABLE 330 MEXICO: MARKET, BY ORGANIZATION SIZE, 2024–2029 (USD MILLION)
- TABLE 331 MEXICO: MARKET, BY VERTICAL, 2020–2023 (USD MILLION)
- TABLE 332 MEXICO: MARKET, BY VERTICAL, 2024–2029 (USD MILLION)
- TABLE 333 REST OF LATIN AMERICA: MARKET, BY OFFERING, 2020–2023 (USD MILLION)
- TABLE 334 REST OF LATIN AMERICA: MARKET, BY OFFERING, 2024–2029 (USD MILLION)
- TABLE 335 REST OF LATIN AMERICA: MARKET, BY IDENTITY TYPE, 2020–2023 (USD MILLION)
- TABLE 336 REST OF LATIN AMERICA: MARKET, BY IDENTITY TYPE, 2024–2029 (USD MILLION)
- TABLE 337 REST OF LATIN AMERICA: MARKET, BY NETWORK, 2020–2023 (USD MILLION)
- TABLE 338 REST OF LATIN AMERICA: MARKET, BY NETWORK, 2024–2029 (USD MILLION)
- TABLE 339 REST OF LATIN AMERICA: MARKET, BY ORGANIZATION SIZE, 2020–2023 (USD MILLION)
- TABLE 340 REST OF LATIN AMERICA: MARKET, BY ORGANIZATION SIZE, 2024–2029 (USD MILLION)
- TABLE 341 REST OF LATIN AMERICA: SELF-SOVEREIGN IDENTITY MARKET, BY VERTICAL, 2020–2023 (USD MILLION)
- TABLE 342 REST OF LATIN AMERICA: SELF-SOVEREIGN IDENTITY MARKET, BY VERTICAL, 2024–2029 (USD MILLION)
- TABLE 343 SELF-SOVEREIGN IDENTITY MARKET: DEGREE OF COMPETITION
- TABLE 344 COMPANY OFFERING FOOTPRINT
- TABLE 345 COMPANY VERTICAL FOOTPRINT
- TABLE 346 COMPANY REGION FOOTPRINT
- TABLE 347 DETAILED LIST OF KEY STARTUPS/SMES
- TABLE 348 SELF-SOVEREIGN IDENTITY MARKET: STARTUP/SME VERTICAL FOOTPRINT
- TABLE 349 SELF-SOVEREIGN IDENTITY MARKET: PRODUCT/SOLUTION/SERVICE LAUNCHES, MAY 2022–MARCH 2023
- TABLE 350 SELF-SOVEREIGN IDENTITY MARKET: DEALS, JUNE 2022–DECEMBER 2023
- TABLE 351 MICROSOFT: COMPANY OVERVIEW
- TABLE 352 MICROSOFT: PRODUCTS/SOLUTIONS/SERVICES OFFERED
- TABLE 353 MICROSOFT: PRODUCT LAUNCHES
- TABLE 354 MICROSOFT: DEALS
- TABLE 355 IDEX BIOMETRICS: COMPANY OVERVIEW
- TABLE 356 IDEX BIOMETRICS: PRODUCTS/SOLUTIONS/SERVICES OFFERED
- TABLE 357 IDEX BIOMETRICS: DEALS
- TABLE 358 NEC: COMPANY OVERVIEW
- TABLE 359 NEC: PRODUCTS/SOLUTIONS/SERVICES OFFERED
- TABLE 360 IMAGEWARE: COMPANY OVERVIEW
- TABLE 361 IMAGEWARE: PRODUCTS/SOLUTIONS/SERVICES OFFERED
- TABLE 362 IMAGEWARE: DEALS
- TABLE 363 PING IDENTITY: COMPANY OVERVIEW
- TABLE 364 PING IDENTITY: PRODUCTS/SOLUTIONS/SERVICES OFFERED
- TABLE 365 PING IDENTITY: PRODUCT LAUNCHES
- TABLE 366 PING IDENTITY: DEALS
- TABLE 367 DOCK: COMPANY OVERVIEW
- TABLE 368 DOCK: PRODUCTS/SOLUTIONS/SERVICES OFFERED
- TABLE 369 DOCK: DEALS
- TABLE 370 WIPRO: BUSINESS OVERVIEW
- TABLE 371 WIPRO: PRODUCTS/SOLUTIONS/SERVICES OFFERED
- TABLE 372 WIPRO: PRODUCT LAUNCHES
- TABLE 373 PERSISTENT: BUSINESS OVERVIEW
- TABLE 374 PERSISTENT: PRODUCTS/SOLUTIONS/SERVICES OFFERED
- TABLE 375 INFOPULSE: BUSINESS OVERVIEW
- TABLE 376 INFOPULSE: PRODUCTS/SOLUTIONS/SERVICES OFFERED
- TABLE 377 METADIUM: COMPANY OVERVIEW
- TABLE 378 METADIUM: PRODUCTS/SOLUTIONS/SERVICES OFFERED
- TABLE 379 VALIDATED ID: COMPANY OVERVIEW
- TABLE 380 VALIDATED ID: PRODUCTS/SOLUTIONS/SERVICES OFFERED
- TABLE 381 BLOCKCHAIN HELIX: COMPANY OVERVIEW
- TABLE 382 BLOCKCHAIN HELIX: PRODUCTS/SOLUTIONS/SERVICES OFFERED
- TABLE 383 ADJACENT MARKETS AND FORECASTS
- TABLE 384 DECENTRALIZED IDENTITY MARKET, BY IDENTITY TYPE, 2019–2027 (USD MILLION)
- TABLE 385 NON-BIOMETRICS DECENTRALIZED IDENTITY MARKET, BY REGION, 2019–2027 (USD MILLION)
- TABLE 386 BIOMETRICS DECENTRALIZED IDENTITY MARKET, BY REGION, 2019–2027 (USD MILLION)
- TABLE 387 DECENTRALIZED IDENTITY MARKET, BY END USER, 2019–2027 (USD MILLION)
- TABLE 388 DECENTRALIZED IDENTITY MARKET: INDIVIDUAL, BY REGION, 2019–2027 (USD MILLION)
- TABLE 389 DECENTRALIZED IDENTITY MARKET: ENTERPRISE, BY REGION, 2019–2027 (USD MILLION)
- TABLE 390 BLOCKCHAIN IDENTITY MANAGEMENT MARKET, BY OFFERING, 2017–2022 (USD MILLION)
- TABLE 391 BLOCKCHAIN IDENTITY MANAGEMENT MARKET, BY OFFERING, 2023–2028 (USD MILLION)
- TABLE 392 SOFTWARE: BLOCKCHAIN IDENTITY MANAGEMENT MARKET, BY REGION, 2017–2022 (USD MILLION)
- TABLE 393 SOFTWARE: BLOCKCHAIN IDENTITY MANAGEMENT MARKET, BY REGION, 2023–2028 (USD MILLION)
- TABLE 394 SERVICES: BLOCKCHAIN IDENTITY MANAGEMENT MARKET, BY REGION, 2017–2022 (USD MILLION)
- TABLE 395 SERVICES: BLOCKCHAIN IDENTITY MANAGEMENT MARKET, BY REGION, 2023–2028 (USD MILLION)
- FIGURE 1 SELF-SOVEREIGN IDENTITY MARKET: RESEARCH DESIGN
- FIGURE 2 BREAKDOWN OF PRIMARY INTERVIEWS, BY COMPANY TYPE, DESIGNATION, AND REGION
- FIGURE 3 SELF-SOVEREIGN IDENTITY MARKET: DATA TRIANGULATION
- FIGURE 4 SELF-SOVEREIGN IDENTITY MARKET ESTIMATION: RESEARCH FLOW
- FIGURE 5 APPROACH 1 (SUPPLY SIDE): REVENUE FROM SOLUTIONS/SERVICES OF SELF-SOVEREIGN IDENTITY VENDORS
- FIGURE 6 APPROACH 1: SUPPLY-SIDE ANALYSIS
- FIGURE 7 MARKET SIZE ESTIMATION METHODOLOGY APPROACH 2—BOTTOM-UP (DEMAND SIDE): PRODUCTS/SOLUTIONS/SERVICES
- FIGURE 8 GLOBAL SELF-SOVEREIGN IDENTITY MARKET SIZE AND Y-O-Y GROWTH RATE
- FIGURE 9 SEGMENTS WITH SIGNIFICANT MARKET SHARES AND GROWTH RATES
- FIGURE 10 NORTH AMERICA TO ACCOUNT FOR LARGEST SHARE IN 2024
- FIGURE 11 INCREASING INSTANCES OF IDENTITY FRAUD, RISING STRINGENT REGULATIONS, AND GROWING ADOPTION OF BIOMETRIC SSI TRENDS TO DRIVE MARKET GROWTH
- FIGURE 12 SOLUTIONS SEGMENT TO ACCOUNT FOR LARGER MARKET SHARE DURING FORECAST PERIOD
- FIGURE 13 BIOMETRICS SEGMENT TO ACCOUNT FOR LARGER MARKET SHARE IN 2024
- FIGURE 14 LARGE ENTERPRISES SEGMENT TO ACCOUNT FOR LARGER MARKET SHARE IN 2024
- FIGURE 15 BFSI SEGMENT AND NORTH AMERICA TO ACCOUNT FOR SIGNIFICANT SHARE IN 2024
- FIGURE 16 ASIA PACIFIC TO EMERGE AS LUCRATIVE MARKET FOR INVESTMENTS IN NEXT FIVE YEARS
- FIGURE 17 DRIVERS, RESTRAINTS, OPPORTUNITIES, AND CHALLENGES: SELF-SOVEREIGN IDENTITY MARKET
- FIGURE 18 COUNTRIES VULNERABLE TO IDENTITY FRAUD
- FIGURE 19 SELF-SOVEREIGN IDENTITY (SSI) MARKET: VALUE CHAIN ANALYSIS
- FIGURE 20 SELF-SOVEREIGN IDENTITY (SSI) MARKET: ECOSYSTEM
- FIGURE 21 PORTER’S FIVE FORCES ANALYSIS: SELF-SOVEREIGN IDENTITY (SSI) MARKET
- FIGURE 22 NUMBER OF PATENTS GRANTED FOR SELF-SOVEREIGN IDENTITY (SSI) MARKET, 2014–2024
- FIGURE 23 REGIONAL ANALYSIS OF PATENTS GRANTED FOR SELF-SOVEREIGN IDENTITY (SSI) MARKET
- FIGURE 24 IMPORT DATA, BY KEY COUNTRY, 2018–2022 (USD MILLION)
- FIGURE 25 EXPORT DATA, BY KEY COUNTRY, 2018–2022 (USD MILLION)
- FIGURE 26 REVENUE SHIFT FOR SELF-SOVEREIGN IDENTITY (SSI) MARKET VENDORS
- FIGURE 27 INFLUENCE OF STAKEHOLDERS ON BUYING PROCESS FOR TOP THREE VERTICALS
- FIGURE 28 KEY BUYING CRITERIA FOR TOP THREE VERTICALS
- FIGURE 29 LEADING GLOBAL SELF-SOVEREIGN IDENTITY (SSI) STARTUPS AND SMES: NUMBER OF INVESTORS AND FUNDING ROUNDS, 2023
- FIGURE 30 EVOLUTION OF DIGITAL IDENTITY MODELS
- FIGURE 31 SERVICES SEGMENT TO RECORD HIGHER GROWTH RATE DURING FORECAST PERIOD
- FIGURE 32 BIOMETRICS TO ACCOUNT FOR LARGER MARKET SIZE DURING FORECAST PERIOD
- FIGURE 33 PERMISSIONLESS NETWORK SEGMENT TO GROW AT HIGHER CAGR DURING FORECAST PERIOD
- FIGURE 34 SMES SEGMENT TO GROW AT HIGHER CAGR DURING FORECAST PERIOD
- FIGURE 35 BFSI VERTICAL TO DOMINATE MARKET DURING FORECAST PERIOD
- FIGURE 36 ASIA PACIFIC TO GROW AT HIGHEST CAGR DURING FORECAST PERIOD
- FIGURE 37 NORTH AMERICA: SELF-SOVEREIGN IDENTITY MARKET SNAPSHOT
- FIGURE 38 ASIA PACIFIC: SELF-SOVEREIGN IDENTITY MARKET SNAPSHOT
- FIGURE 39 SELF-SOVEREIGN IDENTITY MARKET: BRAND COMPARISON
- FIGURE 40 SELF-SOVEREIGN IDENTITY MARKET: COMPANY EVALUATION AND FINANCIAL METRICS
- FIGURE 41 SEGMENTAL REVENUE ANALYSIS OF TOP FIVE MARKET PLAYERS, 2020–2023 (USD MILLION)
- FIGURE 42 SHARE OF LEADING COMPANIES IN IDENTITY VERIFICATION MARKET
- FIGURE 43 RANKING OF TOP 5 PLAYERS
- FIGURE 44 COMPANY EVALUATION MATRIX: KEY PLAYERS, 2023
- FIGURE 45 OVERALL COMPANY FOOTPRINT
- FIGURE 46 COMPANY EVALUATION MATRIX: STARTUPS/SMES, 2023
- FIGURE 47 MICROSOFT: COMPANY SNAPSHOT
- FIGURE 48 IDEX BIOMETRICS: COMPANY SNAPSHOT
- FIGURE 49 NEC: COMPANY SNAPSHOT
- FIGURE 50 WIPRO: COMPANY SNAPSHOT
- FIGURE 51 PERSISTENT: COMPANY SNAPSHOT
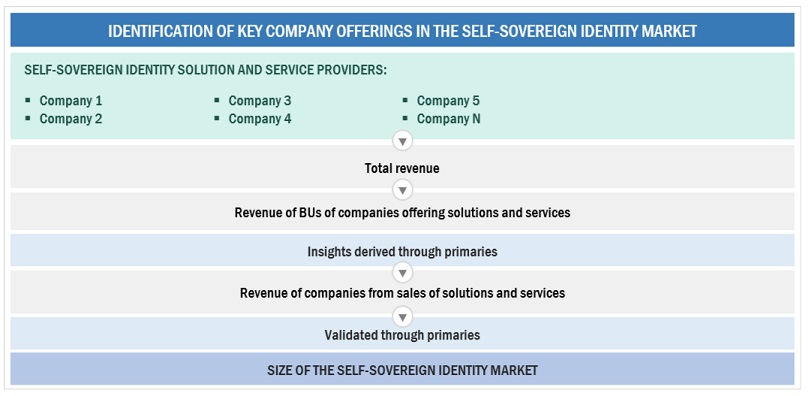
The study involved significant activities in estimating the current market size for the self-sovereign identity market. Exhaustive secondary research was done to collect information on the self-sovereign identity industry. The next step was to validate these findings, assumptions, and sizing with industry experts across the value chain using primary research. Different approaches, such as top-down and bottom-up, were employed to estimate the total market size. After that, the market breakup and data triangulation procedures were used to estimate the market size of the segments and subsegments of the self-sovereign identity market.
Secondary Research
The market for the companies offering self-sovereign identity solutions and services is arrived at by secondary data available through paid and unpaid sources, analyzing the product portfolios of the major companies in the ecosystem, and rating the companies by their performance and quality. Various sources were referred to in the secondary research process to identify and collect information for this study. The secondary sources include annual reports, press releases, investor presentations of companies, white papers, journals, certified publications, and articles from recognized authors, directories, and databases.
In the secondary research process, various secondary sources were referred to identify and collect information related to the study. Secondary sources included annual reports, press releases, and investor presentations of self-sovereign identity vendors, forums, certified publications, and whitepapers. The secondary research was used to obtain critical information on the industry's value chain, the total pool of key players, market classification, and segmentation from the market and technology-oriented perspectives.
Primary Research
In the primary research process, various supply and demand sources were interviewed to obtain qualitative and quantitative information for this report. The primary sources from the supply side included industry experts, such as Chief Executive Officers (CEOs), Vice Presidents (VPs), marketing directors, technology and innovation directors, and related key executives from various key companies and organizations operating in the self-sovereign identity market.
After the complete market engineering (calculations for market statistics, market breakdown, market size estimations, market forecasting, and data triangulation), extensive primary research was conducted to gather information and verify and validate the critical numbers arrived at. Primary research was also undertaken to identify the segmentation types, industry trends, competitive landscape of self-sovereign identity solutions offered by various market players, and fundamental market dynamics, such as drivers, restraints, opportunities, challenges, industry trends, and key player strategies.
In the complete market engineering process, the top-down and bottom-up approaches and several data triangulation methods were extensively used to perform the market estimation and market forecasting for the overall market segments and subsegments listed in this report. Extensive qualitative and quantitative analysis was performed on the complete market engineering process to list the key information/insights throughout the report.
Following is the breakup of the primary study:
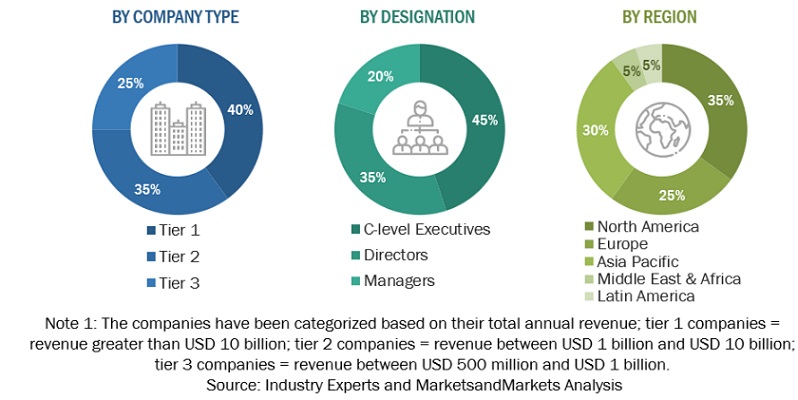
To know about the assumptions considered for the study, download the pdf brochure
Market Size Estimation
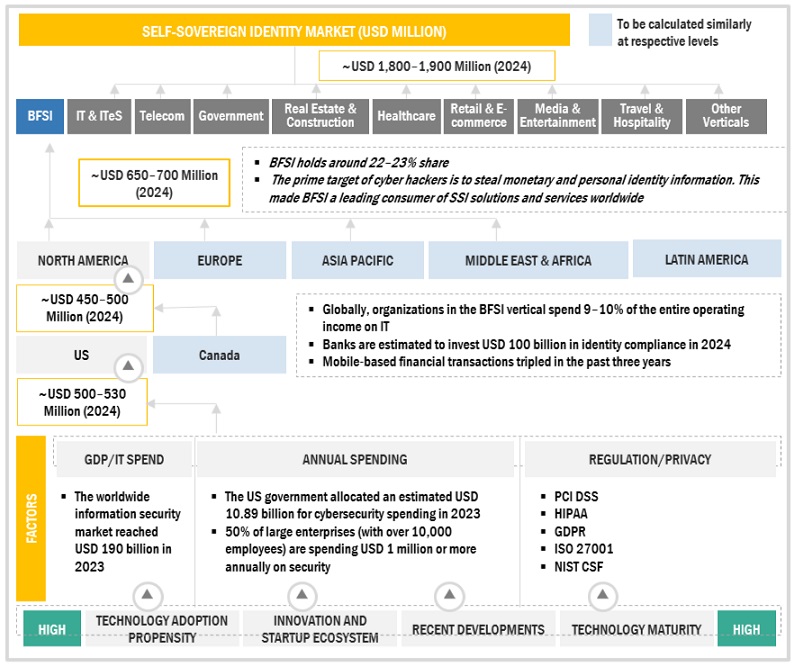
Top-down and bottom-up approaches were used to estimate and validate the size of the global self-sovereign identity market and the size of various other dependent sub-segments in the overall self-sovereign identity market. The research methodology used to estimate the market size includes the following details: critical players in the market were identified through secondary research, and their market shares in the respective regions were determined through primary and secondary research. This entire procedure included the study of the annual and financial reports of the top market players, and extensive interviews were conducted for key insights from the industry leaders, such as CEOs, VPs, directors, and marketing executives.
All percentage splits and breakdowns were determined using secondary sources and verified through primary sources. All possible parameters that affect the market covered in this research study have been accounted for, viewed in extensive detail, verified through primary research, and analyzed to get the final quantitative and qualitative data. This data is consolidated and added to detailed inputs and analysis from MarketsandMarkets.
Infographic Depicting Bottom-Up And Top-Down Approaches
To know about the assumptions considered for the study, Request for Free Sample Report
Data Triangulation
The market was split into several segments and subsegments after arriving at the overall market size using the market size estimation processes explained above. The data triangulation and market breakup procedures were employed, wherever applicable, to complete the overall market engineering process and arrive at the exact statistics of each market segment and subsegment. The data was triangulated by studying various factors and trends from both the demand and supply sides.
Market Definition
Self-sovereign identity (SSI) refers to a digital framework that emphasizes individual ownership and control over one's identity information, free from the oversight of centralized authorities. In an SSI system, individuals manage their identity credentials digitally, enabling them to selectively disclose relevant information to different parties without relying on intermediaries. This approach empowers users to assert their identities with greater autonomy and security, akin to physical interactions.
Key Stakeholders
- Government agencies
- Consulting firms
- Information Technology (IT) security agencies
- Raw material/Component suppliers
- Research organizations and consulting companies
- Government bodies, such as regulating authorities and policymakers
-
Venture capitalists and private equity firms
- Chief technology and data officers
- SSI service professionals
- SSI foundations
- Business analysts
- Information Technology (IT) professionals
- Consultants/Consultancies/Advisory firms
Report Objectives
- To define, describe, and forecast the self-sovereign identity market based on - offering, identity type, network, organization size, vertical, and region.
- To define, describe, and forecast the self-sovereign identity market by – offering, identity type, network, organization size, vertical, and region.
- To forecast the market size of five main regions: North America, Europe, Asia Pacific (APAC), Middle East & Africa (MEA), and Latin America
- To analyze the subsegments of the market concerning individual growth trends, prospects, and contributions to the overall market.
- To provide detailed information on the major factors (drivers, restraints, opportunities, and challenges) influencing the growth of the self-sovereign identity market.
- To analyze opportunities in the market for stakeholders by identifying high-growth segments of the self-sovereign identity market.
- To profile the key players of the self-sovereign identity market and comprehensively analyze their market size and core competencies.
- Track and analyze competitive developments, such as new product launches, mergers and acquisitions, partnerships, agreements, and collaborations in the global self-sovereign identity market.
Customization Options
With the given market data, MarketsandMarkets offers customizations based on company-specific needs. The following customization options are available for the report:
Geographic Analysis
- Further breakup of the Asia Pacific market into countries contributing 75% to the regional market size
- Further breakup of the North American market into countries contributing 100% to the regional market size
- Further breakup of the Latin American market into countries contributing 75% to the regional market size
- Further breakup of the Middle Eastern and African market into countries contributing 75% to the regional market size
- Further breakup of the European market into countries contributing 75% to the regional market size
Company Information
- Detailed analysis and profiling of additional market players (up to 5)
Growth opportunities and latent adjacency in Self-Sovereign Identity (SSI) Market