Satellites Market

Report Code AS 9245
Published in Nov, 2024, By MarketsandMarkets™
Download PDF

Choose License Type

Buy Report Now Inquire Before Buying

Satellites Market by Satellite Mass (Small, Medium, Large), Application (Communication, Earth Observation & Remote Sensing), Orbit (LEO, MEO, GEO), End User, Sub-systems, Frequency and Region - Global Forecast to 2030

Overview

The satellites global launches is expected to be 3,154 units in 2024 and is projected to be 5,048 units in 2030 at a CAGR of 8.2%. The satellites market is estimated to be USD 17.94 billion in 2024 and is projected to reach USD 35.95 billion by 2030, at a CAGR of 12.3% between 2024 and 2030.

Increasing demand for global connectivity, especially in remote areas, is driven by the requirement of satellites offering essential communication and internet services. Rising space-based broadband constellations in LEO for high-speed broadband paired with 5G networks, IoT, and smart city applications accelerate the need for satellite systems.". Satellites play a strong role in the defense sector, matching up with intelligence, reconnaissance, and secure communications, and therefore become a strong avenue for government investments. The need for Earth observation satellites in environmental monitoring, resource management, and disaster response also fuels industries. Advancements in miniaturization and low-cost launches for satellites have made deployment more accessible. With the expansion of SaaS models for satellites, further commercial use is also being driven, which combines to create strong market growth.

Attractive Opportunities in the Satellites Market

Europe

Europe is projected to be the fastest-growing region during the forecast period. The growth in this region can be attributed to the supportive environmental regulations and increasing advancement in satellite technology.

Market growth can be attributed to the increasing emphasis on development and deployment of green propulsion systems.

Contracts and partnerships are expected to create lucrative opportunities for market players in the next five years.

The market growth in Asia Pacific can be attributed to the significant investments in satellite technology by countries like China, India, Japan, Australia and South Korea.

By satellite mass, the large satellite segment is projected to reach USD 17.06 billion by 2030, registering a CAGR of 7.6%.

Global Satellites Market Dynamics

DRIVER: ESCALATING DEMAND FOR SATELLITE-BASED PNT SERVICES IN VARIOUS SECTORS

It is crucial for PNT solutions via satellites in high-dynamic environments to support high-precision and synchronization. With the integration of relatively advanced technology in various industries, their demand for accurate and reliable positioning, navigation, and timing services has also increased. This, primarily, is on account of a global push toward digitalization, automation, and operational efficiencies. Growing demands for higher accuracy and reliability in location-based services are stimulating growth across satellites because both government and commercial entities continue investing to further develop their satellite capabilities to offer PNT functionalities.

New satellite constellations, along with innovations in satellite navigation technologies, continue driving improvements in availability and coverage of PNT services around the world. This exercises competitive pressure on market players and ensures that they focus their efforts on improving the performance of satellite systems so that people can meet their rising demand for real-time data and uninterrupted connectivity. For instance, the production at higher levels of the GPS III and GPS IIIF satellites by Lockheed Martin comprises more positions and interference, which plays an extremely critical role in defense, transportation, and telecommunication sectors. In August 2023, the US Space Force reportedly awarded a contract to Lockheed Martin for additional production of the GPS IIIF satellite as the company continues its expansion of the constellation of GPS satellites providing critical PNT services.

RESTRAINT: LIMITED COVERAGE AND OPERATIONAL COMPLEXITY OF SATELLITES

Although satellites offer crucial communications and data services, there are some limitations such as orbital restrictions, signal latency, and geographic reach that restrict their possibilities to provide constant and unbroken coverage. In the case of constellations in non-geostationary orbits such as LEO, these are relatively large and unwieldy for constant coverage and hence more costly to manage.

This operational challenge of satellite management makes the practical deployment and utilization of satellites difficult. The operation of satellites that orbit must be carried out with much care in order to avoid the collision of one satellite with the other, preserving the stability of an orbit, and reducing the dangerous impacts of space debris-thus requiring great technical know-how and very many resources. It is also logistically tough to coordinate and achieve interoperability of satellite constellations, particularly when multiple different provider satellites or satellites on various orbital planes are integrated.

Besides, this list comprises ground infrastructure: among others, ground stations and network management systems, which must support the data to be transmitted between thousands of users and satellite communication. These systems must therefore be in a position to handle large volumes of data and also ensure the security of transmission as well as the accuracy of the satellite positioning and timing services.

OneWeb launched its last tranche in March 2023 but, because of geopolitical tensions and launch restrictions, could not keep up with promises regarding achieving global coverage. Geopolitical tensions and launch constraints are only one of several complications related to managing large constellations and ensuring smooth service across differing regions. Satellite systems remain constrained by operational complexity and limited coverage, which continue to be barriers toward market growth. The small companies and underdeveloped regions are normally at a disadvantage and most of the time, deter overall scalability and efficiency of satellite services.


OPPORTUNITY: RISING DEMAND FOR DATA ANALYTICS

The rising demand for data analytics poses huge potential in the satellite market where satellite data is increasingly important in decision making for many spheres. Since there is increasing reliance on satellite systems for Earth observation, environmental monitoring, defense, and telecommunication, the large amounts of information that have to be processed, analyzed, and interpreted in real time constitutes a great need.

Data analytics converts raw data into "actionable" to make business decisions and those of governments faster and more accurate. This is realized from increased utilization of satellite data used in the application of predictive analytics, resource management, disaster response, and market intelligence. Meaningful information extracted from the satellite-derived data has become necessary for operating and strategic planning in industries that are becoming increasingly data-driven. Advanced analytics tools such as AI, ML-an automated analysis, pattern recognition, and real-time insights-have enhanced the improved capability and potentiality of satellite data. This actuality is the main driver of the increase in satellite data analytics services usage in areas like agriculture, finance, logistics, and urban planning.

Under artificial intelligence, ICEYE expanded its data analytics capabilities, further processing of radar satellite imagery would be used to gain insights faster and with much higher accuracy into industries like insurance, defense, and disaster management.

CHALLENGES: INCREASE IN SPACE DEBRIS

Increased space junk in LEO is the biggest challenge to the satellites market. More small satellites are launched than ever before, in large constellations - which increases the quantity of debris rising with it. The rise in density of space debris complicates planning of operations and increases the chance of damage to or destruction of satellites, and thus heavy financial impact.

One of the most pressing concerns for companies involved in this field is the management of space debris risks. Debris has a direct possibility of damaging the physical integrity of satellites and seriously reduces its reliability and lifetime operational expectation. As the space environment continues to become denser, the more likely it is for debris to be encountered and thus makes constellations of satellites harder to maintain and protect. According to NASA (US) and the European Space Agency (ESA) estimates on its web pages, above 150 million objects orbit between LEO and up to 10,000 km from the Earth's surface to GEO with a total weight of more than 5,000 tons. As an exception to this, other than the hazard of crashing with interplanetary space missiles, Earth impacts are a great danger since debris is not controlled and may well survive atmospheric re-entry friction and fall anywhere when reattracted by gravity.

NASA (US) and the US Department of Defense's global Space Surveillance Network sensors statistics include more than 27,000 large debris, around 23,000 debris larger than a softball orbiting the Earth, half a million pieces of debris the size of a marble or larger (up to 0.4 in, or 1 cm), and around 100 million pieces of debris-about .04 in, or 1 mm. There is even smaller debris of micrometer-sized or 0.000039 in. The current average fallout is one piece of debris per day. This is a behemoth challenge which has been an area of research for many space agencies.

Global Satellites Market Ecosystem Analysis

In the satellites market ecosystem, key stakeholders range from major satellites manufactures, solution providers, and platform manufacturers. Influential forces shaping the industry include investors, funders, academic researchers, distributors, service providers, and defense procurement authorities. This intricate network of participants collaboratively drives market dynamics, innovation, and strategic decisions.


BASED ON SATELLITE MASS, LARGE SATELLITES SEGMENT TO LEAD SATELLITES MARKET IN 2024

The large satellites segment will boom heavily in terms of a number of factors giving a push to its demand. The large satellites are the lifeline for high-capacity communication networks, defense systems, and even weather monitoring. These applications cannot be met by advanced technologies that smaller satellites lack support for. Governments and defense agencies all over the world are investing hugely in large satellite projects for national security, intelligence, and geospatial applications. Increasing bandwidth and high-definition images for telecommunication and earth observation require more large-sized satellites with better payload capacity. Public-private partnerships also support substantial investments in large-scale satellite infrastructure since it facilitates technological innovation as well as better designs for satellites. Global operators are also expanding their fleets of geostationary-large-sized satellites to extend coverage and better communications, especially in less-covered regions. Favorable space policies across several countries and satellite launch regulatory approvals are speeding up the development of large satellite constellations, particularly for military, scientific research, and climate monitoring. The increasing trend in space exploration missions and deep-space communications enhance the role of large satellites, thereby becoming essential for future space mission launches and long-lasting explorations. All this combined will make the large satellite segment grow the fastest as they help solve most of the critical communications, defense and space research requirements worldwide.

BASED ON APPLICATION, COMMUNICATION SEGMENT TO LEAD SATELLITES MARKET IN 2024

The communication segment is expected to grow at the fastest rate due to various converging factors. Communication satellites' deployment, in turn, is driven by growing demands on global connectivity, which are mainly found in underserved and remote regions where terrestrial networks lack. In that context, the pervasiveness of data consumption necessitates increased broadband internet services, 5G networks, and IoT applications, thus making the satellite infrastructure to be strong and robust enough to support minimal communication lags. The communication satellite should make high-capacity data transmission very critical in supporting all forms of internet, voice, and video communications in both the commercial and government sectors. Moreover, growing demand for satcom-based broadband services for mobile platforms also encompassing aviation, maritime, and military usage will strengthen this market further. Governmental efforts for completing the digital divide in rural and cut-off areas have accelerated the introduction of communication satellites; a lot of public-private joint ventures are set up to launch next-generation constellations. Also, the trend to rely on satellites for national communication infrastructures in the emerging markets of Asia-Pacific, Africa, and Latin America is gaining strength. In addition, steady growth in the dependency on cloud services and data centers worldwide is fueling the cause for reliable satellite communications for expanding digital economies. Taken together, these force all the above headwinds to push growth in the communication segment- the fastest-growing application within the satellite market, serving critical needs for global connectivity.

Asia Pacific to have Largest Share in 2024 in Satellites Market

In terms of region, the Asia Pacific market, is witnessing unprecedented economic growth with China, India, Japan, and South Korea investing heavily in space technology towards upgradation of their means of communication and defense capabilities along with their research setup. Examples include India's ambitious ISRO space programs and China's advancements in satellite constellations under the "Belt and Road" space strategy. More importantly, growing demand for digital connectivity to bridge the emerging gap among markets is driving demand for satellites that will provide Internet and communication services in underserved rural areas. With the rapid growth of 5G networks, smart cities, and IoT ecosystems all across Asia, the infrastructure of satellite systems would be needed for high-speed data transmission as well as connectivity. National security and space systems with high capability in surveillance, intelligence gathering, and defense drive the countries to have very advanced infrastructure, which has boosted the market. Commercialization of space by regions bears several merits such as introducing new private companies, innovation stimulation, and attracts investments. Regional cooperation in the form of APSCO enhances satellite capabilities by utilizing shared resource and knowledge and facilitates market growth. Summing it up, all these positions Asia Pacific as the fastest-growing region in the global satellite market.

HIGHEST CAGR MARKET IN 2024
AUSTRALIA FASTEST GROWING MARKET IN THE REGION

Recent Developments of Satellites Market

  • In October 2023, The US Space Force awarded SPACEX a contract valued at USD 70 million for Starlink satellite Internet services. The contract involves a one-year task order starting September 1. Additionally, the contract specifies undisclosed requirements set by the US DoD. The contract was valued at USD 70 Million.
  • In January 2024, The US SDA awarded a Tranche 2 contract of the Space Tracking Layer to Lockheed Martin Corporation to build 18 satellites. The contract was valued at USD 890 Million.
  • In January 2024, Airbus Defence and Space acquired the remaining 50% share in Eutelsat OneWeb, becoming the sole owner of the satellite manufacturing facility in Merritt Island, Florida. This restructuring aimed to enhance efficiency and competitiveness for commercial, institutional, and national security space customers.
  • In October 2024, Northrop Grumman was awarded a contract by the US SDA to design and build 38 data transport satellites for the Tranche 2 Transport Layer – Alpha (T2TL-Alpha) of the Proliferated Warfighter Space Architecture (PWSA). These LEO satellites are expected to support military missions, with operations scheduled to start in December 2026. The contract was valued at USD 732 Million.

Key Market Players

KEY PLAYERS IN THE SATELLITES MARKET INCLUDE

Want to explore hidden markets that can drive new revenue in Satellites Market?

Scope of the Report

Report Metric Details
Market size available for years 2020-2030
Base Year Considered 2023
Forecast period 2024-2030
Forecast units Value (USD Million/USD Billion)
Segments covered By satellite mass, applications, sub-systems, end user, frequency, orbit
Geographies covered North America, Europe, Asia Pacific, Middle East, and Rest of the World


Key Questions Addressed by the Report

What are your views on the growth prospects of the satellites market?
The satellites market holds strong growth prospects, driven by increasing demand for global connectivity, particularly in remote and underserved regions, fueling the deployment of Low Earth Orbit (LEO) constellations for high-speed internet and supporting 5G networks.
What are the key sustainability strategies adopted by leading players operating in the satellites market?
Leading players in the satellite market are adapting key sustainability strategies like developing green propulsion systems such as electric propulsion that have the potential to reduce emissions and fuel consumption, while focusing on satellite miniaturization to lower energy usage and environmental impact.
What are the emerging technologies and use cases disrupting the satellites market?
The new generation in the satellite market is constituted of AI and Machine Learning technologies, which optimize operational satellite operations and data analytics. Quantum communication reinforces new standards of security in defense for transmitting data. 3D printing technology is changing satellite manufacturing, making deployment much faster and cheaper. LEO satellite constellations can bring wide coverage of broadband, IoT, and 5G, and earth observation satellites may be used for environment monitoring, disaster management, and agriculture analytics. At the same time, they improved the SAR and hyperspectral imaging and position satellites as obligatory tools for many industries.
Who are the key players and innovators in the satellites market ecosystem?
SPACEX (US), Lockheed Martin Corporation (US), Airbus Defence and Space (Germany), Northrop Grumman (US), Thales Alenia Space (France) are the key players in the satellites market ecosystem.
Which region is expected to hold the largest market share in the satellites market?
The Asia Pacific green methanol market is estimated to account for the largest share of 33.9% in 2024.


Personalize This Research

  • Triangulate with your Own Data
  • Get Data as per your Format and Definition
  • Gain a Deeper Dive on a Specific Application, Geography, Customer or Competitor
  • Any level of Personalization
Request A Free Customisation

Let Us Help You

  • What are the Known and Unknown Adjacencies Impacting the Satellites Market
  • What will your New Revenue Sources be?
  • Who will be your Top Customer; what will make them switch?
  • Defend your Market Share or Win Competitors
  • Get a Scorecard for Target Partners
Customized Workshop Request

Table of Contents

Exclusive indicates content/data unique to MarketsandMarkets and not available with any competitors.

TITLE
PAGE NO
INTRODUCTION
26
RESEARCH METHODOLOGY
30
EXECUTIVE SUMMARY
41
PREMIUM INSIGHTS
44
MARKET OVERVIEW
46
  • 5.1 INTRODUCTION
  • 5.2 MARKET DYNAMICS
    DRIVERS
    - Escalating demand for satellite-based PNT services in various sectors
    - Increase in public-private partnerships
    - Heightened national security requirements
    - Rising commercialization of Low Earth Orbit (LEO) for communication and Earth observation applications
    RESTRAINTS
    - Absence of unified regulations and government policies
    - Limited coverage and operational complexity
    OPPORTUNITIES
    - Increasing government investments in space agencies
    - Rising demand for data analytics
    CHALLENGES
    - Increase in space debris
    - Complexity in advanced hybrid propulsion system development
    - Supply chain management issues
  • 5.3 VALUE CHAIN ANALYSIS
  • 5.4 TRENDS & DISRUPTIONS IMPACTING CUSTOMER BUSINESS
  • 5.5 ECOSYSTEM ANALYSIS
    PROMINENT COMPANIES
    PRIVATE AND SMALL ENTERPRISES
    END USERS
  • 5.6 INVESTMENT AND FUNDING SCENARIO
  • 5.7 PRICING ANALYSIS
    AVERAGE SELLING PRICE, BY REGION
    INDICATIVE PRICING ANALYSIS, BY SATELLITE MASS
  • 5.8 REGULATORY LANDSCAPE
  • 5.9 TRADE ANALYSIS
    IMPORT SCENARIO (HS CODE 880260)
    EXPORT SCENARIO (HS CODE 880260)
  • 5.10 KEY STAKEHOLDERS & BUYING CRITERIA
    KEY STAKEHOLDERS IN BUYING PROCESS
    BUYING CRITERIA
  • 5.11 KEY CONFERENCES & EVENTS, 2024
  • 5.12 USE CASE ANALYSIS
    ICEYE USED ITS SAR SATELLITE CONSTELLATION TO DELIVER REAL-TIME, HIGH-RESOLUTION RADAR IMAGERY UNAFFECTED BY WEATHER CONDITIONS
    ONEWEB COMPLETED DEPLOYMENT OF ITS LEO SATELLITE CONSTELLATION, OFFERING GLOBAL BROADBAND CONNECTIVITY
    SPIRE GLOBAL LAUNCHED AN UPGRADED SERVICE INTEGRATING AIS (AUTOMATIC IDENTIFICATION SYSTEM) DATA WITH ADVANCED SATELLITE-BASED ANALYTICS
  • 5.13 TECHNOLOGY ANALYSIS
    KEY TECHNOLOGIES
    - Advanced power systems
    - Miniaturization
    - Space data analytics
    COMPLEMENTARY TECHNOLOGIES
    - Quantum encryption for satellites
  • 5.14 OPERATIONAL DATA
  • 5.15 SATELLITES MARKET: BUSINESS MODELS
  • 5.16 TOTAL COST OF OWNERSHIP
  • 5.17 BILL OF MATERIALS
  • 5.18 MACROECONOMIC OUTLOOK
    INTRODUCTION
    NORTH AMERICA
    EUROPE
    ASIA PACIFIC
    MIDDLE EAST
    LATIN AMERICA & AFRICA
  • 5.19 IMPACT OF GENERATIVE AI
    INTRODUCTION
    ADOPTION OF AI IN SPACE BY TOP COUNTRIES
    IMPACT OF AI ON SPACE: USE CASES
    IMPACT OF AI ON SATELLITES MARKET
  • 5.20 TECHNOLOGY ROADMAP
  • 5.21 MARKET SCENARIO ANALYSIS
    MARKET PERSPECTIVE THROUGH SATELLITES LAUNCHED IN DIFFERENT SCENARIOS
INDUSTRY TRENDS
93
  • 6.1 INTRODUCTION
  • 6.2 TECHNOLOGY TRENDS
    ADVANCED MATERIALS
    ADDITIVE MANUFACTURING
    GREEN PROPULSION SYSTEMS
    SATELLITE-TO-CELL CONNECTIVITY
  • 6.3 IMPACT OF MEGATRENDS
    INDUSTRY 4.0
    AI & ML INTEGRATION
    SATELLITE-AS-A-SERVICE (SAAS)
  • 6.4 SUPPLY CHAIN ANALYSIS
  • 6.5 PATENT ANALYSIS
SATELLITES MARKET, BY SATELLITE MASS
102
  • 7.1 INTRODUCTION
  • 7.2 SMALL
    NEED FOR ROBUST MISSION CAPABILITIES TO DRIVE MARKET
  • 7.3 MEDIUM
    NEED FOR TECHNOLOGICAL ADVANCEMENTS TO DRIVE MARKET
  • 7.4 LARGE
    DEMAND FOR HIGH-CAPACITY TELECOMMUNICATION AND BROADBAND SERVICES TO DRIVE MARKET
SATELLITES MARKET, BY APPLICATION
110
  • 8.1 INTRODUCTION
  • 8.2 COMMUNICATION
    NEED FOR RELIABLE AND WIDESPREAD CONNECTIVITY TO DRIVE MARKET
    COMMUNICATION: USE CASE
  • 8.3 EARTH OBSERVATION & REMOTE SENSING
    GROWING DEMAND FOR ACCURATE AND TIMELY DATA FOR ENVIRONMENTAL MONITORING TO DRIVE MARKET
    EARTH OBSERVATION & REMOTE SENSING: USE CASE
  • 8.4 OTHER APPLICATIONS
    SCIENTIFIC RESEARCH
    - Satellites facilitate scientific research by helping researchers study meteorology and space observation
    SCIENTIFIC RESEARCH: USE CASE
    TECHNOLOGY
    - Extensive use of small satellites in missile tracking and threat detection to drive market
    TECHNOLOGY: USE CASE
SATELLITES MARKET, BY END USER
117
  • 9.1 INTRODUCTION
  • 9.2 COMMERCIAL
    SATELLITE OPERATORS/OWNERS
    - Growing demand for communication services to drive market
    MEDIA & ENTERTAINMENT COMPANIES
    - Increasing demand for fast broadband connectivity to drive market
    ENERGY SERVICE PROVIDERS
    - Enhanced operational efficiency and monitoring capabilities of satellites to drive market
    SCIENTIFIC RESEARCH & DEVELOPMENT ORGANIZATIONS
    - Increasing use of satellites for data collection to drive market
    OTHERS
  • 9.3 GOVERNMENT & CIVIL
    NATIONAL SPACE AGENCIES
    - Demand for advanced scientific knowledge and technological capabilities to drive market
    SEARCH & RESCUE ENTITIES
    - Need for enhanced situational awareness and coordination to drive market
    ACADEMIC & RESEARCH INSTITUTIONS
    - Need for data accessibility for scientific research and education to drive market
    NATIONAL MAPPING & TOPOGRAPHIC AGENCIES
    - Increasing need for accurate and comprehensive geographic data collection to drive market
  • 9.4 DEFENSE
    DEPARTMENT OF DEFENSE & INTELLIGENCE AGENCIES
    - Focus on enhanced situational awareness and intelligence gathering to drive market
SATELLITES MARKET, BY ORBIT
124
  • 10.1 INTRODUCTION
  • 10.2 LEO
  • 10.3 MEO
  • 10.4 GEO
  • 10.5 OTHER ORBITS
SATELLITES MARKET, BY SUBSYSTEM
129
  • 11.1 INTRODUCTION
  • 11.2 SATELLITE BUS
    ATTITUDE & ORBITAL CONTROL SYSTEMS
    - Need for precision in satellite positioning to drive market
    COMMAND & DATA HANDLING SYSTEMS
    - Growing complexity of satellite missions to drive market
    ELECTRICAL POWER SYSTEMS
    - Focus on enhancing satellite performance to drive market
    PROPULSION SYSTEMS
    - Chemical propulsion
    - Electric propulsion
    - Hybrid propulsion
    TELEMETRY, TRACKING, AND COMMAND SYSTEMS
    - Increasing need for effective communication between satellites and ground stations to drive market
    STRUCTURES
    - Expanding capabilities of structural subsystems to drive market
    THERMAL SYSTEMS
    - Advancements in materials science and thermal management solutions to drive market
  • 11.3 PAYLOADS
    TRADITIONAL PAYLOADS
    - Growing demand for enhanced Earth observation capabilities in satellites to drive market
    SOFTWARE-DEFINED PAYLOADS
    - Demand for effective product mapping in commercial industries to drive market
  • 11.4 SOLAR PANELS
    DEPLOYABLE
    - Increasing need for high power generation in satellites to drive market
    STATIC
    - Rising demand for cost-effective and reliable solutions for satellite missions to drive market
  • 11.5 SATELLITE ANTENNAS
    SATELLITE ANTENNAS USE ULTRA-HIGH-FREQUENCY BAND THAT SUPPORTS WIDE RANGE OF FREQUENCIES
  • 11.6 OTHER SUBSYSTEMS
SATELLITES MARKET, BY FREQUENCY
135
  • 12.1 INTRODUCTION
  • 12.2 L-BAND
    ENHANCED SIGNAL RELIABILITY IN L-BAND FREQUENCIES TO DRIVE MARKET
  • 12.3 S-BAND
    GROWING SCIENTIFIC MISSIONS TO DRIVE MARKET
  • 12.4 C-BAND
    DEMAND FOR ROBUST COMMUNICATION SERVICES FROM DEVELOPING REGIONS TO DRIVE MARKET
  • 12.5 X-BAND
    INCREASING GEOPOLITICAL TENSIONS TO DRIVE MARKET
  • 12.6 KU-BAND
    INCREASING NEED FOR HIGH-CAPACITY DATA TRANSMISSION AND BROADBAND INTERNET SERVICES TO DRIVE MARKET
  • 12.7 KA-BAND
    NEED FOR BACKHAUL SOLUTIONS WITH EXPANSION OF 5G TO DRIVE MARKET
  • 12.8 Q/V/E-BAND
    INCREASING DEMAND FOR ULTRA-HIGH-SPEED DATA SERVICES TO DRIVE MARKET
  • 12.9 HF/VHF/UHF-BAND
    NEED FOR LONG-RANGE COMMUNICATION TO DRIVE MARKET
  • 12.10 LASER/OPTICAL BAND
    DEVELOPMENT OF LASER COMMUNICATION TECHNOLOGY BY PROMINENT COMPANIES TO DRIVE MARKET
SATELLITES MARKET, BY REGION
138
  • 13.1 INTRODUCTION
  • 13.2 NORTH AMERICA
    PESTLE ANALYSIS
    US
    - Substantial government investments to drive market
    CANADA
    - Government initiatives for space technology development to drive market
  • 13.3 EUROPE
    PESTLE ANALYSIS
    RUSSIA
    - Government’s strategic focus on space to drive market
    UK
    - Need for prioritizing innovation in small satellite technologies to drive market
    GERMANY
    - Emphasis on technological innovation and advanced engineering to drive market
    FRANCE
    - Leadership in space research and satellite innovation to drive market
    ITALY
    - Focus on satellite manufacturing to drive market
  • 13.4 ASIA PACIFIC
    PESTLE ANALYSIS
    CHINA
    - Focus on satellite-based infrastructure to drive market
    INDIA
    - Emphasis on space accessibility to drive market
    JAPAN
    - Precision technologies and resilience in space infrastructure to drive market
    SOUTH KOREA
    - Focus on technological innovation and national security to drive market
    AUSTRALIA
    - Space sustainability and regional space leadership to drive market
  • 13.5 MIDDLE EAST
    PESTLE ANALYSIS
    GCC
    - UAE
    - Saudi Arabia
    REST OF MIDDLE EAST
  • 13.6 REST OF THE WORLD
    LATIN AMERICA
    - Focus on enhanced broadband connectivity in underserved areas to drive market
    AFRICA
    - Need to address connectivity gaps to drive market
COMPETITIVE LANDSCAPE
181
  • 14.1 INTRODUCTION
  • 14.2 KEY PLAYER STRATEGIES/RIGHT TO WIN, 2020–2024
  • 14.3 REVENUE ANALYSIS, 2020–2023
  • 14.4 MARKET SHARE ANALYSIS, 2023
  • 14.5 COMPANY EVALUATION MATRIX: KEY PLAYERS, 2023
    STARS
    EMERGING LEADERS
    PERVASIVE PLAYERS
    PARTICIPANTS
    COMPANY FOOTPRINT: KEY PLAYERS, 2023
  • 14.6 COMPANY EVALUATION MATRIX: STARTUPS/SMES, 2023
    PROGRESSIVE COMPANIES
    RESPONSIVE COMPANIES
    DYNAMIC COMPANIES
    STARTING BLOCKS
    COMPETITIVE BENCHMARKING
  • 14.7 COMPANY VALUATION AND FINANCIAL METRICS
  • 14.8 BRAND/PRODUCT COMPARISON
  • 14.9 COMPETITIVE SCENARIO AND TRENDS
    PRODUCT LAUNCHES
    DEALS
    OTHER DEVELOPMENTS
COMPANY PROFILES
218
  • 15.1 KEY PLAYERS
    SPACEX
    - Business overview
    - Products/Solutions/Services offered
    - Recent developments
    - MnM view
    LOCKHEED MARTIN CORPORATION
    - Business overview
    - Products/Solutions/Services offered
    - Recent developments
    - MnM view
    AIRBUS DEFENCE AND SPACE
    - Business overview
    - Products/Solutions/Services offered
    - Recent developments
    - MnM view
    NORTHROP GRUMMAN
    - Business overview
    - Products/Solutions/Services offered
    - Recent developments
    - MnM view
    THALES ALENIA SPACE
    - Business overview
    - Products/Solutions/Services offered
    - Recent developments
    - MnM view
    L3HARRIS TECHNOLOGIES, INC.
    - Business overview
    - Products/Solutions/Services offered
    - Recent developments
    MDA
    - Business overview
    - Products/Solutions/Services offered
    - Recent developments
    PLANET LABS PBC
    - Business overview
    - Products/Solutions/Services offered
    - Recent developments
    SNC
    - Business overview
    - Products/Solutions/Services offered
    - Recent developments
    MAXAR TECHNOLOGIES
    - Business overview
    - Products/Solutions/Services offered
    - Recent developments
    MITSUBISHI ELECTRIC CORPORATION
    - Business overview
    - Products/Solutions/Services offered
    - Recent developments
    RTX
    - Business overview
    - Products/Solutions/Services offered
    - Recent developments
    OHB SE
    - Business overview
    - Products/Solutions/Services offered
    - Recent developments
    BOEING
    - Business overview
    - Products/Solutions/Services offered
    - Recent developments
    TERRAN ORBITAL CORPORATION
    - Business overview
    - Products/Solutions/Services offered
    - Recent developments
    YORK SPACE SYSTEMS
    - Business overview
    - Products/Solutions/Services offered
    - Recent developments
  • 15.2 OTHER PLAYERS
    AEROSPACELAB
    ENDUROSAT
    NANOAVIONICS
    ASTRANIS
    ICEYE
    PIXXEL
    FLEET SPACE TECHNOLOGIES PTY LTD
    KUIPER SYSTEMS LLC
    ALÉN SPACE
    SKYKRAFT PTY LTD
    ARGOTEC S.R.L.
APPENDIX
300
  • 16.1 DISCUSSION GUIDE
  • 16.2 KNOWLEDGESTORE: MARKETSANDMARKETS’ SUBSCRIPTION PORTAL
  • 16.3 CUSTOMIZATION OPTIONS
  • 16.4 RELATED REPORTS
  • 16.5 ANNEXURE
  • 16.6 AUTHOR DETAILS
LIST OF TABLES
 
  • TABLE 1 USD EXCHANGE RATES, 2019–2023
  • TABLE 2 SATELLITE CONSTELLATIONS INTO LEO ORBIT, BY OWNER
  • TABLE 3 ROLE OF COMPANIES IN ECOSYSTEM
  • TABLE 4 INDICATIVE PRICING LEVELS OF SATELLITES, BY SATELLITE MASS (USD MILLION)
  • TABLE 5 NORTH AMERICA: REGULATORY BODIES, GOVERNMENT AGENCIES, AND OTHER ORGANIZATIONS
  • TABLE 6 EUROPE: REGULATORY BODIES, GOVERNMENT AGENCIES, AND OTHER ORGANIZATIONS
  • TABLE 7 ASIA PACIFIC: REGULATORY BODIES, GOVERNMENT AGENCIES, AND OTHER ORGANIZATIONS
  • TABLE 8 MIDDLE EAST: REGULATORY BODIES, GOVERNMENT AGENCIES, AND OTHER ORGANIZATIONS
  • TABLE 9 REST OF THE WORLD: REGULATORY BODIES, GOVERNMENT AGENCIES, AND OTHER ORGANIZATIONS
  • TABLE 10 IMPORT DATA FOR HS CODE 880260-COMPLIANT PRODUCTS, BY COUNTRY, 2020–2023 (USD THOUSAND)
  • TABLE 11 EXPORT DATA FOR HS CODE 880260-COMPLIANT PRODUCTS, BY COUNTRY, 2020–2023 (USD THOUSAND)
  • TABLE 12 INFLUENCE OF STAKEHOLDERS ON BUYING PROCESS, BY END USER (%)
  • TABLE 13 KEY BUYING CRITERIA, BY APPLICATION
  • TABLE 14 KEY CONFERENCES & EVENTS, 2024
  • TABLE 15 ACTIVE FLEETS OF SMALL SATELLITES, BY COUNTRY, 2020–2023 (UNITS)
  • TABLE 16 COMPARISON BETWEEN BUSINESS MODELS
  • TABLE 17 TOTAL COST OF OWNERSHIP: COMPARISON BETWEEN SATELLITES
  • TABLE 18 AVERAGE TOTAL COST OF OWNERSHIP FOR SATELLITES, BY SATELLITE MASS (USD MILLION)
  • TABLE 19 BILL OF MATERIALS ANALYSIS FOR SATELLITES
  • TABLE 20 BILL OF MATERIALS: COMPARISON BETWEEN SATELLITES
  • TABLE 21 IMPACT OF AI ON SPACE APPLICATIONS
  • TABLE 22 PATENT ANALYSIS, 2022–2023
  • TABLE 23 SATELLITES MARKET, BY SATELLITE MASS, 2020–2023 (USD MILLION)
  • TABLE 24 SATELLITES MARKET, BY SATELLITE MASS, 2024–2030 (USD MILLION)
  • TABLE 25 SATELLITES MARKET, BY SATELLITE MASS, 2020–2023 (UNITS)
  • TABLE 26 SATELLITES MARKET, BY SATELLITE MASS, 2024–2030 (UNITS)
  • TABLE 27 PLANNED SATELLITE LAUNCHES FOR MAJOR SATELLITE CONSTELLATIONS, BY KEY PLAYER, 2024–2030 (UNITS)
  • TABLE 28 STARLINK V1.5: SPECIFICATIONS
  • TABLE 29 S-CLASS SATELLITE: SPECIFICATIONS
  • TABLE 30 SMARTLEO AGILE: SPECIFICATIONS
  • TABLE 31 THALES ALENIA SPACE (TAS) LEO 2000: SPECIFICATIONS
  • TABLE 32 THALES ALENIA SPACE (TAS) SPACEBUS 4000: SPECIFICATIONS
  • TABLE 33 BOEING 702X: SPECIFICATIONS
  • TABLE 34 SATELLITES MARKET, BY APPLICATION, 2020–2023 (USD MILLION)
  • TABLE 35 SATELLITES MARKET, BY APPLICATION, 2024–2030 (USD MILLION)
  • TABLE 36 SATELLITES MARKET, BY APPLICATION, 2020–2023 (UNITS)
  • TABLE 37 SATELLITES MARKET, BY APPLICATION, 2024–2030 (UNITS)
  • TABLE 38 SATELLITES MARKET, BY END USER, 2020–2023 (USD MILLION)
  • TABLE 39 SATELLITES MARKET, BY END USER, 2024–2030 (USD MILLION)
  • TABLE 40 SATELLITES MARKET, BY END USER, 2020–2023 (UNITS)
  • TABLE 41 SATELLITES MARKET, BY END USER, 2024–2030 (UNITS)
  • TABLE 42 SATELLITES MARKET, BY ORBIT, 2020–2023 (USD MILLION)
  • TABLE 43 SATELLITES MARKET, BY ORBIT, 2024–2030 (USD MILLION)
  • TABLE 44 SATELLITES MARKET, BY ORBIT, 2020–2023 (UNITS)
  • TABLE 45 SATELLITES MARKET, BY ORBIT, 2024–2030 (UNITS)
  • TABLE 46 SATELLITES MARKET, BY REGION, 2020–2023 (USD MILLION)
  • TABLE 47 SATELLITES MARKET, BY REGION, 2024–2030 (USD MILLION)
  • TABLE 48 SATELLITES MARKET, BY REGION, 2020–2023 (UNITS)
  • TABLE 49 SATELLITES MARKET, BY REGION, 2024–2030 (UNITS)
  • TABLE 50 NORTH AMERICA: SATELLITES MARKET, BY SATELLITE MASS, 2020–2023 (UNITS)
  • TABLE 51 NORTH AMERICA: SATELLITES MARKET, BY SATELLITE MASS, 2024–2030 (UNITS)
  • TABLE 52 NORTH AMERICA: SATELLITES MARKET, BY APPLICATION, 2020–2023 (UNITS)
  • TABLE 53 NORTH AMERICA: SATELLITES MARKET, BY APPLICATION, 2024–2030 (UNITS)
  • TABLE 54 NORTH AMERICA: SATELLITES MARKET, BY COUNTRY, 2020–2023 (UNITS)
  • TABLE 55 NORTH AMERICA: SATELLITES MARKET, BY COUNTRY, 2024–2030 (UNITS)
  • TABLE 56 US: SATELLITES MARKET, BY SATELLITE MASS, 2020–2023 (UNITS)
  • TABLE 57 US: SATELLITES MARKET, BY SATELLITE MASS, 2024–2030 (UNITS)
  • TABLE 58 US: SATELLITES MARKET, BY APPLICATION, 2020–2023 (UNITS)
  • TABLE 59 US: SATELLITES MARKET, BY APPLICATION, 2024–2030 (UNITS)
  • TABLE 60 CANADA: SATELLITES MARKET, BY SATELLITE MASS, 2020–2023 (UNITS)
  • TABLE 61 CANADA: SATELLITES MARKET, BY SATELLITE MASS, 2024–2030 (UNITS)
  • TABLE 62 CANADA: SATELLITES MARKET, BY APPLICATION, 2020–2023 (UNITS)
  • TABLE 63 CANADA: SATELLITES MARKET, BY APPLICATION, 2024–2030 (UNITS)
  • TABLE 64 EUROPE: SATELLITES MARKET, BY SATELLITE MASS, 2020–2023 (UNITS)
  • TABLE 65 EUROPE: SATELLITES MARKET, BY SATELLITE MASS, 2024–2030 (UNITS)
  • TABLE 66 EUROPE: SATELLITES MARKET, BY APPLICATION, 2020–2023 (UNITS)
  • TABLE 67 EUROPE: SATELLITES MARKET, BY APPLICATION, 2024–2030 (UNITS)
  • TABLE 68 EUROPE: SATELLITES MARKET, BY COUNTRY, 2020–2023 (UNITS)
  • TABLE 69 EUROPE: SATELLITES MARKET, BY COUNTRY, 2024–2030 (UNITS)
  • TABLE 70 RUSSIA: SATELLITES MARKET, BY SATELLITE MASS, 2020–2023 (UNITS)
  • TABLE 71 RUSSIA: SATELLITES MARKET, BY SATELLITE MASS, 2024–2030 (UNITS)
  • TABLE 72 RUSSIA: SATELLITES MARKET, BY APPLICATION, 2020–2023 (UNITS)
  • TABLE 73 RUSSIA: SATELLITES MARKET, BY APPLICATION, 2024–2030 (UNITS)
  • TABLE 74 UK: SATELLITES MARKET, BY SATELLITE MASS, 2020–2023 (UNITS)
  • TABLE 75 UK: SATELLITES MARKET, BY SATELLITE MASS, 2024–2030 (UNITS)
  • TABLE 76 UK: SATELLITES MARKET, BY APPLICATION, 2020–2023 (UNITS)
  • TABLE 77 UK: SATELLITES MARKET, BY APPLICATION, 2024–2030 (UNITS)
  • TABLE 78 GERMANY: SATELLITES MARKET, BY SATELLITE MASS, 2020–2023 (UNITS)
  • TABLE 79 GERMANY: SATELLITES MARKET, BY SATELLITE MASS, 2024–2030 (UNITS)
  • TABLE 80 GERMANY: SATELLITES MARKET, BY APPLICATION, 2020–2023 (UNITS)
  • TABLE 81 GERMANY: SATELLITES MARKET, BY APPLICATION, 2024–2030 (UNITS)
  • TABLE 82 FRANCE: SATELLITES MARKET, BY SATELLITE MASS, 2020–2023 (UNITS)
  • TABLE 83 FRANCE: SATELLITES MARKET, BY SATELLITE MASS, 2024–2030 (UNITS)
  • TABLE 84 FRANCE: SATELLITES MARKET, BY APPLICATION, 2020–2023 (UNITS)
  • TABLE 85 FRANCE: SATELLITES MARKET, BY APPLICATION, 2024–2030 (UNITS)
  • TABLE 86 ITALY: SATELLITES MARKET, BY SATELLITE MASS, 2020–2023 (UNITS)
  • TABLE 87 ITALY: SATELLITES MARKET, BY SATELLITE MASS, 2024–2030 (UNITS)
  • TABLE 88 ITALY: SATELLITES MARKET, BY APPLICATION, 2020–2023 (UNITS)
  • TABLE 89 ITALY: SATELLITES MARKET, BY APPLICATION, 2024–2030 (UNITS)
  • TABLE 90 ASIA PACIFIC: SATELLITES MARKET, BY SATELLITE MASS, 2020–2023 (UNITS)
  • TABLE 91 ASIA PACIFIC: SATELLITES MARKET, BY SATELLITE MASS, 2024–2030 (UNITS)
  • TABLE 92 ASIA PACIFIC: SATELLITES MARKET, BY APPLICATION, 2020–2023 (UNITS)
  • TABLE 93 ASIA PACIFIC: SATELLITES MARKET, BY APPLICATION, 2024–2030 (UNITS)
  • TABLE 94 ASIA PACIFIC: SATELLITES MARKET, BY COUNTRY, 2020–2023 (UNITS)
  • TABLE 95 ASIA PACIFIC: SATELLITES MARKET, BY COUNTRY, 2024–2030 (UNITS)
  • TABLE 96 CHINA: SATELLITES MARKET, BY SATELLITE MASS, 2020–2023 (UNITS)
  • TABLE 97 CHINA: SATELLITES MARKET, BY SATELLITE MASS, 2024–2030 (UNITS)
  • TABLE 98 CHINA: SATELLITES MARKET, BY APPLICATION, 2020–2023 (UNITS)
  • TABLE 99 CHINA: SATELLITES MARKET, BY APPLICATION, 2024–2030 (UNITS)
  • TABLE 100 INDIA: SATELLITES MARKET, BY SATELLITE MASS, 2020–2023 (UNITS)
  • TABLE 101 INDIA: SATELLITES MARKET, BY SATELLITE MASS, 2024–2030 (UNITS)
  • TABLE 102 INDIA: SATELLITES MARKET, BY APPLICATION, 2020–2023 (UNITS)
  • TABLE 103 INDIA: SATELLITES MARKET, BY APPLICATION, 2024–2030 (UNITS)
  • TABLE 104 JAPAN: SATELLITES MARKET, BY SATELLITE MASS, 2020–2023 (UNITS)
  • TABLE 105 JAPAN: SATELLITES MARKET, BY SATELLITE MASS, 2024–2030 (UNITS)
  • TABLE 106 JAPAN: SATELLITES MARKET, BY APPLICATION, 2020–2023 (UNITS)
  • TABLE 107 JAPAN: SATELLITES MARKET, BY APPLICATION, 2024–2030 (UNITS)
  • TABLE 108 SOUTH KOREA: SATELLITES MARKET, BY SATELLITE MASS, 2020–2023 (UNITS)
  • TABLE 109 SOUTH KOREA: SATELLITES MARKET, BY SATELLITE MASS, 2024–2030 (UNITS)
  • TABLE 110 SOUTH KOREA: SATELLITES MARKET, BY APPLICATION, 2020–2023 (UNITS)
  • TABLE 111 SOUTH KOREA: SATELLITES MARKET, BY APPLICATION, 2024–2030 (UNITS)
  • TABLE 112 AUSTRALIA: SATELLITES MARKET, BY SATELLITE MASS, 2020–2023 (UNITS)
  • TABLE 113 AUSTRALIA: SATELLITES MARKET, BY SATELLITE MASS, 2024–2030 (UNITS)
  • TABLE 114 AUSTRALIA: SATELLITES MARKET, BY APPLICATION, 2020–2023 (UNITS)
  • TABLE 115 AUSTRALIA: SATELLITES MARKET, BY APPLICATION, 2024–2030 (UNITS)
  • TABLE 116 MIDDLE EAST: SATELLITES MARKET, BY SATELLITE MASS, 2020–2023 (UNITS)
  • TABLE 117 MIDDLE EAST: SATELLITES MARKET, BY SATELLITE MASS, 2024–2030 (UNITS)
  • TABLE 118 MIDDLE EAST: SATELLITES MARKET, BY APPLICATION, 2020–2023 (UNITS)
  • TABLE 119 MIDDLE EAST: SATELLITES MARKET, BY APPLICATION, 2024–2030 (UNITS)
  • TABLE 120 MIDDLE EAST: SATELLITES MARKET, BY COUNTRY, 2020–2023 (UNITS)
  • TABLE 121 MIDDLE EAST: SATELLITES MARKET, BY COUNTRY, 2024–2030 (UNITS)
  • TABLE 122 UAE: SATELLITES MARKET, BY SATELLITE MASS, 2020–2023 (UNITS)
  • TABLE 123 UAE: SATELLITES MARKET, BY SATELLITE MASS, 2024–2030 (UNITS)
  • TABLE 124 UAE: SATELLITES MARKET, BY APPLICATION, 2020–2023 (UNITS)
  • TABLE 125 UAE: SATELLITES MARKET, BY APPLICATION, 2024–2030 (UNITS)
  • TABLE 126 SAUDI ARABIA: SATELLITES MARKET, BY SATELLITE MASS, 2020–2023 (UNITS)
  • TABLE 127 SAUDI ARABIA: SATELLITES MARKET, BY SATELLITE MASS, 2024–2030 (UNITS)
  • TABLE 128 SAUDI ARABIA: SATELLITES MARKET, BY APPLICATION, 2020–2023 (UNITS)
  • TABLE 129 SAUDI ARABIA: SATELLITES MARKET, BY APPLICATION, 2024–2030 (UNITS)
  • TABLE 130 REST OF MIDDLE EAST: SATELLITES MARKET, BY SATELLITE MASS, 2020–2023 (UNITS)
  • TABLE 131 REST OF MIDDLE EAST: SATELLITES MARKET, BY SATELLITE MASS, 2024–2030 (UNITS)
  • TABLE 132 REST OF MIDDLE EAST: SATELLITES MARKET, BY APPLICATION, 2020–2023 (UNITS)
  • TABLE 133 REST OF MIDDLE EAST: SATELLITES MARKET, BY APPLICATION, 2024–2030 (UNITS)
  • TABLE 134 REST OF THE WORLD: SATELLITES MARKET, BY SATELLITE MASS, 2020–2023 (UNITS)
  • TABLE 135 REST OF THE WORLD: SATELLITES MARKET, BY SATELLITE MASS, 2024–2030 (UNITS)
  • TABLE 136 REST OF THE WORLD: SATELLITES MARKET, BY APPLICATION, 2020–2023 (UNITS)
  • TABLE 137 REST OF THE WORLD: SATELLITES MARKET, BY APPLICATION, 2024–2030 (UNITS)
  • TABLE 138 REST OF THE WORLD: SATELLITES MARKET, BY REGION, 2020–2023 (UNITS)
  • TABLE 139 REST OF THE WORLD: SATELLITES MARKET, BY REGION, 2024–2030 (UNITS)
  • TABLE 140 LATIN AMERICA: SATELLITES MARKET, BY SATELLITE MASS, 2020–2023 (UNITS)
  • TABLE 141 LATIN AMERICA: SATELLITES MARKET, BY SATELLITE MASS, 2024–2030 (UNITS)
  • TABLE 142 LATIN AMERICA: SATELLITES MARKET, BY APPLICATION, 2020–2023 (UNITS)
  • TABLE 143 LATIN AMERICA: SATELLITES MARKET, BY APPLICATION, 2024–2030 (UNITS)
  • TABLE 144 AFRICA: SATELLITES MARKET, BY SATELLITE MASS, 2020–2023 (UNITS)
  • TABLE 145 AFRICA: SATELLITES MARKET, BY SATELLITE MASS, 2024–2030 (UNITS)
  • TABLE 146 AFRICA: SATELLITES MARKET, BY APPLICATION, 2020–2023 (UNITS)
  • TABLE 147 AFRICA: SATELLITES MARKET, BY APPLICATION, 2024–2030 (UNITS)
  • TABLE 148 KEY PLAYER STRATEGIES/RIGHT TO WIN, 2020–2024
  • TABLE 149 SATELLITES MARKET: DEGREE OF COMPETITION
  • TABLE 150 VOLUME BREAKDOWN FOR SATELLITES LAUNCHED IN 2023
  • TABLE 151 END USER FOOTPRINT
  • TABLE 152 ORBIT FOOTPRINT
  • TABLE 153 SATELLITE MASS FOOTPRINT
  • TABLE 154 REGIONAL FOOTPRINT
  • TABLE 155 DETAILED LIST OF STARTUPS/SMES
  • TABLE 156 COMPETITIVE BENCHMARKING OF STARTUPS/SMES
  • TABLE 157 SATELLITES MARKET: PRODUCT LAUNCHES, JANUARY 2020–OCTOBER 2024
  • TABLE 158 SATELLITES MARKET: DEALS, JANUARY 2020–OCTOBER 2024
  • TABLE 159 SATELLITES MARKET: OTHER DEVELOPMENTS, JANUARY 2020–OCTOBER 2024
  • TABLE 160 SPACEX: COMPANY OVERVIEW
  • TABLE 161 SPACEX: PRODUCTS/SOLUTIONS/SERVICES OFFERED
  • TABLE 162 SPACEX: OTHER DEVELOPMENTS
  • TABLE 163 LOCKHEED MARTIN CORPORATION: COMPANY OVERVIEW
  • TABLE 164 LOCKHEED MARTIN CORPORATION: PRODUCTS/SOLUTIONS/SERVICES OFFERED
  • TABLE 165 LOCKHEED MARTIN CORPORATION: OTHER DEVELOPMENTS
  • TABLE 166 AIRBUS DEFENCE AND SPACE: COMPANY OVERVIEW
  • TABLE 167 AIRBUS DEFENCE AND SPACE: PRODUCTS/SOLUTIONS/SERVICES OFFERED
  • TABLE 168 AIRBUS DEFENCE AND SPACE: DEALS
  • TABLE 169 AIRBUS DEFENCE AND SPACE: OTHER DEVELOPMENTS
  • TABLE 170 NORTHROP GRUMMAN: COMPANY OVERVIEW
  • TABLE 171 NORTHROP GRUMMAN: PRODUCTS/SOLUTIONS/SERVICES OFFERED
  • TABLE 172 NORTHROP GRUMMAN: DEALS
  • TABLE 173 NORTHROP GRUMMAN: OTHER DEVELOPMENTS
  • TABLE 174 THALES ALENIA SPACE: COMPANY OVERVIEW
  • TABLE 175 THALES ALENIA SPACE: PRODUCTS/SOLUTIONS/SERVICES OFFERED
  • TABLE 176 THALES ALENIA SPACE: DEALS
  • TABLE 177 THALES ALENIA SPACE: OTHER DEVELOPMENTS
  • TABLE 178 L3HARRIS TECHNOLOGIES, INC.: COMPANY OVERVIEW
  • TABLE 179 L3HARRIS TECHNOLOGIES, INC.: PRODUCTS/SOLUTIONS/SERVICES OFFERED
  • TABLE 180 L3HARRIS TECHNOLOGIES, INC.: DEALS
  • TABLE 181 L3HARRIS TECHNOLOGIES, INC.: OTHER DEVELOPMENTS
  • TABLE 182 MDA: COMPANY OVERVIEW
  • TABLE 183 MDA: PRODUCTS/SOLUTIONS/SERVICES OFFERED
  • TABLE 184 MDA: OTHER DEVELOPMENTS
  • TABLE 185 PLANET LABS PBC: COMPANY OVERVIEW
  • TABLE 186 PLANET LABS PBC: PRODUCTS/SOLUTIONS/SERVICES OFFERED
  • TABLE 187 PLANET LABS PBC: PRODUCT LAUNCHES
  • TABLE 188 PLANET LABS PBC: DEALS
  • TABLE 189 PLANET LABS PBC: OTHER DEVELOPMENTS
  • TABLE 190 SNC: COMPANY OVERVIEW
  • TABLE 191 SNC: PRODUCTS/SOLUTIONS/SERVICES OFFERED
  • TABLE 192 SNC: OTHER DEVELOPMENTS
  • TABLE 193 MAXAR TECHNOLOGIES: COMPANY OVERVIEW
  • TABLE 194 MAXAR TECHNOLOGIES: PRODUCTS/SOLUTIONS/SERVICES OFFERED
  • TABLE 195 MAXAR TECHNOLOGIES: OTHER DEVELOPMENTS
  • TABLE 196 MITSUBISHI ELECTRIC CORPORATION: COMPANY OVERVIEW
  • TABLE 197 MITSUBISHI ELECTRIC CORPORATION: PRODUCTS/SOLUTIONS/SERVICES OFFERED
  • TABLE 198 MITSUBISHI ELECTRIC CORPORATION: OTHER DEVELOPMENTS
  • TABLE 199 RTX: COMPANY OVERVIEW
  • TABLE 200 RTX: PRODUCTS/SOLUTIONS/SERVICES OFFERED
  • TABLE 201 RTX: DEALS
  • TABLE 202 RTX: OTHER DEVELOPMENTS
  • TABLE 203 OHB SE: COMPANY OVERVIEW
  • TABLE 204 OHB SE: PRODUCTS/SOLUTIONS/SERVICES OFFERED
  • TABLE 205 OHB SE: DEALS
  • TABLE 206 OHB SE: OTHER DEVELOPMENTS
  • TABLE 207 BOEING: COMPANY OVERVIEW
  • TABLE 208 BOEING: PRODUCTS/SOLUTIONS/SERVICES OFFERED
  • TABLE 209 BOEING: OTHER DEVELOPMENTS
  • TABLE 210 TERRAN ORBITAL CORPORATION: COMPANY OVERVIEW
  • TABLE 211 TERRAN ORBITAL CORPORATION: PRODUCTS/SOLUTIONS/SERVICES OFFERED
  • TABLE 212 TERRAN ORBITAL CORPORATION: PRODUCT LAUNCHES
  • TABLE 213 TERRAN ORBITAL CORPORATION: DEALS
  • TABLE 214 TERRAN ORBITAL CORPORATION: OTHER DEVELOPMENTS
  • TABLE 215 YORK SPACE SYSTEMS: COMPANY OVERVIEW
  • TABLE 216 YORK SPACE SYSTEMS: PRODUCTS/SOLUTIONS/SERVICES OFFERED
  • TABLE 217 YORK SPACE SYSTEMS: OTHER DEVELOPMENTS
  • TABLE 218 AEROSPACELAB: COMPANY OVERVIEW
  • TABLE 219 ENDUROSAT: COMPANY OVERVIEW
  • TABLE 220 NANOAVIONICS: COMPANY OVERVIEW
  • TABLE 221 ASTRANIS: COMPANY OVERVIEW
  • TABLE 222 ICEYE: COMPANY OVERVIEW
  • TABLE 223 PIXXEL: COMPANY OVERVIEW
  • TABLE 224 FLEET SPACE TECHNOLOGIES PTY LTD: COMPANY OVERVIEW
  • TABLE 225 KUIPER SYSTEMS LLC: COMPANY OVERVIEW
  • TABLE 226 ALÉN SPACE: COMPANY OVERVIEW
  • TABLE 227 SKYKRAFT: COMPANY OVERVIEW
  • TABLE 228 ARGOTEC S.R.L.: COMPANY OVERVIEW
  • TABLE 229 SATELLITES MARKET: OTHER MAPPED COMPANIES
LIST OF FIGURES
 
  • FIGURE 1 RESEARCH DESIGN MODEL
  • FIGURE 2 RESEARCH DESIGN
  • FIGURE 3 BOTTOM-UP APPROACH
  • FIGURE 4 TOP-DOWN APPROACH
  • FIGURE 5 DATA TRIANGULATION
  • FIGURE 6 SMALL SEGMENT TO BE LARGEST MARKET DURING FORECAST PERIOD
  • FIGURE 7 COMMUNICATION SEGMENT TO ACCOUNT FOR LARGEST SHARE DURING FORECAST PERIOD
  • FIGURE 8 LEO SEGMENT TO ACQUIRE MAXIMUM SHARE DURING FORECAST PERIOD
  • FIGURE 9 ASIA PACIFIC TO BE LARGEST MARKET IN 2024
  • FIGURE 10 INCREASING USE OF SMALL SATELLITES FOR TRACKING, MONITORING, AND SURVEILLANCE TO DRIVE MARKET GROWTH
  • FIGURE 11 COMMERCIAL SEGMENT TO BE DOMINANT SEGMENT IN 2024
  • FIGURE 12 COMMUNICATION SEGMENT TO LEAD MARKET DURING FORECAST PERIOD
  • FIGURE 13 INDIA TO BE FASTEST-GROWING MARKET DURING FORECAST PERIOD
  • FIGURE 14 SATELLITES MARKET: DRIVERS, RESTRAINTS, OPPORTUNITIES, AND CHALLENGES
  • FIGURE 15 SPACE JUNK ANALYSIS, 2023
  • FIGURE 16 VALUE CHAIN ANALYSIS
  • FIGURE 17 TRENDS & DISRUPTIONS IMPACTING CUSTOMER BUSINESS
  • FIGURE 18 ECOSYSTEM ANALYSIS
  • FIGURE 19 VENTURE CAPITAL FUNDING, 2019–2023 (USD BILLION)
  • FIGURE 20 EQUITY INVESTMENT IN SATELLITES, BY INVESTOR TYPE, 2023
  • FIGURE 21 SATELLITES MARKET: AVERAGE SELLING PRICE, BY REGION, 2020–2023 (USD MILLION)
  • FIGURE 22 INDICATIVE PRICING ANALYSIS, BY SATELLITE MASS
  • FIGURE 23 IMPORT DATA FOR HS CODE 880260-COMPLIANT PRODUCTS, BY COUNTRY, 2020–2023 (USD THOUSAND)
  • FIGURE 24 EXPORT DATA FOR HS CODE 880260-COMPLIANT PRODUCTS, BY COUNTRY, 2020–2023 (USD THOUSAND)
  • FIGURE 25 INFLUENCE OF STAKEHOLDERS ON BUYING PROCESS, BY END USER
  • FIGURE 26 KEY BUYING CRITERIA, BY APPLICATION
  • FIGURE 27 SATELLITES MARKET: BUSINESS MODELS
  • FIGURE 28 BUSINESS MODELS IN SATELLITE MANUFACTURING
  • FIGURE 29 BREAKDOWN OF TOTAL COST OF OWNERSHIP
  • FIGURE 30 OVERALL COST OF OWNERSHIP FOR DIFFERENT SATELLITE PLATFORMS
  • FIGURE 31 BILL OF MATERIALS FOR LARGE SATELLITES
  • FIGURE 32 BILL OF MATERIALS FOR MEDIUM SATELLITES
  • FIGURE 33 BILL OF MATERIALS FOR SMALL SATELLITES
  • FIGURE 34 ADOPTION OF AI IN SPACE
  • FIGURE 35 ADOPTION OF AI IN SPACE, BY TOP COUNTRY
  • FIGURE 36 IMPACT OF AI ON SATELLITE PLATFORMS
  • FIGURE 37 IMPACT OF AI ON SATELLITES MARKET
  • FIGURE 38 TECHNOLOGY ROADMAP
  • FIGURE 39 EVOLUTION OF SATELLITE TECHNOLOGIES
  • FIGURE 40 EMERGING TECHNOLOGY TRENDS
  • FIGURE 41 SATELLITE LAUNCHES, 2025–2030
  • FIGURE 42 TECHNOLOGY TRENDS
  • FIGURE 43 SUPPLY CHAIN ANALYSIS
  • FIGURE 44 PATENT ANALYSIS, 2013–2023
  • FIGURE 45 SATELLITES MARKET, BY SATELLITE MASS, 2024 VS. 2030 (UNITS)
  • FIGURE 46 SATELLITES MARKET, BY APPLICATION, 2024 VS. 2030 (UNITS)
  • FIGURE 47 SATELLITES MARKET, BY END USER, 2024 VS. 2030 (UNITS)
  • FIGURE 48 SATELLITES MARKET, BY ORBIT, 2024 VS. 2030 (UNITS)
  • FIGURE 49 SATELLITES MARKET, BY REGION
  • FIGURE 50 NORTH AMERICA: SATELLITES MARKET SNAPSHOT
  • FIGURE 51 EUROPE: SATELLITES MARKET SNAPSHOT
  • FIGURE 52 ASIA PACIFIC: SATELLITES MARKET SNAPSHOT
  • FIGURE 53 MIDDLE EAST: SATELLITES MARKET SNAPSHOT
  • FIGURE 54 REST OF THE WORLD: SATELLITES MARKET SNAPSHOT
  • FIGURE 55 REVENUE ANALYSIS OF TOP FOUR PLAYERS, 2020–2023 (USD BILLION)
  • FIGURE 56 MARKET SHARE ANALYSIS OF KEY PLAYERS, 2023
  • FIGURE 57 VOLUME ANALYSIS OF SATELLITES LAUNCHED IN 2023
  • FIGURE 58 SATELLITES MARKET: COMPANY EVALUATION MATRIX (KEY PLAYERS), 2023
  • FIGURE 59 COMPANY FOOTPRINT
  • FIGURE 60 SATELLITES MARKET: COMPANY EVALUATION MATRIX (STARTUPS/SMES), 2023
  • FIGURE 61 COMPANY VALUATION, 2023
  • FIGURE 62 EV/EBITDA, 2023
  • FIGURE 63 BRAND/PRODUCT COMPARISON
  • FIGURE 64 LOCKHEED MARTIN CORPORATION: COMPANY SNAPSHOT
  • FIGURE 65 AIRBUS DEFENCE AND SPACE: COMPANY SNAPSHOT
  • FIGURE 66 NORTHROP GRUMMAN: COMPANY SNAPSHOT
  • FIGURE 67 THALES ALENIA SPACE: COMPANY SNAPSHOT
  • FIGURE 68 L3HARRIS TECHNOLOGIES, INC.: COMPANY SNAPSHOT
  • FIGURE 69 MDA: COMPANY SNAPSHOT
  • FIGURE 70 PLANET LABS PBC: COMPANY SNAPSHOT
  • FIGURE 71 MAXAR TECHNOLOGIES: COMPANY SNAPSHOT
  • FIGURE 72 MITSUBISHI ELECTRIC CORPORATION: COMPANY SNAPSHOT
  • FIGURE 73 RTX: COMPANY SNAPSHOT
  • FIGURE 74 OHB SE: COMPANY SNAPSHOT
  • FIGURE 75 BOEING: COMPANY SNAPSHOT
  • FIGURE 76 TERRAN ORBITAL CORPORATION: COMPANY SNAPSHOT

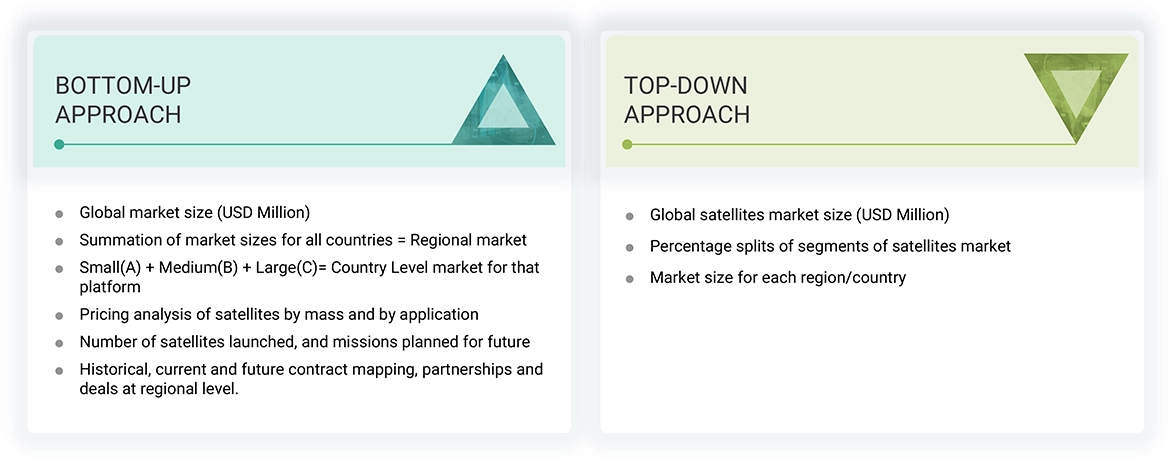
This research study involved the extensive use of secondary sources, directories, and databases, such as D&B Hoovers, Bloomberg Businessweek, and Factiva, to identify and collect useful information on the satellites market. Secondary sources included the space library and product brochures of leading satellite providers. Primary sources included experts from core and related industries, preferred suppliers, manufacturers, solution providers, technology developers, alliances, and organizations related to all segments of the industry’s value chain. All primary sources were interviewed to obtain and verify critical qualitative and quantitative information and assess the prospects of the satellites market. A deductive approach, also known as the bottom-up approach combined with the top-down approach, was used to forecast the market size of different market segments.

Secondary Research

The ranking of companies in the satellites market was carried out using secondary data from paid and unpaid sources and by analyzing their product portfolios and service offerings. These companies were rated based on the performance and quality of their products. The data points were further validated by primary sources.

Secondary sources referred to for this research study included the European Space Agency (ESA), the National Aeronautics and Space Administration (NASA), the United Nations Conference on Trade and Development (UNCTAD), the Satellite Industry Association (SIA), annual reports, investor presentations, and financial statements of trade, business, and professional associations. The secondary data was collected and analyzed to arrive at the overall size of the market, which was validated by primary respondents.

Primary Research

Extensive primary research was conducted after obtaining information about the current scenario of the satellites market through secondary research. Several primary interviews were conducted with market experts from the demand and supply sides across five regions, namely North America, Europe, Asia Pacific, the Middle East, and the Rest of the World. This primary data was collected through questionnaires, emails, and telephonic interviews. These interviews were conducted to gather insights such as market statistics, data on revenue collected from the products and services, market breakdowns, market size estimations, market size forecasting, and data triangulation. They also helped analyze the mass, subsystem, orbit, end user, application, and frequency segments of the market for the regions mentioned above.
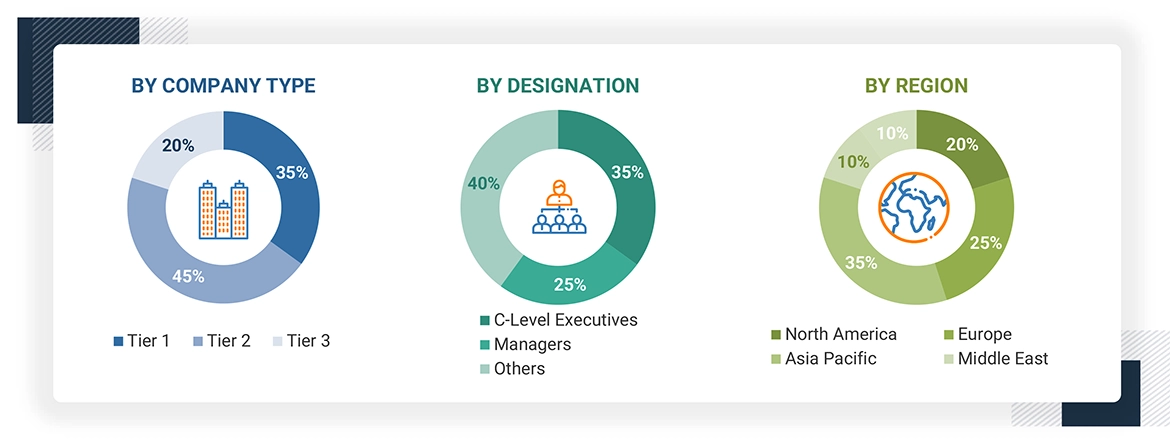
Note: The tier of the companies has been defined based on their total revenue as of 2023: Tier 1 = >USD 1 billion, Tier 2 = USD 100 million to USD 1 billion, and Tier 3 = < USD 100 million.

C-level designations include CEO, COO, and CTO.

Others include sales managers, marketing managers, and product managers.

To know about the assumptions considered for the study, download the pdf brochure

Market Size Estimation

Both the top-down and bottom-up approaches were used to estimate and validate the size of the market. The research methodology used to estimate the market size also includes the following details:

  • Key players were identified through secondary research, and their market ranking was determined through primary and secondary research. This included a study of annual and financial reports of the top market players and extensive interviews of leaders, including CEOs, directors, and marketing executives.
  • All percentage shares, splits, and breakdowns were determined using secondary sources and verified through primary sources. \
  • All possible parameters that affect the market covered in this research study were accounted for, viewed in extensive detail, verified through primary research, and analyzed to obtain the final quantitative and qualitative data. This data was consolidated, enhanced with detailed inputs, analyzed by MarketsandMarkets, and presented in this report.
Data Triangulation

After arriving at the overall size of the satellites market from the market size estimation process explained above, the total market was split into several segments and subsegments. The data triangulation and market breakdown procedures explained below were implemented, wherever applicable, to complete the overall market engineering process and arrive at the exact statistics for various segments and sub-segments of the market. The data was triangulated by studying various factors and trends from both the demand and supply sides. The market size was validated using both top-down and bottom-up approaches.

Market Definition

A satellite is an artificial object placed in orbit around a planet or celestial body to perform specific functions, such as communication, Earth observation, navigation, or scientific research. Satellites collect and transmit data back to Earth, enabling a wide range of applications across industries. The classification includes various subcategories like small, medium and large, based on their mass. Satellites leverages advancements in miniaturization of technology and are launched either independently or as secondary payloads, allowing for cost-effective access to space and opportunities for high-frequency mission updates and constellation deployment. The satellites are typically used by businesses and governments for a variety of applications and depending on their function, satellites operate in different orbits such as low Earth orbit (LEO), medium Earth orbit (MEO), or geostationary orbit (GEO) and other orbits.

Stakeholders

  • Satellite Component Manufacturers
  • Satellite Manufacturers
  • Satellite Integrators
  • Launch Service Providers
  • Government and Civil Organizations Related to Satellite Market
  • Satellite Companies
  • Payload Suppliers
  • Scientific Institutions
  • Meteorological Organizations
  • Component Suppliers
  • Technologists
  • R&D Staff

Report Objectives

  • To define, describe, segment, and forecast the size of the satellite market based on satellite mass, subsystem, end user, application, frequency, orbit, and region
  • To forecast the size of market segments based on five regions: North America, Europe, Asia Pacific, the Middle East, and Rest of the World, along with key countries in each region
  • To identify and analyze key drivers, restraints, opportunities, and challenges influencing the growth of the market
  • To identify industry trends, market trends, and technology trends prevailing in the market
  • To analyze micro markets with respect to individual technological trends, prospects, and their contribution to the overall market
  • To strategically profile key market players and comprehensively analyze their market ranking and core competencies
  • To provide a detailed competitive landscape of the market and analyze competitive growth strategies such as product developments, contracts, partnerships, MOU’s, agreements, and collaborations adopted by key players in the market
  • To identify the detailed financial position, key products, unique selling points, and key developments of leading companies in the market

Previous Versions of this Report

Custom Market Research Services

We Will Customise The Research For You, In Case The Report Listed Above Does Not Meet With Your Requirements

Get 10% Free Customisation

Growth opportunities and latent adjacency in Satellites Market

DMCA.com Protection Status