Recycling Water Filtration Market by Product Type (Sand, Multimedia, Activated Carbon, Membrane Filters), Membrane Type (Reverse Osmosis, Ultrafiltration, Microfiltration, Nanofiltration), Maximum Flow Rate, End User and Region - Global Forecast to 2028
[254 Pages Report] The Recycling water filtration market is expected to grow from an estimated USD 2.7 billion in 2023 to USD 3.8 billion by 2028, at a CAGR of 7.5% during the forecast period. The recycling water filtration market is expanding as recycled water filtration plays a pivotal role across diverse industries, ensuring the quality and purity of water. In oil and gas, efficient water filtration is essential to safeguard equipment and processes, enhancing operational reliability. Power generation facilities rely on advanced filtration systems to maintain the integrity of cooling water, improving equipment's overall efficiency and longevity. In the food and beverage industry, stringent filtration processes are employed to meet stringent quality standards, ensuring the safety and purity of consumables. Water desalination facilities utilize advanced filtration technologies to produce freshwater from seawater, addressing global water scarcity challenges. Additionally, farms employ water filtration systems in agriculture to enhance irrigation efficiency, promoting sustainable and responsible water usage. Across these sectors, water filtration emerges as a critical component, contributing to operational efficiency, product quality, and environmental sustainability.
To know about the assumptions considered for the study, Request for Free Sample Report
To know about the assumptions considered for the study, download the pdf brochure
Recycling water filtration market Dynamics
Driver: Stringent environmental regulations governing wastewater treatment.
The environmental regulations governing wastewater treatment and water quality standards are comprehensive and stringent in the US and Europe. The Clean Water Act in the US empowers the National Pollutant Discharge Elimination System (NPDES) to issue permits to wastewater dischargers. These permits establish precise discharge limits, monitoring protocols, and environmental protection measures to curb harmful pollutants.
Under Title 22, California enforces rigorous standards for reclaimed water discharge and reuse, which is vital for managing water scarcity. Its goals include increasing recycled water use and stormwater utilization significantly by specific targets in 2020 and 2030.
Meanwhile, in the UK and Europe, water quality regulations demand compliance with strict standards set by authorities like the Water Supply Regulations and directives such as the Urban Wastewater Treatment Directive, Shellfish Waters Directive, and Bathing Water Directive. These laws mandate thorough testing, treatment, and monitoring of water sources to ensure they meet specific quality criteria, safeguarding public health and environmental integrity.
Restraints: High-tech complexities in water treatment
According to the national renewable energy laboratory, the emergence of a groundbreaking water treatment technology, low-salt-rejection reverse osmosis, holds significant promise for revolutionizing the recycling water filtration market. As climate change intensifies, resulting in megadroughts and diminishing water supplies, traditional water treatment methods face limitations, especially with super-salty waters that conventional reverse osmosis struggles to handle. As analyzed by the National Alliance for Water Innovation (NAWI), the theoretical design of low-salt-rejection reverse osmosis presents an innovative solution that could efficiently treat highly saline water sources, including wastewater.
In a recent study, NAWI researchers employed a mathematical model powered by a supercomputer to evaluate over 130,000 potential system designs. The results indicate that low-salt-rejection reverse osmosis has the potential to be the most cost-effective choice, reducing the overall cost of producing clean water by up to 63%. The technology's complexity lies in allowing more salt to pass through each membrane, requiring less force and energy. However, recycling still-salty water back into previous membrane stages adds intricacy to the system. Computational analyses conducted in minutes, thanks to high-performance computing, revealed optimal designs for membrane stages and recycling loops, swiftly addressing potential hurdles.
While the theoretical nature of this technology necessitates real-world testing, its potential impact on the recycling water filtration market is significant. Low-salt-rejection reverse osmosis could provide a more affordable and energy-efficient alternative, particularly for water sources containing less than 125 grams of salt per liter. The computational model developed by NAWI expedites the evaluation of this theoretical technology and serves as a valuable tool for researchers and experimentalists in optimizing system designs. As the market seeks advanced solutions to address water scarcity challenges, this high-tech complexity in water treatment could usher in a new era of sustainable and cost-effective recycling water filtration methods.
Opportunity: Growing emphasis on wastewater reuse sustainable water management solutions.
The growing emphasis on wastewater reuse as a sustainable water management solution presents a significant opportunity for addressing the challenges of the rising global population. With approximately 4.2 billion people lacking access to safely managed sanitation services and increasing water demand anticipated to rise by 55 % by 2050, adopting wastewater reuse technologies emerges as a crucial strategy to meet the escalating water needs of a burgeoning population. In regions where water scarcity is a pressing concern, such as Sub-Saharan Africa and other water-stressed areas, reusing treated wastewater can provide a reliable and sustainable source of fresh water. The case of Durban, South Africa, where wastewater equivalent to 13 Olympic-sized swimming pools is treated and reused daily, exemplifies how such initiatives can alleviate water shortages in densely populated urban areas.
Moreover, the circular economy approach of wastewater reuse aligns with the principles of sustainable development, offering potential benefits for millions of people. The recycled water can serve various purposes, including industrial and agricultural uses and occasional potable applications. Compared to alternatives like desalination or inter-basin water transfers, the lower investment costs and reduced energy use associated with wastewater reuse make it an attractive and cost-effective solution for densely populated regions. The economic potential of wastewater reuse is particularly noteworthy, as highlighted by the World Bank's estimate that focusing on low-carbon water and waste in emerging markets could catalyze up to USD 2 trillion in investments and create over 23 million new jobs by 2030. This addresses water challenges and contributes to economic progress, poverty eradication, and sustainable development, aligning with the broader goals of accommodating a growing global population.
When approached as an investment opportunity, municipal waste and water can contribute significantly to economic recovery and job creation, especially in emerging markets. As the world faces increasing water stress, climate change uncertainties, and the imperative to ensure access to water supply and sanitation, wastewater reuse stands out as a transformative and scalable solution. Leveraging private capital through well-structured public-private partnerships, as exemplified by the successful Durban PPP, presents a pathway for governments to address water challenges effectively and create opportunities for sustainable development in the face of a rising global population.
Challenges: Discrepancy between monitoring location and installation site.
Water quality monitoring and control face several challenges that can impact a utility's ability to detect variations in source water quality effectively. Firstly, unanticipated changes in the quality of source water or the presence of unusual contaminants pose a significant challenge. Treatment plants are designed to handle known contaminants, and unexpected water quality alterations may exceed the capacity of existing treatment processes, jeopardizing the utility's compliance with drinking water standards and customer expectations. The dynamic nature of water sources, influenced by factors like weather events, industrial discharges, or agricultural runoff, makes it difficult to predict and address these unanticipated variations.
Secondly, the physical logistics of installing and maintaining monitoring stations at diverse locations within a watershed present a practical challenge. The discrepancy between the monitoring location and the installation site of the monitoring station introduces complexities, especially when source water needs to be transported to a different site for monitoring. Additionally, implementing and sustaining a comprehensive water quality monitoring system on a watershed scale requires collaboration among multiple organizations. While such collaboration offers benefits like extensive geographic coverage and increased monitoring locations, it also demands a sustained commitment from all partners. Challenges may arise if partner organizations withdraw their support, impacting the system's overall effectiveness and potentially leaving gaps in water quality monitoring and control across the watershed. These challenges underscore the need for robust planning, coordination, and long-term commitment to ensure the success and continuity of water quality monitoring and control systems.
Recycling water filtration Market Ecosystem
Notable players in this industry comprise long-standing, financially robust manufacturers of Recycling water filtration Market and related components. These companies have a significant track record in the market, offering a wide range of products, employing cutting-edge technologies, and maintaining robust global sales and marketing networks. Prominent companies in this market include Veolia (France), TORAY INDUSTRIES, INC (Japan), Xylem (US), DuPont (US), KUBOTA Corporation (Japan).
Above 50 cubic meters per hour, is expected to be the second-fastest market, based on Maximum flow rate.
Above 50 cubic meters per hour is the second-fastest section of the recycling water filtration market for numerous reasons. For instance, Across vast mining operations, they treat process water laden with heavy metals and suspended solids, facilitating reuse in activities like washing or dust suppression, thereby minimizing water consumption and environmental impact. Second, large-scale food processing plants employ these filters to reclaim valuable ingredients and treat wastewater for reuse in sanitation and cooling processes, optimizing resource efficiency and reducing waste. Third, Municipal wastewater treatment plants rely on these robust filters as stalwart contributors, efficiently managing large influent volumes and eliminating stubborn contaminants prior to subsequent treatment stages. Finally, Serving as the backbone of large-scale water recycling, these high-flow filters empower industries to operate efficiently, sustainably, and responsibly, all while minimizing their environmental footprint.
Power generation, by end user, to hold the largest market share during the forecast period.
The power generation segment is the largest segment of the recycling water filtration market because ongoing expansion of large thermal power units, accompanied by continuous improvements in their parameters and capacity, has led to significant transformations in the chemical water treatment practices of power plants. Furthermore, this shift is primarily driven by the demanding water quality requirements of high-parameter and large-capacity units, coupled with a growing emphasis on environmental protection. The emergence and application of innovative water treatment technologies and materials offer promising prospects for the advancement of power plant water treatment.
North America is expected to be the second largest market during the forecast period.
The recycling water filtration market in North America is experiencing significant expansion fueled by a combination of factors. Stringent environmental regulations, corporate sustainability endeavors, recent regulatory approvals, emphasizing sustainable development and, substantial government investments, showcases a thriving market propelled by public acceptance of water reuse and ongoing infrastructure projects, and the market growth is driven by collaborative initiatives between the US and Mexico in enhancing wastewater treatment infrastructure and joint efforts to address cross-border environmental challenges. Technological advancements in filtration systems and cost reductions make recycled water more viable and cost competitive.
Key Market Players
The recycling water filtration market is dominated by a few major players that have a wide regional presence. The major players in the Recycling water filtration market are Veolia (France), TORAY INDUSTRIES, INC (Japan), Xylem (US), DuPont (US), KUBOTA Corporation (Japan). Between 2020 and 2023, strategies such as product launches, contracts, agreements, partnerships, collaborations, alliances, acquisitions, and expansions are followed by these companies to capture a larger share of the Recycling water filtration market.
Want to explore hidden markets that can drive new revenue in Recycling Water Filtration Market?
Scope of the Report
Want to explore hidden markets that can drive new revenue in Recycling Water Filtration Market?
Report Metric |
Details |
Market size available for years |
2021–2028 |
Base year considered |
2022 |
Forecast period |
2023–2028 |
Forecast units |
Value (USD) |
Segments Covered |
Product type, membrane type, maximum flow rate, end user, and region |
Geographies covered |
Asia Pacific, North America, Europe, Middle East & Africa, and South America |
Companies covered |
Veolia (France), TORAY INDUSTRIES, INC. (Japan), Xylem (US), DuPont (US), KUBOTA Corporation (Japan), NEWater (China), Hongtek Filtration Co. Ltd. (China), Swati Water Purification (India), REE & Company Engineering Works (India), Filson Filter (China), Pure Aqua, Inc. (US), Milipure Water System (India), MANN+HUMMEL (Germany), Kovalus Separation Solutions (US), Grundfos Holding A/S (Denmark), Synder Filtration, Inc. (US), Fluence Corporation Limited (US), Membranium (Russia), Osmotech Membranes Pvt. Ltd. (India), Imemflo (Germany), Nijhuis Saur Industries (Netherland), Aria Filtra (US), PHILOS Co. Ltd. (South Korea), Vikas Pump (India), and Guangzhou Chunke Environmental Technology Co. Ltd. (China). |
This research report categorizes the Recycling water filtration market by product type, membrane type, end-user, maximum flow rate, and region
On the basis of product type:
- Sand Filters
- Multimedia Filters
- Activated Carbon Filters
- Membrane Filters
On the basis of membrane type:
- Microfiltration (MF) Membranes
- Ultrafiltration (UF) Membranes
- Nanofiltration (NF) Membranes
- Reverse Osmosis (RO) Membrane
On the basis of end-user:
- Oil & Gas Plants
- Power Generation Plants
- Food & Beverage Companies
- Water Desalination Plants
- Farm
On the basis of maximum flow rate:
- Upto 30 Cubic Meters/Hour
- 30–50 Cubic Meters/Hour
- Above 50 Cubic Meters/Hour
On the basis of region:
- Asia Pacific
- Europe
- North America
- Middle East & Africa
- South America
Recent Developments
- In November 2023, in collaboration with REEL, EDF chose Veolia's technological solution to create, produce, and deploy mobile units for treating contaminated water in the event of a nuclear incident. This solution aims to significantly minimize environmental impact by processing the primary circuit water stored in the reactor building tanks on-site in case of a pipe rupture.
- In April 2023, TORAY INDUSTRIES, INC. received an order for reverse osmosis (RO) membranes for Hong Kong's Tseung Kwan O Desalination Plant. This marks Hong Kong's first large desalination plant using RO membranes, with a daily capacity of 135,000 cubic meters, meeting 5% of the city's water demand. Operational by late 2023, plans are in place to increase daily capacity to 270,000 cubic meters.
- In May 2023, Xylem announced the completion of acquiring Evoqua Water Technologies Corp. for USD 7.5 billion. The combination creates the world’s most advanced platform of capabilities to address customers’ and communities’ critical water challenges.
Frequently Asked Questions (FAQ):
What is the current size of the Recycling water filtration market?
The current market size of global Recycling water filtration market is USD 2.7 billion in 2023.
What are the major drivers for Recycling water filtration market?
The global recycling water filtration market is driven by pressing need for sustainable water management.
Which is the largest region during the forecasted period in Recycling water filtration market?
Asia Pacific is the largest market in the recycling water filtration market.
Which is the largest segment, by end user during the forecasted period in Recycling water filtration market?
Power generation dominates the recycling water filtration market end user segment due to ongoing expansion of large thermal power units, accompanied by continuous improvements in their parameters and capacity, has led to significant transformations in the chemical water treatment practices of power plants, and utilization of wastewater for reuse.
Which is the largest segment, by membrane type during the forecasted period in the Recycling water filtration market?
Reverse Osmosis membranes are the most significant segment of the recycling water filtration market by membrane type as they have high filtration precision, and are indispensable for eliminating microscopic impurities, salts, and pollutants, making them essential in industries where stringent water quality standards are paramount. .
To speak to our analyst for a discussion on the above findings, click Speak to Analyst
Exclusive indicates content/data unique to MarketsandMarkets and not available with any competitors.
- 5.1 INTRODUCTION
-
5.2 MARKET DYNAMICSDRIVERS- Pressing need for sustainable water management- Stringent environmental regulations pertaining to wastewater treatmentRESTRAINTS- Lack of effective pricing strategies to ensure financial viability and sustainability- Complexities in water and wastewater treatment plantsOPPORTUNITIES- Ongoing advancements in water treatment technologies- Rising focus on adopting sustainable wastewater management practices- Adoption of circular economy approach to reuse wastewaterCHALLENGES- Discrepancy between monitoring location and installation site- Social and political pressure to ensure affordability and accessibility of water
- 5.3 TRENDS/DISRUPTIONS IMPACTING CUSTOMER’S BUSINESSES
-
5.4 PRICING ANALYSISAVERAGE SELLING PRICE (ASP) TREND OF RECYCLING WATER FILTRATION PRODUCTS, BY TYPE, 2021–2023AVERAGE SELLING PRICE (ASP) TREND OF RECYCLING FILTRATION PRODUCTS, BY MEMBRANE TYPE, 2021–2023AVERAGE SELLING PRICE (ASP) TREND OF RECYCLING WATER FILTRATION PRODUCTS, BY REGION, 2021–2023
-
5.5 VALUE CHAIN ANALYSISRAW MATERIAL PROVIDERSRECYCLING WATER FILTRATION MANUFACTURERSDISTRIBUTORS/RESELLERSEND USERSMAINTENANCE/SERVICE PROVIDERS
- 5.6 ECOSYSTEM ANALYSIS
- 5.7 LIST OF POTENTIAL CUSTOMERS FOR RECYCLING WATER FILTRATION PRODUCTS, BY COUNTRY
- 5.8 RECYCLING WATER FILTRATION FUNDING LANDSCAPE
- 5.9 OPEC COUNTRIES FUNDING FOR INTERNATIONAL DEVELOPMENT IN WATER AND SANITATION SECTOR, 2022
-
5.10 TECHNOLOGY ANALYSISNANOTECHNOLOGYPHOTOCATALYTIC WATER PURIFICATIONAUTOMATED VARIABLE FILTRATIONDIGITALIZATION
-
5.11 PATENT ANALYSISRECYCLING WATER FILTRATION MARKET: INNOVATIONS AND PATENT REGISTRATIONS
-
5.12 TRADE ANALYSISHS CODE 842121- Export data for machinery and apparatus used in water filtering or purifying water applications- Import data for machinery and apparatus used in water filtering or purifying applicationsHS CODE 842199- Export scenario of machinery and apparatus for filtering or purifying liquids or gases- Import data for machinery and apparatus used in liquid or gas filtering or purifying applications
- 5.13 KEY CONFERENCES AND EVENTS, 2023–2024
-
5.14 TARIFFS, STANDARDS, AND REGULATORY LANDSCAPETARIFF RELATED TO RECYCLING WATER FILTRATIONREGULATORY BODIES, GOVERNMENT AGENCIES, AND OTHER ORGANIZATIONSCODES AND REGULATIONS PERTAINING TO RECYCLING WATER FILTRATION MARKET
-
5.15 PORTER’S FIVE FORCES ANALYSISTHREAT OF NEW ENTRANTSBARGAINING POWER OF SUPPLIERSBARGAINING POWER OF BUYERSTHREAT OF SUBSTITUTESINTENSITY OF COMPETITIVE RIVALRY
-
5.16 CASE STUDY ANALYSISFILTERSAFE ASSISTS KIBBUTZ MAAGAN MICHAEL WITH EASY FILTERS THAT HAVE HIGH RECOVERY RATES AND DURABILITYARIA FILTRA AND CHEMTREAT MEXICO OFFER MOBILE TEMPORARY DEPLOYMENT OF MICROFILTRATION AND HIGH-RECOVERY REVERSE OSMOSIS TO MINERA SAN XAVIERNAWI EXPLORES LOW-SALT-REJECTION REVERSE OSMOSIS THAT TREATS HIGHLY SALINE WATER AND OFFERS DRINKABLE WATER
-
5.17 KEY STAKEHOLDERS AND BUYING CRITERIAKEY STAKEHOLDERS IN BUYING PROCESSBUYING CRITERIA
- 6.1 INTRODUCTION
-
6.2 OIL & GAS PLANTSBETTER EFFLUENT QUALITY AND LOW-SLUDGE OUTPUT OFFERED BY MEMBRANE FILTRATION SEPARATION TECHNOLOGY TO BOOST DEMAND
-
6.3 POWER GENERATION PLANTSEXPANSION OF THERMAL POWER UNITS TO DRIVE MARKET
-
6.4 FOOD & BEVERAGE COMPANIESNEED TO ADHERE TO HYGIENE STANDARDS AND PREVENT PRODUCT SPOILAGE TO ACCELERATE DEMAND
-
6.5 WATER DESALINATION PLANTSINCREASING ENVIRONMENTAL CONCERNS ASSOCIATED WITH BRINE DISCHARGE AND CHEMICAL USAGE TO DRIVE MARKET
-
6.6 FARMSRISING UTILIZATION OF REVERSE OSMOSIS SYSTEMS IN CROP IRRIGATION AND LIVESTOCK FARMING TO DRIVE MARKET
- 7.1 INTRODUCTION
-
7.2 SAND FILTERSHIGH AFFORDABILITY AND EXTENDED LIFESPAN TO DRIVE DEMAND
-
7.3 MULTIMEDIA FILTERSABILITY TO TRAP AND RETAIN LARGE QUANTITIES OF PARTICLES THROUGHOUT ENTIRE DEPTH OF FILTER BED TO DRIVE DEMAND
-
7.4 ACTIVATED CARBON FILTERSINCREASING EMPHASIS ON ECO-FRIENDLY PRACTICES TO BOOST DEMAND
-
7.5 MEMBRANE FILTERSABILITY TO SEPARATE EXTRACTS AND SPECIFIC NATURAL ESSENCES AT LOW OR AMBIENT TEMPERATURES TO FOSTER SEGMENTAL GROWTH
- 8.1 INTRODUCTION
-
8.2 UP TO 30 CUBIC METERS/HOURRISING DEPLOYMENT IN FARMS TO BOOST DEMAND
-
8.3 30–50 CUBIC METERS/HOURAQUACULTURE AND TEXTILE MILLS TO OFFER LUCRATIVE GROWTH OPPORTUNITIES TO PLAYERS
-
8.4 ABOVE 50 CUBIC METERS/HOURGROWING DEPLOYMENT IN ENERGY SECTOR TO FILTER WATER IN COOLING TOWERS TO FOSTER SEGMENTAL GROWTH
- 9.1 INTRODUCTION
-
9.2 MICROFILTRATION MEMBRANESABILITY TO REDUCE NEED FOR CHEMICAL ADDITIVES TO TREAT WATER TO DRIVE MARKET
-
9.3 ULTRAFILTRATION MEMBRANESEFFICIENCY IN REMOVING MICROORGANISMS, PARTICULATE MATTER, AND CONTAMINANTS TO FOSTER SEGMENTAL GROWTH
-
9.4 NANOFILTRATION MEMBRANESABILITY TO REMOVE CYSTS AND HUMIC MATERIALS TO BOOST DEMAND
-
9.5 REVERSE OSMOSIS MEMBRANESCOMPLETE REMOVAL OF INORGANIC CONTAMINANTS FROM WATER TO ACCELERATE DEMAND
- 10.1 INTRODUCTION
-
10.2 NORTH AMERICARECESSION IMPACT: NORTH AMERICAUS- Stringent environmental regulations and high-quality of water standards to boost adoptionCANADA- Government Investments and rising construction of water treatment plants to drive marketMEXICO- Strategic Initiatives to curb wastewater spills to boost demand
-
10.3 ASIA PACIFICRECESSION IMPACT: ASIA PACIFICCHINA- Emergence of “blue water factories” to drive marketINDIA- Increasing Urbanization and Population Growth to drive marketJAPAN- Adoption of decentralized wastewater treatment systems to boost demandSOUTH KOREA- International collaborations and focus on sustainable technologies to propel marketREST OF ASIA PACIFIC
-
10.4 EUROPERECESSION IMPACT: EUROPEUK- Stringent regulations and rising campaigns to address water pollution-related issues to drive marketGERMANY- Stringent legal provisions of Federal Water Act to boost demandFRANCE- Growing awareness of increasing water crisis to drive demandITALY- Increasing emphasis on improving water management practices to accelerate demandSPAIN- Rising use of treated wastewater in irrigation applications to drive market- Rest of Europe
-
10.5 MIDDLE EAST & AFRICARECESSION IMPACT: MIDDLE EAST & AFRICAGCC COUNTRIES- UAE- Saudi Arabia- Rest of GCC countriesSOUTH AFRICA- Growing importance of investing in advanced water reuse technologies to drive marketREST OF MIDDLE EAST & AFRICA
-
10.6 SOUTH AMERICARECESSION IMPACT: SOUTH AMERICABRAZIL- Drought conditions and low reservoirs to offer lucrative growth opportunities to playersARGENTINA- Ongoing expansions of water treatment systems to drive marketPERU- Increased construction of new water treatment plants to drive marketREST OF SOUTH AMERICA
- 11.1 OVERVIEW
- 11.2 STRATEGIES ADOPTED BY MAJOR PLAYERS, 2019
- 11.3 MARKET SHARE ANALYSIS
- 11.4 REVENUE SHARE ANALYSIS, 2018–2022
-
11.5 COMPANY EVALUATION MATRIX: KEY PLAYERS, 2022STARSEMERGING LEADERSPERVASIVE PLAYERSPARTICIPANTSCOMPANY FOOTPRINT- Product type footprint- Membrane type footprint- End user footprint- Region Footprint- Overall company footprint
-
11.6 COMPANY EVALUATION MATRIX: STARTUPS/SMALL AND MEDIUM-SIZED ENTERPRISES (SMES), 2022PROGRESSIVE COMPANIESRESPONSIVE COMPANIESDYNAMIC COMPANIESSTARTING BLOCKSCOMPETITIVE BENCHMARKING- Competitive benchmarking of key startups/SMEs- Detailed list of key startups/SMEs
-
11.7 COMPETITIVE SCENARIOS AND TRENDSDEALS, JANUARY 2019–NOVEMBER 2023OTHERS, JANUARY 2019–JANUARY 2023
- 11.8 VALUATION AND FINANCIAL METRICS OF KEY RECYCLING WATER FILTRATION VENDORS
- 11.9 BRAND/PRODUCT COMPARATIVE ANALYSIS
-
12.1 KEY PLAYERSVEOLIA- Business overview- Products/Solutions/Services offered- Recent developments- MnM viewFLUENCE CORPORATION LIMITED- Business overview- Products/Solutions/Services offered- Recent developmentsKOVALUS SEPARATION SOLUTIONS- Business overview- Products/Solutions/Services offered- Recent developmentsXYLEM- Business overview- Products/Solutions/Services offered- Recent developments- MnM viewPURE AQUA, INC.- Business overview- Products/Solutions/Services offeredMANN + HUMMEL- Business overview- Products/Solutions/Services offeredOSMOTECH MEMBRANES PVT. LTD.- Business overview- Products/Solutions/Services offeredNEWATER- Business overview- Products/Solutions/Services offeredTORAY INDUSTRIES, INC- Business overview- Products/Solutions/Services offered- Recent developments- MnM viewSYNDER FILTRATION, INC.- Business overview- Products/Solutions/Services offered- Recent developmentsPHILOS CO., LTD.- Business overview- Products/Solutions/Services offered- Recent developmentsDUPONT- Business overview- Products/Solutions/Services offered- Recent developments- MnM viewKUBOTA CORPORATION- Business overview- Products/Solutions/Services offered- Recent developments- MnM viewVIKAS PUMP- Business overview- Products/Solutions/Services offeredFILSON FILTER- Business overview- Products/Solutions/Services offeredGUANGZHOU CHUNKE ENVIRONMENTAL TECHNOLOGY CO. LTD.- Business overview- Products/Solutions/Services offeredARIA FILTRA- Business overview- Products/Solutions/Services offered- Recent developmentsGRUNDFOS HOLDING A/S- Business overview- Products/Solutions/Services offered- Recent developmentsNIJHUIS SAUR INDUSTRIES- Business overview- Products/Solutions/Services offered- Recent developmentsHONGTEK FILTRATION CO., LTD.- Business overview- Products/Solutions/Services offered
-
12.2 OTHER PLAYERSMILIPURE WATER SYSTEMSWATI WATER PURIFICATIONREE & COMPANY ENGINEERING WORKSIMEMFLOMEMBRANIUM
- 13.1 INSIGHTS FROM INDUSTRY EXPERTS
- 13.2 DISCUSSION GUIDE
- 13.3 KNOWLEDGESTORE: MARKETSANDMARKETS’ SUBSCRIPTION PORTAL
- 13.4 CUSTOMIZATION OPTIONS
- 13.5 RELATED REPORTS
- 13.6 AUTHOR DETAILS
- TABLE 1 RECYCLING WATER FILTRATION MARKET SNAPSHOT
- TABLE 2 AVERAGE SELLING PRICE (ASP) TREND OF RECYCLING WATER FILTRATION PRODUCTS, BY TYPE, 2021–2023 (USD/UNIT)
- TABLE 3 AVERAGE SELLING PRICE (ASP) TREND OF RECYCLING FILTRATION PRODUCTS, BY MEMBRANE TYPE, 2021–2023 (USD/UNIT)
- TABLE 4 AVERAGE SELLING PRICE (ASP) TREND OF RECYCLING WATER FILTRATION PRODUCTS, BY REGION, 2021–2023 (USD/UNIT)
- TABLE 5 COMPANIES AND THEIR ROLES IN RECYCLING WATER FILTRATION ECOSYSTEM
- TABLE 6 MARKET: POTENTIAL CUSTOMERS
- TABLE 7 XYLEM INC.: FUNDING DETAILS
- TABLE 8 FLUENCE CORPORATION LIMITED: FUNDING DETAILS
- TABLE 9 ZWITTERCO.: FUNDING DETAILS
- TABLE 10 EXPORT DATA FOR HS CODE 842121-COMPLIANT PRODUCTS, BY COUNTRY, 2020–2022 (USD THOUSAND)
- TABLE 11 IMPORT DATA FOR HS CODE 842121-COMPLIANT PRODUCTS, BY COUNTRY, 2020–2022 (USD THOUSAND)
- TABLE 12 EXPORT DATA FOR HS CODE 842199-COMPLIANT PRODUCTS, BY COUNTRY, 2020–2022 (USD THOUSAND)
- TABLE 13 IMPORT SCENARIO FOR HS CODE 842199-COMPLIANT PRODUCTS, BY COUNTRY, 2020–2022 (USD THOUSAND)
- TABLE 14 MARKET: LIST OF CONFERENCES AND EVENTS, 2023–2024
- TABLE 15 IMPORT TARIFF FOR HS CODE 842121-COMPLIANT PRODUCTS, 2022
- TABLE 16 IMPORT TARIFF FOR HS CODE 842199-COMPLIANT PRODUCTS, 2022
- TABLE 17 NORTH AMERICA: REGULATORY BODIES, GOVERNMENT AGENCIES, AND OTHER ORGANIZATIONS
- TABLE 18 EUROPE: REGULATORY BODIES, GOVERNMENT AGENCIES, AND OTHER ORGANIZATIONS
- TABLE 19 ASIA PACIFIC: REGULATORY BODIES, GOVERNMENT AGENCIES, AND OTHER ORGANIZATIONS
- TABLE 20 SOUTH AMERICA: REGULATORY BODIES, GOVERNMENT AGENCIES, AND OTHER ORGANIZATIONS
- TABLE 21 MIDDLE EAST & AFRICA: REGULATORY BODIES, GOVERNMENT AGENCIES, AND OTHER ORGANIZATIONS
- TABLE 22 GLOBAL: REGULATORY BODIES, GOVERNMENT AGENCIES, AND OTHER ORGANIZATIONS
- TABLE 23 NORTH AMERICA: CODES AND REGULATIONS
- TABLE 24 ASIA PACIFIC: CODES AND REGULATIONS
- TABLE 25 SOUTH AMERICA: CODES AND REGULATIONS
- TABLE 26 MIDDLE EAST & AFRICA: CODES AND REGULATIONS
- TABLE 27 GLOBAL: CODES AND REGULATIONS
- TABLE 28 MARKET: PORTER’S FIVE FORCES ANALYSIS
- TABLE 29 INFLUENCE OF STAKEHOLDERS ON BUYING PROCESS FOR TOP THREE END USERS
- TABLE 30 KEY BUYING CRITERIA FOR TOP THREE END USERS
- TABLE 31 MARKET, BY END USER, 2021–2028 (USD MILLION)
- TABLE 32 MARKET, BY END USER, 2021–2028 (THOUSAND UNITS)
- TABLE 33 OIL & GAS PLANTS: MARKET, BY REGION, 2021–2028 (USD MILLION)
- TABLE 34 OIL & GAS PLANTS: MARKET, BY REGION, 2021–2028 (THOUSAND UNITS)
- TABLE 35 POWER GENERATION PLANTS: MARKET, BY REGION, 2021–2028 (USD MILLION)
- TABLE 36 POWER GENERATION PLANTS: MARKET, BY REGION, 2021–2028 (THOUSAND UNITS)
- TABLE 37 FOOD & BEVERAGE COMPANIES: MARKET, BY REGION, 2021–2028 (USD MILLION)
- TABLE 38 FOOD & BEVERAGE COMPANIES: MARKET, BY REGION, 2021–2028 (THOUSAND UNITS)
- TABLE 39 WATER DESALINATION PLANTS: MARKET, BY REGION, 2021–2028 (USD MILLION)
- TABLE 40 WATER DESALINATION PLANTS: MARKET, BY REGION, 2021–2028 (THOUSAND UNITS)
- TABLE 41 FARMS: MARKET, BY REGION, 2021–2028 (USD MILLION)
- TABLE 42 FARMS: MARKET, BY REGION, 2021–2028 (THOUSAND UNITS)
- TABLE 43 MARKET, BY PRODUCT TYPE, 2021–2028 (USD MILLION)
- TABLE 44 MARKET, BY PRODUCT TYPE, 2021–2028 (THOUSAND UNITS)
- TABLE 45 SAND FILTERS: MARKET, BY REGION, 2021–2028 (USD MILLION)
- TABLE 46 SAND FILTERS: MARKET, BY REGION, 2021–2028 (THOUSAND UNITS)
- TABLE 47 MULTIMEDIA FILTERS: MARKET, BY REGION, 2021–2028 (USD MILLION)
- TABLE 48 MULTIMEDIA FILTERS: MARKET, BY REGION, 2021–2028 (THOUSAND UNITS)
- TABLE 49 ACTIVATED CARBON FILTERS: MARKET, BY REGION, 2021–2028 (USD MILLION)
- TABLE 50 ACTIVATED CARBON FILTERS: MARKET, BY REGION, 2021–2028 (THOUSAND UNITS)
- TABLE 51 MEMBRANE FILTERS: MARKET, BY REGION, 2021–2028 (USD MILLION)
- TABLE 52 MEMBRANE FILTERS: MARKET, BY REGION, 2021–2028 (THOUSAND UNITS)
- TABLE 53 MARKET, BY MAXIMUM FLOW RATE, 2021–2028 (USD MILLION)
- TABLE 54 UP TO 30 CUBIC METERS/HOUR: MARKET, BY REGION, 2021–2028 (USD MILLION)
- TABLE 55 30–50 CUBIC METERS/HOUR: MARKET, BY REGION, 2021–2028 (USD MILLION)
- TABLE 56 ABOVE 50 CUBIC METERS/HOUR: MARKET, BY REGION, 2021–2028 (USD MILLION)
- TABLE 57 MARKET, BY MEMBRANE TYPE, 2021–2028 (USD MILLION)
- TABLE 58 MARKET, BY MEMBRANE TYPE, 2021–2028 (THOUSAND UNITS)
- TABLE 59 MICROFILTRATION MEMBRANES: MARKET, BY REGION, 2021–2028 (USD MILLION)
- TABLE 60 MICROFILTRATION MEMBRANES: MARKET, BY REGION, 2021–2028 (THOUSAND UNITS)
- TABLE 61 ULTRAFILTRATION MEMBRANES: MARKET, BY REGION, 2021–2028 (USD MILLION)
- TABLE 62 ULTRAFILTRATION MEMBRANES: MARKET, BY REGION, 2021–2028 (THOUSAND UNITS)
- TABLE 63 NANOFILTRATION MEMBRANES: MARKET, BY REGION, 2021–2028 (USD MILLION)
- TABLE 64 NANOFILTRATION MEMBRANES: MARKET, BY REGION, 2021–2028 (THOUSAND UNITS)
- TABLE 65 REVERSE OSMOSIS MEMBRANES: MARKET, BY REGION, 2021–2028 (USD MILLION)
- TABLE 66 REVERSE OSMOSIS MEMBRANES: MARKET, BY REGION, 2021–2028 (THOUSAND UNITS)
- TABLE 67 MARKET, BY REGION, 2021–2028 (USD MILLION)
- TABLE 68 MARKET, BY REGION, 2021–2028 (THOUSAND UNITS)
- TABLE 69 NORTH AMERICA: MARKET, BY PRODUCT TYPE, 2021–2028 (USD MILLION)
- TABLE 70 NORTH AMERICA: MARKET, BY MEMBRANE TYPE, 2021–2028 (USD MILLION)
- TABLE 71 NORTH AMERICA: MARKET, BY MAXIMUM FLOW RATE, 2021–2028 (USD MILLION)
- TABLE 72 NORTH AMERICA: MARKET, BY END USER, 2021–2028 (USD MILLION)
- TABLE 73 NORTH AMERICA: MARKET, BY COUNTRY, 2021–2028 (USD MILLION)
- TABLE 74 US: MARKET, BY END USER, 2021–2028 (USD MILLION)
- TABLE 75 CANADA: MARKET, BY END USER, 2021–2028 (USD MILLION)
- TABLE 76 MEXICO: MARKET, BY END USER, 2021–2028 (USD MILLION)
- TABLE 77 ASIA PACIFIC: MARKET, BY PRODUCT TYPE, 2021–2028 (USD MILLION)
- TABLE 78 ASIA PACIFIC: MARKET, BY MEMBRANE TYPE, 2021–2028 (USD MILLION)
- TABLE 79 ASIA PACIFIC: MARKET, BY MAXIMUM FLOW RATE, 2021–2028 (USD MILLION)
- TABLE 80 ASIA PACIFIC: MARKET, BY END USER, 2021–2028 (USD MILLION)
- TABLE 81 ASIA PACIFIC: MARKET, BY COUNTRY, 2021–2028 (USD MILLION)
- TABLE 82 CHINA: MARKET, BY END USER, 2021–2028 (USD MILLION)
- TABLE 83 INDIA: MARKET, BY END USER, 2021–2028 (USD MILLION)
- TABLE 84 JAPAN: MARKET, BY END USER, 2021–2028 (USD MILLION)
- TABLE 85 SOUTH KOREA: MARKET, BY END USER, 2021–2028 (USD MILLION)
- TABLE 86 REST OF ASIA PACIFIC: MARKET, BY END USER, 2021–2028 (USD MILLION)
- TABLE 87 EUROPE: MARKET, BY PRODUCT TYPE, 2021–2028 (USD MILLION)
- TABLE 88 EUROPE: MARKET, BY MEMBRANE TYPE, 2021–2028 (USD MILLION)
- TABLE 89 EUROPE: MARKET, BY END USER, 2021–2028 (USD MILLION)
- TABLE 90 EUROPE: MARKET, BY MAXIMUM FLOW RATE, 2021–2028 (USD MILLION)
- TABLE 91 EUROPE: MARKET, BY COUNTRY, 2021–2028 (USD MILLION)
- TABLE 92 UK: MARKET, BY END USER, 2021–2028 (USD MILLION)
- TABLE 93 GERMANY: MARKET, BY END USER, 2021–2028 (USD MILLION)
- TABLE 94 FRANCE: MARKET, BY END USER, 2021–2028 (USD MILLION)
- TABLE 95 ITALY: MARKET, BY END USER, 2021–2028 (USD MILLION)
- TABLE 96 SPAIN: MARKET, BY END USER, 2021–2028 (USD MILLION)
- TABLE 97 REST OF EUROPE: MARKET, BY END USER, 2021–2028 (USD MILLION)
- TABLE 98 MIDDLE EAST & AFRICA: MARKET, BY PRODUCT TYPE, 2021–2028 (USD MILLION)
- TABLE 99 MIDDLE EAST & AFRICA: MARKET, BY MEMBRANE TYPE, 2021–2028 (USD MILLION)
- TABLE 100 MIDDLE EAST & AFRICA: MARKET, BY END USER, 2021–2028 (USD MILLION)
- TABLE 101 MIDDLE EAST & AFRICA: MARKET, BY MAXIMUM FLOW RATE, 2021–2028 (USD MILLION)
- TABLE 102 MIDDLE EAST & AFRICA: MARKET, BY COUNTRY, 2021–2028 (USD MILLION)
- TABLE 103 GCC COUNTRIES: MARKET, BY COUNTRY, 2021–2028 (USD MILLION)
- TABLE 104 GCC COUNTRIES: MARKET, BY END USER, 2021–2028 (USD MILLION)
- TABLE 105 UAE: MARKET, BY END USER, 2021–2028 (USD MILLION)
- TABLE 106 SAUDI ARABIA: MARKET, BY END USER, 2021–2028 (USD MILLION)
- TABLE 107 REST OF GCC COUNTRIES: MARKET, BY END USER, 2021–2028 (USD MILLION)
- TABLE 108 SOUTH AFRICA: MARKET, BY END USER, 2021–2028 (USD MILLION)
- TABLE 109 REST OF MIDDLE EAST & AFRICA: MARKET, BY END USER, 2021–2028 (USD MILLION)
- TABLE 110 SOUTH AMERICA: MARKET, BY PRODUCT TYPE, 2021–2028 (USD MILLION)
- TABLE 111 SOUTH AMERICA: MARKET, BY MEMBRANE TYPE, 2021–2028 (USD MILLION)
- TABLE 112 SOUTH AMERICA: MARKET, BY END USER, 2021–2028 (USD MILLION)
- TABLE 113 SOUTH AMERICA: MARKET, BY MAXIMUM FLOW RATE, 2021–2028 (USD MILLION)
- TABLE 114 SOUTH AMERICA: MARKET, BY COUNTRY, 2021–2028 (USD MILLION)
- TABLE 115 BRAZIL: MARKET, BY END USER, 2021–2028 (USD MILLION)
- TABLE 116 ARGENTINA: MARKET, BY END USER, 2021–2028 (USD MILLION)
- TABLE 117 PERU: MARKET, BY END USER, 2021–2028 (USD MILLION)
- TABLE 118 REST OF SOUTH AMERICA: MARKET, BY END USER, 2021–2028 (USD MILLION)
- TABLE 119 MARKET: OVERVIEW OF STRATEGIES DEPLOYED BY KEY PLAYERS, 2019–2022
- TABLE 120 MARKET: DEGREE OF COMPETITION
- TABLE 121 PRODUCT TYPE FOOTPRINT
- TABLE 122 MEMBRANE TYPE FOOTPRINT
- TABLE 123 END USER FOOTPRINT
- TABLE 124 REGION FOOTPRINT
- TABLE 125 OVERALL COMPANY FOOTPRINT
- TABLE 126 MARKET: COMPETITIVE BENCHMARKING OF KEY STARTUPS/SMES
- TABLE 127 MARKET: DETAILED LIST OF KEY STARTUPS/SMES
- TABLE 128 MARKET: DEALS, JANUARY 2019– NOVEMBER 2023
- TABLE 129 MARKET: OTHERS, JANUARY 2019– JANUARY 2023
- TABLE 130 VEOLIA: COMPANY OVERVIEW
- TABLE 131 VEOLIA: PRODUCTS/SOLUTIONS/SERVICES OFFERED
- TABLE 132 VEOLIA: DEALS
- TABLE 133 FLUENCE CORPORATION LIMITED: COMPANY OVERVIEW
- TABLE 134 FLUENCE CORPORATION LIMITED: PRODUCTS/SOLUTIONS/SERVICES OFFERED
- TABLE 135 FLUENCE CORPORATION LIMITED: DEALS
- TABLE 136 KOVALUS SEPARATION SOLUTIONS: COMPANY OVERVIEW
- TABLE 137 KOVALUS SEPARATION SOLUTIONS: PRODUCTS/SOLUTIONS/SERVICES OFFERED
- TABLE 138 KOVALUS SEPARATION SOLUTIONS: PRODUCT LAUNCHES
- TABLE 139 KOVALUS SEPARATION SOLUTIONS: DEALS
- TABLE 140 KOVALUS SEPARATION SOLUTIONS: OTHERS
- TABLE 141 XYLEM INC.: COMPANY OVERVIEW
- TABLE 142 XYLEM INC.: PRODUCTS/SOLUTIONS/SERVICES OFFERED
- TABLE 143 XYLEM INC.: DEALS
- TABLE 144 XYLEM INC.: OTHERS
- TABLE 145 PURE AQUA, INC.: COMPANY OVERVIEW
- TABLE 146 PURE AQUA, INC.: PRODUCTS/SOLUTIONS/SERVICES OFFERED
- TABLE 147 MANN+HUMMEL: COMPANY OVERVIEW
- TABLE 148 MANN+HUMMEL: PRODUCTS/SOLUTIONS/SERVICES OFFERED
- TABLE 149 OSMOTECH MEMBRANES PVT. LTD.: COMPANY OVERVIEW
- TABLE 150 OSMOTECH MEMBRANES PVT. LTD.: PRODUCTS/SOLUTIONS/SERVICES OFFERED
- TABLE 151 NEWATER: COMPANY OVERVIEW
- TABLE 152 NEWATER: PRODUCTS/SOLUTIONS/SERVICES OFFERED
- TABLE 153 TORAY INDUSTRIES, INC.: COMPANY OVERVIEW
- TABLE 154 TORAY INDUSTRIES, INC.: PRODUCTS/SOLUTIONS/SERVICES OFFERED
- TABLE 155 TORAY INDUSTRIES, INC.: PRODUCT LAUNCHES
- TABLE 156 TORAY INDUSTRIES, INC.: DEALS
- TABLE 157 TORAY INDUSTRIES, INC.: OTHERS
- TABLE 158 SYNDER FILTRATION, INC.: COMPANY OVERVIEW
- TABLE 159 SYNDER FILTRATION, INC.: PRODUCTS/SOLUTIONS/SERVICES OFFERED
- TABLE 160 SYNDER FILTRATION, INC.: PRODUCT LAUNCHES
- TABLE 161 SYNDER FILTRATION, INC.: OTHERS
- TABLE 162 PHILOS CO., LTD.: COMPANY OVERVIEW
- TABLE 163 PHILOS CO., LTD.: PRODUCTS/SOLUTIONS/SERVICES OFFERED
- TABLE 164 PHILOS CO., LTD.: PRODUCT LAUNCHES
- TABLE 165 PHILOS CO., LTD.: DEALS
- TABLE 166 DUPONT: COMPANY OVERVIEW
- TABLE 167 DUPONT: PRODUCTS/SOLUTIONS/SERVICES OFFERED
- TABLE 168 DUPONT: DEALS
- TABLE 169 KUBOTA CORPORATION: COMPANY OVERVIEW
- TABLE 170 KUBOTA CORPORATION: PRODUCTS/SOLUTIONS/SERVICES OFFERED
- TABLE 171 KUBOTA CORPORATION: DEALS
- TABLE 172 KUBOTA CORPORATION: OTHERS
- TABLE 173 VIKAS PUMP: COMPANY OVERVIEW
- TABLE 174 VIKAS PUMP: PRODUCTS/SOLUTIONS/SERVICES OFFERED
- TABLE 175 FILSON FILTER: COMPANY OVERVIEW
- TABLE 176 FILSON FILTER: PRODUCTS/SOLUTIONS/SERVICES OFFERED
- TABLE 177 GUANGZHOU CHUNKE ENVIRONMENTAL TECHNOLOGY CO. LTD.: COMPANY OVERVIEW
- TABLE 178 NGZHOU CHUNKE ENVIRONMENTAL TECHNOLOGY CO. LTD.: PRODUCTS/SOLUTIONS/SERVICES OFFERED
- TABLE 179 ARIA FILTRA: COMPANY OVERVIEW
- TABLE 180 ARIA FILTRA: PRODUCTS/SOLUTIONS/SERVICES OFFERED
- TABLE 181 ARIA FILTRA: OTHERS
- TABLE 182 GRUNDFOS HOLDING A/S: COMPANY OVERVIEW
- TABLE 183 GRUNDFOS HOLDING A/S: PRODUCTS/SOLUTIONS/SERVICES OFFERED
- TABLE 184 GRUNDFOS HOLDING A/S: OTHERS
- TABLE 185 NIJHUIS SAUR INDUSTRIES: COMPANY OVERVIEW
- TABLE 186 NIJHUIS SAUR INDUSTRIES: PRODUCTS/SOLUTIONS/SERVICES OFFERED
- TABLE 187 NIJHUIS SAUR INDUSTRIES: DEALS
- TABLE 188 HONGTEK FILTRATION CO., LTD: COMPANY OVERVIEW
- TABLE 189 HONGTEK FILTRATION CO., LTD: PRODUCTS/SOLUTIONS/SERVICES OFFERED
- FIGURE 1 MARKET: RESEARCH DESIGN
- FIGURE 2 DATA TRIANGULATION
- FIGURE 3 MAIN METRICS CONSIDERED TO ANALYZE AND ASSESS DEMAND FOR RECYCLING WATER FILTRATIONS
- FIGURE 4 MARKET SIZE ESTIMATION METHODOLOGY: BOTTOM-UP APPROACH
- FIGURE 5 MARKET SIZE ESTIMATION METHODOLOGY: TOP-DOWN APPROACH
- FIGURE 6 KEY STEPS CONSIDERED TO ASSESS SUPPLY OF RECYCLING WATER FILTRATION PRODUCTS
- FIGURE 7 MARKET: SUPPLY-SIDE ANALYSIS
- FIGURE 8 COMPANY REVENUE ANALYSIS, 2022
- FIGURE 9 ASIA PACIFIC TO REGISTER HIGHEST CAGR IN MARKET DURING FORECAST PERIOD
- FIGURE 10 MEMBRANE FILTERS TO CAPTURE LARGEST MARKET SHARE THROUGHOUT FORECAST PERIOD
- FIGURE 11 REVERSE OSMOSIS MEMBRANES SEGMENT TO DOMINATE MARKET FROM 2023 TO 2028
- FIGURE 12 POWER GENERATION PLANTS SEGMENT TO SECURE LARGEST MARKET SHARE DURING FORECAST PERIOD
- FIGURE 13 30–50 CUBIC METERS/HOUR SEGMENT TO DISPLAY HIGHEST CAGR FROM 2023 TO 2028
- FIGURE 14 GROWING WATER SCARCITY CONCERNS TO DRIVE MARKET
- FIGURE 15 ASIA PACIFIC TO REGISTER HIGHEST CAGR DURING FORECAST PERIOD
- FIGURE 16 POWER GENERATION PLANTS SEGMENT AND CHINA DOMINATED MARKET IN ASIA PACIFIC IN 2023
- FIGURE 17 MEMBRANE FILTERS TO HOLD LARGEST MARKET SHARE IN 2028
- FIGURE 18 REVERSE OSMOSIS MEMBRANES SEGMENT TO SECURE LARGEST MARKET SHARE IN 2028
- FIGURE 19 POWER GENERATION PLANTS TO DOMINATE MARKET IN 2028
- FIGURE 20 30–50 CUBIC METERS/HOUR SEGMENT TO HOLD LARGEST MARKET SHARE FROM 2023 TO 2028
- FIGURE 21 MARKET: DRIVERS, RESTRAINTS, OPPORTUNITIES, AND CHALLENGES
- FIGURE 22 GLOBAL WATER CONSUMPTION IN ENERGY SECTOR, BY FUEL AND POWER GENERATION TYPE, 2021 AND 2030
- FIGURE 23 DATA ON ASIA PACIFIC COUNTRIES REPORTING >80% COST RECOVERY OF O&M COSTS FROM WATER SUPPLY AND SANITATION TARIFFS, 2018
- FIGURE 24 NUMBER OF PROJECTS WITH PRIVATE CAPITAL IN CENTRAL ASIA, BY SECTOR, 1990–2021
- FIGURE 25 TOTAL INVESTMENT WITH PRIVATE CAPITAL PARTICIPATION IN CENTRAL ASIA, BY SECTOR, 1990–2021
- FIGURE 26 TRENDS/DISRUPTIONS IMPACTING CUSTOMER’S BUSINESS
- FIGURE 27 AVERAGE SELLING PRICE (ASP) TREND OF RECYCLING WATER FILTRATION PRODUCTS, BY TYPE, 2021–2023
- FIGURE 28 AVERAGE SELLING PRICE (ASP) TREND OF RECYCLING FILTRATION PRODUCTS, BY MEMBRANE TYPE, 2021–2023
- FIGURE 29 AVERAGE SELLING PRICE (ASP) TREND OF RECYCLING WATER FILTRATION PRODUCTS, BY REGION, 2021–2023
- FIGURE 30 MARKET: VALUE CHAIN ANALYSIS
- FIGURE 31 MARKET: ECOSYSTEM ANALYSIS
- FIGURE 32 FUNDING FOR PLAYERS IN RECYCLING WATER FILTRATION MARKET
- FIGURE 33 FUNDING RAISED BY OPEC COUNTRIES FUNDING FOR INTERNATIONAL DEVELOPMENT IN WATER AND SANITATION SECTOR, 2022
- FIGURE 34 INNOVATIONS AND PATENT REGISTRATIONS PERTAINING TO RECYCLING WATER FILTRATION PRODUCTS, 2013–2022
- FIGURE 35 EXPORT DATA FOR HS CODE 842121-COMPLIANT PRODUCTS, BY COUNTRY, 2020–2022 (USD THOUSAND)
- FIGURE 36 IMPORT DATA FOR HS CODE 842121-COMPLIANT PRODUCTS, BY COUNTRY, 2020–2022 (USD THOUSAND)
- FIGURE 37 EXPORT DATA FOR HS CODE 842199-COMPLIANT PRODUCTS, BY COUNTRY, 2020–2022 (USD THOUSAND)
- FIGURE 38 IMPORT DATA FOR HS CODE 842199-COMPLIANT PRODUCTS, 2020–2022 (USD THOUSAND)
- FIGURE 39 RECYCLING WATER FILTRATION MARKET: PORTER’S FIVE FORCES ANALYSIS
- FIGURE 40 INFLUENCE OF KEY STAKEHOLDERS ON BUYING PROCESS FOR TOP THREE END USERS
- FIGURE 41 KEY BUYING CRITERIA FOR TOP THREE END USERS
- FIGURE 42 RECYCLING WATER FILTRATION MARKET SHARE, BY END USER, 2022
- FIGURE 43 RECYCLING WATER FILTRATION MARKET SHARE, BY PRODUCT TYPE, 2022
- FIGURE 44 RECYCLING WATER FILTRATION MARKET SHARE, BY MAXIMUM FLOW RATE, 2022
- FIGURE 45 RECYCLING WATER FILTRATION MARKET SHARE, BY MEMBRANE TYPE, 2022
- FIGURE 46 ASIA PACIFIC TO DISPLAY HIGHEST CAGR IN GLOBAL RECYCLING WATER FILTRATION MARKET FROM 2023 TO 2028
- FIGURE 47 RECYCLING WATER FILTRATION MARKET, BY REGION, 2022
- FIGURE 48 NORTH AMERICA: RECYCLING WATER FILTRATION MARKET SNAPSHOT
- FIGURE 49 ASIA PACIFIC: RECYCLING WATER FILTRATION MARKET SNAPSHOT
- FIGURE 50 RECYCLING WATER FILTRATION MARKET SHARE ANALYSIS, 2022
- FIGURE 51 RECYCLING WATER FILTRATION MARKET: REVENUE ANALYSIS OF TOP FIVE PLAYERS, 2018–2022
- FIGURE 52 RECYCLING WATER FILTRATION MARKET: COMPANY EVALUATION MATRIX, (KEY PLAYERS) 2022
- FIGURE 53 RECYCLING WATER FILTRATION MARKET: START-UP/SME EVALUATION MATRIX (KEY PLAYERS), 2022
- FIGURE 54 EV/EBITDA OF KEY VENDORS
- FIGURE 55 COMPANY VALUATION OF KEY VENDORS
- FIGURE 56 RECYCLING WATER FILTRATION: TOP TRENDING BRAND/PRODUCTS
- FIGURE 57 VEOLIA: COMPANY SNAPSHOT
- FIGURE 58 FLUENCE CORPORATION LIMITED: COMPANY SNAPSHOT
- FIGURE 59 XYLEM: COMPANY SNAPSHOT
- FIGURE 60 MANN+HUMMEL: COMPANY SNAPSHOT
- FIGURE 61 TORAY INDUSTRIES, INC.: COMPANY SNAPSHOT
- FIGURE 62 DUPONT: COMPANY SNAPSHOT
- FIGURE 63 KUBOTA CORPORATION: COMPANY SNAPSHOT
- FIGURE 64 GRUNDFOS HOLDING A/S: COMPANY SNAPSHOT
The study involved major activities in estimating the current size of the recycling water filtration market. Exhaustive secondary research was done to collect information on the peer and parent markets. The next step was to validate these findings, assumptions, and sizing with industry experts across the value chain through primary research. Both top-down and bottom-up approaches were employed to estimate the complete market size. Thereafter, market breakdown and data triangulation were used to estimate the market size of the segments and subsegments.
Secondary Research
This research study on the recycling water filtration market involved the use of extensive secondary sources, directories, and databases, such as Hoovers, dealroom, Bloomberg, Businessweek, Factiva, International Energy Agency, and BP Statistical Review of World Energy, to identify and collect information useful for a technical, market-oriented, and commercial study of the global recycling water filtration market. The other secondary sources included annual reports, press releases & investor presentations of companies, white papers, certified publications, articles by recognized authors, manufacturer associations, trade directories, and databases.
Primary Research
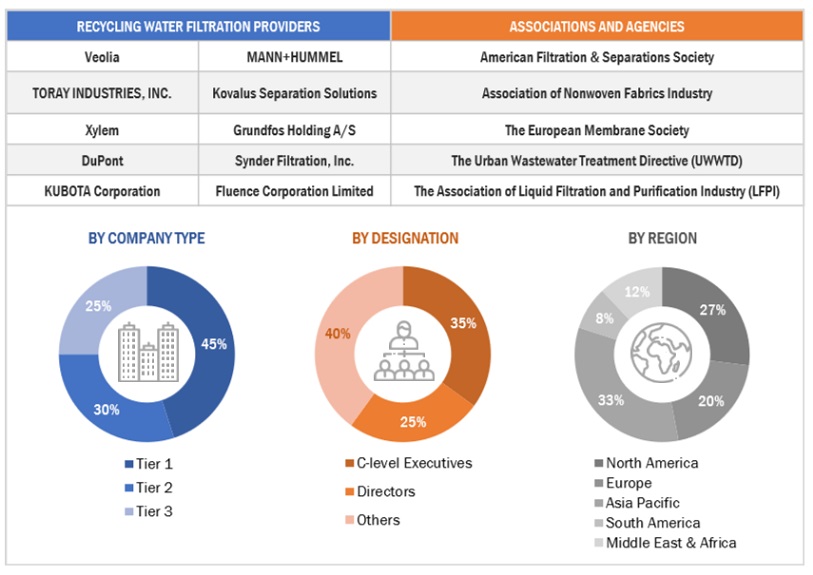
The recycling water filtration market comprises several stakeholders such as recycling water filtration manufacturers, consulting companies from water & wastewater sector, manufacturing industries, state and national authorities in the supply chain. The demand side of this market is characterized by the rising demand for sustainable water management. The supply side is characterized by rising demand for contracts from the various industries and mergers & acquisitions among big players. Various primary sources from both the supply and demand sides of the market were interviewed to obtain qualitative and quantitative information. Following is the breakdown of primary respondents:
To know about the assumptions considered for the study, download the pdf brochure
Market Size Estimation
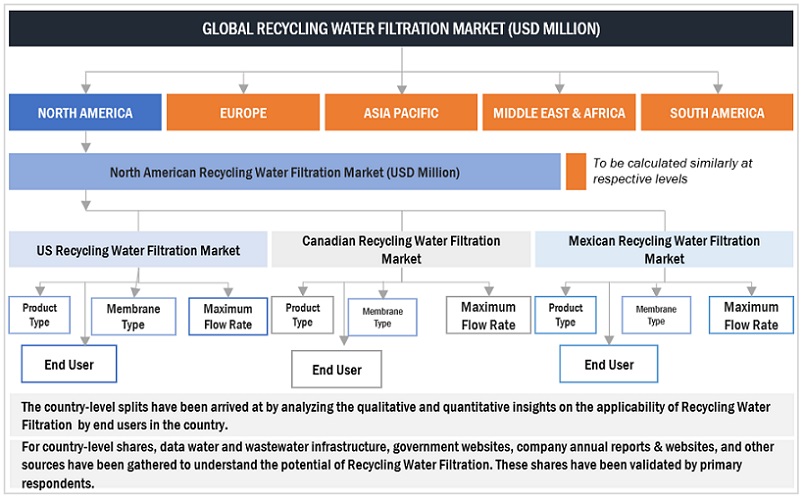
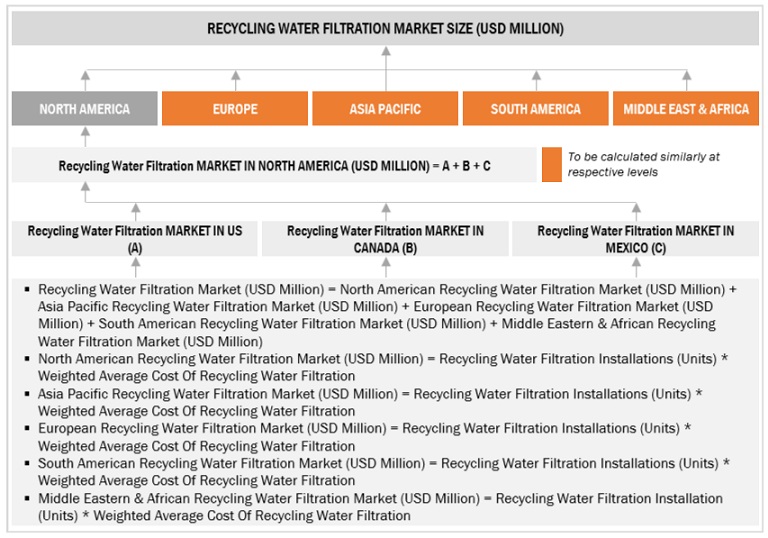
Both top-down and bottom-up approaches were used to estimate and validate the total size of the recycling water filtration market. These methods were also used extensively to estimate the size of various subsegments in the market. The research methodology used to estimate the market size includes the following:
- The key players in the industry and market have been identified through extensive secondary research, and their market share in the respective regions has been determined through both primary and secondary research.
- The industry’s value chain and market size, in terms of value, have been determined through primary and secondary research processes.
- All percentage shares, splits, and breakdowns have been determined using secondary sources and verified through primary sources.
Recycling Water Filtration Market Size: Top-down Approach
To know about the assumptions considered for the study, Request for Free Sample Report
Recycling Water Filtration Market Size: Bottom-Up Approach
Data Triangulation
After arriving at the overall market size from the estimation process explained above, the total market has been split into several segments and subsegments. To complete the overall market engineering process and arrive at the exact statistics for all the segments and subsegments, data triangulation and market breakdown processes have been employed, wherever applicable. The data has been triangulated by studying various factors and trends from both the demand- and supply sides. Along with this, the market has been validated using both the top-down and bottom-up approaches.
Market Definition
Recycling water filtration refers to the process of treating used water and filtering it to a quality suitable for reuse. This can be done for a variety of purposes, including potable and non-potable water, and environmental restoration. It encompasses the technologies and equipment involved in purifying used water for reuse in various applications.
Key Stakeholders
- Recycling Water Filtration Manufacturers and Providers
- Industrial Gas Supplying Companies
- Manufacturing Industries
- R&D Laboratories
- Consulting Companies from the Energy & Power Sector
- Distributors of Recycling Water Filtration
- Government and Research Organizations
- State and National Regulatory Authorities
Objectives of the Study
- To define and forecast the market by product type, by membrane type, by end-user, and by maximum flow rate in terms of value.
- To define and forecast the market, End User, Membrane Type, and Product type, in terms of volume.
- To forecast the market size for five key regions: North America, South America, Europe, Asia Pacific, and Middle East & Africa, along with their key countries
- To provide detailed information about the key drivers, restraints, opportunities, and challenges influencing the growth of the market
- To strategically analyze the subsegments with respect to individual growth trends, prospects, and contributions of each segment to the overall market size
- To analyze market opportunities for stakeholders and the competitive landscape of the market
- To strategically profile the key players and comprehensively analyze their market shares and core competencies
- To analyze competitive developments, such as sales contracts, agreements, investments, expansions, new product launches, mergers, partnerships, collaborations, and acquisitions, in the market
Available Customizations:
With the given market data, MarketsandMarkets offers customizations as per the client’s specific needs. The following customization options are available for this report:
Geographic Analysis
- Further breakdown of region or country-specific analysis
Company Information
- Detailed analyses and profiling of additional market players (up to 5)
Growth opportunities and latent adjacency in Recycling Water Filtration Market