Private Cloud Market

Report Code TC 9100
Published in Jul, 2024, By MarketsandMarkets™
Download PDF

Choose License Type

Buy Report Now Inquire Before Buying

Private Cloud Market Size, By Type (Virtual, On-premises, Hosted, Managed), Service Model (laaS [Compute, Network], PaaS [Data Analytics & Processing, Application Development & Deployment], SaaS [Business Applications]) - Global Forecast to 2029

Overview

The global private cloud market will grow from USD 124.8 billion in 2024 to USD 190.9 billion by 2029 at a compounded annual growth rate (CAGR) of 8.9% during the forecast period. The constantly growing advancement of multiple technologies is affecting the market of private cloud solutions, which have improved performance and customer-oriented services worldwide. For instance, using HCI, such as VMware, has enabled some vendors to simplify services in private clouds. VMware SvSAN unifies storage computing and networking into a single SW layer, making it easier for enterprises to manage and scale the OSN architecture. Likewise, Nutanix’s HCI solutions allow organizations to work more effectively and efficiently regarding complicated workloads, offering a solid base for private clouds. Other technologies like artificial intelligence and machine learning also revolutionize private cloud solutions. Furthermore, with products like the Microsoft Azure Stack, organizations can bring the AI and ML models on-premise. While the organization enjoys advanced analytics, the data never leaves the organization’s premises. This integration could assist the health sector, for instance, in predictive analytics to improve patients’ care without being a subject of data loss. Also, it changes the architecture of the private cloud as it directs data processing near the data source. Hence, Cisco’s private cloud solutions use edge computing in operations and manufacturing industries to enhance analytics, which demands low latency. Another field that promotes increased protection of data and transparency within private cloud settings is Blockchain technology. IBM’s blockchain offering is incorporated into its private cloud services and can help businesses create securely immutable finance and supply chain applications. These are examples of how vendors continue to increase their existing technological ability to service the variety of needs of international customers, making private cloud solutions more variable, secure, and efficient.

Attractive Opportunities in the Private Cloud Market

Asia Pacific

Asia Pacific is projected to grow at the highest CAGR during the forecast period. North America is estimated to account for the largest market share in 2024.

The rise of remote work, IOT devices, virtualization, automation and the globalization of businesses have increased the demand for cloud services.

Industry associations, government bodies, and technology vendors are actively promoting the benefits of cloud computing solutions to increase adoption. Therefore, this increasing awareness is driving organizations to explore and adopt private cloud solutions.

Acquisitions and new product launches with the incorporation of regulations compliance management are expected to offer lucrative opportunities for market players in the next few years.

The globalization of businesses and the need for efficient communication across regionally dispersed teams are driving the adoption of private cloud solutions to enable seamless collaboration and knowledge sharing.

Global Private Cloud Market Dynamics

Driver: Increasing demand for data security

One of the most critical issues in the cloud sector is data privacy and the need for private data security. They have been accumulating and storing large volumes of personal, financial, and other information that should be protected from unauthorized access. On the other hand, private clouds have extra security options such as separate hardware, strong encryption, and strict access control, which make them less vulnerable to hackers and other malicious people. Additional regulatory policies such as GDPR, HIPAA, and CCPA introduce the need for more robust security measures that private clouds offer. Further, with the increase in threat, business organizations require specific security solutions and round-the-clock security that the private cloud provides. Such factors have made the private cloud environment a preferred choice for organizations requiring higher data security and privacy levels, thus contributing to market growth.

Restraint: High initial cost

A major restraint in the private cloud market is the initial cost of installing this solution. Setting up a private cloud involves significant capital investment in servers, storage, networking hardware, and software. Furthermore, organizations must spend money on physical space and other needs, such as cooling and power, to support this infrastructure; this can be very expensive, especially for small and medium enterprises with limited budgets. Recurring costs are also incurred in regular maintenance, upgrades, adding more capacity, and using skilled IT personnel during deployment and management of private clouds. This requirement for significant capital and skills may act as a limiting factor for organizations to implement their solutions; instead, they can opt for cheaper public cloud services, which enable user-based billing flexibility while saving them on infrastructure expenses.


Opportunity: Integration with hybrid cloud solutions

The private cloud market can be seen as evolving compatibly with the hybrid cloud; this is a significant advantage of the former. The hybrid cloud includes public and private clouds; hence, it’s more advantageous to organizations primarily because of its flexibility. In this approach, companies can maximize utilization and cost-effectively use private clouds for secure data and vital applications. In contrast, public clouds are used for more capacity and non-critical operations, leading to improved business resilience that allows for cloning data, thereby reducing disaster or failure recovery time. Besides, workload mobility is possible in the hybrid cloud environment, thus making organization adaptability easier toward new work demands. Integration improves IT systems’ flexibility and reliability, making the public cloud sought by more businesses today due to safety concerns and regulatory issues besides operational value. These combined ones are being adopted more often, which leads to the expansion of the private cloud related to the public cloud services, enhancing the market growth. Traditional IT infrastructure is being adopted more frequently these days, which has led to the expansion of private cloud associated with public cloud services to foster the growth of this market.

Challenge: Vendor lock-in and interoperability challenges

The two significant issues with the private cloud market are vendor lock-ins and interchangeability. They have to be less controlling concerning proprietary technologies, support, other services, and pricing that heavily depends on particular providers, decreasing their bargaining power. Hence, it can restrict one from bargaining for a change to another supplier or integrating to different clouds. Achieving functional compatibility between hybrid clouds and other clouds and third-party applications is painful if interfaces are not in place and rigorous testing is not done. Migration of data and workloads from one private cloud to another or an altogether different or public cloud is tedious and expensive for organizations to reach the desired optimization level for their cloud strategy. So, businesses should try to deal with them by selecting open standards, minimizing vendor lock-in exposure, and endeavoring to place versatility into their contracts with permission for scalability and adjustability for the subsequent surroundings.

Global Private Cloud Market Ecosystem Analysis

The private cloud market ecosystem comprises diverse stakeholders, each playing a crucial role in supporting and enhancing private cloud deployments. Network connectivity vendors form the foundational layer, offering routers, switches, and networking protocols that ensure robust and secure data transmission within private cloud infrastructures. They provide essential connectivity solutions that underpin the performance and reliability of private cloud environments, catering to varying bandwidth and latency requirements.


Based on the vertical, the BFSI vertical will dominate the market during the forecast period.

Based on the vertical, the private cloud market is segmented into BFSI, retail & consumer goods, IT & telecom, energy & utilities, healthcare & life sciences, manufacturing, government & public sector, and other verticals. BFSI will hold the largest market share during the forecast period. Private cloud is vital in the BFSI sector because it has to comply with the regulations and be scalable and secure for the industry. They also assist in ensuring that cyber attacks do not result in any loss of money as financial institutions process and store data; this enables such organizations to design their own security plans and management models because private cloud infrastructures give them control over their IT resources and an opportunity to deploy unique security solutions and performance monitoring systems. Private clouds can help disaster recovery and business continuity without disrupting services. Therefore, it lets organizations in the sector effectively address this challenge by managing high transaction volumes and increasing data during this time of rapid growth, thereby enabling them to be more responsive to market demands while keeping up with service quality levels required by regulation bodies within their jurisdictions.

Based on the organization’s size, the SME segment is expected to have the highest CAGR growth rate during the forecast period.

The private cloud market by organization size includes large enterprises and SMEs. As per the organization size, the SME segment will hold the highest CAGR during the forecast period. Based on the findings, private cloud solutions and services are highlighted as necessary for SMEs to maintain customers’ and other stakeholders’ flexible and secure IT environments to meet the organization’s needs. Most strategies of these solutions can control the resources best, and they won’t need to delete the critical data or violate the legislation. Implementing a private cloud solution can effectively manage and protect patient records for a mid-sized healthcare provider. This approach ensures that patient data is stored securely and compliant while remaining accessible to authorized personnel. Additionally, it allows for better resource organization, enhanced data security, and adherence to industry standards, ultimately improving the quality of care. One of the key advantages of a private cloud is its scalability; as the healthcare provider expands, its IT infrastructure can seamlessly grow to meet increasing demands.A private cloud solution could address data management and patient records protection for a mid-sized healthcare organization. This approach guarantees that the patient’s records are secure and legal while, at the same time, can be accessed by any interested personnel. Furthermore, it helps organize resources and increase data protection and compliance with specific standards, which, in return, leads to a better quality of patient care. A significant strength often associated with private cloud is the implementation of scale: while the scope of the operation is increasing, the necessity to buy new equipment for growing healthcare providers’ IT needs does not arise.

North America region holds the largest share of the Private Cloud Market.

North America will lead the private cloud market in 2024. The US is estimated to account for the largest market share in North America in 2024, the private cloud market, and the trend will continue until 2029. In the US, private cloud solutions help to improve data security, compliance, and manageability for SMEs and large businesses. Private clouds are advantageous to small and medium-sized companies since they receive consistent and superior protection, flexibility, and cost efficiency; these allow small businesses to match large organizations through customized, protected computing environments; still, the firms do not have to spend much money initially. On the other hand, the vast legal and regulatory statutes compel big enterprises to utilize private clouds for the highly secure processing of extensive data. Organizations rely on its possibilities to tailor the resources, keep direct control over the IT environment, and adopt innovations such as AI and big data analytics. Thus, private clouds are critical enablers of innovation and data-centric initiatives in organizations worldwide. They are essential in sustaining competitiveness and acquiring new solutions related to the digital transformation of numerous industries.


Recent Developments of Private Cloud Market industry

  • In June 2024, AWS announced the general availability of Amazon Virtual Private Cloud (VPC) support for AWS CloudShell; this allows users to create CloudShell environments in a VPC and use CloudShell securely within the same subnet as other resources in their VPC without the need for additional network configuration.
  • In June 2024, HPE introduced HPE Aruba Networking Enterprise Private 5G to help customers accelerate and simplify the deployment and management of private 5G networks, providing high levels of reliable wireless coverage across large campus and industrial environments and opening up new, untapped use cases for private cellular.

Key Market Players

KEY PLAYERS IN THE Private Cloud Market INCLUDE

Want to explore hidden markets that can drive new revenue in Private Cloud Market?

Scope of the Report

Report Attribute Details
Market size available for years 2019–2029
Base year considered 2023
Forecast period 2024–2029
Forecast units Value (USD Million/Billion)
Segments Covered Type, Organization Size, Service Model, and Vertical
Geographies Covered North America, Europe, Asia Pacific, Middle East Africa, and Latin America
Companies Covered Some of the significant private cloud market vendors are Microsoft (US), Google (US), IBM (US), AWS (US), Oracle (US), VMware (US), Alibaba Cloud (China), HPE (US), Cisco (US), and SAP (Germany)


Key Questions Addressed by the Report

What is a private cloud?
A private cloud provides the user greater control over security and may enable other forms of customization that hybrid clouds cannot support. It is up to the company whether it will maintain its private cloud or outsource its cloud management so it can provide data and applications based on customer requests. Private clouds offer the security benefits of using a public cloud but ensure that data is not created or stored outside company jurisdiction.
Which country was the early adopter of private cloud?
The US was at the initial stage of adopting a private cloud.
Which are the key vendors exploring the private cloud?
Some of the significant vendors offering private cloud worldwide include Microsoft (US), Google (US), IBM (US), AWS (US), Oracle (US), VMware (US), Alibaba Cloud (China), HPE (US), Cisco (US), and SAP (Germany).
What is the total CAGR recorded for the private cloud market from 2024 to 2029?
The private cloud market will record a CAGR of 8.9% from 2024 to 2029.
Who are vital clients adopting the private cloud market?
Key clients adopting the private cloud market include:
  • Training and consulting service providers
  • Information Technology (IT) infrastructure providers
  • Private cloud solutions providers
  • Private cloud service providers
  • Government organizations and standardization bodies
  • Network Administrators
  • Compliance Officers
  • Application Developers
  • Private Cloud Architects


Personalize This Research

  • Triangulate with your Own Data
  • Get Data as per your Format and Definition
  • Gain a Deeper Dive on a Specific Application, Geography, Customer or Competitor
  • Any level of Personalization
Request A Free Customisation

Let Us Help You

  • What are the Known and Unknown Adjacencies Impacting the Private Cloud Market
  • What will your New Revenue Sources be?
  • Who will be your Top Customer; what will make them switch?
  • Defend your Market Share or Win Competitors
  • Get a Scorecard for Target Partners
Customized Workshop Request

Table of Contents

Exclusive indicates content/data unique to MarketsandMarkets and not available with any competitors.

TITLE
PAGE NO
INTRODUCTION
28
RESEARCH METHODOLOGY
33
EXECUTIVE SUMMARY
46
PREMIUM INSIGHTS
50
MARKET OVERVIEW AND INDUSTRY TRENDS
53
  • 5.1 INTRODUCTION
  • 5.2 MARKET DYNAMICS
    DRIVERS
    - Increasing demand for data security
    - Customization and control over IT infrastructure
    - Enhanced performance and reliability
    RESTRAINTS
    - High initial costs
    - Complexity of implementation and management
    OPPORTUNITIES
    - Integration with hybrid cloud solutions
    - Emphasis on sustainability and green IT
    CHALLENGES
    - Vendor lock-in and interoperability challenges
    - Limited elasticity and flexibility
    - Cyberattacks posing risks of business disruption and data loss
  • 5.3 CASE STUDY ANALYSIS
    BEN & JERRY’S AIMED TO STORE AND SHARE FILES USING DROPBOX
    AWS CLOUD AIDED WITH COST-CUTTING ADVANTAGE & GROWTH MULTIPLIER FOR IT FIRM
    DEKA IMMOBILIEN SCALED UP IN CONTENT CLOUD
  • 5.4 ECOSYSTEM ANALYSIS
  • 5.5 VALUE CHAIN ANALYSIS
  • 5.6 PRICING ANALYSIS
    AVERAGE SELLING PRICE TREND OF KEY PLAYERS, BY SOLUTION
    AVERAGE SELLING PRICE TRENDS
  • 5.7 PATENT ANALYSIS
  • 5.8 TECHNOLOGY ANALYSIS
    KEY TECHNOLOGIES
    - Virtualization
    - Software-defined Networking (SDN)
    - Automation & Orchestration
    COMPLEMENTARY TECHNOLOGIES
    - Edge Computing
    - Blockchain
    - AI & ML
    ADJACENT TECHNOLOGIES
    - Internet of Things
    - 5G Technology
  • 5.9 REGULATORY LANDSCAPE
    REGULATORY BODIES, GOVERNMENT AGENCIES, AND OTHER ORGANIZATIONS
    REGULATIONS, BY REGION
    - North America
    - Europe
    - Asia Pacific
    - Middle East & South Africa
    - Latin America
    REGULATORY IMPLICATIONS AND INDUSTRY STANDARDS
    - General Data Protection Regulation (GDPR)
    - SEC Rule 17a-4
    - ISO/IEC 27001
    - System and Organization Controls 2 Type II Compliance
    - Financial Industry Regulatory Authority (FINRA)
    - Freedom of Information Act (FOIA)
    - Health Insurance Portability and Accountability Act (HIPAA)
  • 5.10 PORTER’S FIVE FORCES’ ANALYSIS
    THREAT OF NEW ENTRANTS
    THREAT OF SUBSTITUTES
    BARGAINING POWER OF SUPPLIERS
    BARGAINING POWER OF BUYERS
    INTENSITY OF COMPETITIVE RIVALRY
  • 5.11 KEY CONFERENCES AND EVENTS
  • 5.12 TRENDS/DISRUPTIONS IMPACTING CUSTOMERS’ BUSINESSES
  • 5.13 KEY STAKEHOLDERS & BUYING CRITERIA
    KEY STAKEHOLDERS IN BUYING PROCESS
  • 5.14 BUYING CRITERIA
  • 5.15 BUSINESS MODEL ANALYSIS
    PAY-AS-YOU-GO
    SUBSCRIPTION MODEL
    FREEMIUM
    CUSTOM PRICING AGREEMENT
  • 5.16 INVESTMENT & FUNDING SCENARIO
  • 5.17 FUTURE OF PRIVATE CLOUD
  • 5.18 IMPACT OF AI/GEN AI ON PRIVATE CLOUD MARKET
  • 5.19 INDUSTRY TRENDS: USE CASES
    USE CASE 1: RETAIL & E-COMMERCE INDUSTRY
    USE CASE 2: HEALTHCARE & LIFE SCIENCES INDUSTRY
    TOP CLIENTS ADAPTING TO GEN AI
    - HPE
    - VMware
PRIVATE CLOUD MARKET, BY SERVICE MODEL
87
  • 6.1 INTRODUCTION
    SERVICE MODELS: MARKET DRIVERS
  • 6.2 INFRASTRUCTURE-AS-A-SERVICE (IAAS)
    COMPUTE
    - Compute-intensive applications to offer affordability, scalability, integration, and load balancing
    - Virtual machines (VMs)
    - Bare metals
    - Containers
    NETWORK
    - Offers VPN, load balancing, firewall, and SDN networking for secure and high-performing networks
    - Virtual network
    - VPN gateways
    STORAGE
    - Helps in organizing data and its storage & backup and archival
    - Block storage
    - File storage
  • 6.3 PLATFORM-AS-A-SERVICE (PAAS)
    APPLICATION DEVELOPMENT & DEPLOYMENT
    - Application development to lead to cost-efficiency, scalability, and rapid development
    - Application hosting
    - Container orchestration
    DATA ANALYTICS & PROCESSING
    - Analytics and processing applications to enhance performance and decision-making
    - Big data processing
    - Business intelligence
    APPLICATION TESTING & QUALITY
    - Growing preference for effective testing strategy systems, user interfaces, and APIs
    - CI/CD tools
    - Automated testing
  • 6.4 SOFTWARE-AS-A-SERVICE (SAAS)
    BUSINESS APPLICATIONS
    - SaaS business applications integrate into companies’ operations to improve processes
    - Customer relationship management
    - Enterprise resource planning
    - Project management
    COLLABORATION & PRODUCTIVITY TOOLS
    - Enables real-time collaboration among distributed teams, fostering seamless communication and knowledge sharing
    - Email & communication
    - Document management & collaboration
    - Team collaboration
PRIVATE CLOUD MARKET, BY TYPE
108
  • 7.1 INTRODUCTION
    TYPES: MARKET DRIVERS
  • 7.2 ON-PREMISES PRIVATE CLOUD
    INTEGRATION OF CLOUD COMPUTING WITH ALL ADVANTAGES OF ONSITE SOLUTIONS AND LOCAL INFRASTRUCTURE
  • 7.3 HOSTED PRIVATE CLOUD
    DATA LOSS AND ISSUES RELATED TO REGULATORY COMPLIANCE TO DRIVE PREFERENCE FOR HOSTED PRIVATE CLOUD
  • 7.4 MANAGED PRIVATE CLOUD
    ENABLE ORGANIZATIONS TO HARNESS CLOUD BENEFITS WITHOUT NECESSARILY HANDLING OPERATIONAL TASKS
  • 7.5 VIRTUAL PRIVATE CLOUD
    ORGANIZATIONS CAN CREATE THEIR VIRTUAL TOPOLOGY IN TERMS OF SUBNETS, IP ADDRESSES, AND ROUTING
PRIVATE CLOUD MARKET, BY ORGANIZATION SIZE
115
  • 8.1 INTRODUCTION
    ORGANIZATION SIZES: MARKET DRIVERS
  • 8.2 SMALL AND MEDIUM-SIZED ENTERPRISES
    CLOUD SERVICES TO EMPOWER SMES TO HOST THEIR APPLICATIONS
  • 8.3 LARGE ENTERPRISES
    RISING ADOPTION OF PRIVATE CLOUD COMPUTING IN LARGE ENTERPRISES TO IMPROVE PRODUCTIVITY AND EFFICIENCY
PRIVATE CLOUD MARKET, BY VERTICAL
120
  • 9.1 INTRODUCTION
    VERTICALS: MARKET DRIVERS
  • 9.2 BFSI
    NEED TO DECREASE EXPENSES, ENCOURAGE INNOVATION, AND INCREASE FLEXIBILITY
    BFSI: USE CASES
    - Data security & privacy
    - Customer relationship management
    - Fraud detection & prevention
  • 9.3 IT & TELECOM
    ENTERPRISE VIDEO SOLUTIONS ENCOURAGE IT COMPANIES TO TRANSFER KNOWLEDGE AND INFORMATION THROUGH VIDEOS
    IT & TELECOM: USE CASES
    - Software development & testing
    - Disaster recovery & business continuity
    - Smart infrastructure
  • 9.4 HEALTHCARE & LIFE SCIENCES
    INCREASED FOCUS ON MANAGING PATIENTS’ RECORDS
    HEALTHCARE & LIFE SCIENCES: USE CASES
    - Electronic health record (EHR) management
    - Data analytics for research
    - Administrative management
  • 9.5 GOVERNMENT & PUBLIC SECTOR
    NEED FOR GOVERNMENT AGENCIES TO GAIN GREATER VISIBILITY AND FASTER DATA ANALYSIS TO DRIVE MARKET
    GOVERNMENT & PUBLIC SECTOR: USE CASES
    - Government infrastructure migration
    - Digital government & e-government services
    - Inter-agency collaboration
  • 9.6 RETAIL & CONSUMER GOODS
    DEMAND FOR BETTER STORAGE, BACKUP, AND SECURITY SERVICES
    RETAIL & CONSUMER GOODS: USE CASES
    - Point-of-sale systems
    - Online shopping & e-commerce
    - Security & loss prevention
    - Customer behavioral analysis
  • 9.7 MANUFACTURING
    SEAMLESS DATA MANAGEMENT AND REAL-TIME VISIBILITY OFFERED BY PRIVATE CLOUD COMPUTING SERVICES
    MANUFACTURING: USE CASES
    - Supply chain management
    - Product lifecycle management
    - Manufacturing execution systems (MES)
  • 9.8 ENERGY & UTILITIES
    ADDRESSING ISSUES RELATED TO CRUDE OIL, STORAGE, AND TRANSPORTATION
    ENERGY & UTILITIES: USE CASES
    - Smart grid management
    - Energy monitoring & management
    - Renewable energy forecasting
  • 9.9 OTHER VERTICALS
PRIVATE CLOUD MARKET, BY REGION
137
  • 10.1 INTRODUCTION
  • 10.2 NORTH AMERICA
    NORTH AMERICA: MARKET DRIVERS
    NORTH AMERICA: MACROECONOMIC OUTLOOK
    US
    - Presence of private cloud providers to drive market
    CANADA
    - Increased R&D and focus on long-term infrastructure plan for private cloud
  • 10.3 EUROPE
    EUROPE: MARKET DRIVERS
    EUROPE: MACROECONOMIC OUTLOOK
    UK
    - Increase in digitalization and rapid surge in mobile devices to accelerate market growth
    GERMANY
    - High demand for private cloud among startups in Germany
    FRANCE
    - Focus on equipping public sector operations with private cloud solutions
    SPAIN
    - Expansion plans and road maps of "hyper scalers" to drive market
    ITALY
    - Smart city initiatives and digital transformation to fuel market growth
    REST OF EUROPE
  • 10.4 ASIA PACIFIC
    ASIA PACIFIC: MARKET DRIVERS
    ASIA PACIFIC: MACROECONOMIC OUTLOOK
    CHINA
    - Low costs and enhanced business efficiencies to boost demand for cloud-based technologies
    JAPAN
    - High involvement of SMEs in cloud adoption to drive market
    AUSTRALIA & NEW ZEALAND
    - Rapid technological advancements and high degree of R&D to foster market growth
    INDIA
    - Broad customer base and rapid adoption of new technologies to drive market
    REST OF ASIA PACIFIC
  • 10.5 MIDDLE EAST & AFRICA
    MIDDLE EAST & AFRICA: MARKET DRIVERS
    MIDDLE EAST & AFRICA: MACROECONOMIC OUTLOOK
    GULF COOPERATION COUNCIL COUNTRIES
    - Driving digital transformation to improve operational efficiency
    - KSA
    - UAE
    - Other GCC countries
    SOUTH AFRICA
    - High adoption of cloud services by startups due to low costs and operational benefits to propel market
    REST OF MIDDLE EAST & AFRICA
  • 10.6 LATIN AMERICA
    LATIN AMERICA: PRIVATE CLOUD MARKET DRIVERS
    LATIN AMERICA: MACROECONOMIC OUTLOOK
    BRAZIL
    - Need to modernize infrastructure and greater speed in catering to business demands to boost market
    MEXICO
    - Need to enhance employee experience and increase organizational productivity to drive market
    REST OF LATIN AMERICA
COMPETITIVE LANDSCAPE
198
  • 11.1 OVERVIEW
  • 11.2 KEY PLAYERS’ STRATEGIES/RIGHT TO WIN
  • 11.3 MARKET SHARE ANALYSIS
  • 11.4 BRAND/PRODUCT COMPARISON
  • 11.5 REVENUE ANALYSIS
  • 11.6 COMPANY EVALUATION MATRIX FOR KEY PLAYERS
    STARS
    EMERGING LEADERS
    PERVASIVE PLAYERS
    PARTICIPANTS
    COMPANY FOOTPRINT: KEY PLAYERS, 2023
  • 11.7 COMPANY EVALUATION MATRIX: STARTUPS/SMES, 2023
    PROGRESSIVE COMPANIES
    RESPONSIVE COMPANIES
    DYNAMIC COMPANIES
    STARTING BLOCKS
    COMPETITIVE BENCHMARKING: STARTUPS/SMES, 2023
  • 11.8 COMPANY VALUATION AND FINANCIAL METRICS
  • 11.9 COMPETITIVE SCENARIO
    PRODUCT LAUNCHES & ENHANCEMENTS
    DEALS
COMPANY PROFILES
232
  • 12.1 INTRODUCTION
  • 12.2 MAJOR PLAYERS
    MICROSOFT
    - Business overview
    - Products/Solutions/Services offered
    - Recent developments
    - MnM view
    AWS
    - Business overview
    - Products/Solutions/Services offered
    - Recent developments
    - MnM view
    VMWARE
    - Business overview
    - Products/Solutions/Services offered
    - Recent developments
    - MnM view
    IBM
    - Business overview
    - Products/Solutions/Services offered
    - Recent developments
    - MnM view
    HPE
    - Business overview
    - Products/Solutions/Services offered
    - Recent developments
    - MnM view
    GOOGLE
    - Business overview
    - Products/Solutions/Services offered
    - Recent developments
    - MnM view
    ORACLE
    - Business overview
    - Products/Solutions/Services offered
    - Recent developments
    ALIBABA CLOUD
    - Business overview
    - Products/Solutions/Services offered
    - Recent developments
    SAP
    - Business overview
    - Products/Solutions/Services offered
    - Recent developments
    CISCO
    - Business overview
    - Products/Solutions/Services offered
    - Recent developments
  • 12.3 OTHER PLAYERS
    OVHCLOUD
    DIGITALOCEAN
    RACKSPACE TECHNOLOGY
    HUAWEI
    ATOS
    KYNDRYL
    NUTANIX
    TENCENT CLOUD
    DELL TECHNOLOGIES
    OPENSTACK
    INVICTA LINUX
    G42 CLOUD
    BSIMPLIFY
    UPCLOUD
    SAFECLOUDBOX
    OPER8 GLOBAL
    VULTR
    SCALEWAY
    CASBAY
    SAICOM
ADJACENT AND RELATED MARKETS
303
  • 13.1 INTRODUCTION
    RELATED MARKETS
    LIMITATIONS
  • 13.2 CLOUD COMPUTING MARKET
  • 13.3 PUBLIC CLOUD MARKET
APPENDIX
306
  • 14.1 DISCUSSION GUIDE
  • 14.2 KNOWLEDGESTORE: MARKETSANDMARKETS’ SUBSCRIPTION PORTAL
  • 14.3 CUSTOMIZATION OPTIONS
  • 14.4 RELATED REPORTS
  • 14.5 AUTHOR DETAILS
LIST OF TABLES
 
  • TABLE 1 USD EXCHANGE RATES, 2018–2023
  • TABLE 2 FACTOR ANALYSIS
  • TABLE 3 INDICATIVE PRICING ANALYSIS OF PRIVATE CLOUD MARKET, BY SOLUTION
  • TABLE 4 PRIVATE CLOUD MARKET: AVERAGE PRICING LEVELS (USD)
  • TABLE 5 TOP PATENT OWNERS
  • TABLE 6 NORTH AMERICA: REGULATORY BODIES, GOVERNMENT AGENCIES, AND OTHER ORGANIZATIONS
  • TABLE 7 EUROPE: REGULATORY BODIES, GOVERNMENT AGENCIES, AND OTHER ORGANIZATIONS
  • TABLE 8 ASIA PACIFIC: REGULATORY BODIES, GOVERNMENT AGENCIES, AND OTHER ORGANIZATIONS
  • TABLE 9 REST OF THE WORLD: REGULATORY BODIES, GOVERNMENT AGENCIES, AND OTHER ORGANIZATIONS
  • TABLE 10 PORTER’S FIVE FORCES' IMPACT ON PRIVATE CLOUD MARKET
  • TABLE 11 PRIVATE CLOUD MARKET: KEY CONFERENCES AND EVENTS, 2024–2025
  • TABLE 12 INFLUENCE OF STAKEHOLDERS ON BUYING PROCESS FOR TOP THREE VERTICALS
  • TABLE 13 KEY BUYING CRITERIA FOR TOP THREE VERTICALS
  • TABLE 14 MARKET, BY SERVICE MODEL, 2019–2023 (USD MILLION)
  • TABLE 15 PRIVATE CLOUD MARKET, BY SERVICE MODEL, 2024–2029 (USD MILLION)
  • TABLE 16 MARKET, BY IAAS, 2019–2023 (USD MILLION)
  • TABLE 17 PRIVATE CLOUD MARKET, BY IAAS, 2024–2029 (USD MILLION)
  • TABLE 18 IAAS: MARKET, BY REGION, 2019–2023 (USD MILLION)
  • TABLE 19 IAAS: MARKET, BY REGION, 2024–2029 (USD MILLION)
  • TABLE 20 COMPUTE: MARKET, BY REGION, 2019–2023 (USD MILLION)
  • TABLE 21 COMPUTE: MARKET, BY REGION, 2024–2029 (USD MILLION)
  • TABLE 22 NETWORK: MARKET, BY REGION, 2019–2023 (USD MILLION)
  • TABLE 23 NETWORK: MARKET, BY REGION, 2024–2029 (USD MILLION)
  • TABLE 24 STORAGE: MARKET, BY REGION, 2019–2023 (USD MILLION)
  • TABLE 25 STORAGE: MARKET, BY REGION, 2024–2029 (USD MILLION)
  • TABLE 26 PRIVATE CLOUD MARKET, BY PAAS, 2019–2023 (USD MILLION)
  • TABLE 27 MARKET, BY PAAS, 2024–2029 (USD MILLION)
  • TABLE 28 PAAS: MARKET, BY REGION, 2019–2023 (USD MILLION)
  • TABLE 29 PAAS: MARKET, BY REGION, 2024–2029 (USD MILLION)
  • TABLE 30 APPLICATION DEVELOPMENT & DEPLOYMENT: MARKET, BY REGION, 2019–2023 (USD MILLION)
  • TABLE 31 APPLICATION DEVELOPMENT & DEPLOYMENT: MARKET, BY REGION, 2024–2029 (USD MILLION)
  • TABLE 32 DATA ANALYTICS & PROCESSING: MARKET, BY REGION, 2019–2023 (USD MILLION)
  • TABLE 33 DATA ANALYTICS & PROCESSING: MARKET, BY REGION, 2024–2029 (USD MILLION)
  • TABLE 34 APPLICATION TESTING & QUALITY: MARKET, BY REGION, 2019–2023 (USD MILLION)
  • TABLE 35 APPLICATION TESTING & QUALITY: MARKET, BY REGION, 2024–2029 (USD MILLION)
  • TABLE 36 PRIVATE CLOUD MARKET, BY SAAS, 2019–2023 (USD MILLION)
  • TABLE 37 MARKET, BY SAAS, 2024–2029 (USD MILLION)
  • TABLE 38 SAAS: MARKET, BY REGION, 2019–2023 (USD MILLION)
  • TABLE 39 SAAS: MARKET, BY REGION, 2024–2029 (USD MILLION)
  • TABLE 40 BUSINESS APPLICATIONS: MARKET, BY REGION, 2019–2023 (USD MILLION)
  • TABLE 41 BUSINESS APPLICATIONS: MARKET, BY REGION, 2024–2029 (USD MILLION)
  • TABLE 42 COLLABORATION & PRODUCTIVITY TOOLS: MARKET, BY REGION, 2019–2023 (USD MILLION)
  • TABLE 43 COLLABORATION & PRODUCTIVITY TOOLS: MARKET, BY REGION, 2024–2029 (USD MILLION)
  • TABLE 44 PRIVATE CLOUD MARKET, BY TYPE, 2019–2023 (USD MILLION)
  • TABLE 45 MARKET, BY TYPE, 2024–2029 (USD MILLION)
  • TABLE 46 ON-PREMISES PRIVATE CLOUD: MARKET, BY REGION, 2019–2023 (USD MILLION)
  • TABLE 47 ON-PREMISES PRIVATE CLOUD: MARKET, BY REGION, 2024–2029 (USD MILLION)
  • TABLE 48 HOSTED PRIVATE CLOUD: MARKET, BY REGION, 2019–2023 (USD MILLION)
  • TABLE 49 HOSTED PRIVATE CLOUD: MARKET, BY REGION, 2024–2029 (USD MILLION)
  • TABLE 50 MANAGED PRIVATE CLOUD: MARKET, BY REGION, 2019–2023 (USD MILLION)
  • TABLE 51 MANAGED PRIVATE CLOUD: MARKET, BY REGION, 2024–2029 (USD MILLION)
  • TABLE 52 VIRTUAL PRIVATE CLOUD: MARKET, BY REGION, 2019–2023 (USD MILLION)
  • TABLE 53 VIRTUAL PRIVATE CLOUD: MARKET, BY REGION, 2024–2029 (USD MILLION)
  • TABLE 54 PRIVATE CLOUD MARKET, BY ORGANIZATION SIZE, 2019–2023 (USD MILLION)
  • TABLE 55 MARKET, BY ORGANIZATION SIZE, 2024–2029 (USD MILLION)
  • TABLE 56 SMALL AND MEDIUM-SIZED ENTERPRISES: MARKET, BY REGION, 2019–2023 (USD MILLION)
  • TABLE 57 SMALL AND MEDIUM-SIZED ENTERPRISES: MARKET, BY REGION, 2024–2029 (USD MILLION)
  • TABLE 58 LARGE ENTERPRISES: MARKET, BY REGION, 2019–2023 (USD MILLION)
  • TABLE 59 LARGE ENTERPRISES: MARKET, BY REGION, 2024–2029 (USD MILLION)
  • TABLE 60 PRIVATE CLOUD MARKET, BY VERTICAL, 2019–2023 (USD MILLION)
  • TABLE 61 MARKET, BY VERTICAL, 2024–2029 (USD MILLION)
  • TABLE 62 BFSI: MARKET, BY REGION, 2019–2023 (USD MILLION)
  • TABLE 63 BFSI: MARKET, BY REGION, 2024–2029 (USD MILLION)
  • TABLE 64 IT & TELECOM: MARKET, BY REGION, 2019–2023 (USD MILLION)
  • TABLE 65 IT & TELECOM: MARKET, BY REGION, 2024–2029 (USD MILLION)
  • TABLE 66 HEALTHCARE & LIFE SCIENCES: MARKET, BY REGION, 2019–2023 (USD MILLION)
  • TABLE 67 HEALTHCARE & LIFE SCIENCES: MARKET, BY REGION, 2024–2029 (USD MILLION)
  • TABLE 68 GOVERNMENT & PUBLIC SECTOR: MARKET, BY REGION, 2019–2023 (USD MILLION)
  • TABLE 69 GOVERNMENT & PUBLIC SECTOR: MARKET, BY REGION, 2024–2029 (USD MILLION)
  • TABLE 70 RETAIL & CONSUMER GOODS: MARKET, BY REGION, 2019–2023 (USD MILLION)
  • TABLE 71 RETAIL & CONSUMER GOODS: MARKET, BY REGION, 2024–2029 (USD MILLION)
  • TABLE 72 MANUFACTURING: MARKET, BY REGION, 2019–2023 (USD MILLION)
  • TABLE 73 MANUFACTURING: MARKET, BY REGION, 2024–2029 (USD MILLION)
  • TABLE 74 ENERGY & UTILITIES: MARKET, BY REGION, 2019–2023 (USD MILLION)
  • TABLE 75 ENERGY & UTILITIES: MARKET, BY REGION, 2024–2029 (USD MILLION)
  • TABLE 76 OTHER VERTICALS: MARKET, BY REGION, 2019–2023 (USD MILLION)
  • TABLE 77 OTHER VERTICALS: MARKET, BY REGION, 2024–2029 (USD MILLION)
  • TABLE 78 PRIVATE CLOUD MARKET, BY REGION, 2019–2023 (USD MILLION)
  • TABLE 79 MARKET, BY REGION, 2024–2029 (USD MILLION)
  • TABLE 80 NORTH AMERICA: MARKET, BY TYPE, 2019–2023 (USD MILLION)
  • TABLE 81 NORTH AMERICA: MARKET, BY TYPE, 2024–2029 (USD MILLION)
  • TABLE 82 NORTH AMERICA: MARKET, BY SERVICE MODEL, 2019–2023 (USD MILLION)
  • TABLE 83 NORTH AMERICA: MARKET, BY SERVICE MODEL, 2024–2029 (USD MILLION)
  • TABLE 84 NORTH AMERICA: PRIVATE CLOUD MARKET, BY IAAS, 2019–2023 (USD MILLION)
  • TABLE 85 NORTH AMERICA: MARKET, BY IAAS, 2024–2029 (USD MILLION)
  • TABLE 86 NORTH AMERICA: MARKET, BY PAAS, 2019–2023 (USD MILLION)
  • TABLE 87 NORTH AMERICA: MARKET, BY PAAS, 2024–2029 (USD MILLION)
  • TABLE 88 NORTH AMERICA: MARKET, BY SAAS, 2019–2023 (USD MILLION)
  • TABLE 89 NORTH AMERICA: MARKET, BY SAAS, 2024–2029 (USD MILLION)
  • TABLE 90 NORTH AMERICA: MARKET, BY ORGANIZATION SIZE, 2019–2023 (USD MILLION)
  • TABLE 91 NORTH AMERICA: MARKET, BY ORGANIZATION SIZE, 2024–2029 (USD MILLION)
  • TABLE 92 NORTH AMERICA: MARKET, BY VERTICAL, 2019–2023 (USD MILLION)
  • TABLE 93 NORTH AMERICA: MARKET, BY VERTICAL, 2024–2029 (USD MILLION)
  • TABLE 94 NORTH AMERICA: MARKET, BY COUNTRY, 2019–2023 (USD MILLION)
  • TABLE 95 NORTH AMERICA: MARKET, BY COUNTRY, 2024–2029 (USD MILLION)
  • TABLE 96 US: MARKET, BY ORGANIZATION SIZE, 2019–2023 (USD MILLION)
  • TABLE 97 US: MARKET, BY ORGANIZATION SIZE, 2024–2029 (USD MILLION)
  • TABLE 98 US: MARKET, BY SERVICE MODEL, 2019–2023 (USD MILLION)
  • TABLE 99 US: MARKET, BY SERVICE MODEL, 2024–2029 (USD MILLION)
  • TABLE 100 CANADA: MARKET, BY ORGANIZATION SIZE, 2019–2023 (USD MILLION)
  • TABLE 101 CANADA: MARKET, BY ORGANIZATION SIZE, 2024–2029 (USD MILLION)
  • TABLE 102 CANADA: MARKET, BY SERVICE MODEL, 2019–2023 (USD MILLION)
  • TABLE 103 CANADA: MARKET, BY SERVICE MODEL, 2024–2029 (USD MILLION)
  • TABLE 104 EUROPE: MARKET, BY TYPE, 2019–2023 (USD MILLION)
  • TABLE 105 EUROPE: PRIVATE CLOUD MARKET, BY TYPE, 2024–2029 (USD MILLION)
  • TABLE 106 EUROPE: MARKET, BY SERVICE MODEL, 2019–2023 (USD MILLION)
  • TABLE 107 EUROPE: MARKET, BY SERVICE MODEL, 2024–2029 (USD MILLION)
  • TABLE 108 EUROPE: MARKET, BY IAAS, 2019–2023 (USD MILLION)
  • TABLE 109 EUROPE: MARKET, BY IAAS, 2024–2029 (USD MILLION)
  • TABLE 110 EUROPE: MARKET, BY PAAS, 2019–2023 (USD MILLION)
  • TABLE 111 EUROPE: MARKET, BY PAAS, 2024–2029 (USD MILLION)
  • TABLE 112 EUROPE: MARKET, BY SAAS, 2019–2023 (USD MILLION)
  • TABLE 113 EUROPE: MARKET, BY SAAS, 2024–2029 (USD MILLION)
  • TABLE 114 EUROPE: MARKET, BY ORGANIZATION SIZE, 2019–2023 (USD MILLION)
  • TABLE 115 EUROPE: MARKET, BY ORGANIZATION SIZE, 2024–2029 (USD MILLION)
  • TABLE 116 EUROPE: MARKET, BY VERTICAL, 2019–2023 (USD MILLION)
  • TABLE 117 EUROPE: MARKET, BY VERTICAL, 2024–2029 (USD MILLION)
  • TABLE 118 EUROPE: MARKET, BY COUNTRY, 2019–2023 (USD MILLION)
  • TABLE 119 EUROPE: MARKET, BY COUNTRY, 2024–2029 (USD MILLION)
  • TABLE 120 UK: MARKET, BY ORGANIZATION SIZE, 2019–2023 (USD MILLION)
  • TABLE 121 UK: MARKET, BY ORGANIZATION SIZE, 2024–2029 (USD MILLION)
  • TABLE 122 UK: MARKET, BY SERVICE MODEL, 2019–2023 (USD MILLION)
  • TABLE 123 UK: MARKET, BY SERVICE MODEL, 2024–2029 (USD MILLION)
  • TABLE 124 GERMANY: MARKET, BY ORGANIZATION SIZE, 2019–2023 (USD MILLION)
  • TABLE 125 GERMANY: MARKET, BY ORGANIZATION SIZE, 2024–2029 (USD MILLION)
  • TABLE 126 GERMANY: MARKET, BY SERVICE MODEL, 2019–2023 (USD MILLION)
  • TABLE 127 GERMANY: MARKET, BY SERVICE MODEL, 2024–2029 (USD MILLION)
  • TABLE 128 FRANCE: MARKET, BY ORGANIZATION SIZE, 2019–2023 (USD MILLION)
  • TABLE 129 FRANCE: MARKET, BY ORGANIZATION SIZE, 2024–2029 (USD MILLION)
  • TABLE 130 FRANCE: MARKET, BY SERVICE MODEL, 2019–2023 (USD MILLION)
  • TABLE 131 FRANCE: MARKET, BY SERVICE MODEL, 2024–2029 (USD MILLION)
  • TABLE 132 SPAIN: MARKET, BY ORGANIZATION SIZE, 2019–2023 (USD MILLION)
  • TABLE 133 SPAIN: PRIVATE CLOUD MARKET, BY ORGANIZATION SIZE, 2024–2029 (USD MILLION)
  • TABLE 134 SPAIN: MARKET, BY SERVICE MODEL, 2019–2023 (USD MILLION)
  • TABLE 135 SPAIN: MARKET, BY SERVICE MODEL, 2024–2029 (USD MILLION)
  • TABLE 136 ITALY: MARKET, BY ORGANIZATION SIZE, 2019–2023 (USD MILLION)
  • TABLE 137 ITALY: MARKET, BY ORGANIZATION SIZE, 2024–2029 (USD MILLION)
  • TABLE 138 ITALY: MARKET, BY SERVICE MODEL, 2019–2023 (USD MILLION)
  • TABLE 139 ITALY: MARKET, BY SERVICE MODEL, 2024–2029 (USD MILLION)
  • TABLE 140 REST OF EUROPE: MARKET, BY ORGANIZATION SIZE, 2019–2023 (USD MILLION)
  • TABLE 141 REST OF EUROPE: PRIVATE CLOUD MARKET, BY ORGANIZATION SIZE, 2024–2029 (USD MILLION)
  • TABLE 142 REST OF EUROPE: MARKET, BY SERVICE MODEL, 2019–2023 (USD MILLION)
  • TABLE 143 REST OF EUROPE: MARKET, BY SERVICE MODEL, 2024–2029 (USD MILLION)
  • TABLE 144 ASIA PACIFIC: MARKET, BY TYPE, 2019–2023 (USD MILLION)
  • TABLE 145 ASIA PACIFIC: MARKET, BY TYPE, 2024–2029 (USD MILLION)
  • TABLE 146 ASIA PACIFIC: MARKET, BY SERVICE MODEL, 2019–2023 (USD MILLION)
  • TABLE 147 ASIA PACIFIC: PRIVATE CLOUD MARKET, BY SERVICE MODEL, 2024–2029 (USD MILLION)
  • TABLE 148 ASIA PACIFIC: MARKET, BY IAAS, 2019–2023 (USD MILLION)
  • TABLE 149 ASIA PACIFIC: MARKET, BY IAAS, 2024–2029 (USD MILLION)
  • TABLE 150 ASIA PACIFIC: MARKET, BY PAAS, 2019–2023 (USD MILLION)
  • TABLE 151 ASIA PACIFIC: MARKET, BY PAAS, 2024–2029 (USD MILLION)
  • TABLE 152 ASIA PACIFIC: MARKET, BY SAAS, 2019–2023 (USD MILLION)
  • TABLE 153 ASIA PACIFIC: MARKET, BY SAAS, 2024–2029 (USD MILLION)
  • TABLE 154 ASIA PACIFIC: MARKET, BY ORGANIZATION SIZE, 2019–2023 (USD MILLION)
  • TABLE 155 ASIA PACIFIC: MARKET, BY ORGANIZATION SIZE, 2024–2029 (USD MILLION)
  • TABLE 156 ASIA PACIFIC: MARKET, BY VERTICAL, 2019–2023 (USD MILLION)
  • TABLE 157 ASIA PACIFIC: MARKET, BY VERTICAL, 2024–2029 (USD MILLION)
  • TABLE 158 ASIA PACIFIC: MARKET, BY COUNTRY, 2019–2023 (USD MILLION)
  • TABLE 159 ASIA PACIFIC: MARKET, BY COUNTRY, 2024–2029 (USD MILLION)
  • TABLE 160 CHINA: MARKET, BY ORGANIZATION SIZE, 2019–2023 (USD MILLION)
  • TABLE 161 CHINA: MARKET, BY ORGANIZATION SIZE, 2024–2029 (USD MILLION)
  • TABLE 162 CHINA: MARKET, BY SERVICE MODEL, 2019–2023 (USD MILLION)
  • TABLE 163 CHINA: MARKET, BY SERVICE MODEL, 2024–2029 (USD MILLION)
  • TABLE 164 JAPAN: MARKET, BY ORGANIZATION SIZE, 2019–2023 (USD MILLION)
  • TABLE 165 JAPAN: PRIVATE CLOUD MARKET, BY ORGANIZATION SIZE, 2024–2029 (USD MILLION)
  • TABLE 166 JAPAN: MARKET, BY SERVICE MODEL, 2019–2023 (USD MILLION)
  • TABLE 167 JAPAN: MARKET, BY SERVICE MODEL, 2024–2029 (USD MILLION)
  • TABLE 168 AUSTRALIA & NEW ZEALAND: MARKET, BY ORGANIZATION SIZE, 2019–2023 (USD MILLION)
  • TABLE 169 AUSTRALIA & NEW ZEALAND: MARKET, BY ORGANIZATION SIZE, 2024–2029 (USD MILLION)
  • TABLE 170 AUSTRALIA & NEW ZEALAND: MARKET, BY SERVICE MODEL, 2019–2023 (USD MILLION)
  • TABLE 171 AUSTRALIA & NEW ZEALAND: MARKET, BY SERVICE MODEL, 2024–2029 (USD MILLION)
  • TABLE 172 INDIA: MARKET, BY ORGANIZATION SIZE, 2019–2023 (USD MILLION)
  • TABLE 173 INDIA: MARKET, BY ORGANIZATION SIZE, 2024–2029 (USD MILLION)
  • TABLE 174 INDIA: MARKET, BY SERVICE MODEL, 2019–2023 (USD MILLION)
  • TABLE 175 INDIA: MARKET, BY SERVICE MODEL, 2024–2029 (USD MILLION)
  • TABLE 176 REST OF ASIA PACIFIC: PRIVATE CLOUD MARKET, BY ORGANIZATION SIZE, 2019–2023 (USD MILLION)
  • TABLE 177 REST OF ASIA PACIFIC: MARKET, BY ORGANIZATION SIZE, 2024–2029 (USD MILLION)
  • TABLE 178 REST OF ASIA PACIFIC: MARKET, BY SERVICE MODEL, 2019–2023 (USD MILLION)
  • TABLE 179 REST OF ASIA PACIFIC: MARKET, BY SERVICE MODEL, 2024–2029 (USD MILLION)
  • TABLE 180 MIDDLE EAST & AFRICA: MARKET, BY TYPE, 2019–2023 (USD MILLION)
  • TABLE 181 MIDDLE EAST & AFRICA: MARKET, BY TYPE, 2024–2029 (USD MILLION)
  • TABLE 182 MIDDLE EAST & AFRICA: MARKET, BY SERVICE MODEL, 2019–2023 (USD MILLION)
  • TABLE 183 MIDDLE EAST & AFRICA: MARKET, BY SERVICE MODEL, 2024–2029 (USD MILLION)
  • TABLE 184 MIDDLE EAST & AFRICA: PRIVATE CLOUD MARKET, BY IAAS, 2019–2023 (USD MILLION)
  • TABLE 185 MIDDLE EAST & AFRICA: MARKET, BY IAAS, 2024–2029 (USD MILLION)
  • TABLE 186 MIDDLE EAST & AFRICA: MARKET, BY PAAS, 2019–2023 (USD MILLION)
  • TABLE 187 MIDDLE EAST & AFRICA: MARKET, BY PAAS, 2024–2029 (USD MILLION)
  • TABLE 188 MIDDLE EAST & AFRICA: MARKET, BY SAAS, 2019–2023 (USD MILLION)
  • TABLE 189 MIDDLE EAST & AFRICA: MARKET, BY SAAS, 2024–2029 (USD MILLION)
  • TABLE 190 MIDDLE EAST & AFRICA: MARKET, BY ORGANIZATION SIZE, 2019–2023 (USD MILLION)
  • TABLE 191 MIDDLE EAST & AFRICA: MARKET, BY ORGANIZATION SIZE, 2024–2029 (USD MILLION)
  • TABLE 192 MIDDLE EAST & AFRICA: MARKET, BY VERTICAL, 2019–2023 (USD MILLION)
  • TABLE 193 MIDDLE EAST & AFRICA: MARKET, BY VERTICAL, 2024–2029 (USD MILLION)
  • TABLE 194 MIDDLE EAST & AFRICA: MARKET, BY COUNTRY, 2019–2023 (USD MILLION)
  • TABLE 195 MIDDLE EAST & AFRICA: MARKET, BY COUNTRY, 2024–2029 (USD MILLION)
  • TABLE 196 GULF COOPERATION COUNCIL COUNTRIES: MARKET, BY COUNTRY, 2019–2023 (USD MILLION)
  • TABLE 197 GULF COOPERATION COUNCIL COUNTRIES: MARKET, BY COUNTRY, 2024–2029 (USD MILLION)
  • TABLE 198 GULF COOPERATION COUNCIL COUNTRIES: MARKET, BY ORGANIZATION SIZE, 2019–2023 (USD MILLION)
  • TABLE 199 GULF COOPERATION COUNCIL COUNTRIES: PRIVATE CLOUD MARKET, BY ORGANIZATION SIZE, 2024–2029 (USD MILLION)
  • TABLE 200 GULF COOPERATION COUNCIL COUNTRIES: MARKET, BY SERVICE MODEL, 2019–2023 (USD MILLION)
  • TABLE 201 GULF COOPERATION COUNCIL COUNTRIES: MARKET, BY SERVICE MODEL, 2024–2029 (USD MILLION)
  • TABLE 202 KSA: MARKET, BY ORGANIZATION SIZE, 2019–2023 (USD MILLION)
  • TABLE 203 KSA: MARKET, BY ORGANIZATION SIZE, 2024–2029 (USD MILLION)
  • TABLE 204 KSA: MARKET, BY SERVICE MODEL, 2019–2023 (USD MILLION)
  • TABLE 205 KSA: MARKET, BY SERVICE MODEL, 2024–2029 (USD MILLION)
  • TABLE 206 UAE: MARKET, BY ORGANIZATION SIZE, 2019–2023 (USD MILLION)
  • TABLE 207 UAE: MARKET, BY ORGANIZATION SIZE, 2024–2029 (USD MILLION)
  • TABLE 208 UAE: MARKET, BY SERVICE MODEL, 2019–2023 (USD MILLION)
  • TABLE 209 UAE: MARKET, BY SERVICE MODEL, 2024–2029 (USD MILLION)
  • TABLE 210 OTHER GCC COUNTRIES: PRIVATE CLOUD MARKET, BY ORGANIZATION SIZE, 2019–2023 (USD MILLION)
  • TABLE 211 OTHER GCC COUNTRIES: MARKET, BY ORGANIZATION SIZE, 2024–2029 (USD MILLION)
  • TABLE 212 OTHER GCC COUNTRIES: MARKET, BY SERVICE MODEL, 2019–2023 (USD MILLION)
  • TABLE 213 OTHER GCC COUNTRIES: MARKET, BY SERVICE MODEL, 2024–2029 (USD MILLION)
  • TABLE 214 SOUTH AFRICA: MARKET, BY ORGANIZATION SIZE, 2019–2023 (USD MILLION)
  • TABLE 215 SOUTH AFRICA: MARKET, BY ORGANIZATION SIZE, 2024–2029 (USD MILLION)
  • TABLE 216 SOUTH AFRICA: MARKET, BY SERVICE MODEL, 2019–2023 (USD MILLION)
  • TABLE 217 SOUTH AFRICA: MARKET, BY SERVICE MODEL, 2024–2029 (USD MILLION)
  • TABLE 218 REST OF MIDDLE EAST & AFRICA: MARKET, BY ORGANIZATION SIZE, 2019–2023 (USD MILLION)
  • TABLE 219 REST OF MIDDLE EAST & AFRICA: PRIVATE CLOUD MARKET, BY ORGANIZATION SIZE, 2024–2029 (USD MILLION)
  • TABLE 220 REST OF MIDDLE EAST & AFRICA: MARKET, BY SERVICE MODEL, 2019–2023 (USD MILLION)
  • TABLE 221 REST OF MIDDLE EAST & AFRICA: MARKET, BY SERVICE MODEL, 2024–2029 (USD MILLION)
  • TABLE 222 LATIN AMERICA: MARKET, BY TYPE, 2019–2023 (USD MILLION)
  • TABLE 223 LATIN AMERICA: MARKET, BY TYPE, 2024–2029 (USD MILLION)
  • TABLE 224 LATIN AMERICA: MARKET, BY SERVICE MODEL, 2019–2023 (USD MILLION)
  • TABLE 225 LATIN AMERICA: MARKET, BY SERVICE MODEL, 2024–2029 (USD MILLION)
  • TABLE 226 LATIN AMERICA: PRIVATE CLOUD MARKET, BY IAAS, 2019–2023 (USD MILLION)
  • TABLE 227 LATIN AMERICA: MARKET, BY IAAS, 2024–2029 (USD MILLION)
  • TABLE 228 LATIN AMERICA: MARKET, BY PAAS, 2019–2023 (USD MILLION)
  • TABLE 229 LATIN AMERICA: MARKET, BY PAAS, 2024–2029 (USD MILLION)
  • TABLE 230 LATIN AMERICA: MARKET, BY SAAS, 2019–2023 (USD MILLION)
  • TABLE 231 LATIN AMERICA: MARKET, BY SAAS, 2024–2029 (USD MILLION)
  • TABLE 232 LATIN AMERICA: MARKET, BY ORGANIZATION SIZE, 2019–2023 (USD MILLION)
  • TABLE 233 LATIN AMERICA: MARKET, BY ORGANIZATION SIZE, 2024–2029 (USD MILLION)
  • TABLE 234 LATIN AMERICA: MARKET, BY VERTICAL, 2019–2023 (USD MILLION)
  • TABLE 235 LATIN AMERICA: MARKET, BY VERTICAL, 2024–2029 (USD MILLION)
  • TABLE 236 LATIN AMERICA: MARKET, BY COUNTRY, 2019–2023 (USD MILLION)
  • TABLE 237 LATIN AMERICA: MARKET, BY COUNTRY, 2024–2029 (USD MILLION)
  • TABLE 238 BRAZIL: MARKET, BY ORGANIZATION SIZE, 2019–2023 (USD MILLION)
  • TABLE 239 BRAZIL: MARKET, BY ORGANIZATION SIZE, 2024–2029 (USD MILLION)
  • TABLE 240 BRAZIL: MARKET, BY SERVICE MODEL, 2019–2023 (USD MILLION)
  • TABLE 241 BRAZIL: MARKET, BY SERVICE MODEL, 2024–2029 (USD MILLION)
  • TABLE 242 MEXICO: MARKET, BY ORGANIZATION SIZE, 2019–2023 (USD MILLION)
  • TABLE 243 MEXICO: MARKET, BY ORGANIZATION SIZE, 2024–2029 (USD MILLION)
  • TABLE 244 MEXICO: MARKET, BY SERVICE MODEL, 2019–2023 (USD MILLION)
  • TABLE 245 MEXICO: MARKET, BY SERVICE MODEL, 2024–2029 (USD MILLION)
  • TABLE 246 REST OF LATIN AMERICA: MARKET, BY ORGANIZATION SIZE, 2019–2023 (USD MILLION)
  • TABLE 247 REST OF LATIN AMERICA: PRIVATE CLOUD MARKET, BY ORGANIZATION SIZE, 2024–2029 (USD MILLION)
  • TABLE 248 REST OF LATIN AMERICA: MARKET, BY SERVICE MODEL, 2019–2023 (USD MILLION)
  • TABLE 249 REST OF LATIN AMERICA: MARKET, BY SERVICE MODEL, 2024–2029 (USD MILLION)
  • TABLE 250 OVERVIEW OF STRATEGIES ADOPTED BY KEY VENDORS
  • TABLE 251 MARKET: DEGREE OF COMPETITION, 2023
  • TABLE 252 PRIVATE CLOUD MARKET: REGION FOOTPRINT
  • TABLE 253 MARKET: TYPE FOOTPRINT
  • TABLE 254 MARKET: SERVICE MODEL FOOTPRINT
  • TABLE 255 MARKET: ORGANIZATION SIZE FOOTPRINT
  • TABLE 256 MARKET: VERTICAL FOOTPRINT
  • TABLE 257 PRIVATE CLOUD MARKET: KEY STARTUPS/SMES
  • TABLE 258 MARKET: COMPETITIVE BENCHMARKING OF KEY STARTUPS/SMES
  • TABLE 259 PRIVATE CLOUD MARKET: PRODUCT LAUNCHES & ENHANCEMENTS, 2021–2024
  • TABLE 260 PRIVATE CLOUD MARKET: DEALS, 2021–2024
  • TABLE 261 MICROSOFT: COMPANY OVERVIEW
  • TABLE 262 MICROSOFT: PRODUCTS/SOLUTIONS/SERVICES OFFERED
  • TABLE 263 MICROSOFT: PRODUCT LAUNCHES & ENHANCEMENTS
  • TABLE 264 MICROSOFT: DEALS
  • TABLE 265 AWS: COMPANY OVERVIEW
  • TABLE 266 AWS: PRODUCTS/SOLUTIONS/SERVICES OFFERED
  • TABLE 267 AWS: PRODUCT LAUNCHES & ENHANCEMENTS
  • TABLE 268 AWS: DEALS
  • TABLE 269 VMWARE: COMPANY OVERVIEW
  • TABLE 270 VMWARE: PRODUCTS/SOLUTIONS/SERVICES OFFERED
  • TABLE 271 VMWARE: PRODUCT LAUNCHES & ENHANCEMENTS
  • TABLE 272 VMWARE: DEALS
  • TABLE 273 IBM: COMPANY OVERVIEW
  • TABLE 274 IBM: PRODUCTS/SOLUTIONS/SERVICES OFFERED
  • TABLE 275 IBM: PRODUCT LAUNCHES & ENHANCEMENTS
  • TABLE 276 IBM: DEALS
  • TABLE 277 HPE: COMPANY OVERVIEW
  • TABLE 278 HPE: PRODUCTS/SOLUTIONS/SERVICES OFFERED
  • TABLE 279 HPE: PRODUCT LAUNCHES & ENHANCEMENTS
  • TABLE 280 HPE: DEALS
  • TABLE 281 GOOGLE: COMPANY OVERVIEW
  • TABLE 282 GOOGLE: PRODUCTS/SOLUTIONS/SERVICES OFFERED
  • TABLE 283 GOOGLE: PRODUCT LAUNCHES AND ENHANCEMENTS
  • TABLE 284 GOOGLE: DEALS
  • TABLE 285 ORACLE: BUSINESS OVERVIEW
  • TABLE 286 ORACLE: PRODUCTS/SOLUTIONS/SERVICES OFFERED
  • TABLE 287 ORACLE: PRODUCT LAUNCHES & ENHANCEMENTS
  • TABLE 288 ORACLE: DEALS
  • TABLE 289 ALIBABA CLOUD: COMPANY OVERVIEW
  • TABLE 290 ALIBABA CLOUD: PRODUCTS/SOLUTIONS/SERVICES OFFERED
  • TABLE 291 ALIBABA CLOUD: PRODUCT ENHANCEMENTS
  • TABLE 292 ALIBABA CLOUD: DEALS
  • TABLE 293 SAP: COMPANY OVERVIEW
  • TABLE 294 SAP: PRODUCTS/SOLUTIONS/SERVICES OFFERED
  • TABLE 295 SAP: PRODUCT LAUNCHES
  • TABLE 296 SAP: DEALS
  • TABLE 297 CISCO: COMPANY OVERVIEW
  • TABLE 298 CISCO: PRODUCTS/SOLUTIONS/SERVICES OFFERED
  • TABLE 299 CISCO: PRODUCT/SOLUTION/SERVICE LAUNCHES & ENHANCEMENTS
  • TABLE 300 CISCO: DEALS
  • TABLE 301 CLOUD COMPUTING MARKET, BY SERVICE MODEL, 2018–2022 (USD BILLION)
  • TABLE 302 CLOUD COMPUTING MARKET, BY SERVICE MODEL, 2023–2028 (USD BILLION)
  • TABLE 303 PUBLIC CLOUD MARKET, BY ORGANIZATION SIZE, 2017–2021 (USD BILLION)
  • TABLE 304 PUBLIC CLOUD MARKET, BY ORGANIZATION SIZE, 2022–2027 (USD BILLION)
LIST OF FIGURES
 
  • FIGURE 1 MARKET: RESEARCH DESIGN
  • FIGURE 2 PRIVATE CLOUD MARKET: MARKET BREAKUP AND DATA TRIANGULATION
  • FIGURE 3 MARKET: TOP-DOWN AND BOTTOM-UP APPROACHES
  • FIGURE 4 MARKET SIZE ESTIMATION METHODOLOGY: TOP-DOWN APPROACH
  • FIGURE 5 MARKET SIZE ESTIMATION METHODOLOGY: BOTTOM-UP APPROACH
  • FIGURE 6 PRIVATE CLOUD MARKET: RESEARCH FLOW
  • FIGURE 7 MARKET SIZE ESTIMATION METHODOLOGY: SUPPLY-SIDE ANALYSIS
  • FIGURE 8 MARKET SIZE ESTIMATION METHODOLOGY: BOTTOM-UP APPROACH FROM SUPPLY SIDE – COLLECTIVE REVENUE OF VENDORS
  • FIGURE 9 DEMAND-SIDE APPROACH: PRIVATE CLOUD MARKET
  • FIGURE 10 TOP MARKET SEGMENTS IN TERMS OF GROWTH RATE
  • FIGURE 11 NORTH AMERICA TO ACCOUNT FOR LARGEST MARKET SHARE DURING FORECAST PERIOD
  • FIGURE 12 GLOBALIZATION AND COMMUNICATION NEEDS DRIVE ADOPTION OF PRIVATE CLOUD SOLUTIONS FOR SEAMLESS COLLABORATION
  • FIGURE 13 VIRTUAL PRIVATE CLOUD SEGMENT TO ACCOUNT FOR LARGEST MARKET SHARE DURING FORECAST PERIOD
  • FIGURE 14 SAAS SEGMENT TO ACCOUNT FOR LARGEST MARKET SHARE DURING FORECAST PERIOD
  • FIGURE 15 LARGE ENTERPRISES SEGMENT TO ACCOUNT FOR LARGER MARKET SHARE DURING FORECAST PERIOD
  • FIGURE 16 BFSI SEGMENT TO ACCOUNT FOR LARGEST MARKET SHARE IN 2029
  • FIGURE 17 ASIA PACIFIC TO EMERGE AS BEST MARKET FOR INVESTMENTS IN NEXT FIVE YEARS
  • FIGURE 18 DRIVERS, RESTRAINTS, OPPORTUNITIES, AND CHALLENGES: PRIVATE CLOUD MARKET
  • FIGURE 19 KEY PLAYERS IN PRIVATE CLOUD MARKET
  • FIGURE 20 PRIVATE CLOUD MARKET: VALUE CHAIN
  • FIGURE 21 NUMBER OF PATENTS PUBLISHED, 2013–2023
  • FIGURE 22 TOP 10 PATENT APPLICANTS (GLOBAL) IN 2023
  • FIGURE 23 PORTER’S FIVE FORCES’ ANALYSIS: PRIVATE CLOUD MARKET
  • FIGURE 24 MARKET: TRENDS/DISRUPTIONS IMPACTING CUSTOMERS’ BUSINESSES
  • FIGURE 25 INFLUENCE OF STAKEHOLDERS ON BUYING PROCESS FOR TOP THREE VERTICALS
  • FIGURE 26 KEY BUYING CRITERIA FOR TOP THREE VERTICALS
  • FIGURE 27 LEADING PRIVATE CLOUD MARKET VENDORS, BY NUMBER OF INVESTORS AND FUNDING ROUNDS, 2023
  • FIGURE 28 GEN AI IN PRIVATE CLOUD, 2023
  • FIGURE 29 IAAS SEGMENT TO GROW AT HIGHEST CAGR DURING FORECAST PERIOD
  • FIGURE 30 NETWORK SEGMENT TO GROW AT HIGHEST CAGR DURING FORECAST PERIOD
  • FIGURE 31 APPLICATION TESTING & QUALITY SEGMENT TO GROW AT HIGHEST CAGR DURING FORECAST PERIOD
  • FIGURE 32 COLLABORATION & PRODUCTIVITY TOOLS SEGMENT TO GROW AT HIGHER CAGR DURING FORECAST PERIOD
  • FIGURE 33 MANAGED PRIVATE CLOUD SEGMENT TO REGISTER HIGHEST CAGR DURING FORECAST PERIOD
  • FIGURE 34 SMALL AND MEDIUM-SIZED ENTERPRISES SEGMENT TO REGISTER HIGHER CAGR DURING FORECAST PERIOD
  • FIGURE 35 BFSI SEGMENT TO ACCOUNT FOR LARGEST MARKET IN 2024
  • FIGURE 36 NORTH AMERICA TO ACCOUNT FOR LARGEST MARKET DURING FORECAST PERIOD
  • FIGURE 37 NORTH AMERICA: MARKET SNAPSHOT
  • FIGURE 38 ASIA PACIFIC: MARKET SNAPSHOT
  • FIGURE 39 PRIVATE CLOUD MARKET: MARKET SHARE ANALYSIS
  • FIGURE 40 BRAND COMPARISON/VENDOR PRODUCT LANDSCAPE
  • FIGURE 41 HISTORICAL REVENUE ANALYSIS, 2019–2023 (USD MILLION)
  • FIGURE 42 COMPANY EVALUATION MATRIX FOR KEY PLAYERS: CRITERIA WEIGHTAGE
  • FIGURE 43 COMPANY EVALUATION MATRIX: KEY PLAYERS, 2023
  • FIGURE 44 PRIVATE CLOUD MARKET: COMPANY FOOTPRINT
  • FIGURE 45 MARKET: COMPANY EVALUATION MATRIX (STARTUPS/SMES), 2023
  • FIGURE 46 COMPANY VALUATION AND FINANCIAL METRICS
  • FIGURE 47 YEAR-TO-DATE (YTD) PRICE TOTAL RETURN AND 5-YEAR STOCK BETA OF KEY VENDORS
  • FIGURE 48 MICROSOFT: COMPANY SNAPSHOT
  • FIGURE 49 AWS: COMPANY SNAPSHOT
  • FIGURE 50 VMWARE: COMPANY SNAPSHOT
  • FIGURE 51 IBM: COMPANY SNAPSHOT
  • FIGURE 52 HPE: COMPANY SNAPSHOT
  • FIGURE 53 GOOGLE: COMPANY SNAPSHOT
  • FIGURE 54 ORACLE: COMPANY SNAPSHOT
  • FIGURE 55 ALIBABA CLOUD: COMPANY SNAPSHOT
  • FIGURE 56 SAP: COMPANY SNAPSHOT
  • FIGURE 57 CISCO: COMPANY SNAPSHOT


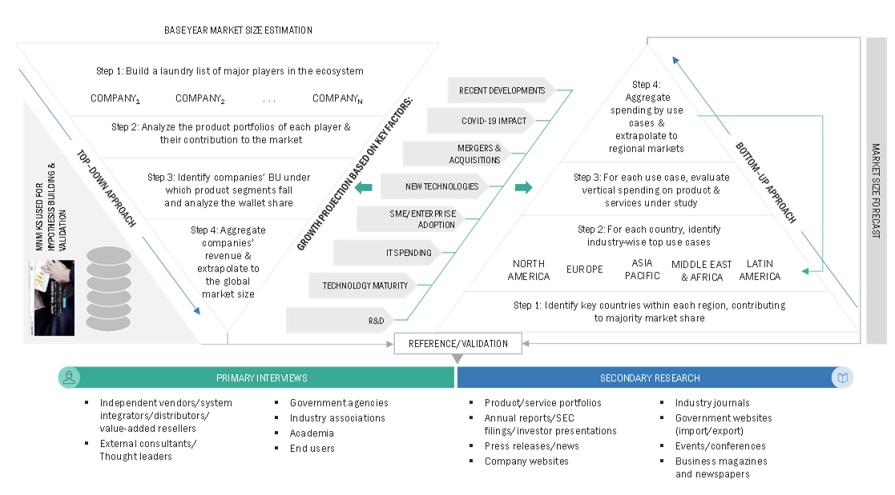
The study comprised four main activities to estimate the private cloud market size. We conducted significant secondary research to gather data on the market, the competing market, and the parent market. The following stage involved conducting primary research to confirm these conclusions and hypotheses and sizing with industry experts throughout the value chain. The overall market size was evaluated using a blend of top-down and bottom-up approach methodologies. After that, we estimated the market sizes of the various market segments using the market breakup and data triangulation techniques.

Secondary Research

We determined the size of companies offering private cloud markets and services based on secondary data from paid and unpaid sources. It was also arrived at by analyzing the product portfolios of major companies and rating the companies based on their performance and quality.

In the secondary research process, various sources were referred to identify and collect information for this study. Secondary sources included annual reports, press releases, and investor presentations of companies; white papers, journals, and certified publications; and articles from recognized authors, directories, and databases. The data was also collected from other secondary sources, such as journals, government websites, blogs, and vendors' websites. Additionally, the spending of various countries on the private cloud market was extracted from the respective sources. We used secondary research to obtain the critical information related to the industry's value chain and supply chain to identify the key players based on solutions, services, market classification, and segmentation according to components of the major players, industry trends related to components, users, and regions, and the key developments from both market- and technology-oriented perspectives.

Primary Research

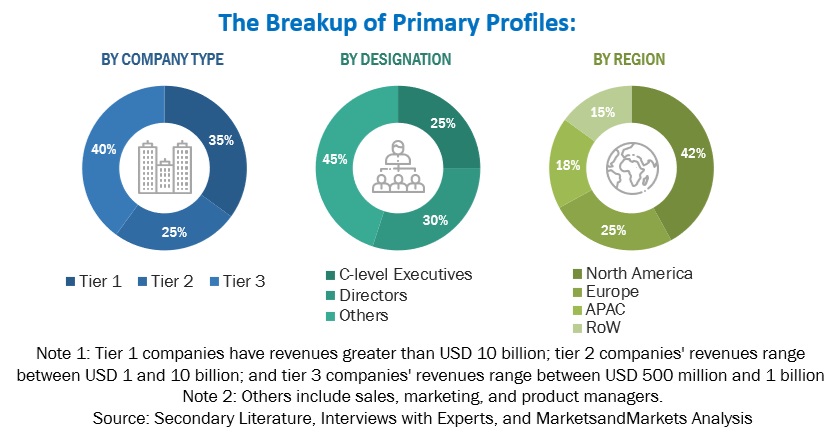
in the primary research process, we interviewed various primary sources from the supply and demand sides of the private cloud market to obtain qualitative and quantitative information. The primary sources from the supply side included industry experts, such as Chief Executive Officers (CEOs), Vice Presidents (VPs), marketing directors, technology and innovation directors, and related key executives from vendors providing private cloud offerings, associated service providers; and is operating in the targeted countries. all possible parameters that affect the market covered in this research study have been accounted for, viewed in extensive detail, verified through primary research, and analyzed to arrive at the final quantitative and qualitative data.

After the complete market engineering process (including calculations for market statistics, market breakup, market size estimations, market forecasting, and data triangulation), we conducted extensive primary research to gather information and verify and validate the critical numbers arrived at. The primary research also helped identify and validate the segmentation, industry trends, key players, competitive landscape, and market dynamics, such as drivers, restraints, opportunities, challenges, and key strategies. In the complete market engineering process, the bottom-up approach and several data triangulation methods were extensively used to perform market estimation and market forecasting for the overall market segments and subsegments listed in this report. We conducted an extensive qualitative and quantitative analysis of the complete market engineering process to list the key information/insights throughout the report.
Private Cloud Market  Size, and Share

To know about the assumptions considered for the study, download the pdf brochure

Market Size Estimation

The private cloud market and related submarkets were estimated and forecasted using top-down and bottom-up methodologies. We used the bottom-up method to determine the market's overall size, using the revenues and product offerings of the major market players. This research ascertained and validated the precise value of the total parent market size through data triangulation techniques and primary interview validation. Next, using percentage splits of the market segments, we utilized the overall market size in the top-down approach to estimate the size of other individual markets.

Top Down and Bottom Up Approach of Private Cloud Market.
Private Cloud Market Top Down and Bottom Up Approach

To know about the assumptions considered for the study, Request for Free Sample Report

The research methodology used to estimate the market size included the following:

  • We used primary and secondary research to determine the revenue contributions of the major market participants in each country after secondary research helped identify them.
  • Throughout the process, we obtained critical insights by conducting in-depth interviews with industry professionals, including directors, CEOs, VPs, and marketing executives, and by reading the annual and financial reports of the top firms in the market.
  • We used primary sources to verify all percentage splits and breakups, which we calculated using secondary sources.

Data Triangulation

Once the overall market size was determined, we divided the market into segments and subsegments using the previously described market size estimation procedures. When required, market breakdown and data triangulation procedures were employed to complete the market engineering process and specify the exact figures for every market segment and subsegment. The data was triangulated by examining several variables and patterns from government entities' supply and demand sides.

Market Definition

According to MarketsandMarkets, the Private cloud is one of the segments in the Cloud Computing sectors that remains focused on rendering and processing private content, including images, videos & graphic-intensive applications. This platform offers powerful utilities for rendering, video encoding, and real-time streaming work-flows running tailored private online experiences utilizing superior cloud infrastructure. These private cloud solutions are particularly useful for use cases like media and entertainment, gaming, virtual/augmented reality, or SaaS remote work where scalability is required without investing heavily in on-premises hardware. These include video conferencing, virtual desktops, a high-performance small footprint cache for hyper-fast data privatization, or even burst storage accelerated in cloud gaming.

Key Stakeholders

  • Training and consulting service providers
  • Information Technology (IT) infrastructure providers
  • Private cloud solutions providers
  • Private cloud service providers
  • Government organizations and standardization bodies
  • Network Administrators
  • Compliance Officers
  • Application Developers
  • Private Cloud Architects

Report Objectives

  • To define, describe, and forecast the private cloud market based on type, service model, organization size, vertical, and region.
  • To provide detailed information about the significant factors, such as drivers, opportunities, restraints, and challenges, influencing the growth of the market
  • To analyze the opportunities in the market for stakeholders by identifying the high-growth segments of the market
  • To forecast the market size concerning five central regions — North America, Europe, Asia Pacific, the Middle East & Africa, and Latin America
  • To analyze the subsegments of the market concerning individual growth trends, prospects, and contributions to the overall market
  • To profile the market's key players and comprehensively analyze their size and core competencies
  • To track and analyze the competitive developments, such as product enhancements, product launches, acquisitions, partnerships, and collaborations, in the private cloud market globally

Available Customizations

MarketsandMarkets provides customizations based on the company's unique requirements using market data. The following customization options are available for the report:

Product analysis

  • The product matrix provides a detailed comparison of each company's portfolio.

Geographic Analysis

  • Further breakup of the private cloud market

Company Information

  • Detailed analysis and profiling of five additional market players

Previous Versions of this Report

"Our USP is "providing game-changing business opportunities reports with free customization" - so please feel free to provide us with your specific areas of interest / business challenges in much greater detail !!"

We appreciate your interest in this report. Once you fill out the form, you'll be immediately directed to an exclusive solution tailored to your needs. This high-value offering can help boost your revenue by 30% - a must-see opportunity for anyone looking to maximize growth.


By clicking the "Submit" button, you are agreeing to the Terms of Use and Privacy Policy.

Custom Market Research Services

We Will Customise The Research For You, In Case The Report Listed Above Does Not Meet With Your Requirements

Get 10% Free Customisation

Growth opportunities and latent adjacency in Private Cloud Market

DMCA.com Protection Status