Precision Irrigation Market

Report Code AGI 9208
Published in Oct, 2024, By MarketsandMarkets™
Download PDF

Choose License Type

Buy Report Now Inquire Before Buying

Precision Irrigation Market by Type (Sprinkler Irrigation, Drip Irrigation), Component (Controllers, Sensors, Water Flow Meters), Technology Type, End Use (Agriculture, Nonagriculture), and Region - Global Forecast to 2029

Overview

The global precision Irrigation Market is projected to expand from USD 4.18 billion in 2024 to reach USD 6.29 billion by 2029, at a CAGR of 8.5% during the forecast period. The need to boost agricultural productivity and the labor shortage drive market growth. Traditional farming faces labor shortages, increasing the demand for advanced irrigation technologies that enhance productivity and minimize manual labor. For instance, the USDA’s 2022 Census of Agriculture revealed a loss of 141,733 farms in the US from 2017 to 2022, highlighting the urgent need for solutions to improve efficiency and promote sustainable farming practices.

Precision Irrigation Market

Attractive Opportunities in the Precision Irrigation Market

ASIA PACIFIC

Asia Pacific's high vulnerability to climate change impacts, such as prolonged droughts and erratic rainfall patterns drives the market in the region.

The precision irrigation market is projected to record a CAGR of 8.5% during the study period, to reach USD 6.3 billion by 2029.

Partnerships and the introduction of new products are expected to present profitable prospects for industry participants in the next five years.

Growing global concerns over water scarcity and the need for efficient water management in agriculture fuel the increased adoption of precision irrigation.

The rising demand for higher crop yields to meet global food security challenges is encouraging farmers to further invest in advanced precision irrigation systems for improved productivity, further boosting its demand.

Global Precision Irrigation Market Dynamics

Drivers: Government initiatives to promote water conservation

Government initiatives aimed at promoting water conservation have significantly driven the growth of the precision irrigation market. Water scarcity and climate variability are among the pressing issues that governments worldwide are tackling with the implementation of policies that promote efficient use of water. These initiatives typically provide financial incentives for farmers to adopt advanced irrigation technologies, along with technical support and educational programs that showcase the advantages of precision irrigation. For instance, in June 2023, the World Bank's Board of Executive Directors approved a loan of USD 148 million to help West Bengal, India, enhance its irrigation practices. This project aimed to improve the management of surface and groundwater in rural areas that experience erratic rainfall and high temperatures. The initiative targeted bringing 30,000 hectares under new irrigation schemes, using innovative methods like solar irrigation pumping systems, sprinkler systems, and drip irrigation.

These government-supported programs facilitate the adoption of precision irrigation technologies and promote sustainable agricultural practices. By emphasizing efficient water management, they contribute to raising agricultural yields while protecting priceless water resources, proving the value of precision irrigation in modern farming practices.

Restraints: High initial investment costs of precision irrigation systems

High initial investment costs have severely hampered precision irrigation since these systems frequently demand large sums of money. Technologies, such as sensors and automated controls, are used in these advanced systems to optimize water usage and require substantial upfront capital for equipment and installation. Many farmers, particularly those in developing regions, struggle to afford these expenses, leading to slower adoption rates. The need for skilled labor and ongoing maintenance drives the cost, slowing down the adoption of precision irrigation.

Moreover, the return on investment (ROI) associated with precision irrigation can be unpredictable and varies greatly based on a number of variables, including the type of crop, the climate, and specific farm management techniques. Farmers often hesitate to invest in such technology without clear evidence of substantial long-term savings or yield increases. An additional barrier is the complexity of these systems, which requires farmers to spend time and money learning new technologies and becoming acquainted with them. Smallholder farmers face additional challenges due to the limited financing options for precision irrigation. This means that the high initial costs make it difficult for them to adopt precision irrigation, which in turn slows progress in sustainable farming practices.


Opportunities:Increasing adoption of precision agriculture and sustainable practices

The increasing adoption of precision agriculture and sustainable practices has significantly boosted the precision irrigation market, creating substantial opportunities for growth. With precision irrigation, crops receive precisely the right amount of water at the right stage of growth due to the use of modern technologies like sensors, drones, and satellite imagery. This strategy improves crop yields while conserving water resources, consistent with sustainable agricultural methods. Farmers are turning towards smart irrigation systems due to growing awareness of the negative environmental effects of excessive irrigation. These systems leverage data analytics to monitor soil moisture levels, weather conditions, and crop requirements, enabling real-time adjustments to irrigation schedules. The potential of precision irrigation is enhanced by integrating Internet of Things (IoT) technology, which provides farmers with valuable insights and improves overall water management.

Additionally, precision irrigation technologies are gaining popularity due to government initiatives that promote sustainable farming practices and the increasing demand for organic produce. The precision irrigation market is poised for growth as the world's water needs grow, providing innovative options that maximize resource efficiency while supporting sustainable agriculture. This trend helps achieve both wider environmental goals and financial benefits for farmers.

Challenges: Lack of training and awareness among farmers

The lack of proper training and awareness among farmers is among the main challenges in the precision irrigation market. Precision irrigation maximizes water use by utilizing modern innovations such as automated systems, weather data analytics, and sensors. However, many farmers, particularly in developing countries, lack the technical knowledge to comprehend and effectively implement these systems. This knowledge gap limits their ability to leverage the full benefits of precision irrigation, which include increased crop yields and reduced water waste.

Furthermore, because of these technologies' perceived complexity and high initial costs, farmers may be reluctant to adopt them without adequate training. Many are unfamiliar with the long-term savings and sustainability advantages of precision irrigation, further stalling its adoption. Awareness programs, tailored training, and government or industry-supported initiatives are crucial to overcoming these barriers. These efforts would improve farmers' technical capabilities and foster a better understanding of how precision irrigation systems can enhance productivity and water efficiency in the long run. Precision irrigation can increase agricultural productivity overall, but its growth will be limited if this challenge is not addressed.

Global Precision Irrigation Market Ecosystem Analysis

Prominent companies in this market include well-established, financially stable manufacturers of precision irrigation. These companies have been operating in the market for several years and possess a diversified product portfolio, state-of-the-art technologies, and strong global sales and marketing networks. Prominent companies in this market include Valmont Industries, Inc. (US), NETAFIM (Israel), Hunter Industries Inc. (US), The Toro Company (US), and Rain Bird Corporation (US).

Top Companies in Precision Irrigation Market
 

Based on type, the drip irrigation segment is estimated to grow at the highest CAGR during the studied period.

The increasing need for effective water management in agriculture drives the demand for drip irrigation within the precision irrigation market. This technique greatly reduces runoff and evaporation by delivering water straight to plant roots through a network of emitters and tubing. As global water scarcity worsens, farmers seek solutions that maximize water use, making drip irrigation popular. The ability of drip irrigation to deliver targeted irrigation at a 50% lower water consumption than conventional techniques makes it crucial for precision agriculture. It ensures that plants get regular nutrients and moisture, encouraging healthier growth and improving crop quality and yield. Furthermore, drip irrigation systems can be combined with other precision technologies, like soil moisture sensors and weather forecasting tools, to increase efficacy. This is because they are very flexible.

The segment is projected to grow at the highest CAGR as more farmers recognize its long-term cost-effectiveness, improved resource management, and adaptability to diverse cropping systems. In comparison, while sprinkler irrigation is effective, it can waste significant water due to evaporation and wind drift, making drip irrigation a more sustainable choice in modern agricultural practices.

Based on component, the sensors segment is estimated to grow at the highest CAGR during the studied period.

The sensors segment of the precision irrigation market is projected to experience significant growth due to the rising demand for efficient water management and improved agricultural productivity. Sensors are crucial for precision irrigation, as they deliver real-time data on temperature, humidity, soil moisture levels, and other environmental factors. By using this information, farmers can apply water to optimize plant health and conserve water. Moreover, the need for sensors is also driven by rising awareness of sustainable farming methods. Farmers are searching for creative ways to reduce water waste and boost crop yields as the water crisis becomes more urgent. Sensors facilitate this by allowing for precise, on-demand irrigation, tailoring water application to the specific needs of crops, and minimizing runoff. Since sensors provide a more thorough approach to data-driven irrigation than other components like controllers and water flow meters, they are projected to grow at a higher CAGR. While controllers automate irrigation schedules and water flow meters measure usage, sensors provide vital data to inform those systems. This synergy enhances overall system effectiveness, making sensors indispensable in advancing precision irrigation technologies.

The Asia Pacific region is anticipated to experience rapid growth between 2024 and 2029.

The Asia Pacific region is expected to witness the highest growth rate for the precision irrigation market due to several key factors, such as rapid advancements in agriculture, increasing water scarcity, and strong government initiatives aimed at improving irrigation efficiency. Initiatives such as the Pradhan Mantri Krishi Sinchayee Yojana (PMKSY), which encourages effective irrigation techniques and technologies, have been helping nations like India prioritize water conservation. This program aims to expand irrigation coverage under the slogan "Har Khet ko Pani," which emphasizes the efficient use of water through precision irrigation technologies.

PMKSY encourages modern irrigation methods like drip and sprinkler systems, which are essential for optimizing water usage and increasing crop yields. The program also promotes infrastructure development by offering funding for the construction of facilities like distribution systems and silt traps. Currently, drip irrigation has successfully covered 532,000 hectares under PMKSY, highlighting the government's dedication to effective irrigation solutions.

Furthermore, growing population demands, climate change, and the need for sustainable farming practices are driving the adoption of precision irrigation technologies. Asia Pacific's growth in the precision irrigation market is expected to outpace other regions by a significant margin as long as it keeps investing in modern agricultural and water management systems.

HIGHEST CAGR MARKET IN 2024-2030
INDIA FASTEST GROWING MARKET IN THE REGION
Precision Irrigation Market

Recent Developments of Precision Irrigation Market

  • In September 2024, Rivulis (Israel) announced the opening of its largest micro-irrigation manufacturing facility in North America. This 160,000-square-foot facility in Tijuana, Mexico, will manufacture T-Tape goods. With its advanced technology, the new facility has produced about 200 jobs locally, is built for future growth, and maximizes recycled materials and product quality.
  • In August 2024, Rain Bird Corporation (US) announced the acquisition of Adritec Group International's Jordanian and Mexican assets. This acquisition is expected to enhance Rain Bird's agricultural irrigation capabilities in the Middle East, Africa, and Latin America. It enables the business to take advantage of Adritec's experience and broaden its product line, particularly in drip irrigation.
  • In April 2024, Mahindra Irrigation (India) announced that it had received contracts to supply micro-irrigation systems for about 2,700 hectares of land. The contract is worth USD 1.59 million and will be completed within a year.
  • In January 2024, Lindsay Corporation (US) introduced FieldNET NextGen, a new user interface for its FieldNET platform that makes managing precision irrigation easier. The new interface offered farmers clear and intuitive maps, graphics, and real-time analytics for efficient irrigation control and monitoring. It features better mapping, intelligent reporting, and remote control, giving farmers a complete view of their fields.

Key Market Players

List of Top Precision Irrigation Market Companies

The global Market is dominated by a few major players that have a wide regional presence. The major players in the Precision Irrigation Market are

Want to explore hidden markets that can drive new revenue in Precision Irrigation Market?

Scope of the Report

Report Attribute Details
Market size available for years 2024–2029
Base year considered 2023
Forecast period 2024–2029
Forecast units Value (USD)
Segments Covered By Type, By Technology Type, By Component, By End Use, and By Region
Regions covered North America, Europe, Asia Pacific, South America, and RoW


Key Questions Addressed by the Report

What is the current size of the precision irrigation market?
The precision irrigation market is estimated at USD 4.18 billion in 2024 and is projected to reach USD 6.29 billion by 2029 at a CAGR of 8.5%.
What are the key market players, and how intense is the competition?
The key market players include Valmont Industries, Inc. (US), NETAFIM (Israel), Hunter Industries Inc. (US), The Toro Company (US), Rain Bird Corporation (US), Lindsay Corporation (US), Rivulis (Israel), HydroPoint (US), REINKE MANUFACTURING CO., INC. (US), AZUD (Spain), T-L Irrigation (US), and Mahindra Irrigation (India).
The precision irrigation market is expanding rapidly, with increasing mergers, acquisitions, partnerships, and product launches. Companies in this sector are also heavily investing in research and development.
Which region is estimated to account for the largest share of the precision irrigation market in 2024?
North America is estimated to dominate the precision irrigation market in 2024. Water scarcity, government regulations on water usage, and the need for improved agricultural productivity in response to climate variability accelerate the market growth in the region.
What kind of information is provided in the company profiles section?
The provided company profiles deliver crucial details, including a thorough business summary that covers different segments, financial results, geographic presence, revenue distribution, and business revenue breakdown. They also offer insights into product lines, key achievements, and expert analyst opinions to better illustrate the company's potential.
What are the factors driving the precision irrigation market?
Government initiatives to promote water conservation, growing advancements in technological capabilities of precision irrigation systems, and rising mechanization & adoption of smart agricultural technologies are increasing the demand for precision irrigation.


Personalize This Research

  • Triangulate with your Own Data
  • Get Data as per your Format and Definition
  • Gain a Deeper Dive on a Specific Application, Geography, Customer or Competitor
  • Any level of Personalization
Request A Free Customisation

Let Us Help You

  • What are the Known and Unknown Adjacencies Impacting the Precision Irrigation Market
  • What will your New Revenue Sources be?
  • Who will be your Top Customer; what will make them switch?
  • Defend your Market Share or Win Competitors
  • Get a Scorecard for Target Partners
Customized Workshop Request

Table Of Contents

Exclusive indicates content/data unique to MarketsandMarkets and not available with any competitors.

TITLE
PAGE NO
INTRODUCTION
39
RESEARCH METHODOLOGY
44
EXECUTIVE SUMMARY
56
PREMIUM INSIGHTS
62
PRECISION IRRIGATION MARKET OVERVIEW
68
  • 5.1 INTRODUCTION
  • 5.2 MACROECONOMIC OUTLOOK
    INCREASING POPULATION DENSITY
    CLIMATE CHANGE
  • 5.3 MARKET DYNAMICS
    DRIVERS
    - Rising mechanization and adoption of smart agricultural technologies
    - Government initiatives to promote water conservation
    RESTRAINTS
    - High initial investment costs of precision irrigation systems
    - Data collection and data management in precision irrigation systems
    OPPORTUNITIES
    - Increasing adoption of precision agriculture and sustainable practices
    - Growing advancements in technological capabilities of precision irrigation systems
    CHALLENGES
    - Lack of training and awareness among farmers
    - Implementation of precision irrigation in fragmented land holdings
  • 5.4 IMPACT OF GEN AI ON PRECISION IRRIGATION MARKET
    INTRODUCTION
    USE OF GEN AI IN PRECISION IRRIGATION
    CASE STUDY ANALYSIS
    - Viridix's Gen3 Auto-Pilot system enabled real-time monitoring of root activity and implement tailored smart irrigation protocols
    - Treetoscope’s commercial device helps sense plant’s internal water flow
    IMPACT OF GEN AI ON PRECISION IRRIGATION MARKET
    ADJACENT ECOSYSTEMS WORKING ON GEN AI
PRECISION IRRIGATION INDUSTRY TRENDS
82
  • 6.1 INTRODUCTION
  • 6.2 SUPPLY CHAIN ANALYSIS
  • 6.3 VALUE CHAIN ANALYSIS
    RESEARCH & DEVELOPMENT
    MANUFACTURING
    DISTRIBUTION
    MARKETING & SALES
    POST-SALE SERVICES
  • 6.4 TRADE ANALYSIS
    EXPORT SCENARIO OF HS CODE 842482
    IMPORT SCENARIO OF HS CODE 842482
  • 6.5 TECHNOLOGY ANALYSIS
    KEY TECHNOLOGIES
    - Integration of IoT in irrigation
    - Integration of AI in irrigation systems
    - Machine learning
    COMPLEMENTARY TECHNOLOGIES
    - Soil moisture sensors
    - Digital image processing
    ADJACENT TECHNOLOGIES
    - Precision agriculture
  • 6.6 PRICING ANALYSIS
    AVERAGE SELLING PRICE TREND OF KEY PLAYERS, BY TYPE
    AVERAGE SELLING PRICE TREND, BY TYPE, 2023
    AVERAGE SELLING PRICE TREND, BY REGION, 2019–2023
  • 6.7 ECOSYSTEM ANALYSIS
    DEMAND SIDE
    SUPPLY SIDE
  • 6.8 TRENDS/DISRUPTIONS IMPACTING CUSTOMERS’ BUSINESSES
  • 6.9 PATENT ANALYSIS
  • 6.10 KEY CONFERENCES & EVENTS
  • 6.11 REGULATORY LANDSCAPE
    REGULATORY BODIES, GOVERNMENT AGENCIES, AND OTHER ORGANIZATIONS
  • 6.12 REGULATORY LANDSCAPE
    NORTH AMERICA
    - US
    - United States Department of Agriculture (USDA)
    EUROPE
    - Regulation 167/2013 on wheeled agricultural or forestry tractors
    ASIA PACIFIC
    - India
    - Japan
    - China
    - Australia
    MIDDLE EAST
    - UAE
    AFRICA
  • 6.13 PORTER’S FIVE FORCES ANALYSIS
    INTENSITY OF COMPETITIVE RIVALRY
    BARGAINING POWER OF SUPPLIERS
    BARGAINING POWER OF BUYERS
    THREAT OF SUBSTITUTES
    THREAT OF NEW ENTRANTS
  • 6.14 KEY STAKEHOLDERS & BUYING CRITERIA
    KEY STAKEHOLDERS IN BUYING PROCESS
    BUYING CRITERIA
  • 6.15 CASE STUDY ANALYSIS
    VALLEY IRRIGATION’S SMART WATER MANAGEMENT SOLUTION HELPED MCCLURE FARMS MEET ADDITIONAL WATER REQUIREMENTS DURING CROP GROWING SEASON
    HYDROPOINT’S WEATHERTRAK HELPED LEED PLATINUM RESEARCH CAMPUS ACHIEVE SUSTAINABILITY GOALS
  • 6.16 INVESTMENT AND FUNDING SCENARIO
PRECISION IRRIGATION MARKET, BY TYPE
121
  • 7.1 INTRODUCTION
  • 7.2 SPRINKLER IRRIGATION
    SURGING NEED TO INCREASE RESOURCE EFFICIENCY, MAXIMIZE AGRICULTURAL PRODUCTIVITY, AND SAVE COSTS TO DRIVE MARKET
    TRADITIONAL SPRINKLERS
    - Cheap prices, ease of operation, and low maintenance to drive demand for traditional sprinkler systems
    CENTER PIVOT SPRINKLERS
    - Low labor & maintenance requirements, convenience, performance, and flexibility to propel market growth
    LATERAL/LINEAR MOVE SPRINKLERS
    - Low capital costs and uniform pressure along length to boost market
  • 7.3 DRIP IRRIGATION
    IMPROVED YIELD & QUALITY AND ABILITY TO MAINTAIN UNIFORM MOISTURE NEAR ROOT ZONE TO BOLSTER MARKET GROWTH
    SURFACE DRIP IRRIGATION
    - Low cost of installation and easy navigability to boost market
    SUBSURFACE DRIP IRRIGATION
    - Efficient water use, healthy root development, reduced weed growth, and enhanced accessibility to foster market growth
  • 7.4 OTHER TYPES
PRECISION IRRIGATION MARKET, BY TECHNOLOGY TYPE
133
  • 8.1 INTRODUCTION
  • 8.2 IOT-BASED PRECISION IRRIGATION
    PRECISION FARMING THROUGH REAL-TIME DATA COLLECTION AND ANALYSIS TO DRIVE MARKET
  • 8.3 AI & ML ALGORITHMS IN IRRIGATION
    INCREASING DEMAND FOR MONITORING REAL-TIME DATA AND DATA-DRIVEN DECISION-MAKING TO ACCELERATE MARKET GROWTH
  • 8.4 GPS- AND GIS-BASED IRRIGATION
    INCREASING NEED FOR CREATION OF TAILORED IRRIGATION PLANS BASED ON SPECIFIC FIELD CONDITIONS TO DRIVE MARKET
  • 8.5 CLOUD COMPUTING & DATA ANALYTICS
    RISING DEMAND FOR ENHANCED DECISION-MAKING, IMPROVED WATER EFFICIENCY, AND SUSTAINABLE AGRICULTURE TO PROPEL MARKET GROWTH
PRECISION IRRIGATION MARKET, BY COMPONENT
140
  • 9.1 INTRODUCTION
  • 9.2 CONTROLLERS
    GROWING NEED FOR OPTIMIZING WATER USAGE AND IMPROVING OVERALL EFFICIENCY TO DRIVE DEMAND FOR CONTROLLERS
  • 9.3 SENSORS
    SURGING DEMAND FOR DETERMINATION OF OPTIMAL IRRIGATION SCHEDULES, WATER, AND FERTILIZER REQUIREMENTS TO FUEL MARKET GROWTH
    SOIL MOISTURE SENSORS
    - Growing need for enhancing land and crop productivity by preventing overwatering to boost market
    TEMPERATURE SENSORS
    - Increasing importance of temperature monitoring for crop protection and irrigation timing to drive demand for temperature sensors
    RAIN/FREEZE SENSORS
    - Surging need for avoidance of unnecessary irrigation during rainfall to drive market
    FERTIGATION SENSORS
    - Surging demand for balancing water and nutrient requirements to accelerate market growth
    OTHER SENSORS
  • 9.4 WATER FLOW METERS
    INCREASING WATER SCARCITY AND GROWING AWARENESS OF WATER CONSERVATION TO DRIVE DEMAND FOR WATER FLOW METERS
  • 9.5 OTHER COMPONENTS
PRECISION IRRIGATION MARKET, BY END USE
154
  • 10.1 INTRODUCTION
  • 10.2 AGRICULTURE
    WATER CONSERVATION AND PRECISE APPLICATION OF FERTILIZERS TO FUEL MARKET GROWTH
    OPEN-FIELD AGRICULTURE
    - Rising need to address global food security and water scarcity to drive adoption of precision irrigation in open-field agriculture
    - Cereals & grains
    - Oilseeds & pulses
    - Vegetables
    - Fruits & nuts
    - Plantation crops
    CONTROLLED ENVIRONMENT AGRICULTURE
    - Rising demand for efficient farming solutions in limited urban spaces to drive adoption of precision irrigation in controlled environment agriculture
  • 10.3 NONAGRICULTURE
    ABILITY TO MEASURE SOIL MOISTURE AND MAINTAIN RIGHT AMOUNT OF WATER TO DRIVE SHIFT TOWARD AUTOMATED IRRIGATION METHODS
    RESIDENTIAL
    - Rising water conservation awareness to drive demand for precision irrigation in residential applications
    TURFS & LANDSCAPES
    - Increasing focus on environmental sustainability to boost market
    GOLF COURSES
    - Surging need for maintenance of optimal playing conditions and lush landscapes while adhering to water conservation standards to bolster market growth
PRECISION IRRIGATION MARKET, BY REGION
189
  • 11.1 INTRODUCTION
  • 11.2 NORTH AMERICA
    US
    - Surging demand for reducing water footprint to drive market
    CANADA
    - Increasing instances of water scarcity and surging demand for more efficient ways of irrigation to propel market growth
    MEXICO
    - Government initiatives to propel adoption of precision irrigation systems
  • 11.3 EUROPE
    SPAIN
    - Frequent droughts and seasonal variations in rainfall to propel adoption of precision irrigation systems
    ITALY
    - Effectiveness of integrating AI and automated systems to foster market growth
    FRANCE
    - Government initiatives to encourage adoption of innovative irrigation technologies
    GERMANY
    - Decreasing annual precipitation rates and decreasing groundwater levels to drive market
    UK
    - Rising demand for quality, consistency, and continuity of vegetable supply to propel market growth
    NETHERLANDS
    - Increasing demand for sustainable agricultural practices coupled with prolonged drought to propel market growth
    REST OF EUROPE
  • 11.4 ASIA PACIFIC
    CHINA
    - Promotion of water-saving irrigation technologies to boost market
    INDIA
    - Favorable government policies to support adoption of precision irrigation systems
    JAPAN
    - Technological advancements, such as robotic farm systems, to stimulate demand for precision irrigation technologies
    AUSTRALIA
    - Projects aimed at improving water use and management efficiency to boost market growth
    REST OF ASIA PACIFIC
  • 11.5 SOUTH AMERICA
    BRAZIL
    - Higher yields, reduced water usage, improved fruit quality, and decreased incidence of foliage diseases to propel market growth
    ARGENTINA
    - Rising demand for precision watering irrigation systems to propel market growth
    REST OF SOUTH AMERICA
  • 11.6 ROW
    AFRICA
    - Government initiatives facilitating efficient water usage and bolstering agricultural productivity to drive market
    MIDDLE EAST
    - Arid climate conditions and depleting groundwater reserves to propel market growth
    - Israel
    - Rest of Middle East
COMPETITIVE LANDSCAPE
298
  • 12.1 OVERVIEW
  • 12.2 KEY PLAYER STRATEGIES/RIGHT TO WIN
  • 12.3 REVENUE ANALYSIS
  • 12.4 MARKET SHARE ANALYSIS, 2023
    MARKET RANKING ANALYSIS
  • 12.5 COMPANY EVALUATION MATRIX: KEY PLAYERS, 2023
    STARS
    EMERGING LEADERS
    PERVASIVE PLAYERS
    PARTICIPANTS
    COMPANY FOOTPRINT: KEY PLAYERS, 2023
    - Company footprint
    - Regional footprint
    - Type footprint
    - End-use footprint
  • 12.6 COMPANY EVALUATION MATRIX: STARTUPS/SMES, 2023
    PROGRESSIVE COMPANIES
    RESPONSIVE COMPANIES
    DYNAMIC COMPANIES
    STARTING BLOCKS
    COMPETITIVE BENCHMARKING: STARTUPS/SMES, 2023
    - Detailed list of key startups/SMEs
    - Competitive benchmarking of key startups/SMEs
  • 12.7 COMPANY VALUATION AND FINANCIAL METRICS
  • 12.8 BRAND/PRODUCT COMPARISON
  • 12.9 COMPETITIVE SCENARIO AND TRENDS
    PRODUCT LAUNCHES
    DEALS
    EXPANSIONS
    OTHER DEALS/DEVELOPMENTS
COMPANY PROFILES
330
  • 13.1 KEY PLAYERS
    VALMONT INDUSTRIES INC.
    - Business overview
    - Products/Solutions/Services offered
    - Recent developments
    - MnM view
    NETAFIM
    - Business overview
    - Products/Solutions/Services offered
    - Recent developments
    - MnM view
    HUNTER INDUSTRIES INC.
    - Business overview
    - Products/Solutions/Services offered
    - Recent developments
    - MnM view
    THE TORO COMPANY
    - Business overview
    - Products/Solutions/Services offered
    - Recent developments
    - MnM view
    RAIN BIRD CORPORATION
    - Business overview
    - Products/Solutions/Services offered
    - Recent developments
    - MnM view
    LINDSAY CORPORATION
    - Business overview
    - Products/Solutions/Services offered
    - Recent developments
    - MnM view
    RIVULIS – IN ALLIANCE WITH JAIN INTERNATIONAL
    - Business overview
    - Products/Solutions/Services offered
    - Recent developments
    - MnM view
    HYDROPOINT
    - Business overview
    - Products/Solutions/Services offered
    - Recent developments
    - MnM view
    REINKE MANUFACTURING CO., INC.
    - Business overview
    - Products/Solutions/Services offered
    - Recent developments
    - MnM view
    AZUD
    - Business overview
    - Products/Solutions/Services offered
    - MnM view
    T-L IRRIGATION
    - Business overview
    - Products/Solutions/Services offered
    - Recent developments
    - MnM view
    MAHINDRA IRRIGATION
    - Business overview
    - Products/Solutions/Services offered
    - Recent developments
    - MnM view
    METZER
    - Business overview
    - Products/Solutions/Services offered
    - MnM view
    DRAGON-LINE
    - Business overview
    - Products/Solutions/Services offered
    - Recent developments
    - MnM view
    HORTAU INC.
    - Business overview
    - Products/Solutions/Services offered
    - MnM view
    CROPX INC.
    - Business overview
    - Products/Solutions/Services offered
    - Recent developments
    - MnM view
    WEATHERMATIC
    - Business overview
    - Products/Solutions/Services offered
    - MnM view
  • 13.2 OTHER PLAYERS
    CHINADRIP IRRIGATION EQUIPMENT (XIAMEN) CO., LTD
    ELGO IRRIGATION LTD
    AQUASPY INC.
    GRODAN (ROCKWOOL A/S.)
    LIBELIUM COMUNICACIONES DISTRIBUIDAS S.L.
    DIG CORPORATION
    TRIMBLE, INC.
    BERMAD CS LTD.
ADJACENT AND RELATED MARKETS
399
  • 14.1 INTRODUCTION
  • 14.2 LIMITATIONS
  • 14.3 DRIP IRRIGATION MARKET
    MARKET DEFINITION
    MARKET OVERVIEW
  • 14.4 IRRIGATION AUTOMATION MARKET
    MARKET DEFINITION
    MARKET OVERVIEW
APPENDIX
403
  • 15.1 DISCUSSION GUIDE
  • 15.2 KNOWLEDGESTORE: MARKETSANDMARKETS’ SUBSCRIPTION PORTAL
  • 15.3 CUSTOMIZATION OPTIONS
  • 15.4 RELATED REPORTS
  • 15.5 AUTHOR DETAILS
LIST OF TABLES
 
  • TABLE 1 PRECISION IRRIGATION MARKET: INCLUSIONS & EXCLUSIONS
  • TABLE 2 USD EXCHANGE RATES CONSIDERED, 2019–2023
  • TABLE 3 PRECISION IRRIGATION MARKET SNAPSHOT, 2024 VS. 2029
  • TABLE 4 POPULATION DENSITY, BY COUNTRY, 2019–2027 (PEOPLE PER SQUARE KILOMETER)
  • TABLE 5 EXPORT VALUE OF HS CODE 842482, BY KEY COUNTRY, 2019–2023 (USD THOUSAND)
  • TABLE 6 IMPORT VALUE OF HS CODE 842482, BY KEY COUNTRY, 2019–2023 (USD THOUSAND)
  • TABLE 7 INDICATIVE PRICING TRENDS OF KEY COMPONENTS OFFERED BY MAJOR PLAYERS, 2023 (USD)
  • TABLE 8 AVERAGE SELLING PRICE (ASP) OF PRECISION IRRIGATION SYSTEMS, BY TYPE, 2019–2023 (USD/HECTARE)
  • TABLE 9 AVERAGE SELLING PRICE, BY REGION, 2023 (USD/HECTARE)
  • TABLE 10 PRECISION IRRIGATION MARKET: ECOSYSTEM
  • TABLE 11 KEY PATENTS PERTAINING TO PRECISION IRRIGATION, 2014–2024
  • TABLE 12 PRECISION IRRIGATION MARKET: DETAILED LIST OF CONFERENCES AND EVENTS, 2024–2025
  • TABLE 13 NORTH AMERICA: REGULATORY BODIES, GOVERNMENT AGENCIES, AND OTHER ORGANIZATIONS
  • TABLE 14 EUROPE: REGULATORY BODIES, GOVERNMENT AGENCIES, AND OTHER ORGANIZATIONS
  • TABLE 15 ASIA PACIFIC: REGULATORY BODIES, GOVERNMENT AGENCIES, AND OTHER ORGANIZATIONS
  • TABLE 16 SOUTH AMERICA: REGULATORY BODIES, GOVERNMENT AGENCIES, AND OTHER ORGANIZATIONS
  • TABLE 17 ROW: REGULATORY BODIES, GOVERNMENT AGENCIES, AND OTHER ORGANIZATIONS
  • TABLE 18 STANDARDS CODES & PRACTICES FOR RURAL IRRIGATION SYSTEM DESIGN BY QUEENSLAND STATE GOVERNMENT
  • TABLE 19 IMPACT OF PORTER’S FIVE FORCES ON THE PRECISION IRRIGATION MARKET
  • TABLE 20 INFLUENCE OF STAKEHOLDERS ON BUYING PROCESS FOR END USE (%)
  • TABLE 21 KEY BUYING CRITERIA FOR END USE
  • TABLE 22 PRECISION IRRIGATION MARKET, BY TYPE, 2019–2023 (USD MILLION)
  • TABLE 23 MARKET, BY TYPE, 2024–2029 (USD MILLION)
  • TABLE 24 SPRINKLER IRRIGATION: PRECISION IRRIGATION MARKET, BY TYPE, 2019–2023 (USD MILLION)
  • TABLE 25 SPRINKLER IRRIGATION: MARKET, BY TYPE, 2024–2029 (USD MILLION)
  • TABLE 26 SPRINKLER IRRIGATION: PRECISION IRRIGATION MARKET, BY REGION, 2019–2023 (USD MILLION)
  • TABLE 27 SPRINKLER IRRIGATION: MARKET, BY REGION, 2024–2029 (USD MILLION)
  • TABLE 28 TRADITIONAL SPRINKLERS: PRECISION IRRIGATION MARKET, BY REGION, 2019–2023 (USD MILLION)
  • TABLE 29 TRADITIONAL SPRINKLERS: MARKET, BY REGION, 2024–2029 (USD MILLION)
  • TABLE 30 CENTER PIVOT SPRINKLERS: PRECISION IRRIGATION MARKET, BY REGION, 2019–2023 (USD MILLION)
  • TABLE 31 CENTER PIVOT SPRINKLERS: MARKET, BY REGION, 2024–2029 (USD MILLION)
  • TABLE 32 LATERAL/LINEAR MOVE SPRINKLERS: PRECISION IRRIGATION MARKET, BY REGION, 2019–2023 (USD MILLION)
  • TABLE 33 LATERAL/LINEAR MOVE SPRINKLERS: MARKET, BY REGION, 2024–2029 (USD MILLION)
  • TABLE 34 DRIP IRRIGATION: PRECISION IRRIGATION MARKET, BY TYPE, 2019–2023 (USD MILLION)
  • TABLE 35 DRIP IRRIGATION: MARKET, BY TYPE, 2024–2029 (USD MILLION)
  • TABLE 36 DRIP IRRIGATION: PRECISION IRRIGATION MARKET, BY REGION, 2019–2023 (USD MILLION)
  • TABLE 37 DRIP IRRIGATION: MARKET, BY REGION, 2024–2029 (USD MILLION)
  • TABLE 38 SURFACE DRIP IRRIGATION: PRECISION IRRIGATION MARKET, BY REGION, 2019–2023 (USD MILLION)
  • TABLE 39 SURFACE DRIP IRRIGATION: MARKET, BY REGION, 2024–2029 (USD MILLION)
  • TABLE 40 SUBSURFACE DRIP IRRIGATION: PRECISION IRRIGATION MARKET, BY REGION, 2019–2023 (USD MILLION)
  • TABLE 41 SUBSURFACE DRIP IRRIGATION: MARKET, BY REGION, 2024–2029 (USD MILLION)
  • TABLE 42 OTHER TYPES: PRECISION IRRIGATION MARKET, BY REGION, 2019–2023 (USD MILLION)
  • TABLE 43 OTHER TYPES: MARKET, BY REGION, 2024–2029 (USD MILLION)
  • TABLE 44 PRECISION IRRIGATION MARKET, BY TECHNOLOGY TYPE, 2019–2023 (USD MILLION)
  • TABLE 45 MARKET, BY TECHNOLOGY TYPE, 2024–2029 (USD MILLION)
  • TABLE 46 IOT-BASED PRECISION IRRIGATION: PRECISION IRRIGATION MARKET, BY REGION, 2019–2023 (USD MILLION)
  • TABLE 47 IOT-BASED PRECISION IRRIGATION: MARKET, BY REGION, 2024–2029 (USD MILLION)
  • TABLE 48 AI & ML ALGORITHMS IN IRRIGATION: PRECISION IRRIGATION MARKET, BY REGION, 2019–2023 (USD MILLION)
  • TABLE 49 AI & ML ALGORITHMS IN IRRIGATION: MARKET, BY REGION, 2024–2029 (USD MILLION)
  • TABLE 50 GPS- AND GIS-BASED IRRIGATION: PRECISION IRRIGATION MARKET, BY REGION, 2019–2023 (USD MILLION)
  • TABLE 51 GPS- AND GIS-BASED IRRIGATION: MARKET, BY REGION, 2024–2029 (USD MILLION)
  • TABLE 52 CLOUD COMPUTING & DATA ANALYTICS: PRECISION IRRIGATION MARKET, BY REGION, 2019–2023 (USD MILLION)
  • TABLE 53 CLOUD COMPUTING & DATA ANALYTICS: MARKET, BY REGION, 2024–2029 (USD MILLION)
  • TABLE 54 PRECISION IRRIGATION MARKET, BY COMPONENT, 2019–2023 (USD MILLION)
  • TABLE 55 MARKET, BY COMPONENT, 2024–2029 (USD MILLION)
  • TABLE 56 CONTROLLERS: PRECISION IRRIGATION MARKET, BY REGION, 2019–2023 (USD MILLION)
  • TABLE 57 CONTROLLERS: MARKET, BY REGION, 2024–2029 (USD MILLION)
  • TABLE 58 SENSORS: PRECISION IRRIGATION MARKET, BY REGION, 2019–2023 (USD MILLION)
  • TABLE 59 SENSORS: MARKET, BY REGION, 2024–2029 (USD MILLION)
  • TABLE 60 PRECISION IRRIGATION MARKET, BY SENSOR, 2019–2023 (USD MILLION)
  • TABLE 61 MARKET, BY SENSOR, 2024–2029 (USD MILLION)
  • TABLE 62 SOIL MOISTURE SENSORS: PRECISION IRRIGATION MARKET, BY REGION, 2019–2023 (USD MILLION)
  • TABLE 63 SOIL MOISTURE SENSORS: MARKET, BY REGION, 2024–2029 (USD MILLION)
  • TABLE 64 TEMPERATURE SENSORS: PRECISION IRRIGATION MARKET, BY REGION, 2019–2023 (USD MILLION)
  • TABLE 65 TEMPERATURE SENSORS: MARKET, BY REGION, 2024–2029 (USD MILLION)
  • TABLE 66 RAIN/FREEZE SENSORS: PRECISION IRRIGATION MARKET, BY REGION, 2019–2023 (USD MILLION)
  • TABLE 67 RAIN/FREEZE SENSORS: MARKET, BY REGION, 2024–2029 (USD MILLION)
  • TABLE 68 FERTIGATION SENSORS: PRECISION IRRIGATION MARKET, BY REGION, 2019–2023 (USD MILLION)
  • TABLE 69 FERTIGATION SENSORS: MARKET, BY REGION, 2024–2029 (USD MILLION)
  • TABLE 70 OTHER SENSORS: PRECISION IRRIGATION MARKET, BY REGION, 2019–2023 (USD MILLION)
  • TABLE 71 OTHER SENSORS: MARKET, BY REGION, 2024–2029 (USD MILLION)
  • TABLE 72 WATER FLOW METERS: PRECISION IRRIGATION MARKET, BY REGION, 2019–2023 (USD MILLION)
  • TABLE 73 WATER FLOW METERS: MARKET, BY REGION, 2024–2029 (USD MILLION)
  • TABLE 74 OTHER COMPONENTS: PRECISION IRRIGATION MARKET, BY REGION, 2019–2023 (USD MILLION)
  • TABLE 75 OTHER COMPONENTS: MARKET, BY REGION, 2024–2029 (USD MILLION)
  • TABLE 76 PRECISION IRRIGATION MARKET, BY END USE, 2019–2023 (USD MILLION)
  • TABLE 77 MARKET, BY END USE, 2024–2029 (USD MILLION)
  • TABLE 78 AGRICULTURE: PRECISION IRRIGATION MARKET, BY REGION, 2019–2023 (USD MILLION)
  • TABLE 79 AGRICULTURE: MARKET, BY REGION, 2024–2029 (USD MILLION)
  • TABLE 80 PRECISION IRRIGATION MARKET, BY AGRICULTURE TYPE, 2019–2023 (USD MILLION)
  • TABLE 81 MARKET, BY AGRICULTURE TYPE, 2024–2029 (USD MILLION)
  • TABLE 82 OPEN-FIELD AGRICULTURE: PRECISION IRRIGATION MARKET, BY REGION, 2019–2023 (USD MILLION)
  • TABLE 83 OPEN-FIELD AGRICULTURE: MARKET, BY REGION, 2024–2029 (USD MILLION)
  • TABLE 84 PRECISION IRRIGATION MARKET, BY OPEN-FIELD AGRICULTURE TYPE, 2019–2023 (USD MILLION)
  • TABLE 85 MARKET, BY OPEN-FIELD AGRICULTURE TYPE, 2024–2029 (USD MILLION)
  • TABLE 86 CEREALS & GRAINS: PRECISION IRRIGATION MARKET, BY REGION, 2019–2023 (USD MILLION)
  • TABLE 87 CEREALS & GRAINS: MARKET, BY REGION, 2024–2029 (USD MILLION)
  • TABLE 88 PRECISION IRRIGATION MARKET, BY CEREALS & GRAINS TYPE, 2019–2023 (USD MILLION)
  • TABLE 89 MARKET, BY CEREALS & GRAINS TYPE, 2024–2029 (USD MILLION)
  • TABLE 90 RICE: PRECISION IRRIGATION MARKET, BY REGION, 2019–2023 (USD MILLION)
  • TABLE 91 RICE: MARKET, BY REGION, 2024–2029 (USD MILLION)
  • TABLE 92 MAIZE: PRECISION IRRIGATION MARKET, BY REGION, 2019–2023 (USD MILLION)
  • TABLE 93 MAIZE: MARKET, BY REGION, 2024–2029 (USD MILLION)
  • TABLE 94 WHEAT: PRECISION IRRIGATION MARKET, BY REGION, 2019–2023 (USD MILLION)
  • TABLE 95 WHEAT: MARKET, BY REGION, 2024–2029 (USD MILLION)
  • TABLE 96 OTHER CEREALS & GRAINS: PRECISION IRRIGATION MARKET, BY REGION, 2019–2023 (USD MILLION)
  • TABLE 97 OTHER CEREALS & GRAINS: MARKET, BY REGION, 2024–2029 (USD MILLION)
  • TABLE 98 OILSEEDS & PULSES: PRECISION IRRIGATION MARKET, BY REGION, 2019–2023 (USD MILLION)
  • TABLE 99 OILSEEDS & PULSES: MARKET, BY REGION, 2024–2029 (USD MILLION)
  • TABLE 100 PRECISION IRRIGATION MARKET, BY OILSEEDS & PULSES TYPE, 2019–2023 (USD MILLION)
  • TABLE 101 MARKET, BY OILSEEDS & PULSES TYPE, 2024–2029 (USD MILLION)
  • TABLE 102 SOYBEAN: PRECISION IRRIGATION MARKET, BY REGION, 2019–2023 (USD MILLION)
  • TABLE 103 SOYBEAN: MARKET, BY REGION, 2024–2029 (USD MILLION)
  • TABLE 104 RAPESEED: PRECISION IRRIGATION MARKET, BY REGION, 2019–2023 (USD MILLION)
  • TABLE 105 RAPESEED: MARKET, BY REGION, 2024–2029 (USD MILLION)
  • TABLE 106 COTTON: PRECISION IRRIGATION MARKET, BY REGION, 2019–2023 (USD MILLION)
  • TABLE 107 COTTON: MARKET, BY REGION, 2024–2029 (USD MILLION)
  • TABLE 108 GROUNDNUT: PRECISION IRRIGATION MARKET, BY REGION, 2019–2023 (USD MILLION)
  • TABLE 109 GROUNDNUT: MARKET, BY REGION, 2024–2029 (USD MILLION)
  • TABLE 110 OTHER OILSEEDS & PULSES: PRECISION IRRIGATION MARKET, BY REGION, 2019–2023 (USD MILLION)
  • TABLE 111 OTHER OILSEEDS & PULSES: MARKET, BY REGION, 2024–2029 (USD MILLION)
  • TABLE 112 VEGETABLES: PRECISION IRRIGATION MARKET, BY REGION, 2019–2023 (USD MILLION)
  • TABLE 113 VEGETABLES: MARKET, BY REGION, 2024–2029 (USD MILLION)
  • TABLE 114 PRECISION IRRIGATION MARKET, BY VEGETABLE TYPE, 2019–2023 (USD MILLION)
  • TABLE 115 MARKET, BY VEGETABLE TYPE, 2024–2029 (USD MILLION)
  • TABLE 116 ROOTS & TUBERS: PRECISION IRRIGATION MARKET, BY REGION, 2019–2023 (USD MILLION)
  • TABLE 117 ROOTS & TUBERS: MARKET, BY REGION, 2024–2029 (USD MILLION)
  • TABLE 118 BRASSICAS: PRECISION IRRIGATION MARKET, BY REGION, 2019–2023 (USD MILLION)
  • TABLE 119 BRASSICAS: MARKET, BY REGION, 2024–2029 (USD MILLION)
  • TABLE 120 OTHER VEGETABLES: PRECISION IRRIGATION MARKET, BY REGION, 2019–2023 (USD MILLION)
  • TABLE 121 OTHER VEGETABLES: MARKET, BY REGION, 2024–2029 (USD MILLION)
  • TABLE 122 FRUITS & NUTS: PRECISION IRRIGATION MARKET, BY REGION, 2019–2023 (USD MILLION)
  • TABLE 123 FRUITS & NUTS: MARKET, BY REGION, 2024–2029 (USD MILLION)
  • TABLE 124 PRECISION IRRIGATION MARKET, BY FRUIT & NUT TYPE, 2019–2023 (USD MILLION)
  • TABLE 125 MARKET, BY FRUIT & NUT TYPE, 2024–2029 (USD MILLION)
  • TABLE 126 CITRUS FRUITS: PRECISION IRRIGATION MARKET, BY REGION, 2019–2023 (USD MILLION)
  • TABLE 127 CITRUS FRUITS: MARKET, BY REGION, 2024–2029 (USD MILLION)
  • TABLE 128 BERRIES: PRECISION IRRIGATION MARKET, BY REGION, 2019–2023 (USD MILLION)
  • TABLE 129 BERRIES: MARKET, BY REGION, 2024–2029 (USD MILLION)
  • TABLE 130 OTHER FRUITS & NUTS: PRECISION IRRIGATION MARKET, BY REGION, 2019–2023 (USD MILLION)
  • TABLE 131 OTHER FRUITS & NUTS: MARKET, BY REGION, 2024–2029 (USD MILLION)
  • TABLE 132 PLANTATION CROPS: PRECISION IRRIGATION MARKET, BY REGION, 2019–2023 (USD MILLION)
  • TABLE 133 PLANTATION CROPS: MARKET, BY REGION, 2024–2029 (USD MILLION)
  • TABLE 134 CONTROLLED ENVIRONMENT AGRICULTURE: PRECISION IRRIGATION MARKET, BY REGION, 2019–2023 (USD MILLION)
  • TABLE 135 CONTROLLED ENVIRONMENT AGRICULTURE: MARKET, BY REGION, 2024–2029 (USD MILLION)
  • TABLE 136 NONAGRICULTURE: PRECISION IRRIGATION MARKET, BY REGION, 2019–2023 (USD MILLION)
  • TABLE 137 NONAGRICULTURE: MARKET, BY REGION, 2024–2029 (USD MILLION)
  • TABLE 138 PRECISION IRRIGATION MARKET, BY NONAGRICULTURE TYPE, 2019–2023 (USD MILLION)
  • TABLE 139 MARKET, BY NONAGRICULTURE TYPE, 2024–2029 (USD MILLION)
  • TABLE 140 RESIDENTIAL: PRECISION IRRIGATION MARKET, BY REGION, 2019–2023 (USD MILLION)
  • TABLE 141 RESIDENTIAL: MARKET, BY REGION, 2024–2029 (USD MILLION)
  • TABLE 142 TURFS & LANDSCAPES: PRECISION IRRIGATION MARKET, BY REGION, 2019–2023 (USD MILLION)
  • TABLE 143 TURFS & LANDSCAPES: MARKET, BY REGION, 2024–2029 (USD MILLION)
  • TABLE 144 GOLF COURSES: PRECISION IRRIGATION MARKET, BY REGION, 2019–2023 (USD MILLION)
  • TABLE 145 GOLF COURSES: MARKET, BY REGION, 2024–2029 (USD MILLION)
  • TABLE 146 PRECISION IRRIGATION MARKET, BY REGION, 2019–2023 (USD MILLION)
  • TABLE 147 MARKET, BY REGION, 2024–2029 (USD MILLION)
  • TABLE 148 NORTH AMERICA: PRECISION IRRIGATION MARKET, BY COUNTRY, 2019–2023 (USD MILLION)
  • TABLE 149 NORTH AMERICA: MARKET, BY COUNTRY, 2024–2029 (USD MILLION)
  • TABLE 150 NORTH AMERICA: MARKET, BY TYPE, 2019–2023 (USD MILLION)
  • TABLE 151 NORTH AMERICA: MARKET, BY TYPE, 2024–2029 (USD MILLION)
  • TABLE 152 NORTH AMERICA: PRECISION IRRIGATION MARKET, BY SPRINKLER IRRIGATION, 2019–2023 (USD MILLION)
  • TABLE 153 NORTH AMERICA: MARKET, BY SPRINKLER IRRIGATION, 2024–2029 (USD MILLION)
  • TABLE 154 NORTH AMERICA: MARKET, BY DRIP IRRIGATION, 2019–2023 (USD MILLION)
  • TABLE 155 NORTH AMERICA: MARKET, BY DRIP IRRIGATION, 2024–2029 (USD MILLION)
  • TABLE 156 NORTH AMERICA: MARKET, BY TECHNOLOGY TYPE, 2019–2023 (USD MILLION)
  • TABLE 157 NORTH AMERICA: MARKET, BY TECHNOLOGY TYPE, 2024–2029 (USD MILLION)
  • TABLE 158 NORTH AMERICA: MARKET, BY COMPONENT, 2019–2023 (USD MILLION)
  • TABLE 159 NORTH AMERICA: MARKET, BY COMPONENT, 2024–2029 (USD MILLION)
  • TABLE 160 NORTH AMERICA: MARKET, BY SENSOR, 2019–2023 (USD MILLION)
  • TABLE 161 NORTH AMERICA: MARKET, BY SENSOR, 2024–2029 (USD MILLION)
  • TABLE 162 NORTH AMERICA: PRECISION IRRIGATION MARKET, BY END USE, 2019–2023 (USD MILLION)
  • TABLE 163 NORTH AMERICA: MARKET, BY END USE, 2024–2029 (USD MILLION)
  • TABLE 164 NORTH AMERICA: MARKET, BY AGRICULTURE, 2019–2023 (USD MILLION)
  • TABLE 165 NORTH AMERICA: MARKET, BY AGRICULTURE, 2024–2029 (USD MILLION)
  • TABLE 166 NORTH AMERICA: MARKET, BY OPEN-FIELD AGRICULTURE, 2019–2023 (USD MILLION)
  • TABLE 167 NORTH AMERICA: MARKET, BY OPEN-FIELD AGRICULTURE, 2024–2029 (USD MILLION)
  • TABLE 168 NORTH AMERICA: MARKET, BY CEREAL & GRAIN, 2019–2023 (USD MILLION)
  • TABLE 169 NORTH AMERICA: MARKET, BY CEREAL & GRAIN, 2024–2029 (USD MILLION)
  • TABLE 170 NORTH AMERICA: MARKET, BY OILSEED & PULSE, 2019–2023 (USD MILLION)
  • TABLE 171 NORTH AMERICA: MARKET, BY OILSEED & PULSE, 2024–2029 (USD MILLION)
  • TABLE 172 NORTH AMERICA: PRECISION IRRIGATION MARKET, BY VEGETABLE, 2019–2023 (USD MILLION)
  • TABLE 173 NORTH AMERICA: MARKET, BY VEGETABLE, 2024–2029 (USD MILLION)
  • TABLE 174 NORTH AMERICA: MARKET, BY FRUIT & NUT, 2019–2023 (USD MILLION)
  • TABLE 175 NORTH AMERICA: MARKET, BY FRUIT & NUT, 2024–2029 (USD MILLION)
  • TABLE 176 NORTH AMERICA: MARKET, BY NONAGRICULTURE, 2019–2023 (USD MILLION)
  • TABLE 177 NORTH AMERICA: MARKET, BY NONAGRICULTURE, 2024–2029 (USD MILLION)
  • TABLE 178 US: PRECISION IRRIGATION MARKET, BY TYPE, 2019–2023 (USD MILLION)
  • TABLE 179 US: MARKET, BY TYPE, 2024–2029 (USD MILLION)
  • TABLE 180 US: MARKET, BY SPRINKLER IRRIGATION, 2019–2023 (USD MILLION)
  • TABLE 181 US: MARKET, BY SPRINKLER IRRIGATION, 2024–2029 (USD MILLION)
  • TABLE 182 US: MARKET, BY DRIP IRRIGATION, 2019–2023 (USD MILLION)
  • TABLE 183 US: MARKET, BY DRIP IRRIGATION, 2024–2029 (USD MILLION)
  • TABLE 184 US: MARKET, BY END USE, 2019–2023 (USD MILLION)
  • TABLE 185 US: MARKET, BY END USE, 2024–2029 (USD MILLION)
  • TABLE 186 CANADA: PRECISION IRRIGATION MARKET, BY TYPE, 2019–2023 (USD MILLION)
  • TABLE 187 CANADA: MARKET, BY TYPE, 2024–2029 (USD MILLION)
  • TABLE 188 CANADA: MARKET, BY SPRINKLER IRRIGATION, 2019–2023 (USD MILLION)
  • TABLE 189 CANADA: MARKET, BY SPRINKLER IRRIGATION, 2024–2029 (USD MILLION)
  • TABLE 190 CANADA: MARKET, BY DRIP IRRIGATION, 2019–2023 (USD MILLION)
  • TABLE 191 CANADA: MARKET, BY DRIP IRRIGATION, 2024–2029 (USD MILLION)
  • TABLE 192 CANADA: MARKET, BY END USE, 2019–2023 (USD MILLION)
  • TABLE 193 CANADA: MARKET, BY END USE, 2024–2029 (USD MILLION)
  • TABLE 194 MEXICO: PRECISION IRRIGATION MARKET, BY TYPE, 2019–2023 (USD MILLION)
  • TABLE 195 MEXICO: MARKET, BY TYPE, 2024–2029 (USD MILLION)
  • TABLE 196 MEXICO: MARKET, BY SPRINKLER IRRIGATION, 2019–2023 (USD MILLION)
  • TABLE 197 MEXICO: MARKET, BY SPRINKLER IRRIGATION, 2024–2029 (USD MILLION)
  • TABLE 198 MEXICO: MARKET, BY DRIP IRRIGATION, 2019–2023 (USD MILLION)
  • TABLE 199 MEXICO: MARKET, BY DRIP IRRIGATION, 2024–2029 (USD MILLION)
  • TABLE 200 MEXICO: MARKET, BY END USE, 2019–2023 (USD MILLION)
  • TABLE 201 MEXICO: MARKET, BY END USE, 2024–2029 (USD MILLION)
  • TABLE 202 EUROPE: MARKET, BY COUNTRY, 2019–2023 (USD MILLION)
  • TABLE 203 EUROPE: MARKET, BY COUNTRY, 2024–2029 (USD MILLION)
  • TABLE 204 EUROPE: MARKET, BY TYPE, 2019–2023 (USD MILLION)
  • TABLE 205 EUROPE: MARKET, BY TYPE, 2024–2029 (USD MILLION)
  • TABLE 206 EUROPE: MARKET, BY SPRINKLER IRRIGATION, 2019–2023 (USD MILLION)
  • TABLE 207 EUROPE: MARKET, BY SPRINKLER IRRIGATION, 2024–2029 (USD MILLION)
  • TABLE 208 EUROPE: PRECISION IRRIGATION MARKET, BY DRIP IRRIGATION, 2019–2023 (USD MILLION)
  • TABLE 209 EUROPE: MARKET, BY DRIP IRRIGATION, 2024–2029 (USD MILLION)
  • TABLE 210 EUROPE: MARKET, BY TECHNOLOGY TYPE, 2019–2023 (USD MILLION)
  • TABLE 211 EUROPE: MARKET, BY TECHNOLOGY TYPE, 2024–2029 (USD MILLION)
  • TABLE 212 EUROPE: MARKET, BY COMPONENT, 2019–2023 (USD MILLION)
  • TABLE 213 EUROPE: MARKET, BY COMPONENT, 2024–2029 (USD MILLION)
  • TABLE 214 EUROPE: MARKET, BY SENSOR, 2019–2023 (USD MILLION)
  • TABLE 215 EUROPE: MARKET, BY SENSOR, 2024–2029 (USD MILLION)
  • TABLE 216 EUROPE: MARKET, BY END USE, 2019–2023 (USD MILLION)
  • TABLE 217 EUROPE: MARKET, BY END USE, 2024–2029 (USD MILLION)
  • TABLE 218 EUROPE: MARKET, BY AGRICULTURE, 2019–2023 (USD MILLION)
  • TABLE 219 EUROPE: MARKET, BY AGRICULTURE, 2024–2029 (USD MILLION)
  • TABLE 220 EUROPE: MARKET, BY OPEN-FIELD AGRICULTURE, 2019–2023 (USD MILLION)
  • TABLE 221 EUROPE: MARKET, BY OPEN-FIELD AGRICULTURE, 2024–2029 (USD MILLION)
  • TABLE 222 EUROPE: MARKET, BY CEREAL & GRAIN, 2019–2023 (USD MILLION)
  • TABLE 223 EUROPE: MARKET, BY CEREAL & GRAIN, 2024–2029 (USD MILLION)
  • TABLE 224 EUROPE: MARKET, BY OILSEED & PULSE, 2019–2023 (USD MILLION)
  • TABLE 225 EUROPE: MARKET, BY OILSEED & PULSE, 2024–2029 (USD MILLION)
  • TABLE 226 EUROPE: MARKET, BY VEGETABLE, 2019–2023 (USD MILLION)
  • TABLE 227 EUROPE: MARKET, BY VEGETABLE, 2024–2029 (USD MILLION)
  • TABLE 228 EUROPE: MARKET, BY FRUIT & NUT, 2019–2023 (USD MILLION)
  • TABLE 229 EUROPE: MARKET, BY FRUIT & NUT, 2024–2029 (USD MILLION)
  • TABLE 230 EUROPE: MARKET, BY NONAGRICULTURE, 2019–2023 (USD MILLION)
  • TABLE 231 EUROPE: MARKET, BY NONAGRICULTURE, 2024–2029 (USD MILLION)
  • TABLE 232 SPAIN: PRECISION IRRIGATION MARKET, BY TYPE, 2019–2023 (USD MILLION)
  • TABLE 233 SPAIN: MARKET, BY TYPE, 2024–2029 (USD MILLION)
  • TABLE 234 SPAIN: MARKET, BY SPRINKLER IRRIGATION, 2019–2023 (USD MILLION)
  • TABLE 235 SPAIN: MARKET, BY SPRINKLER IRRIGATION, 2024–2029 (USD MILLION)
  • TABLE 236 SPAIN: MARKET, BY DRIP IRRIGATION, 2019–2023 (USD MILLION)
  • TABLE 237 SPAIN: MARKET, BY DRIP IRRIGATION, 2024–2029 (USD MILLION)
  • TABLE 238 SPAIN: MARKET, BY END USE, 2019–2023 (USD MILLION)
  • TABLE 239 SPAIN: MARKET, BY END USE, 2024–2029 (USD MILLION)
  • TABLE 240 ITALY: PRECISION IRRIGATION MARKET, BY TYPE, 2019–2023 (USD MILLION)
  • TABLE 241 ITALY: MARKET, BY TYPE, 2024–2029 (USD MILLION)
  • TABLE 242 ITALY: MARKET, BY SPRINKLER IRRIGATION, 2019–2023 (USD MILLION)
  • TABLE 243 ITALY: MARKET, BY SPRINKLER IRRIGATION, 2024–2029 (USD MILLION)
  • TABLE 244 ITALY: MARKET, BY DRIP IRRIGATION, 2019–2023 (USD MILLION)
  • TABLE 245 ITALY: MARKET, BY DRIP IRRIGATION, 2024–2029 (USD MILLION)
  • TABLE 246 ITALY: MARKET, BY END USE, 2019–2023 (USD MILLION)
  • TABLE 247 ITALY: MARKET, BY END USE, 2024–2029 (USD MILLION)
  • TABLE 248 FRANCE: PRECISION IRRIGATION MARKET, BY TYPE, 2019–2023 (USD MILLION)
  • TABLE 249 FRANCE:MARKET, BY TYPE, 2024–2029 (USD MILLION)
  • TABLE 250 FRANCE: MARKET, BY SPRINKLER IRRIGATION, 2019–2023 (USD MILLION)
  • TABLE 251 FRANCE: MARKET, BY SPRINKLER IRRIGATION, 2024–2029 (USD MILLION)
  • TABLE 252 FRANCE: MARKET, BY DRIP IRRIGATION, 2019–2023 (USD MILLION)
  • TABLE 253 FRANCE: MARKET, BY DRIP IRRIGATION, 2024–2029 (USD MILLION)
  • TABLE 254 FRANCE: MARKET, BY END USE, 2019–2023 (USD MILLION)
  • TABLE 255 FRANCE: MARKET, BY END USE, 2024–2029 (USD MILLION)
  • TABLE 256 GERMANY: PRECISION IRRIGATION MARKET, BY TYPE, 2019–2023 (USD MILLION)
  • TABLE 257 GERMANY: MARKET, BY TYPE, 2024–2029 (USD MILLION)
  • TABLE 258 GERMANY: MARKET, BY SPRINKLER IRRIGATION, 2019–2023 (USD MILLION)
  • TABLE 259 GERMANY: MARKET, BY SPRINKLER IRRIGATION, 2024–2029 (USD MILLION)
  • TABLE 260 GERMANY: MARKET, BY DRIP IRRIGATION, 2019–2023 (USD MILLION)
  • TABLE 261 GERMANY: MARKET, BY DRIP IRRIGATION, 2024–2029 (USD MILLION)
  • TABLE 262 GERMANY: MARKET, BY END USE, 2019–2023 (USD MILLION)
  • TABLE 263 GERMANY: MARKET, BY END USE, 2024–2029 (USD MILLION)
  • TABLE 264 UK: PRECISION IRRIGATION MARKET, BY TYPE, 2019–2023 (USD MILLION)
  • TABLE 265 UK: MARKET, BY TYPE, 2024–2029 (USD MILLION)
  • TABLE 266 UK: MARKET, BY SPRINKLER IRRIGATION, 2019–2023 (USD MILLION)
  • TABLE 267 UK: MARKET, BY SPRINKLER IRRIGATION, 2024–2029 (USD MILLION)
  • TABLE 268 UK: MARKET, BY DRIP IRRIGATION, 2019–2023 (USD MILLION)
  • TABLE 269 UK: MARKET, BY DRIP IRRIGATION, 2024–2029 (USD MILLION)
  • TABLE 270 UK: MARKET, BY END USE, 2019–2023 (USD MILLION)
  • TABLE 271 UK: MARKET, BY END USE, 2024–2029 (USD MILLION)
  • TABLE 272 NETHERLANDS: PRECISION IRRIGATION MARKET, BY TYPE, 2019–2023 (USD MILLION)
  • TABLE 273 NETHERLANDS: MARKET, BY TYPE, 2024–2029 (USD MILLION)
  • TABLE 274 NETHERLANDS: MARKET, BY SPRINKLER IRRIGATION, 2019–2023 (USD MILLION)
  • TABLE 275 NETHERLANDS: MARKET, BY SPRINKLER IRRIGATION, 2024–2029 (USD MILLION)
  • TABLE 276 NETHERLANDS: MARKET, BY DRIP IRRIGATION, 2019–2023 (USD MILLION)
  • TABLE 277 NETHERLANDS: MARKET, BY DRIP IRRIGATION, 2024–2029 (USD MILLION)
  • TABLE 278 NETHERLANDS: MARKET, BY END USE, 2019–2023 (USD MILLION)
  • TABLE 279 NETHERLANDS: MARKET, BY END USE, 2024–2029 (USD MILLION)
  • TABLE 280 REST OF EUROPE: PRECISION IRRIGATION MARKET, BY TYPE, 2019–2023 (USD MILLION)
  • TABLE 281 REST OF EUROPE: MARKET, BY TYPE, 2024–2029 (USD MILLION)
  • TABLE 282 REST OF EUROPE: MARKET, BY SPRINKLER IRRIGATION, 2019–2023 (USD MILLION)
  • TABLE 283 REST OF EUROPE: MARKET, BY SPRINKLER IRRIGATION, 2024–2029 (USD MILLION)
  • TABLE 284 REST OF EUROPE: MARKET, BY DRIP IRRIGATION, 2019–2023 (USD MILLION)
  • TABLE 285 REST OF EUROPE: MARKET, BY DRIP IRRIGATION, 2024–2029 (USD MILLION)
  • TABLE 286 REST OF EUROPE: MARKET, BY END USE, 2019–2023 (USD MILLION)
  • TABLE 287 REST OF EUROPE: MARKET, BY END USE, 2024–2029 (USD MILLION)
  • TABLE 288 ASIA PACIFIC: PRECISION IRRIGATION MARKET, BY COUNTRY, 2019–2023 (USD MILLION)
  • TABLE 289 ASIA PACIFIC: MARKET, BY COUNTRY, 2024–2029 (USD MILLION)
  • TABLE 290 ASIA PACIFIC: MARKET, BY TYPE, 2019–2023 (USD MILLION)
  • TABLE 291 ASIA PACIFIC: MARKET, BY TYPE, 2024–2029 (USD MILLION)
  • TABLE 292 ASIA PACIFIC: MARKET, BY SPRINKLER IRRIGATION, 2019–2023 (USD MILLION)
  • TABLE 293 ASIA PACIFIC: MARKET, BY SPRINKLER IRRIGATION, 2024–2029 (USD MILLION)
  • TABLE 294 ASIA PACIFIC: MARKET, BY DRIP IRRIGATION, 2019–2023 (USD MILLION)
  • TABLE 295 ASIA PACIFIC: MARKET, BY DRIP IRRIGATION, 2024–2029 (USD MILLION)
  • TABLE 296 ASIA PACIFIC: MARKET, BY TECHNOLOGY TYPE, 2019–2023 (USD MILLION)
  • TABLE 297 ASIA PACIFIC: MARKET, BY TECHNOLOGY TYPE, 2024–2029 (USD MILLION)
  • TABLE 298 ASIA PACIFIC: MARKET, BY COMPONENT, 2019–2023 (USD MILLION)
  • TABLE 299 ASIA PACIFIC: MARKET, BY COMPONENT, 2024–2029 (USD MILLION)
  • TABLE 300 ASIA PACIFIC: MARKET, BY SENSOR, 2019–2023 (USD MILLION)
  • TABLE 301 ASIA PACIFIC: MARKET, BY SENSOR, 2024–2029 (USD MILLION)
  • TABLE 302 ASIA PACIFIC: MARKET, BY END USE, 2019–2023 (USD MILLION)
  • TABLE 303 ASIA PACIFIC: PRECISION IRRIGATION MARKET, BY END USE, 2024–2029 (USD MILLION)
  • TABLE 304 ASIA PACIFIC: MARKET, BY AGRICULTURE, 2019–2023 (USD MILLION)
  • TABLE 305 ASIA PACIFIC: MARKET, BY AGRICULTURE, 2024–2029 (USD MILLION)
  • TABLE 306 ASIA PACIFIC: MARKET, BY OPEN-FIELD AGRICULTURE, 2019–2023 (USD MILLION)
  • TABLE 307 ASIA PACIFIC: MARKET, BY OPEN-FIELD AGRICULTURE, 2024–2029 (USD MILLION)
  • TABLE 308 ASIA PACIFIC: MARKET, BY CEREAL & GRAIN, 2019–2023 (USD MILLION)
  • TABLE 309 ASIA PACIFIC: MARKET, BY CEREAL & GRAIN, 2024–2029 (USD MILLION)
  • TABLE 310 ASIA PACIFIC: MARKET, BY OILSEED & PULSE, 2019–2023 (USD MILLION)
  • TABLE 311 ASIA PACIFIC: MARKET, BY OILSEED & PULSE, 2024–2029 (USD MILLION)
  • TABLE 312 ASIA PACIFIC: MARKET, BY VEGETABLE, 2019–2023 (USD MILLION)
  • TABLE 313 ASIA PACIFIC: MARKET, BY VEGETABLE, 2024–2029 (USD MILLION)
  • TABLE 314 ASIA PACIFIC: MARKET, BY FRUIT & NUT, 2019–2023 (USD MILLION)
  • TABLE 315 ASIA PACIFIC: MARKET, BY FRUIT & NUT, 2024–2029 (USD MILLION)
  • TABLE 316 ASIA PACIFIC: MARKET, BY NONAGRICULTURE, 2019–2023 (USD MILLION)
  • TABLE 317 ASIA PACIFIC: MARKET, BY NONAGRICULTURE, 2024–2029 (USD MILLION)
  • TABLE 318 CHINA: PRECISION IRRIGATION MARKET, BY TYPE, 2019–2023 (USD MILLION)
  • TABLE 319 CHINA: MARKET, BY TYPE, 2024–2029 (USD MILLION)
  • TABLE 320 CHINA: MARKET, BY SPRINKLER IRRIGATION, 2 019–2023 (USD MILLION)
  • TABLE 321 CHINA: MARKET, BY SPRINKLER IRRIGATION, 2024–2029 (USD MILLION)
  • TABLE 322 CHINA: MARKET, BY DRIP IRRIGATION, 2019–2023 (USD MILLION)
  • TABLE 323 CHINA: MARKET, BY DRIP IRRIGATION, 2024–2029 (USD MILLION)
  • TABLE 324 CHINA: MARKET, BY END USE, 2019–2023 (USD MILLION)
  • TABLE 325 CHINA: MARKET, BY END USE, 2024–2029 (USD MILLION)
  • TABLE 326 INDIA: PRECISION IRRIGATION MARKET, BY TYPE, 2019–2023 (USD MILLION)
  • TABLE 327 INDIA: MARKET, BY TYPE, 2024–2029 (USD MILLION)
  • TABLE 328 INDIA: MARKET, BY SPRINKLER IRRIGATION, 2019–2023 (USD MILLION)
  • TABLE 329 INDIA: MARKET, BY SPRINKLER IRRIGATION, 2024–2029 (USD MILLION)
  • TABLE 330 INDIA: MARKET, BY DRIP IRRIGATION, 2019–2023 (USD MILLION)
  • TABLE 331 INDIA: PMARKET, BY DRIP IRRIGATION, 2024–2029 (USD MILLION)
  • TABLE 332 INDIA: MARKET, BY END USE, 2019–2023 (USD MILLION)
  • TABLE 333 INDIA: MARKET, BY END USE, 2024–2029 (USD MILLION)
  • TABLE 334 JAPAN: PRECISION IRRIGATION MARKET, BY TYPE, 2019–2023 (USD MILLION)
  • TABLE 335 JAPAN: MARKET, BY TYPE, 2024–2029 (USD MILLION)
  • TABLE 336 JAPAN: MARKET, BY SPRINKLER IRRIGATION, 2019–2023 (USD MILLION)
  • TABLE 337 JAPAN: MARKET, BY SPRINKLER IRRIGATION, 2024–2029 (USD MILLION)
  • TABLE 338 JAPAN: MARKET, BY DRIP IRRIGATION, 2019–2023 (USD MILLION)
  • TABLE 339 JAPAN: MARKET, BY DRIP IRRIGATION, 2024–2029 (USD MILLION)
  • TABLE 340 JAPAN: MARKET, BY END USE, 2019–2023 (USD MILLION)
  • TABLE 341 JAPAN: MARKET, BY END USE, 2024–2029 (USD MILLION)
  • TABLE 342 AUSTRALIA: PRECISION IRRIGATION MARKET, BY TYPE, 2019–2023 (USD MILLION)
  • TABLE 343 AUSTRALIA: MARKET, BY TYPE, 2024–2029 (USD MILLION)
  • TABLE 344 AUSTRALIA: MARKET, BY SPRINKLER IRRIGATION, 2019–2023 (USD MILLION)
  • TABLE 345 AUSTRALIA: MARKET, BY SPRINKLER IRRIGATION, 2024–2029 (USD MILLION)
  • TABLE 346 AUSTRALIA: MARKET, BY DRIP IRRIGATION, 2019–2023 (USD MILLION)
  • TABLE 347 AUSTRALIA: MARKET, BY DRIP IRRIGATION, 2024–2029 (USD MILLION)
  • TABLE 348 AUSTRALIA: MARKET, BY END USE, 2019–2023 (USD MILLION)
  • TABLE 349 AUSTRALIA: MARKET, BY END USE, 2024–2029 (USD MILLION)
  • TABLE 350 REST OF ASIA PACIFIC: PRECISION IRRIGATION MARKET, BY TYPE, 2019–2023 (USD MILLION)
  • TABLE 351 REST OF ASIA PACIFIC: MARKET, BY TYPE, 2024–2029 (USD MILLION)
  • TABLE 352 REST OF ASIA PACIFIC: MARKET, BY SPRINKLER IRRIGATION, 2019–2023 (USD MILLION)
  • TABLE 353 REST OF ASIA PACIFIC: MARKET, BY SPRINKLER IRRIGATION, 2024–2029 (USD MILLION)
  • TABLE 354 REST OF ASIA PACIFIC: MARKET, BY DRIP IRRIGATION, 2019–2023 (USD MILLION)
  • TABLE 355 REST OF ASIA PACIFIC: MARKET, BY DRIP IRRIGATION, 2024–2029 (USD MILLION)
  • TABLE 356 REST OF ASIA PACIFIC: MARKET, BY END USE, 2019–2023 (USD MILLION)
  • TABLE 357 REST OF ASIA PACIFIC: MARKET, BY END USE, 2024–2029 (USD MILLION)
  • TABLE 358 SOUTH AMERICA: PRECISION IRRIGATION MARKET, BY COUNTRY, 2019–2023 (USD MILLION)
  • TABLE 359 SOUTH AMERICA: MARKET, BY COUNTRY, 2024–2029 (USD MILLION)
  • TABLE 360 SOUTH AMERICA: MARKET, BY TYPE, 2019–2023 (USD MILLION)
  • TABLE 361 SOUTH AMERICA: MARKET, BY TYPE, 2024–2029 (USD MILLION)
  • TABLE 362 SOUTH AMERICA: MARKET, BY SPRINKLER IRRIGATION, 2019–2023 (USD MILLION)
  • TABLE 363 SOUTH AMERICA: PRECISION IRRIGATION MARKET, BY SPRINKLER IRRIGATION, 2024–2029 (USD MILLION)
  • TABLE 364 SOUTH AMERICA: MARKET, BY DRIP IRRIGATION, 2019–2023 (USD MILLION)
  • TABLE 365 SOUTH AMERICA: MARKET, BY DRIP IRRIGATION, 2024–2029 (USD MILLION)
  • TABLE 366 SOUTH AMERICA: MARKET, BY TECHNOLOGY TYPE, 2019–2023 (USD MILLION)
  • TABLE 367 SOUTH AMERICA: MARKET, BY TECHNOLOGY TYPE, 2024–2029 (USD MILLION)
  • TABLE 368 SOUTH AMERICA: MARKET, BY COMPONENT, 2019–2023 (USD MILLION)
  • TABLE 369 SOUTH AMERICA: MARKET, BY COMPONENT, 2024–2029 (USD MILLION)
  • TABLE 370 SOUTH AMERICA: MARKET, BY SENSOR, 2019–2023 (USD MILLION)
  • TABLE 371 SOUTH AMERICA: PRECISION IRRIGATION MARKET, BY SENSOR, 2024–2029 (USD MILLION)
  • TABLE 372 SOUTH AMERICA: MARKET, BY END USE, 2019–2023 (USD MILLION)
  • TABLE 373 SOUTH AMERICA: MARKET, BY END USE, 2024–2029 (USD MILLION)
  • TABLE 374 SOUTH AMERICA: MARKET, BY AGRICULTURE, 2019–2023 (USD MILLION)
  • TABLE 375 SOUTH AMERICA: MARKET, BY AGRICULTURE, 2024–2029 (USD MILLION)
  • TABLE 376 SOUTH AMERICA: MARKET, BY OPEN-FIELD AGRICULTURE, 2019–2023 (USD MILLION)
  • TABLE 377 SOUTH AMERICA: MARKET, BY OPEN-FIELD AGRICULTURE, 2024–2029 (USD MILLION)
  • TABLE 378 SOUTH AMERICA: MARKET, BY CEREAL & GRAIN, 2019–2023 (USD MILLION)
  • TABLE 379 SOUTH AMERICA: MARKET, BY CEREAL & GRAIN, 2024–2029 (USD MILLION)
  • TABLE 380 SOUTH AMERICA: MARKET, BY OILSEED & PULSE, 2019–2023 (USD MILLION)
  • TABLE 381 SOUTH AMERICA: MARKET, BY OILSEED & PULSE, 2024–2029 (USD MILLION)
  • TABLE 382 SOUTH AMERICA: MARKET, BY VEGETABLE, 2019–2023 (USD MILLION)
  • TABLE 383 SOUTH AMERICA: MARKET, BY VEGETABLE, 2024–2029 (USD MILLION)
  • TABLE 384 SOUTH AMERICA: MARKET, BY FRUIT & NUT, 2019–2023 (USD MILLION)
  • TABLE 385 SOUTH AMERICA: MARKET, BY FRUIT & NUT, 2024–2029 (USD MILLION)
  • TABLE 386 SOUTH AMERICA: MARKET, BY NONAGRICULTURE, 2019–2023 (USD MILLION)
  • TABLE 387 SOUTH AMERICA: MARKET, BY NONAGRICULTURE, 2024–2029 (USD MILLION)
  • TABLE 388 BRAZIL: PRECISION IRRIGATION MARKET, BY TYPE, 2019–2023 (USD MILLION)
  • TABLE 389 BRAZIL: MARKET, BY TYPE, 2024–2029 (USD MILLION)
  • TABLE 390 BRAZIL: MARKET, BY SPRINKLER IRRIGATION, 2019–2023 (USD MILLION)
  • TABLE 391 BRAZIL: MARKET, BY SPRINKLER IRRIGATION, 2024–2029 (USD MILLION)
  • TABLE 392 BRAZIL: MARKET, BY DRIP IRRIGATION, 2019–2023 (USD MILLION)
  • TABLE 393 BRAZIL: MARKET, BY DRIP IRRIGATION, 2024–2029 (USD MILLION)
  • TABLE 394 BRAZIL: MARKET, BY END USE, 2019–2023 (USD MILLION)
  • TABLE 395 BRAZIL: MARKET, BY END USE, 2024–2029 (USD MILLION)
  • TABLE 396 ARGENTINA: PRECISION IRRIGATION MARKET, BY TYPE, 2019–2023 (USD MILLION)
  • TABLE 397 ARGENTINA: MARKET, BY TYPE, 2024–2029 (USD MILLION)
  • TABLE 398 ARGENTINA: MARKET, BY SPRINKLER IRRIGATION, 2019–2023 (USD MILLION)
  • TABLE 399 ARGENTINA: MARKET, BY SPRINKLER IRRIGATION, 2024–2029 (USD MILLION)
  • TABLE 400 ARGENTINA: MARKET, BY DRIP IRRIGATION, 2019–2023 (USD MILLION)
  • TABLE 401 ARGENTINA: MARKET, BY DRIP IRRIGATION, 2024–2029 (USD MILLION)
  • TABLE 402 ARGENTINA: MARKET, BY END USE, 2019–2023 (USD MILLION)
  • TABLE 403 ARGENTINA: MARKET, BY END USE, 2024–2029 (USD MILLION)
  • TABLE 404 REST OF SOUTH AMERICA: PRECISION IRRIGATION MARKET, BY TYPE, 2019–2023 (USD MILLION)
  • TABLE 405 REST OF SOUTH AMERICA: MARKET, BY TYPE, 2024–2029 (USD MILLION)
  • TABLE 406 REST OF SOUTH AMERICA: MARKET, BY SPRINKLER IRRIGATION, 2019–2023 (USD MILLION)
  • TABLE 407 REST OF SOUTH AMERICA: MARKET, BY SPRINKLER IRRIGATION, 2024–2029 (USD MILLION)
  • TABLE 408 REST OF SOUTH AMERICA: MARKET, BY DRIP IRRIGATION, 2019–2023 (USD MILLION)
  • TABLE 409 REST OF SOUTH AMERICA: MARKET, BY DRIP IRRIGATION, 2024–2029 (USD MILLION)
  • TABLE 410 REST OF SOUTH AMERICA: MARKET, BY END USE, 2019–2023 (USD MILLION)
  • TABLE 411 REST OF SOUTH AMERICA: MARKET, BY END USE, 2024–2029 (USD MILLION)
  • TABLE 412 ROW: PRECISION IRRIGATION MARKET, BY COUNTRY, 2019–2023 (USD MILLION)
  • TABLE 413 ROW: MARKET, BY COUNTRY, 2024–2029 (USD MILLION)
  • TABLE 414 ROW: MARKET, BY TYPE, 2019–2023 (USD MILLION)
  • TABLE 415 ROW: MARKET, BY TYPE, 2024–2029 (USD MILLION)
  • TABLE 416 ROW: MARKET, BY SPRINKLER IRRIGATION, 2019–2023 (USD MILLION)
  • TABLE 417 ROW: MARKET, BY SPRINKLER IRRIGATION, 2024–2029 (USD MILLION)
  • TABLE 418 ROW: MARKET, BY DRIP IRRIGATION, 2019–2023 (USD MILLION)
  • TABLE 419 ROW: MARKET, BY DRIP IRRIGATION, 2024–2029 (USD MILLION)
  • TABLE 420 ROW: MARKET, BY TECHNOLOGY TYPE, 2019–2023 (USD MILLION)
  • TABLE 421 ROW: MARKET, BY TECHNOLOGY TYPE, 2024–2029 (USD MILLION)
  • TABLE 422 ROW: MARKET, BY COMPONENT, 2019–2023 (USD MILLION)
  • TABLE 423 ROW: MARKET, BY COMPONENT, 2024–2029 (USD MILLION)
  • TABLE 424 ROW: MARKET, BY SENSOR, 2019–2023 (USD MILLION)
  • TABLE 425 ROW: MARKET, BY SENSOR, 2024–2029 (USD MILLION)
  • TABLE 426 ROW: PRECISION IRRIGATION MARKET, BY END USE, 2019–2023 (USD MILLION)
  • TABLE 427 ROW: MARKET, BY END USE, 2024–2029 (USD MILLION)
  • TABLE 428 ROW: MARKET, BY AGRICULTURE, 2019–2023 (USD MILLION)
  • TABLE 429 ROW: MARKET, BY AGRICULTURE, 2024–2029 (USD MILLION)
  • TABLE 430 ROW: MARKET, BY OPEN-FIELD AGRICULTURE, 2019–2023 (USD MILLION)
  • TABLE 431 ROW: MARKET, BY OPEN-FIELD AGRICULTURE, 2024–2029 (USD MILLION)
  • TABLE 432 ROW: MARKET, BY CEREAL & GRAIN, 2019–2023 (USD MILLION)
  • TABLE 433 ROW: MARKET, BY CEREAL & GRAIN, 2024–2029 (USD MILLION)
  • TABLE 434 ROW: MARKET, BY OILSEED & PULSE, 2019–2023 (USD MILLION)
  • TABLE 435 ROW: MARKET, BY OILSEED & PULSE, 2024–2029 (USD MILLION)
  • TABLE 436 ROW: MARKET, BY VEGETABLE, 2019–2023 (USD MILLION)
  • TABLE 437 ROW: MARKET, BY VEGETABLE, 2024–2029 (USD MILLION)
  • TABLE 438 ROW: PRECISION IRRIGATION MARKET, BY FRUIT & NUT, 2019–2023 (USD MILLION)
  • TABLE 439 ROW: MARKET, BY FRUIT & NUT, 2024–2029 (USD MILLION)
  • TABLE 440 ROW: MARKET, BY NONAGRICULTURE, 2019–2023 (USD MILLION)
  • TABLE 441 ROW: MARKET, BY NONAGRICULTURE, 2024–2029 (USD MILLION)
  • TABLE 442 AFRICA: PRECISION IRRIGATION MARKET, BY TYPE, 2019–2023 (USD MILLION)
  • TABLE 443 AFRICA: MARKET, BY TYPE, 2024–2029 (USD MILLION)
  • TABLE 444 ROW: MARKET, BY SPRINKLER IRRIGATION, 2019–2023 (USD MILLION)
  • TABLE 445 AFRICA: PRECISION IRRIGATION MARKET, BY SPRINKLER IRRIGATION, 2024–2029 (USD MILLION)
  • TABLE 446 AFRICA: MARKET, BY DRIP IRRIGATION, 2019–2023 (USD MILLION)
  • TABLE 447 AFRICA: MARKET, BY DRIP IRRIGATION, 2024–2029 (USD MILLION)
  • TABLE 448 AFRICA: MARKET, BY END USE, 2019–2023 (USD MILLION)
  • TABLE 449 AFRICA: MARKET, BY END USE, 2024–2029 (USD MILLION)
  • TABLE 450 MIDDLE EAST: PRECISION IRRIGATION MARKET, BY COUNTRY, 2019–2023 (USD MILLION)
  • TABLE 451 MIDDLE EAST: MARKET, BY COUNTRY, 2024–2029 (USD MILLION)
  • TABLE 452 MIDDLE EAST: MARKET, BY TYPE, 2019–2023 (USD MILLION)
  • TABLE 453 MIDDLE EAST: MARKET, BY TYPE, 2024–2029 (USD MILLION)
  • TABLE 454 MIDDLE EAST: MARKET, BY SPRINKLER IRRIGATION, 2019–2023 (USD MILLION)
  • TABLE 455 MIDDLE EAST: MARKET, BY SPRINKLER IRRIGATION, 2024–2029 (USD MILLION)
  • TABLE 456 MIDDLE EAST: MARKET, BY DRIP IRRIGATION, 2019–2023 (USD MILLION)
  • TABLE 457 MIDDLE EAST: MARKET, BY DRIP IRRIGATION, 2024–2029 (USD MILLION)
  • TABLE 458 MIDDLE EAST: MARKET, BY END USE, 2019–2023 (USD MILLION)
  • TABLE 459 MIDDLE EAST: MARKET, BY END USE, 2024–2029 (USD MILLION)
  • TABLE 460 ISRAEL: PRECISION IRRIGATION MARKET, BY TYPE, 2019–2023 (USD MILLION)
  • TABLE 461 ISRAEL: MARKET, BY TYPE, 2024–2029 (USD MILLION)
  • TABLE 462 ISRAEL: MARKET, BY SPRINKLER IRRIGATION, 2019–2023 (USD MILLION)
  • TABLE 463 ISRAEL: MARKET, BY SPRINKLER IRRIGATION, 2024–2029 (USD MILLION)
  • TABLE 464 ISRAEL: MARKET, BY DRIP IRRIGATION, 2019–2023 (USD MILLION)
  • TABLE 465 ISRAEL: MARKET, BY DRIP IRRIGATION, 2024–2029 (USD MILLION)
  • TABLE 466 ISRAEL: MARKET, BY END USE, 2019–2023 (USD MILLION)
  • TABLE 467 ISRAEL: MARKET, BY END USE, 2024–2029 (USD MILLION)
  • TABLE 468 REST OF MIDDLE EAST: PRECISION IRRIGATION MARKET, BY TYPE, 2019–2023 (USD MILLION)
  • TABLE 469 REST OF MIDDLE EAST: MARKET, BY TYPE, 2024–2029 (USD MILLION)
  • TABLE 470 REST OF MIDDLE EAST: MARKET, BY SPRINKLER IRRIGATION, 2019–2023 (USD MILLION)
  • TABLE 471 REST OF MIDDLE EAST: MARKET, BY SPRINKLER IRRIGATION, 2024–2029 (USD MILLION)
  • TABLE 472 REST OF MIDDLE EAST: MARKET, BY DRIP IRRIGATION, 2019–2023 (USD MILLION)
  • TABLE 473 REST OF MIDDLE EAST: MARKET, BY DRIP IRRIGATION, 2024–2029 (USD MILLION)
  • TABLE 474 REST OF MIDDLE EAST: MARKET, BY END USE, 2019–2023 (USD MILLION)
  • TABLE 475 REST OF MIDDLE EAST: MARKET, BY END USE, 2024–2029 (USD MILLION)
  • TABLE 476 OVERVIEW OF STRATEGIES DEPLOYED BY KEY MARKET PLAYERS
  • TABLE 477 PRECISION IRRIGATION MARKET: DEGREE OF COMPETITION, 2023
  • TABLE 478 MARKET: REGIONAL FOOTPRINT
  • TABLE 479 MARKET: TYPE FOOTPRINT
  • TABLE 480 MARKET: END-USE FOOTPRINT
  • TABLE 481 MARKET: KEY STARTUPS/SMES
  • TABLE 482 MARKET: COMPETITIVE BENCHMARKING OF KEY STARTUPS/SMES, 2023
  • TABLE 483 MARKET: PRODUCT LAUNCHES, JANUARY 2019– SEPTEMBER 2024
  • TABLE 484 MARKET: DEALS, JANUARY 2019–SEPTEMBER 2024
  • TABLE 485 PRECISION IRRIGATION MARKET: EXPANSIONS, JANUARY 2019– SEPTEMBER 2024
  • TABLE 486 PRECISION IRRIGATION MARKET: OTHER DEALS/DEVELOPMENTS, JANUARY 2019–SEPTEMBER 2024
  • TABLE 487 VALMONT INDUSTRIES INC.: COMPANY OVERVIEW
  • TABLE 488 VALMONT INDUSTRIES INC.: PRODUCTS/SOLUTIONS/SERVICES OFFERED
  • TABLE 489 VALMONT INDUSTRIES INC.: DEALS
  • TABLE 490 NETAFIM: COMPANY OVERVIEW
  • TABLE 491 NETAFIM: PRODUCTS/SOLUTIONS/SERVICES OFFERED
  • TABLE 492 NETAFIM: PRODUCT LAUNCHES
  • TABLE 493 NETAFIM: DEALS
  • TABLE 494 HUNTER INDUSTRIES INC.: COMPANY OVERVIEW
  • TABLE 495 HUNTER INDUSTRIES INC.: PRODUCTS/SOLUTIONS/SERVICES OFFERED
  • TABLE 496 HUNTER INDUSTRIES INC.: DEALS
  • TABLE 497 THE TORO COMPANY: COMPANY OVERVIEW
  • TABLE 498 THE TORO COMPANY: PRODUCTS/SOLUTIONS/SERVICES OFFERED
  • TABLE 499 THE TORO COMPANY: PRODUCT LAUNCHES
  • TABLE 500 THE TORO COMPANY: DEALS
  • TABLE 501 THE TORO COMPANY: OTHER DEVELOPMENTS
  • TABLE 502 RAIN BIRD CORPORATION: COMPANY OVERVIEW
  • TABLE 503 RAIN BIRD CORPORATION: PRODUCTS/SOLUTIONS/SERVICES OFFERED
  • TABLE 504 RAIN BIRD CORPORATION: PRODUCT LAUNCHES
  • TABLE 505 RAIN BIRD CORPORATION: DEALS
  • TABLE 506 LINDSAY CORPORATION: COMPANY OVERVIEW
  • TABLE 507 LINDSAY CORPORATION: PRODUCTS/SOLUTIONS/SERVICES OFFERED
  • TABLE 508 LINDSAY CORPORATION: PRODUCT LAUNCHES
  • TABLE 509 LINDSAY CORPORATION: DEALS
  • TABLE 510 RIVULIS – IN ALLIANCE WITH JAIN INTERNATIONAL: COMPANY OVERVIEW
  • TABLE 511 RIVULIS – IN ALLIANCE WITH JAIN INTERNATIONAL: PRODUCTS/SOLUTIONS/SERVICES OFFERED
  • TABLE 512 RIVULIS – IN ALLIANCE WITH JAIN INTERNATIONAL: DEALS
  • TABLE 513 RIVULIS – IN ALLIANCE WITH JAIN INTERNATIONAL: EXPANSIONS
  • TABLE 514 HYDROPOINT: COMPANY OVERVIEW
  • TABLE 515 HYDROPOINT: PRODUCTS/SOLUTIONS/SERVICES OFFERED
  • TABLE 516 HYDROPOINT: PRODUCT LAUNCHES
  • TABLE 517 HYDROPOINT: DEALS
  • TABLE 518 REINKE MANUFACTURING CO., INC.: COMPANY OVERVIEW
  • TABLE 519 REINKE MANUFACTURING CO., INC.: PRODUCTS/SOLUTIONS/SERVICES OFFERED
  • TABLE 520 REINKE MANUFACTURING CO., INC.: DEALS
  • TABLE 521 REINKE MANUFACTURING CO., INC.: EXPANSIONS
  • TABLE 522 AZUD: COMPANY OVERVIEW
  • TABLE 523 AZUD: PRODUCTS/SOLUTIONS/SERVICES OFFERED
  • TABLE 524 T-L IRRIGATION: COMPANY OVERVIEW
  • TABLE 525 T-L IRRIGATION: PRODUCTS/SOLUTIONS/SERVICES OFFERED
  • TABLE 526 T-L IRRIGATION: PRODUCT LAUNCHES
  • TABLE 527 MAHINDRA IRRIGATION: COMPANY OVERVIEW
  • TABLE 528 MAHINDRA IRRIGATION: PRODUCTS/SOLUTIONS/SERVICES OFFERED
  • TABLE 529 MAHINDRA IRRIGATION: OTHER DEVELOPMENTS
  • TABLE 530 METZER: COMPANY OVERVIEW
  • TABLE 531 METZER: PRODUCTS/SOLUTIONS/SERVICES OFFERED
  • TABLE 532 DRAGON-LINE: COMPANY OVERVIEW
  • TABLE 533 DRAGON-LINE: PRODUCTS/SOLUTIONS/SERVICES OFFERED
  • TABLE 534 DRAGON-LINE: DEALS
  • TABLE 535 HORTAU INC.: COMPANY OVERVIEW
  • TABLE 536 HORTAU INC.: PRODUCTS/SOLUTIONS/SERVICES OFFERED
  • TABLE 537 CROPX INC.: COMPANY OVERVIEW
  • TABLE 538 CROPX INC.: PRODUCTS/SOLUTIONS/SERVICES OFFERED
  • TABLE 539 CROPX INC.: DEALS
  • TABLE 540 WEATHERMATIC: COMPANY OVERVIEW
  • TABLE 541 WEATHERMATIC: PRODUCTS/SOLUTIONS/SERVICES OFFERED
  • TABLE 542 CHINADRIP IRRIGATION EQUIPMENT (XIAMEN) CO., LTD: COMPANY OVERVIEW
  • TABLE 543 ELGO IRRIGATION LTD.: COMPANY OVERVIEW
  • TABLE 544 AQUASPY INC.: COMPANY OVERVIEW
  • TABLE 545 GRODAN (ROCKWOOL A/S.): COMPANY OVERVIEW
  • TABLE 546 LIBELIUM COMUNICACIONES DISTRIBUIDAS S.L.: COMPANY OVERVIEW
  • TABLE 547 DIG CORPORATION: COMPANY OVERVIEW
  • TABLE 548 TRIMBLE, INC.: COMPANY OVERVIEW
  • TABLE 549 BERMAD CS LTD.: COMPANY OVERVIEW
  • TABLE 550 ADJACENT MARKETS TO PRECISION IRRIGATION MARKET
  • TABLE 551 DRIP IRRIGATION MARKET, BY APPLICATION, 2019–2023 (USD MILLION)
  • TABLE 552 DRIP IRRIGATION MARKET, BY APPLICATION, 2024–2029 (USD MILLION)
  • TABLE 553 IRRIGATION AUTOMATION MARKET, BY COMPONENT, 2019–2021 (USD MILLION)
  • TABLE 554 IRRIGATION AUTOMATION MARKET, BY COMPONENT, 2022–2027 (USD MILLION)
LIST OF FIGURES
 
  • FIGURE 1 PRECISION IRRIGATION MARKET SEGMENTATION
  • FIGURE 2 PRECISION IRRIGATION MARKET: RESEARCH DESIGN
  • FIGURE 3 KEY DATA FROM PRIMARY SOURCES
  • FIGURE 4 PRECISION IRRIGATION MARKET SIZE ESTIMATION (SUPPLY SIDE)
  • FIGURE 5 DEMAND-SIDE ASPECTS OF MARKET SIZING
  • FIGURE 6 PRECISION IRRIGATION MARKET SIZE ESTIMATION: BOTTOM-UP APPROACH
  • FIGURE 7 PRECISION IRRIGATION MARKET SIZE ESTIMATION: TOP-DOWN APPROACH
  • FIGURE 8 DATA TRIANGULATION
  • FIGURE 9 PRECISION IRRIGATION MARKET, BY TYPE, 2024 VS. 2029 (USD MILLION)
  • FIGURE 10 PRECISION IRRIGATION MARKET, BY TECHNOLOGY TYPE, 2024 VS. 2029 (USD MILLION)
  • FIGURE 11 PRECISION IRRIGATION MARKET, BY COMPONENT, 2024 VS. 2029 (USD MILLION)
  • FIGURE 12 PRECISION IRRIGATION MARKET, BY END USE, 2024 VS. 2029 (USD MILLION)
  • FIGURE 13 PRECISION IRRIGATION MARKET, BY REGION, 2024–2029
  • FIGURE 14 INCREASING WATER SCARCITY TO PROPEL MARKET GROWTH
  • FIGURE 15 US EXPECTED TO ACCOUNT FOR LARGEST MARKET SHARE DURING FORECAST PERIOD
  • FIGURE 16 CHINA EXPECTED TO ACCOUNT FOR LARGEST SHARE IN 2024
  • FIGURE 17 SPRINKLER IRRIGATION SEGMENT PROJECTED TO DOMINATE PRECISION IRRIGATION MARKET DURING FORECAST PERIOD
  • FIGURE 18 AI & ML ALGORITHMS IN IRRIGATION EXPECTED TO DOMINATE MARKET DURING FORECAST PERIOD
  • FIGURE 19 CONTROLLERS SEGMENT EXPECTED TO DOMINATE MARKET DURING FORECAST PERIOD
  • FIGURE 20 NONAGRICULTURE SEGMENT PROJECTED TO DOMINATE MARKET DURING FORECAST PERIOD
  • FIGURE 21 GLOBAL FRESHWATER WITHDRAWALS, 2020
  • FIGURE 22 POPULATION PROJECTION: TOP 10 POPULOUS COUNTRIES, 2050 VS. 2075 (THOUSANDS)
  • FIGURE 23 MARKET DYNAMICS: PRECISION IRRIGATION MARKET
  • FIGURE 24 LEVEL OF MECHANIZATION OF AGRICULTURE IN WESTERN EUROPE & SELECTED COUNTRIES
  • FIGURE 25 ADOPTION OF GEN AI IN PRECISION IRRIGATION
  • FIGURE 26 PRECISION IRRIGATION MARKET: SUPPLY CHAIN ANALYSIS
  • FIGURE 27 PRECISION IRRIGATION MARKET: VALUE CHAIN ANALYSIS
  • FIGURE 28 EXPORT VALUE OF HS CODE 842482: KEY COUNTRIES, 2019–2023 (USD THOUSAND)
  • FIGURE 29 IMPORT VALUE OF HS CODE 842482: KEY COUNTRIES, 2019–2023 (USD THOUSAND)
  • FIGURE 30 AVERAGE SELLING PRICE TREND OF KEY PLAYERS, BY TYPE, 2023
  • FIGURE 31 AVERAGE SELLING PRICE TREND, BY TYPE, 2019–2023 (USD/HECTARE)
  • FIGURE 32 AVERAGE SELLING PRICE TREND, BY REGION, 2019–2023 (USD/HECTARE)
  • FIGURE 33 KEY STAKEHOLDERS IN PRECISION IRRIGATION MARKET ECOSYSTEM
  • FIGURE 34 PRECISION IRRIGATION MARKET: TRENDS/DISRUPTIONS IMPACTING CUSTOMERS’ BUSINESSES
  • FIGURE 35 PATENTS GRANTED FOR PRECISION IRRIGATION MARKET, 2014–2024
  • FIGURE 36 REGIONAL ANALYSIS OF PATENTS GRANTED FOR PRECISION IRRIGATION MARKET, 2014–2024
  • FIGURE 37 PRECISION IRRIGATION MARKET: PORTER’S FIVE FORCES ANALYSIS
  • FIGURE 38 INFLUENCE OF STAKEHOLDERS ON BUYING CRITERIA FOR END USE
  • FIGURE 39 KEY BUYING CRITERIA FOR END USE
  • FIGURE 40 INVESTMENT & FUNDING SCENARIO OF FEW PLAYERS
  • FIGURE 41 SPRINKLER IRRIGATION TO DOMINATE THE MARKET DURING FORECAST PERIOD
  • FIGURE 42 AI & ML ALGORITHMS IN IRRIGATION TO DOMINATE PRECISION IRRIGATION MARKET DURING FORECAST PERIOD
  • FIGURE 43 CONTROLLERS TO DOMINATE MARKET DURING FORECAST PERIOD
  • FIGURE 44 NONAGRICULTURE TO DOMINATE PRECISION IRRIGATION MARKET DURING FORECAST PERIOD
  • FIGURE 45 INDIA PROJECTED TO REGISTER HIGHEST CAGR DURING FORECAST PERIOD
  • FIGURE 46 NORTH AMERICA: MARKET SNAPSHOT
  • FIGURE 47 ASIA PACIFIC: PRECISION IRRIGATION MARKET SNAPSHOT
  • FIGURE 48 REVENUE ANALYSIS FOR KEY COMPANIES, 2019–2023 (USD BILLION)
  • FIGURE 49 SHARE OF LEADING PLAYERS IN PRECISION IRRIGATION MARKET, 2023
  • FIGURE 50 RANKING OF TOP FIVE PLAYERS IN PRECISION IRRIGATION MARKET, 2023
  • FIGURE 51 PRECISION IRRIGATION MARKET: COMPANY EVALUATION MATRIX (KEY PLAYERS), 2023
  • FIGURE 52 PRECISION IRRIGATION MARKET: COMPANY FOOTPRINT
  • FIGURE 53 PRECISION IRRIGATION MARKET: COMPANY EVALUATION MATRIX (STARTUPS/SMES), 2023
  • FIGURE 54 COMPANY VALUATION FOR FEW PLAYERS IN PRECISION IRRIGATION MARKET
  • FIGURE 55 EV/EBITDA OF FEW PLAYERS
  • FIGURE 56 PRECISION IRRIGATION MARKET: BRAND/PRODUCT COMPARISON
  • FIGURE 57 VALMONT INDUSTRIES INC.: COMPANY SNAPSHOT
  • FIGURE 58 NETAFIM: COMPANY SNAPSHOT
  • FIGURE 59 THE TORO COMPANY: COMPANY SNAPSHOT
  • FIGURE 60 LINDSAY CORPORATION: COMPANY SNAPSHOT
  • FIGURE 61 MAHINDRA IRRIGATION: COMPANY SNAPSHOT


The study involved two major approaches in estimating the current size of the precision irrigation market. Exhaustive secondary research was done to collect information on the market, peer, and parent markets. The next step was to validate these findings, assumptions, and sizing with industry experts across the value chain through primary research. Both top-down and bottom-up approaches were employed to estimate the complete market size. After that, market breakdown and data triangulation were used to estimate the market size of segments and subsegments.

Secondary Research

This research study involved the extensive use of secondary sources—directories and databases such as Bloomberg Businessweek and Factiva—to identify and collect information useful for a technical, market-oriented, and commercial study of the market.

In the secondary research process, various sources such as annual reports, press releases & investor presentations of companies, white papers, food journals, certified publications, articles from recognized authors, directories, and databases were referred to identify and collect information.

Secondary research was mainly used to obtain key information about the industry’s supply chain, the total pool of key players, and market classification and segmentation as per the industry trends to the bottom-most level, regional markets, and key developments from both market- and technology-oriented perspectives.

Primary Research

Extensive primary research was conducted after obtaining information regarding the precision irrigation market scenario through secondary research. Several primary interviews were conducted with market experts from both the demand and supply sides across major countries of North America, Europe, Asia Pacific, South America, and the Rest of the World. Primary data was collected through questionnaires, emails, and telephonic interviews. The primary sources from the supply side included various industry experts, such as Chief X Officers (CXOs), Vice Presidents (VPs), Directors from business development, marketing, research, and development teams, and related key executives from distributors and key opinion leaders. Primary interviews were conducted to gather insights such as market statistics, data on revenue collected from the products and services, market breakdowns, market size estimations, market forecasting, and data triangulation. Primary research also helped in understanding the various trends related to precision irrigation type, technology, component, end use, and region. Stakeholders from the demand side, such as farm associations, dealers, distributors, and government agencies, were interviewed to understand the demand side perspective on the suppliers, products, and their current usage of precision irrigation and the outlook of their business, which will affect the overall market.

Precision Irrigation Market Size, and Share

Note: The three tiers of the companies are defined based on their total revenues in 2022 or 2023, as per the availability of financial data: Tier 1: Revenue > USD 1 billion; Tier 2: USD 100 million ≤ Revenue ≤ USD 1 billion; Tier 3: Revenue < USD 100 million.

COMPANY NAME

DESIGNATION

NETAFIM (Israel)

Regional Sales Representative

Rivulis (Israel)

State Manager

Valmont Industries, Inc. (US)

Manager

AZUD (Spain)

Agronomist

Mahindra Irrigation (India)

Sales & Marketing Manager

Lindsay Corporation (US)

Sales Manager

To know about the assumptions considered for the study, download the pdf brochure

Precision Irrigation Market Size Estimation

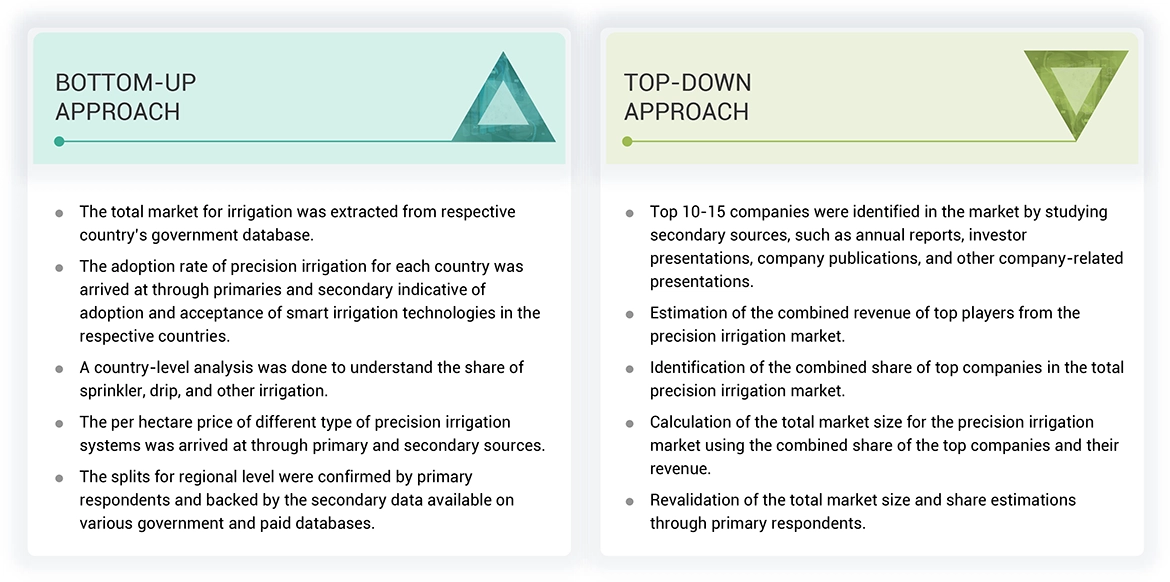
Both the top-down and bottom-up approaches were used to estimate and validate the total size of the precision irrigation market. These approaches were also used extensively to determine the size of various subsegments in the market. The research methodology used to estimate the market size includes the following details:

  • The key players in the industry and the overall markets were identified through extensive secondary research.
  • All shares, splits, and breakdowns were determined using secondary sources and verified through primary sources.
  • All possible parameters that affect the market covered in this research study were accounted for, viewed in extensive detail, verified through primary research, and analyzed to obtain final quantitative and qualitative data.
  • The research included the study of reports, reviews, and newsletters of top market players, along with extensive interviews for opinions from leaders, such as CXOs, directors, and marketing executives.

Precision Irrigation Market : Top-Down and Bottom-Up Approach

Precision Irrigation Market  Top Down and Bottom Up Approach

Data Triangulation

After arriving at the overall market size from the estimation process explained above, the total market was split into several segments and subsegments. Data triangulation and market breakdown procedures were employed, wherever applicable, to estimate the overall precision irrigation market and arrive at the exact statistics for all segments and subsegments. The data was triangulated by studying various factors and trends from the demand and supply sides. Along with this, the market size was validated using both the top-down and bottom-up approaches.

Market Definition

According to Utah State University, precision irrigation involves technology and specialized equipment to improve the efficiency and effectiveness of agriculture irrigation management. This management process is beneficial in allocating water based on spatial variability throughout fields and can sometimes conserve water and improve crop quality.

Precision irrigation is a sustainable farming method that delivers water and nutrients directly to plants at the right time and location, in carefully controlled amounts. This approach ensures optimal growing conditions by providing plants with the necessary resources in a precise, timely manner. Precision irrigation might be used for a range of irrigation systems (sprinkler, drip, and others), including the appropriate sensing, control, and decision support requirements.

Stakeholders

  • Supply side: Precision irrigation component manufacturers, drip irrigation technology providers, irrigation consultants & service providers, suppliers, and distributors
  • Demand side: Farmers, agricultural warehouse owners, horticultural cooperative societies, importers, and exporters
  • Regulatory side: Concerned government authorities, commercial research & development (R&D) institutions, and other regulatory bodies
  • Associations and industry bodies such as the Food and Agricultural Organization (FAO) - AQUASTAT, Environmental Protection Agency (EPA), the International Commission on Irrigation and Drainage (ICID), among others.

Report Objectives

MARKET INTELLIGENCE

  • Determining and projecting the size of the precision irrigation market based on type, technology type, end use, and region from 2024 to 2029
  • Identifying the attractive opportunities in the market by determining the largest and fastest-growing segments across the key regions
  • Analyzing the demand-side factors based on the following:
  • Impact of macro and microeconomic factors on the market
  • Shifts in demand patterns across different subsegments and regions

Available Customizations

With the given market data, MarketsandMarkets offers customizations according to company-specific scientific needs.

The following customization options are available for the report:

PRODUCT ANALYSIS

  • Product Matrix, which gives a detailed comparison of the product portfolio of each company.

GEOGRAPHIC ANALYSIS

With the given market data, MarketsandMarkets offers customizations according to company-specific scientific needs.

  • Further breakdown of the Rest of Europe precision irrigation market into key countries.
  • Further breakdown of the Rest of Asia Pacific precision irrigation market into key countries.
  • Further breakdown of the Rest of South America precision irrigation market into key countries.

COMPANY INFORMATION

  • Detailed analyses and profiling of additional market players (up to five)


Previous Versions of this Report

Custom Market Research Services

We Will Customise The Research For You, In Case The Report Listed Above Does Not Meet With Your Requirements

Get 10% Free Customisation

Growth opportunities and latent adjacency in Precision Irrigation Market

DMCA.com Protection Status