Power Factor Correction Market

Power Factor Correction Market by Reactive Power (0-200 KVAR, 200-500 KVAR, 500 – 1500 KVAR, Above 1500 KVAR), Type (Fixed, Automatic), Sales Channel (Distributors, OEM Direct), Application, & Region - Global Forecast to 2030

Report Code: EP 9162 Sep, 2024, by marketsandmarkets.com

[238 Pages Report] The power factor correction market is projected to reach USD 3.3 billion by 2030 from USD 2.4 billion in 2024, at a CAGR of 5.5%. The demand for power factor correction systems is increasing due to the surging need for energy-efficient products, rising focus on reduction in energy bills, and strict environmental regulations and policies. While industries and commercial establishments are seeking new means of optimizing their energy usage and reducing electricity costs, correcting the power factor is a crucial aspect for minimizing the loss of power and enhancing the overall quality of power. Nowadays, various industries deploy power factor correction solutions since these solutions allow them to lower electricity bills, reduce downtime, and also enhance equipment efficiency. Power factor correction systems also reduce stress on electrical equipment, which enhances equipment life and helps reduce maintenance costs.

Power Factor Correction Market

To know about the assumptions considered for the study, Request for Free Sample Report

Power Factor Correction Market Opportunities

To know about the assumptions considered for the study, download the pdf brochure

Power Factor Correction Market Dynamics

Driver: Increasing investments in clear energy projects

Global investments in energy transition technologies, including energy-efficiency products, are significantly driving the global power factor correction market. According to the International Renewable Energy Agency, global investment in energy transition technologies reached a record high of USD 1.3 trillion in 2022. These accelerated investments have been facilitated by the rising focus on using renewable energy sources and increasing awareness regarding the benefits offered by power factor correction systems.

Governments worldwide promote energy efficiency through stringent regulatory policies and initiatives, further fueling the demand for power factor correction systems. Companies from different industries are keen on deploying energy-efficient products and reducing power consumption and electricity bills. Power factor correction (PFC) systems are used globally by different sectors, including oil & gas, mining, and aerospace. Similarly, the increasing use of renewable energy sources is creating the need for power factor correction systems.

Restraints: High initial installation cost of PFC systems

Although PFC systems have numerous benefits with their reduced energy bills and efficiency of energy, overall high upfront cost of the system is hindering the deployment of PFC systems for many facilities. The PFC systems comprise of highly expensive components such as high-capacity capacitors and filtering inductors at low frequency. In addition to this, highly complex designing and engineering required to customize the PFC systems according to specific industrial applications would also drive up the costs. Therefore, industrial facilities carefully assess their power factor correction needs to mitigate the high initial costs and explore cost-effective alternatives such as active power factor correction systems that represents a similar functionality at a much-reduced initial cost also pose a threat to the market.

Opportunity:  Government incentives and regulations promoting energy-saving technologies

Power factor correction is pivotal to improving energy efficiency and cutting electricity costs. A low power factor may lead to higher energy bills, add strain to electrical systems, and reduce equipment lifespan. Therefore, governments have introduced initiatives to encourage power factor correction and assist businesses in advocating sustainable energy practices.

Several energy-saving programs, such as the NSW Energy Savings Scheme (ESS), provide financial incentives for companies to invest in power factor correction projects. Through the ESS, organizations can earn energy-saving certificates (ESCs) based on the energy savings achieved by implementing PFC systems. These certificates can be traded, resulting in a financial return on investment in PFC systems.

Additionally, regulatory measures have been put in place to ensure adherence to power factor standards. Some utilities impose penalties on businesses with low power factors, incentivizing them to improve efficiency. Furthermore, building codes and energy efficiency standards may require a minimum power factor for new constructions or renovations, further promoting the use of PFC systems. For example, the US Department of Energy's voluntary Energy Star guidelines recommend computing equipment to maintain a power factor of at least 0.9 at full load.

Governments often invest in educational campaigns and programs to raise awareness of the benefits of power factor correction. By informing businesses about these advantages and the resources available to support its implementation, these initiatives encourage widespread adoption and facilitate the transition toward a more energy-efficient economy.

Challenges: Complexities associated with integrating PFC systems into existing infrastructure

Integrating PFC systems with existing infrastructure can be challenging due to several technical reasons. PFC systems might use data formats different from those of existing systems. This can lead to difficulties in interpreting and exchanging information, requiring data conversion or mapping processes that can be error-prone and slow. Existing systems might use specific protocols that the PFC system does not understand, creating a communication barrier. This can hinder real-time data exchange and potentially cause delays in critical financial processes.

Integration challenges arise if the PFC system adheres to different security standards from those of the existing infrastructure, making it challenging to ensure consistent security across the entire system. This could potentially create vulnerabilities for unauthorized access or data breaches. Diagnosing and resolving issues becomes more complex when dealing with interconnected systems. IT teams may need to troubleshoot problems across the existing infrastructure and the new PFC system, extending resolution times and increasing resource demands. Maintaining the PFC system might require specialized knowledge or skills beyond the expertise of existing IT staff, necessitating additional training or hiring new personnel, thereby increasing the overall maintenance burden.

Similarly, dependency on the PFC system vendors for ongoing maintenance and support might increase, introducing vendor lock-in and potentially inflating maintenance costs over time. Merging data from disparate systems can be another challenge, making data consistency and accuracy critical to avoiding errors and maintaining reliable financial operations. Integrating new systems raises security considerations, and network vulnerabilities might be introduced if proper security protocols are not implemented during integration.

Power Factor Correction Market Ecosystem

Notable players in this industry comprise long-standing, financially robust manufacturers of power factor correction systems and related components. These companies have a significant track record in the market, offering a wide range of products, employing cutting-edge technologies, and maintaining robust global sales and marketing networks. Prominent companies in this market include Eaton (Ireland), ABB (Switzerland), GE Vernova (US), Schneider Electric (France), and Hitachi Energy Ltd (Switzerland).

Top Companies in Power Factor Correction Market

500–1,500 kVAr segment to account for third-largest share of power factor correction market by reactive power during forecast period.

The 500–1,500 kVAr segment is expected to account for the third-largest share of the power factor correction market, based on reactive power, during three forecast period. Power factor systems under this category find applications across large industrial and commercial spaces with substantial electric loads. Power factor correction systems ranging from 500 to 1,500 kVAr will efficiently meet operational requirements for managing reactive power, leading to efficacy and lower energy costs. The improved power quality also benefits industries, such as manufacturing, heavy machinery, and larger commercial complexes, through reduced electrical losses, encouraging growth and making this sector more relevant in the market.

Data centers to hold third-largest share of power factor correction market, by application, during forecast period.

Data centers, as an application segment, are expected to hold the third-largest position in the power factor correction market during the forecast period due to the increasing demand for reliable and efficient power management in these facilities. With the rapid growth of cloud computing, big data, and digital services, data centers are experiencing a surge in power consumption. Power factor correction solutions are essential in these environments to optimize energy usage, reduce operational costs, and prevent power inefficiencies that could lead to downtime or equipment damage. This critical need for energy efficiency and reliability boosts the demand for power factor correction solutions in data centers.

North America to be fastest-growing market from 2024 to 2030.

North America is expected to be the fastest-growing market during the forecast period. Grid reliability and efficiency concerns are rising in this region, thereby promoting investments in the modernization of energy infrastructure. Additionally, the need to comply with stringent regulations and policies on energy conservation and reducing carbon footprints is increasingly forcing industries to adopt PFC solutions. Moreover, the increased integration of renewable energy sources further supports the adoption of PFC technologies in North America.

Power Factor Correction Market Size, and Share

Key Market Players

The power factor correction market is dominated by a few major players that have a wide regional presence. The major players in the Power factor correction  market are GE Vernova(US), ABB (Switzerland), Schneider Electric (France), Eaton (Ireland) and Hitachi Energy Ltd. (Switzerland). Between 2019 and 2024, Strategies such as product launches, contracts, agreements, partnerships, collaborations, alliances, acquisitions, and expansions are followed by these companies to capture a larger share of the Power factor correction  market.

Get online access to the report on the World's First Market Intelligence Cloud

  • Easy to Download Historical Data & Forecast Numbers
  • Company Analysis Dashboard for high growth potential opportunities
  • Research Analyst Access for customization & queries
  • Competitor Analysis with Interactive dashboard
  • Latest News, Updates & Trend analysis
Request Sample

Scope of the Report

Report Metric

Details

Market size available for years

  • 2021–2030

Base year considered

  • 2023

Forecast period

  • 2024–2030

Forecast units

  • Value (USD), Volume (Units)

Segments Covered

  • Reactive power, Sales channel, Type, Application

Geographies covered

  • Asia Pacific, North America, Europe, Middle East & Africa, and South America

Companies covered

  • Schnieder Electric (France), Eaton (Ireland), GE Vernova (US), ABB (Switzerland), Hitachi Energy (Switzerland), Powerside (US), Cos Phi (Canada), Circutor (US), Lifasa (Spain), Ducati Energia Spa (Italy), Whatoop, Gentec (Canada), Ortea S.P.A. (US), RTR Energia SRL (Spain), Neptune India Limited (India), Controllix Corporation (US), TCI LLC (US), Enerlux Power Srl (Italy), ZEZ SILKO (Czech Republic), Yuhchang Electric Co., Ltd. (Taiwan), Sharda Electronics & Co, Powercap Capacitor Pvt. Ltd. (India), C.J. Energetics (India), Power Factor Correction Group (US), and Treffer Power System Solutions Private Limited (India)

This research report categorizes the power factor correction market by reactive power, type, sales channel, application and region.

On the basis of reactive power, the power factor correction market has been segmented as follows:
  • 0-200 KVAR
  • 200-500 KVAR
  • 500-1500 KVAR
  • Above 1500 KVAR
On the basis of type, the market has been segmented as follows:
  • Automatic
  • Fixed
On the basis of sales channel, the market has been segmented as follows:
  • Distributors
  • OEM Direct
On the basis of application, the market has been segmented as follows:
  • Industrial
    • Mining
    • Oil & Gas
    • Metals & Minerals
    • Automotive
    • Other Manufacturing Plants
  • Renewables
    • Solar
    • Wind
    • BESS
    • Others
  • Commercial
  • Datacenters
  • EV Charging
On the basis of region, the market has been segmented as follows:
  • Asia Pacific
  • Europe
  • North America
  • Middle East & Africa
  • South America

Recent Developments

  • In May 2024, GE Vernova collaborates with TECO to enhance Taiwan's power grid by deploying advanced STATCOM technology. This technology plays a crucial role in maintaining the stability of the grid, particularly when integrating higher amounts of renewable energy sources such as solar and wind power. Renewable energy sources produce power intermittently, which can lead to voltage fluctuations and disrupt power supply. The STATCOM system, a type of Flexible AC Transmission System (FACTS), regulates voltage and reactive power to ensure the grid's sustained reliability and efficiency.
  • In March 2024,  Schneider Electric announced a significant investment of USD 140 million in 2024 to expand its US-based manufacturing base, focusing on supporting critical infrastructure, industries, and data center demand. This investment includes transforming and equipping an existing building in Mt. Juliet, Tennessee, and upgrading the Smyrna, Tennessee manufacturing operations to produce custom electrical switchgear and medium-voltage power distribution products. These upgrades will enable the company to better meet the growing demand for power factor correction (PFC) solutions, which are critical for ensuring efficient and reliable power distribution in data centers and other applications where high-power computing and artificial intelligence are prevalent.
  • In August 2023, Eaton invested over USD 500 million to increase the manufacturing of electrical solutions and meet the surging demand for these solutions from North American industries. This substantial investment aims to expedite the energy transition and digitalization in utilities, commercial, healthcare, industrial, and residential sectors. This strategic initiative is also projected to significantly influence the power factor correction market, especially in North America. Eaton's improved manufacturing capabilities will play a key role in meeting the growing demand for efficient power factor correction systems in the region.

Frequently Asked Questions (FAQ):

To speak to our analyst for a discussion on the above findings, click Speak to Analyst

TABLE OF CONTENTS
 
1 INTRODUCTION (Page No. - 25)
    1.1 STUDY OBJECTIVES 
    1.2 MARKET DEFINITION 
    1.3 STUDY SCOPE 
           1.3.1 MARKET SEGMENTATION AND REGIONAL SCOPE
           1.3.2 INCLUSIONS AND EXCLUSIONS
           1.3.3 YEARS CONSIDERED
    1.4 LIMITATIONS 
    1.5 UNITS CONSIDERED 
    1.6 CURRENCY CONSIDERED 
    1.7 STAKEHOLDERS 
 
2 RESEARCH METHODOLOGY (Page No. - 30)
    2.1 RESEARCH DATA 
           2.1.1 PRIMARY AND SECONDARY RESEARCH
    2.2 DATA TRIANGULATION 
           2.2.1 SECONDARY DATA
                    2.2.1.1 Key data from secondary sources
                    2.2.1.2 Key secondary sources
           2.2.2 PRIMARY DATA
                    2.2.2.1 Major primary interview participants
                    2.2.2.2 Key data from primary sources
                    2.2.2.3 Key industry insights
                    2.2.2.4 Breakdown of primaries
    2.3 MARKET SIZE ESTIMATION 
           2.3.1 BOTTOM-UP APPROACH
           2.3.2 TOP-DOWN APPROACH
           2.3.3 DEMAND-SIDE ANALYSIS
                    2.3.3.1 Demand-side assumptions
                    2.3.3.2 Demand-side calculations
           2.3.4 SUPPLY-SIDE ANALYSIS
                    2.3.4.1 Supply-side assumptions
                    2.3.4.2 Supply-side calculations
           2.3.5 GROWTH FORECAST
    2.4 RESEARCH ASSUMPTIONS 
    2.5 RESEARCH LIMITATIONS 
    2.6 RISK ANALYSIS 
 
3 EXECUTIVE SUMMARY (Page No. - 42)
 
4 PREMIUM INSIGHTS (Page No. - 47)
    4.1 ATTRACTIVE OPPORTUNITIES FOR PLAYERS IN MARKET 
    4.2 MARKET, BY REGION 
    4.3 POWER FACTOR CORRECTION MARKET IN NORTH AMERICA, BY SALES CHANNEL AND TYPE 
    4.4 POWER FACTOR CORRECTION MARKET, BY SALES CHANNEL 
    4.5 POWER FACTOR CORRECTION MARKET, BY TYPE 
    4.6 POWER FACTOR CORRECTION MARKET, BY REACTIVE POWER 
    4.7 POWER FACTOR CORRECTION MARKET, BY APPLICATION 
 
5 MARKET OVERVIEW (Page No. - 51)
    5.1 INTRODUCTION 
    5.2 MARKET DYNAMICS 
           5.2.1 DRIVERS
                    5.2.1.1 Increasing investments in clear energy projects
                    5.2.1.2 Rising deployment of low-voltage PFC systems in industrial facilities
           5.2.2 RESTRAINTS
                    5.2.2.1 High initial installation cost of PFC systems
           5.2.3 OPPORTUNITIES
                    5.2.3.1 Introduction of incentive schemes by governments for adopting energy-saving technologies
                    5.2.3.2 Growing inclination toward smart grid deployment
                    5.2.3.3 Elevating demand for electric vehicles
           5.2.4 CHALLENGES
                    5.2.4.1 Complexities associated with integrating PFC systems into existing infrastructure
    5.3 TRENDS/DISRUPTIONS IMPACTING CUSTOMER BUSINESS 
    5.4 VALUE CHAIN ANALYSIS 
    5.5 ECOSYSTEM ANALYSIS 
    5.6 INVESTMENT AND FUNDING SCENARIO 
    5.7 IMPACT OF AI/GENERATIVE AI ON POWER FACTOR CORRECTION MARKET 
           5.7.1 RATIONALE FOR IMPACT LEVELS
    5.8 GLOBAL MACROECONOMIC OUTLOOK 
           5.8.1 INTRODUCTION
           5.8.2 GDP TRENDS AND FORECAST
           5.8.3 MANUFACTURING VALUE ADDED (% OF GDP)
           5.8.4 GLOBAL ELECTRICITY PRODUCTION
    5.9 TECHNOLOGY ANALYSIS 
           5.9.1 KEY TECHNOLOGIES
                    5.9.1.1 Internet of Things (IoT)
           5.9.2 ADJACENT TECHNOLOGIES
                    5.9.2.1 Solid-state switching devices
    5.1 PATENT ANALYSIS 
    5.11 TRADE ANALYSIS 
           5.11.1 EXPORT SCENARIO (HS CODE 8532)
           5.11.2 IMPORT SCENARIO (HS CODE 8532)
    5.12 KEY CONFERENCES AND EVENTS, 2024–2025 
    5.13 PRICING ANALYSIS 
           5.13.1 INDICATIVE PRICING TREND OF CAPACITOR BANKS USED IN POWER FACTOR CORRECTION, BY REACTIVE POWER
           5.13.2 AVERAGE SELLING PRICE TREND OF POWER FACTOR CORRECTION SYSTEM, BY REGION
    5.14 TARIFF AND REGULATORY LANDSCAPE 
           5.14.1 TARIFF ANALYSIS
           5.14.2 REGULATORY BODIES, GOVERNMENT AGENCIES, AND OTHER ORGANIZATIONS
           5.14.3 REGULATORY FRAMEWORK
    5.15 PORTER’S FIVE FORCES ANALYSIS 
           5.15.1 THREAT OF SUBSTITUTES
           5.15.2 BARGAINING POWER OF SUPPLIERS
           5.15.3 BARGAINING POWER OF BUYERS
           5.15.4 THREAT OF NEW ENTRANTS
           5.15.5 INTENSITY OF COMPETITIVE RIVALRY
    5.16 KEY STAKEHOLDERS AND BUYING CRITERIA 
           5.16.1 KEY STAKEHOLDERS IN BUYING PROCESS
           5.16.2 BUYING CRITERIA
    5.17 CASE STUDY ANALYSIS 
           5.17.1 SHOPPING MALL IN SYDNEY DEPLOYED SVG SYSTEM TO IMPROVE POWER FACTOR AND REDUCE ENERGY EXPENSE
           5.17.2 HOSPITAL IN MALAYSIA ADOPTED AUTOMATIC PFC SYSTEM FOR RELIABLE AND UNINTERRUPTED POWER SUPPLY
           5.17.3 MEDIUM-SIZED TEXTILE FACTORY IN INDIA IMPLEMENTED PFC CAPACITOR TO REDUCE ENERGY BILLS AND AVOID PENALTIES
 
6 POWER FACTOR CORRECTION MARKET, BY REACTIVE POWER (Page No. - 87)
    6.1 INTRODUCTION 
    6.2 0–200 KVAR 
           6.2.1 RISING DEMAND ACROSS SMALL COMMERCIAL APPLICATIONS TO DRIVE SEGMENTAL GROWTH
    6.3 200–500 KVAR 
           6.3.1 RISING USE IN MEDIUM-SIZED COMMERCIAL BUILDINGS AND INDUSTRIAL FACILITIES TO FUEL SEGMENTAL GROWTH
    6.4 500–1,500 KVAR 
           6.4.1 INCREASING FOCUS OF LARGE INDUSTRIAL PLANT OWNERS ON MINIMIZING ENERGY LOSSES TO BOOST DEMAND
    6.5 ABOVE 1,500 KVAR 
           6.5.1 PRESSING NEED TO STABILIZE VOLTAGE LEVELS ACROSS POWER GRID TO SUPPORT SEGMENTAL GROWTH
 
7 POWER FACTOR CORRECTION MARKET, BY TYPE (Page No. - 94)
    7.1 INTRODUCTION 
    7.2 AUTOMATIC 
           7.2.1 ABILITY TO CRAFT EFFICIENT ELECTRICAL SYSTEMS TO BOOST DEMAND
    7.3 FIXED 
           7.3.1 RISING FOCUS ON ENERGY COST REDUCTION TO SUPPORT SEGMENTAL GROWTH
 
8 POWER FACTOR CORRECTION MARKET, BY SALES CHANNEL (Page No. - 98)
    8.1 INTRODUCTION 
    8.2 DISTRIBUTORS 
           8.2.1 ABILITY TO COVER BROADER GEOGRAPHIC AREAS AND ENTER NEW MARKETS AT FASTER RATE TO BOOST SEGMENTAL GROWTH
    8.3 OEM DIRECT 
           8.3.1 HIGHER UPFRONT COSTS FOR TRAINING SALES TEAM TO LEAD TO SMALLER MARKET SHARE
 
9 POWER FACTOR CORRECTION MARKET, BY APPLICATION (Page No. - 102)
    9.1 INTRODUCTION 
    9.2 INDUSTRIAL 
           9.2.1 RISING USE OF POWER-INTENSIVE INDUSTRIAL EQUIPMENT TO BOOST DEMAND
    9.3 RENEWABLE 
           9.3.1 INTEGRATION OF RENEWABLE ENERGY SOURCES INTO POWER GRID TO PROPEL MARKET
    9.4 COMMERCIAL 
           9.4.1 INCREASING DEMAND FOR ENERGY EFFICIENCY AND COST REDUCTION IN COMMERCIAL BUILDINGS TO DRIVE MARKET
    9.5 DATA CENTER 
           9.5.1 SURGING NEED FOR EFFICIENT AND RELIABLE DATA CENTER INFRASTRUCTURE TO FUEL MARKET GROWTH
    9.6 EV CHARGING 
           9.6.1 INCREASING INVESTMENT AND RAPID EXPANSION OF ELECTRIC VEHICLES TO SUPPORT MARKET GROWTH
 
10 POWER FACTOR CORRECTION MARKET, BY REGION (Page No. - 111)
     10.1 INTRODUCTION 
     10.2 NORTH AMERICA 
             10.2.1 US
                       10.2.1.1 Increasing focus on sustainable energy production using renewable sources to boost demand
             10.2.2 CANADA
                       10.2.2.1 Rising demand from automotive sector to augment market growth
             10.2.3 MEXICO
                       10.2.3.1 Thriving industrial sector to propel demand
     10.3 ASIA PACIFIC 
             10.3.1 CHINA
                       10.3.1.1 Government initiatives to reduce energy consumption to boost demand
             10.3.2 JAPAN
                       10.3.2.1 Growing adoption of renewable energy sources into power grid to foster market growth
             10.3.3 SOUTH KOREA
                       10.3.3.1 Rising focus on enhancing power grid efficiency to drive market
             10.3.4 INDIA
                       10.3.4.1 Pressing need to reduce energy waste to accelerate market growth
             10.3.5 AUSTRALIA
                       10.3.5.1 Emphasis of industrial firms on reducing energy bills to spike demand
             10.3.6 REST OF ASIA PACIFIC
     10.4 EUROPE 
             10.4.1 GERMANY
                       10.4.1.1 Stringent energy regulations to fuel market growth
             10.4.2 UK
                       10.4.2.1 Strategic path to reduce energy consumption and achieve net-zero carbon emission to stimulate market growth
             10.4.3 FRANCE
                       10.4.3.1 Strong need for efficient grid operations to propel market
             10.4.4 ITALY
                       10.4.4.1 Rising demand for higher energy efficiency to drive market
             10.4.5 RUSSIA
                       10.4.5.1 Pressing need to upgrade power transmission infrastructure to drive market
             10.4.6 REST OF EUROPE
     10.5 MIDDLE EAST & AFRICA 
             10.5.1 GCC
                       10.5.1.1 Saudi Arabia
                                   10.5.1.1.1 Rising focus on building digital infrastructure to boost demand
                       10.5.1.2 UAE
                                   10.5.1.2.1 Increasing investment in renewable energy sector to propel market
                       10.5.1.3 Rest of GCC
             10.5.2 SOUTH AFRICA
                       10.5.2.1 Rising electricity costs to spur demand
             10.5.3 REST OF MIDDLE EAST & AFRICA
     10.6 SOUTH AMERICA 
             10.6.1 BRAZIL
                       10.6.1.1 Increasing adoption of clean energy sources to propel market
             10.6.2 ARGENTINA
                       10.6.2.1 Strong need for efficient grid operations to fuel market growth
             10.6.3 REST OF SOUTH AMERICA
 
11 COMPETITIVE LANDSCAPE (Page No. - 162)
     11.1 OVERVIEW 
     11.2 KEY PLAYER STRATEGIES/RIGHT TO WIN, 2020–2024 
     11.3 MARKET SHARE ANALYSIS, 2023 
     11.4 REVENUE ANALYSIS, 2019–2023 
     11.5 BRAND/PRODUCT COMPARISON 
     11.6 COMPANY VALUATION AND FINANCIAL METRICS, 2024 
     11.7 COMPANY EVALUATION MATRIX: KEY PLAYERS, 2023 
             11.7.1 STARS
             11.7.2 EMERGING COMPANIES
             11.7.3 PERVASIVE PLAYERS
             11.7.4 PARTICIPANTS
             11.7.5 COMPANY FOOTPRINT: KEY PLAYERS, 2023
                       11.7.5.1 Company footprint
                       11.7.5.2 Reactive power footprint
                       11.7.5.3 Application footprint
                       11.7.5.4 Type footprint
                       11.7.5.5 Region footprint
     11.8 COMPANY EVALUATION MATRIX: STARTUPS/SMES, 2023 
             11.8.1 PROGRESSIVE COMPANIES
             11.8.2 RESPONSIVE COMPANIES
             11.8.3 DYNAMIC COMPANIES
             11.8.4 STARTING BLOCKS
             11.8.5 COMPETITIVE BENCHMARKING: STARTUPS/SMES, 2023
                       11.8.5.1 Detailed list of key startups/SMEs
                       11.8.5.2 Competitive benchmarking of key startups/SMES
     11.9 COMPETITIVE SCENARIO 
             11.9.1 PRODUCT LAUNCHES
             11.9.2 OTHER DEVELOPMENTS
 
12 COMPANY PROFILES (Page No. - 181)
     12.1 KEY PLAYERS 
             12.1.1 SCHNEIDER ELECTRIC
                       12.1.1.1 Business overview
                       12.1.1.2 Products offered
                       12.1.1.3 Recent developments
                                   12.1.1.3.1 Developments
                       12.1.1.4 MnM view
                                   12.1.1.4.1 Key strengths/Right to win
                                   12.1.1.4.2 Strategic choices
                                   12.1.1.4.3 Weaknesses/Competitive threats
             12.1.2 EATON
                       12.1.2.1 Business overview
                       12.1.2.2 Products offered
                       12.1.2.3 Recent developments
                                   12.1.2.3.1 Developments
                       12.1.2.4 MnM view
                                   12.1.2.4.1 Key strengths/Right to win
                                   12.1.2.4.2 Strategic choices
                                   12.1.2.4.3 Weaknesses/Competitive threats
             12.1.3 GE VERNOVA
                       12.1.3.1 Business overview
                       12.1.3.2 Products offered
                       12.1.3.3 Recent developments
                                   12.1.3.3.1 Deals
                       12.1.3.4 MnM view
                                   12.1.3.4.1 Key strengths/Right to win
                                   12.1.3.4.2 Strategic choices
                                   12.1.3.4.3 Weaknesses/Competitive threats
             12.1.4 ABB
                       12.1.4.1 Business overview
                       12.1.4.2 Products offered
                       12.1.4.3 MnM view
                                   12.1.4.3.1 Key strengths/Right to win
                                   12.1.4.3.2 Strategic choices
                                   12.1.4.3.3 Weaknesses/Competitive threats
             12.1.5 HITACHI ENERGY LTD.
                       12.1.5.1 Business overview
                       12.1.5.2 Products offered
                       12.1.5.3 Recent developments
                                   12.1.5.3.1 Developments
                       12.1.5.4 MnM view
                                   12.1.5.4.1 Key strengths/Right to win
                                   12.1.5.4.2 Strategic choices
                                   12.1.5.4.3 Weaknesses/Competitive threats
             12.1.6 GENTEC
                       12.1.6.1 Business overview
                       12.1.6.2 Products offered
                       12.1.6.3 Recent developments
                                   12.1.6.3.1 Developments
             12.1.7 TCI, LLC
                       12.1.7.1 Business overview
                       12.1.7.2 Products offered
             12.1.8 POWERSIDE
                       12.1.8.1 Business overview
                       12.1.8.2 Products offered
             12.1.9 COS PHI
                       12.1.9.1 Business overview
                       12.1.9.2 Products offered
               12.1.10 CONTROLLIX CORPORATION
            12.1.10.1 Business overview
            12.1.10.2 Products offered
               12.1.11 CIRCUTOR
            12.1.11.1 Business overview
            12.1.11.2 Products offered
               12.1.12 NEPTUNE INDIA LIMITED
            12.1.12.1 Business overview
            12.1.12.2 Products offered
               12.1.13 ENERLUX POWER S.R.L
            12.1.13.1 Business overview
            12.1.13.2 Products offered
               12.1.14 LIFASA
            12.1.14.1 Business overview
            12.1.14.2 Products offered
            12.1.14.3 Recent developments
                     12.1.14.3.1 Developments
               12.1.15 DUCATI ENERGIA SPA
            12.1.15.1 Business overview
            12.1.15.2 Products offered
               12.1.16 ORTEA SPA
            12.1.16.1 Business overview
            12.1.16.2 Products offered
               12.1.17 RTR ENERGIA SRL
            12.1.17.1 Business overview
            12.1.17.2 Products offered
               12.1.18 POWERCAP CAPACITORS PVT. LTD.
            12.1.18.1 Business overview
            12.1.18.2 Products offered
               12.1.19 ZEZ SILKO, S.R.O.
            12.1.19.1 Business overview
            12.1.19.2 Products offered
               12.1.20 TREFFER
            12.1.20.1 Business overview
            12.1.20.2 Products offered
     12.2 OTHER PLAYERS 
             12.2.1 SHARDA ELECTRONICS & CO.
             12.2.2 YUHCHANG ELECTRIC CO., LTD.
             12.2.3 WHATOOP
             12.2.4 POWER FACTOR CORRECTION GROUP
             12.2.5 C. J. ENERGETICS
 
13 APPENDIX (Page No. - 230)
     13.1 INSIGHTS FROM INDUSTRY EXPERTS 
     13.2 DISCUSSION GUIDE 
     13.3 KNOWLEDGE STORE: MARKETSANDMARKETS’ SUBSCRIPTION PORTAL 
     13.4 CUSTOMIZATION OPTIONS 
     13.5 RELATED REPORTS 
     13.6 AUTHOR DETAILS 
 
LIST OF TABLES (248 Tables) 
 
TABLE 1 INCLUSIONS AND EXCLUSIONS: BY REACTIVE POWER
TABLE 2 INCLUSIONS AND EXCLUSIONS: BY TYPE
TABLE 3 INCLUSIONS AND EXCLUSIONS: BY SALES CHANNEL
TABLE 4 INCLUSIONS AND EXCLUSIONS: BY APPLICATION
TABLE 5 POWER FACTOR CORRECTION MARKET SNAPSHOT
TABLE 6 ROLE OF COMPANIES IN POWER FACTOR CORRECTION ECOSYSTEM
TABLE 7 WORLD GDP GROWTH PROJECTION, 2021–2028 (USD TRILLION)
TABLE 8 MANUFACTURING VALUE ADDED (% OF GDP), 2023
TABLE 9 ELECTRICITY PRODUCTION, BY COUNTRY, 2023 (TWH)
TABLE 10 POWER FACTOR CORRECTION MARKET: LIST OF MAJOR PATENTS, 2021–2024
TABLE 11 EXPORT SCENARIO FOR HS CODE 8532-COMPLIANT PRODUCTS, BY COUNTRY, 2021–2023 (USD THOUSAND)
TABLE 12 IMPORT SCENARIO FOR HS CODE 8532-COMPLIANT PRODUCTS, BY COUNTRY, 2021–2023 (USD THOUSAND)
TABLE 13 MARKET: LIST OF CONFERENCES AND EVENTS, 2024–2025
TABLE 14 INDICATIVE PRICING TREND OF CAPACITOR BANKS USED IN POWER FACTOR CORRECTION, BY REACTIVE POWER, 2021–2023 (USD PER UNIT)
TABLE 15 AVERAGE SELLING PRICE TREND OF POWER FACTOR CORRECTION SYSTEM, BY REGION, 2021–2023 (USD PER UNIT)
TABLE 16 IMPORT TARIFF FOR HS CODE 8532-COMPLIANT PRODUCTS, 2023
TABLE 17 NORTH AMERICA: LIST OF REGULATORY BODIES, GOVERNMENT AGENCIES, AND OTHER ORGANIZATIONS
TABLE 18 EUROPE: LIST OF REGULATORY BODIES, GOVERNMENT AGENCIES, AND OTHER ORGANIZATIONS
TABLE 19 ASIA PACIFIC: LIST OF REGULATORY BODIES, GOVERNMENT AGENCIES, AND OTHER ORGANIZATIONS
TABLE 20 SOUTH AMERICA: LIST OF REGULATORY BODIES, GOVERNMENT AGENCIES, AND OTHER ORGANIZATIONS
TABLE 21 MIDDLE EAST & AFRICA: LIST OF REGULATORY BODIES, GOVERNMENT AGENCIES, AND OTHER ORGANIZATIONS
TABLE 22 GLOBAL POWER FACTOR CORRECTION REGULATIONS
TABLE 23 NORTH AMERICAN POWER FACTOR CORRECTION REGULATIONS
TABLE 24 EUROPEAN POWER FACTOR CORRECTION REGULATIONS
TABLE 25 ASIA PACIFIC POWER FACTOR CORRECTION REGULATIONS
TABLE 26 MIDDLE EASTERN & AFRICAN POWER FACTOR CORRECTION REGULATIONS
TABLE 27 SOUTH AMERICAN POWER FACTOR CORRECTION REGULATIONS
TABLE 28 MARKET: IMPACT OF PORTER’S FIVE FORCES
TABLE 29 INFLUENCE OF KEY STAKEHOLDERS ON BUYING PROCESS FOR TOP 3 APPLICATIONS (%)
TABLE 30 KEY BUYING CRITERIA FOR TOP 3 APPLICATIONS
TABLE 31 MARKET, BY REACTIVE POWER, 2021–2023 (USD MILLION)
TABLE 32 MARKET, BY REACTIVE POWER, 2024–2030 (USD MILLION)
TABLE 33 0–200 KVAR: MARKET, BY REGION, 2021–2023 (USD MILLION)
TABLE 34 0–200 KVAR: MARKET, BY REGION, 2024–2030 (USD MILLION)
TABLE 35 200–500 KVAR: MARKET, BY REGION, 2021–2023 (USD MILLION)
TABLE 36 200–500 KVAR: MARKET, BY REGION, 2024–2030 (USD MILLION)
TABLE 37 500–1,500 KVAR: MARKET, BY REGION, 2021–2023 (USD MILLION)
TABLE 38 500–1,500 KVAR: MARKET, BY REGION, 2024–2030 (USD MILLION)
TABLE 39 ABOVE 1,500 KVAR: MARKET, BY REGION, 2021–2023 (USD MILLION)
TABLE 40 ABOVE 1,500 KVAR: MARKET, BY REGION, 2024–2030 (USD MILLION)
TABLE 41 MARKET, BY TYPE, 2021–2023 (USD MILLION)
TABLE 42 MARKET, BY TYPE, 2024–2030 (USD MILLION)
TABLE 43 AUTOMATIC: MARKET, BY REGION, 2021–2023 (USD MILLION)
TABLE 44 AUTOMATIC: MARKET, BY REGION, 2024–2030 (USD MILLION)
TABLE 45 FIXED: MARKET, BY REGION, 2021–2023 (USD MILLION)
TABLE 46 FIXED: MARKET, BY REGION, 2024–2030 (USD MILLION)
TABLE 47 MARKET, BY SALES CHANNEL, 2021–2023 (USD MILLION)
TABLE 48 MARKET, BY SALES CHANNEL, 2024–2030 (USD MILLION)
TABLE 49 DISTRIBUTORS: MARKET, BY REGION, 2021–2023 (USD MILLION)
TABLE 50 DISTRIBUTORS: MARKET, BY REGION, 2024–2030 (USD MILLION)
TABLE 51 OEM DIRECT: MARKET, BY REGION, 2021–2023 (USD MILLION)
TABLE 52 OEM DIRECT: MARKET, BY REGION, 2024–2030 (USD MILLION)
TABLE 53 MARKET, BY APPLICATION, 2021–2023 (USD MILLION)
TABLE 54 MARKET, BY APPLICATION, 2024–2030 (USD MILLION)
TABLE 55 INDUSTRIAL: MARKET, BY REGION, 2021–2023 (USD MILLION)
TABLE 56 INDUSTRIAL: MARKET, BY REGION, 2024–2030 (USD MILLION)
TABLE 57 INDUSTRIAL: MARKET, BY END USER, 2021–2023 (USD MILLION)
TABLE 58 INDUSTRIAL: MARKET, BY END USER, 2024–2030 (USD MILLION)
TABLE 59 RENEWABLE: MARKET, BY REGION, 2021–2023 (USD MILLION)
TABLE 60 RENEWABLE: MARKET, BY REGION, 2024–2030 (USD MILLION)
TABLE 61 RENEWABLE: MARKET, BY SOURCE, 2021–2023 (USD MILLION)
TABLE 62 RENEWABLE: MARKET, BY SOURCE, 2024–2030 (USD MILLION)
TABLE 63 COMMERCIAL: MARKET, BY REGION, 2021–2023 (USD MILLION)
TABLE 64 COMMERCIAL: MARKET, BY REGION, 2024–2030 (USD MILLION)
TABLE 65 DATA CENTER: MARKET, BY REGION, 2021–2023 (USD MILLION)
TABLE 66 DATA CENTER: MARKET, BY REGION, 2024–2030 (USD MILLION)
TABLE 67 EV CHARGING: MARKET, BY REGION, 2021–2023 (USD MILLION)
TABLE 68 EV CHARGING: MARKET, BY REGION, 2024–2030 (USD MILLION)
TABLE 69 MARKET, BY REGION, 2021–2023 (USD MILLION)
TABLE 70 MARKET, BY REGION, 2024–2030 (USD MILLION)
TABLE 71 MARKET, BY REGION, 2021–2023 (UNITS)
TABLE 72 MARKET, BY REGION, 2024–2030 (UNITS)
TABLE 73 NORTH AMERICA: MARKET, BY REACTIVE POWER, 2021–2023 (USD MILLION)
TABLE 74 NORTH AMERICA: MARKET, BY REACTIVE POWER, 2024–2030 (USD MILLION)
TABLE 75 NORTH AMERICA: MARKET, BY TYPE, 2021–2023 (USD MILLION)
TABLE 76 NORTH AMERICA: MARKET, BY TYPE, 2024–2030 (USD MILLION)
TABLE 77 NORTH AMERICA: MARKET, BY SALES CHANNEL, 2021–2023 (USD MILLION)
TABLE 78 NORTH AMERICA: MARKET, BY SALES CHANNEL, 2024–2030 (USD MILLION)
TABLE 79 NORTH AMERICA: MARKET, BY APPLICATION, 2021–2023 (USD MILLION)
TABLE 80 NORTH AMERICA: MARKET, BY APPLICATION, 2024–2030 (USD MILLION)
TABLE 81 NORTH AMERICA: MARKET FOR RENEWABLE APPLICATIONS, BY SOURCE, 2021–2023 (USD MILLION)
TABLE 82 NORTH AMERICA: MARKET FOR RENEWABLE APPLICATIONS, BY SOURCE, 2024–2030 (USD MILLION)
TABLE 83 NORTH AMERICA: MARKET FOR INDUSTRIAL APPLICATIONS, BY END USER, 2021–2023 (USD MILLION)
TABLE 84 NORTH AMERICA: MARKET FOR INDUSTRIAL APPLICATIONS, BY END USER, 2024–2030 (USD MILLION)
TABLE 85 NORTH AMERICA: MARKET, BY COUNTRY, 2021–2023 (USD MILLION)
TABLE 86 NORTH AMERICA: MARKET, BY COUNTRY, 2024–2030 (USD MILLION)
TABLE 87 US: MARKET, BY TYPE, 2021–2023 (USD MILLION)
TABLE 88 US: MARKET, BY TYPE, 2024–2030 (USD MILLION)
TABLE 89 CANADA: MARKET, BY TYPE, 2021–2023 (USD MILLION)
TABLE 90 CANADA: MARKET, BY TYPE, 2024–2030 (USD MILLION)
TABLE 91 MEXICO: MARKET, BY TYPE, 2021–2023 (USD MILLION)
TABLE 92 MEXICO: MARKET, BY TYPE, 2024–2030 (USD MILLION)
TABLE 93 ASIA PACIFIC: MARKET, BY REACTIVE POWER, 2021–2023 (USD MILLION)
TABLE 94 ASIA PACIFIC: MARKET, BY REACTIVE POWER, 2024–2030 (USD MILLION)
TABLE 95 ASIA PACIFIC: MARKET, BY TYPE, 2021–2023 (USD MILLION)
TABLE 96 ASIA PACIFIC: MARKET, BY TYPE, 2024–2030 (USD MILLION)
TABLE 97 ASIA PACIFIC: MARKET, BY SALES CHANNEL, 2021–2023 (USD MILLION)
TABLE 98 ASIA PACIFIC: MARKET, BY SALES CHANNEL, 2024–2030 (USD MILLION)
TABLE 99 ASIA PACIFIC: MARKET, BY APPLICATION, 2021–2023 (USD MILLION)
TABLE 100 ASIA PACIFIC: MARKET, BY APPLICATION, 2024–2030 (USD MILLION)
TABLE 101 ASIA PACIFIC: MARKET FOR RENEWABLE APPLICATIONS, BY SOURCE, 2021–2023 (USD MILLION)
TABLE 102 ASIA PACIFIC: MARKET FOR RENEWABLE APPLICATIONS, BY SOURCE, 2024–2030 (USD MILLION)
TABLE 103 ASIA PACIFIC: MARKET FOR INDUSTRIAL APPLICATIONS, BY END USER, 2021–2023 (USD MILLION)
TABLE 104 ASIA PACIFIC: MARKET FOR INDUSTRIAL APPLICATIONS, BY END USER, 2024–2030 (USD MILLION)
TABLE 105 ASIA PACIFIC: MARKET, BY COUNTRY, 2021–2023 (USD MILLION)
TABLE 106 ASIA PACIFIC: MARKET, BY COUNTRY, 2024–2030 (USD MILLION)
TABLE 107 CHINA: MARKET, BY TYPE, 2021–2023 (USD MILLION)
TABLE 108 CHINA: MARKET, BY TYPE, 2024–2030 (USD MILLION)
TABLE 109 JAPAN: MARKET, BY TYPE, 2021–2023 (USD MILLION)
TABLE 110 JAPAN: MARKET, BY TYPE, 2024–2030 (USD MILLION)
TABLE 111 SOUTH KOREA: MARKET, BY TYPE, 2021–2023 (USD MILLION)
TABLE 112 SOUTH KOREA: MARKET, BY TYPE, 2024–2030 (USD MILLION)
TABLE 113 INDIA: MARKET, BY TYPE, 2021–2023 (USD MILLION)
TABLE 114 INDIA: MARKET, BY TYPE, 2024–2030 (USD MILLION)
TABLE 115 AUSTRALIA: MARKET, BY TYPE, 2021–2023 (USD MILLION)
TABLE 116 AUSTRALIA: MARKET, BY TYPE, 2024–2030 (USD MILLION)
TABLE 117 REST OF ASIA PACIFIC: MARKET, BY TYPE, 2021–2023 (USD MILLION)
TABLE 118 REST OF ASIA PACIFIC: MARKET, BY TYPE, 2024–2030 (USD MILLION)
TABLE 119 EUROPE: MARKET, BY REACTIVE POWER, 2021–2023 (USD MILLION)
TABLE 120 EUROPE: MARKET, BY REACTIVE POWER, 2024–2030 (USD MILLION)
TABLE 121 EUROPE: MARKET, BY TYPE, 2021–2023 (USD MILLION)
TABLE 122 EUROPE: MARKET, BY TYPE, 2024–2030 (USD MILLION)
TABLE 123 EUROPE: MARKET, BY SALES CHANNEL, 2021–2023 (USD MILLION)
TABLE 124 EUROPE: MARKET, BY SALES CHANNEL, 2024–2030 (USD MILLION)
TABLE 125 EUROPE: MARKET, BY APPLICATION, 2021–2023 (USD MILLION)
TABLE 126 EUROPE: MARKET, BY APPLICATION, 2024–2030 (USD MILLION)
TABLE 127 EUROPE: MARKET FOR RENEWABLE APPLICATIONS, BY SOURCE, 2021–2023 (USD MILLION)
TABLE 128 EUROPE: MARKET FOR RENEWABLE APPLICATIONS, BY SOURCE, 2024–2030 (USD MILLION)
TABLE 129 EUROPE: MARKET FOR INDUSTRIAL APPLICATIONS, BY END USER, 2021–2023 (USD MILLION)
TABLE 130 EUROPE: MARKET FOR INDUSTRIAL APPLICATIONS, BY END USER, 2024–2030 (USD MILLION)
TABLE 131 EUROPE: MARKET, BY COUNTRY, 2021–2023 (USD MILLION)
TABLE 132 EUROPE: MARKET, BY COUNTRY, 2024–2030 (USD MILLION)
TABLE 133 GERMANY: MARKET, BY TYPE, 2021–2023 (USD MILLION)
TABLE 134 GERMANY: MARKET, BY TYPE, 2024–2030 (USD MILLION)
TABLE 135 UK: MARKET, BY TYPE, 2021–2023 (USD MILLION)
TABLE 136 UK: MARKET, BY TYPE, 2024–2030 (USD MILLION)
TABLE 137 FRANCE: MARKET, BY TYPE, 2021–2023 (USD MILLION)
TABLE 138 FRANCE: MARKET, BY TYPE, 2024–2030 (USD MILLION)
TABLE 139 ITALY: MARKET, BY TYPE, 2021–2023 (USD MILLION)
TABLE 140 ITALY: MARKET, BY TYPE, 2024–2030 (USD MILLION)
TABLE 141 RUSSIA: MARKET, BY TYPE, 2021–2023 (USD MILLION)
TABLE 142 RUSSIA: MARKET, BY TYPE, 2024–2030 (USD MILLION)
TABLE 143 REST OF EUROPE: MARKET, BY TYPE, 2021–2023 (USD MILLION)
TABLE 144 REST OF EUROPE: MARKET, BY TYPE, 2024–2030 (USD MILLION)
TABLE 145 MIDDLE EAST & AFRICA: MARKET, BY REACTIVE POWER, 2021–2023 (USD MILLION)
TABLE 146 MIDDLE EAST & AFRICA: MARKET, BY REACTIVE POWER, 2024–2030 (USD MILLION)
TABLE 147 MIDDLE EAST & AFRICA: MARKET, BY TYPE, 2021–2023 (USD MILLION)
TABLE 148 MIDDLE EAST & AFRICA: MARKET, BY TYPE, 2024–2030 (USD MILLION)
TABLE 149 MIDDLE EAST & AFRICA: MARKET, BY SALES CHANNEL, 2021–2023 (USD MILLION)
TABLE 150 MIDDLE EAST & AFRICA: MARKET, BY SALES CHANNEL, 2024–2030 (USD MILLION)
TABLE 151 MIDDLE EAST & AFRICA: MARKET, BY APPLICATION, 2021–2023 (USD MILLION)
TABLE 152 MIDDLE EAST & AFRICA: MARKET, BY APPLICATION, 2024–2030 (USD MILLION)
TABLE 153 MIDDLE EAST & AFRICA: MARKET FOR RENEWABLE APPLICATIONS, BY SOURCE, 2021–2023 (USD MILLION)
TABLE 154 MIDDLE EAST & AFRICA: MARKET FOR RENEWABLE APPLICATIONS, BY SOURCE, 2024–2030 (USD MILLION)
TABLE 155 MIDDLE EAST & AFRICA: MARKET FOR INDUSTRIAL APPLICATIONS, BY END USER, 2021–2023 (USD MILLION)
TABLE 156 MIDDLE EAST & AFRICA: MARKET FOR INDUSTRIAL APPLICATIONS, BY END USER, 2024–2030 (USD MILLION)
TABLE 157 MIDDLE EAST & AFRICA: MARKET, BY COUNTRY, 2021–2023 (USD MILLION)
TABLE 158 MIDDLE EAST & AFRICA: MARKET, BY COUNTRY, 2024–2030 (USD MILLION)
TABLE 159 GCC: MARKET, BY TYPE, 2021–2023 (USD MILLION)
TABLE 160 GCC: MARKET, BY TYPE, 2024–2030 (USD MILLION)
TABLE 161 GCC: MARKET, BY COUNTRY, 2021–2023 (USD MILLION)
TABLE 162 GCC: MARKET, BY COUNTRY, 2024–2030 (USD MILLION)
TABLE 163 SAUDI ARABIA: MARKET, BY TYPE, 2021–2023 (USD MILLION)
TABLE 164 SAUDI ARABIA: MARKET, BY TYPE, 2024–2030 (USD MILLION)
TABLE 165 UAE: MARKET, BY TYPE, 2021–2023 (USD MILLION)
TABLE 166 UAE: MARKET, BY TYPE, 2024–2030 (USD MILLION)
TABLE 167 REST OF GCC: MARKET, BY TYPE, 2021–2023 (USD MILLION)
TABLE 168 REST OF GCC: MARKET, BY TYPE, 2024–2030 (USD MILLION)
TABLE 169 SOUTH AFRICA: MARKET, BY TYPE, 2021–2023 (USD MILLION)
TABLE 170 SOUTH AFRICA: MARKET, BY TYPE, 2024–2030 (USD MILLION)
TABLE 171 REST OF MIDDLE EAST & AFRICA: MARKET, BY TYPE, 2021–2023 (USD MILLION)
TABLE 172 REST OF MIDDLE EAST & AFRICA: MARKET, BY TYPE, 2024–2030 (USD MILLION)
TABLE 173 SOUTH AMERICA: MARKET, BY REACTIVE POWER, 2021–2023 (USD MILLION)
TABLE 174 SOUTH AMERICA: MARKET, BY REACTIVE POWER, 2024–2030 (USD MILLION)
TABLE 175 SOUTH AMERICA: MARKET, BY TYPE, 2021–2023 (USD MILLION)
TABLE 176 SOUTH AMERICA: MARKET, BY TYPE, 2024–2030 (USD MILLION)
TABLE 177 SOUTH AMERICA: MARKET, BY SALES CHANNEL, 2021–2023 (USD MILLION)
TABLE 178 SOUTH AMERICA: MARKET, BY SALES CHANNEL, 2024–2030 (USD MILLION)
TABLE 179 SOUTH AMERICA: MARKET, BY APPLICATION, 2021–2023 (USD MILLION)
TABLE 180 SOUTH AMERICA: MARKET, BY APPLICATION, 2024–2030 (USD MILLION)
TABLE 181 SOUTH AMERICA: MARKET FOR RENEWABLE APPLICATIONS, BY SOURCE, 2021–2023 (USD MILLION)
TABLE 182 SOUTH AMERICA: MARKET FOR RENEWABLE APPLICATIONS, BY SOURCE, 2024–2030 (USD MILLION)
TABLE 183 SOUTH AMERICA: MARKET FOR INDUSTRIAL APPLICATIONS, BY END USER, 2021–2023 (USD MILLION)
TABLE 184 SOUTH AMERICA: MARKET FOR INDUSTRIAL APPLICATIONS, BY END USER, 2024–2030 (USD MILLION)
TABLE 185 SOUTH AMERICA: MARKET, BY COUNTRY, 2021–2023 (USD MILLION)
TABLE 186 SOUTH AMERICA: MARKET, BY COUNTRY, 2024–2030 (USD MILLION)
TABLE 187 BRAZIL: MARKET, BY TYPE, 2021–2023 (USD MILLION)
TABLE 188 BRAZIL: MARKET, BY TYPE, 2024–2030 (USD MILLION)
TABLE 189 ARGENTINA: MARKET, BY TYPE, 2021–2023 (USD MILLION)
TABLE 190 ARGENTINA: MARKET, BY TYPE, 2024–2030 (USD MILLION)
TABLE 191 REST OF SOUTH AMERICA: MARKET, BY TYPE, 2021–2023 (USD MILLION)
TABLE 192 REST OF SOUTH AMERICA: MARKET, BY TYPE, 2024–2030 (USD MILLION)
TABLE 193 MARKET: OVERVIEW OF KEY STRATEGIES ADOPTED BY MAJOR PLAYERS, JANUARY 2020–AUGUST 2024
TABLE 194 MARKET: DEGREE OF COMPETITION, 2023
TABLE 195 MARKET: REACTIVE POWER FOOTPRINT
TABLE 196 MARKET: APPLICATION FOOTPRINT
TABLE 197 MARKET: TYPE FOOTPRINT
TABLE 198 MARKET: REGION FOOTPRINT
TABLE 199 MARKET: LIST OF KEY STARTUPS/SMES
TABLE 200 MARKET: COMPETITIVE BENCHMARKING OF KEY STARTUPS/SMES
TABLE 201 MARKET: PRODUCT LAUNCHES, JANUARY 2020–AUGUST 2024
TABLE 202 MARKET: OTHER DEVELOPMENTS, JANUARY 2020–AUGUST 2024
TABLE 203 SCHNIEDER ELECTRIC: COMPANY OVERVIEW
TABLE 204 SCHNIEDER ELECTRIC: PRODUCTS OFFERED
TABLE 205 SCHNEIDER ELECTRIC: DEVELOPMENTS
TABLE 206 EATON: COMPANY OVERVIEW
TABLE 207 EATON: PRODUCTS OFFERED
TABLE 208 EATON: DEVELOPMENTS
TABLE 209 GE VERNOVA: COMPANY OVERVIEW
TABLE 210 GE VERNOVA: PRODUCTS OFFERED
TABLE 211 GE VERNOVA: DEALS
TABLE 212 ABB: COMPANY OVERVIEW
TABLE 213 ABB: PRODUCTS OFFERED
TABLE 214 HITACHI ENERGY LTD.: COMPANY OVERVIEW
TABLE 215 HITACHI ENERGY LTD.: PRODUCTS OFFERED
TABLE 216 HITACHI ENERGY: DEVELOPMENTS
TABLE 217 GENTEC: COMPANY OVERVIEW
TABLE 218 GENTEC: PRODUCTS OFFERED
TABLE 219 GENTEC: DEVELOPMENTS
TABLE 220 TCI, LLC: COMPANY OVERVIEW
TABLE 221 TCI, LLC: PRODUCTS OFFERED
TABLE 222 POWERSIDE: COMPANY OVERVIEW
TABLE 223 POWERSIDE: PRODUCTS OFFERED
TABLE 224 COS PHI: COMPANY OVERVIEW
TABLE 225 COS PHI: PRODUCTS OFFERED
TABLE 226 CONTROLLIX CORPORATION: COMPANY OVERVIEW
TABLE 227 CONTROLLIX CORPORATION: PRODUCTS OFFERED
TABLE 228 CIRCUTOR: COMPANY OVERVIEW
TABLE 229 CIRCUTOR: PRODUCTS OFFERED
TABLE 230 NEPTUNE INDIA LIMITED: COMPANY OVERVIEW
TABLE 231 NEPTUNE INDIA LIMITED: PRODUCTS OFFERED
TABLE 232 ENERLUX POWER S.R.L.: COMPANY OVERVIEW
TABLE 233 ENERLUX POWER S.R.L.: PRODUCTS OFFERED
TABLE 234 LIFASA: COMPANY OVERVIEW
TABLE 235 LIFASA: PRODUCTS OFFERED
TABLE 236 LIFASA: DEVELOPMENTS
TABLE 237 DUCATI ENERGIA SPA: COMPANY OVERVIEW
TABLE 238 DUCATI ENERGIA SPA: PRODUCTS OFFERED
TABLE 239 ORTEA SPA: COMPANY OVERVIEW
TABLE 240 ORTEA SPA: PRODUCTS OFFERED
TABLE 241 RTR ENERGIA SRL: COMPANY OVERVIEW
TABLE 242 RTR ENERGIA SRL: PRODUCTS OFFERED
TABLE 243 POWERCAP CAPACITORS PVT. LTD.: COMPANY OVERVIEW
TABLE 244 POWERCAP CAPACITORS PVT. LTD.: PRODUCTS OFFERED
TABLE 245 ZEZ SILKO, S.R.O.: COMPANY OVERVIEW
TABLE 246 ZEZ SILKO, S.R.O.: PRODUCTS OFFERED
TABLE 247 TREFFER: COMPANY OVERVIEW
TABLE 248 TREFFER: PRODUCTS OFFERED
 
  
LIST OF FIGURES (58 Figures) 
 
FIGURE 1 MARKET SEGMENTATION AND REGIONAL SCOPE
FIGURE 2 MARKET: RESEARCH DESIGN
FIGURE 3 DATA TRIANGULATION
FIGURE 4 MARKET: BOTTOM-UP APPROACH
FIGURE 5 MARKET: TOP-DOWN APPROACH
FIGURE 6 KEY STEPS CONSIDERED TO ASSESS SUPPLY OF POWER FACTOR CORRECTION SYSTEMS
FIGURE 7 MARKET: SUPPLY-SIDE ANALYSIS
FIGURE 8 ASIA PACIFIC DOMINATED MARKET IN 2023
FIGURE 9 DISTRIBUTORS SEGMENT TO ACCOUNT FOR LARGER MARKET SHARE IN 2024
FIGURE 10 AUTOMATIC SEGMENT TO CAPTURE LARGER MARKET SHARE IN 2030
FIGURE 11 INDUSTRIAL SEGMENT TO DOMINATE MARKET IN 2024
FIGURE 12 0–200 KVAR SEGMENT TO HOLD MAJORITY OF MARKET SHARE THROUGHOUT FORECAST PERIOD
FIGURE 13 INCREASING DEMAND FOR ENERGY EFFICIENCY ACROSS INDUSTRIAL SECTOR TO DRIVE MARKET
FIGURE 14 NORTH AMERICA TO EXHIBIT HIGHEST CAGR DURING FORECAST PERIOD
FIGURE 15 DISTRIBUTORS AND AUTOMATIC SEGMENTS HELD LARGEST MARKET SHARE IN 2023
FIGURE 16 DISTRIBUTORS SEGMENT TO CAPTURE LARGER MARKET SHARE IN 2030
FIGURE 17 AUTOMATIC SEGMENT TO DOMINATE MARKET IN 2030
FIGURE 18 0–200 KVAR SEGMENT TO HOLD LARGEST MARKET SHARE IN 2030
FIGURE 19 INDUSTRIAL SEGMENT TO LEAD MARKET IN 2030
FIGURE 20 MARKET: DRIVERS, RESTRAINTS, OPPORTUNITIES, AND CHALLENGES
FIGURE 21 GLOBAL ENERGY INVESTMENTS IN CLEAN ENERGY AND FOSSIL FUELS, 2015–2023
FIGURE 22 WORLDWIDE ANNUAL INVESTMENT IN ENERGY EFFICIENCY BY COMPANIES IN INDUSTRIAL SECTOR, 2015–2020
FIGURE 23 INVESTMENTS IN POWER GRID INFRASTRUCTURE DEVELOPMENT, 2015–2022
FIGURE 24 PUBLICLY AVAILABLE EV CHARGING POINTS IN US, FAST VS. SLOW, 2015–2023
FIGURE 25 TRENDS/DISRUPTIONS INFLUENCING CUSTOMER BUSINESS
FIGURE 26 MARKET: VALUE CHAIN ANALYSIS
FIGURE 27 MARKET: ECOSYSTEM ANALYSIS
FIGURE 28 FUNDING SCENARIO FOR TOP PLAYERS
FIGURE 29 IMPACT OF AI/GENERATIVE AI ON POWER FACTOR CORRECTION SUPPLY CHAIN
FIGURE 30 MARKET: PATENTS APPLIED AND GRANTED, 2014–2023
FIGURE 31 EXPORT DATA FOR HS CODE 8532-COMPLIANT PRODUCTS FOR TOP 5 COUNTRIES, 2019–2023
FIGURE 32 IMPORT DATA FOR HS CODE 8532-COMPLIANT PRODUCTS FOR TOP 5 COUNTRIES, 2019–2023
FIGURE 33 INDICATIVE PRICING TREND, BY REACTIVE POWER, 2021–2023
FIGURE 34 AVERAGE SELLING PRICE TREND OF POWER FACTOR CORRECTION SYSTEM, BY REGION, 2021–2023
FIGURE 35 MARKET: PORTER’S FIVE FORCES ANALYSIS
FIGURE 36 INFLUENCE OF KEY STAKEHOLDERS ON BUYING PROCESS FOR TOP 3 APPLICATIONS
FIGURE 37 INFLUENCE OF STAKEHOLDERS ON BUYING PROCESS FOR TOP 3 APPLICATIONS
FIGURE 38 MARKET SHARE, IN TERMS OF VALUE, BY REACTIVE POWER, 2023
FIGURE 39 MARKET SHARE, IN TERMS OF VALUE, BY TYPE, 2023
FIGURE 40 MARKET SHARE, IN TERMS OF VALUE, BY SALES CHANNEL, 2023
FIGURE 41 MARKET SHARE, IN TERMS OF VALUE, BY APPLICATION, 2023
FIGURE 42 MARKET IN NORTH AMERICA TO GROW AT FASTEST RATE DURING FORECAST PERIOD
FIGURE 43 MARKET, BY REGION, 2023
FIGURE 44 NORTH AMERICA: MARKET SNAPSHOT
FIGURE 45 ASIA PACIFIC: MARKET SNAPSHOT
FIGURE 46 MARKET SHARE ANALYSIS, 2023
FIGURE 47 MARKET: REVENUE ANALYSIS OF THREE KEY PLAYERS, 2019–2023
FIGURE 48 BRAND COMPARISON
FIGURE 49 COMPANY VALUATION
FIGURE 50 FINANCIAL METRICS
FIGURE 51 MARKET: COMPANY EVALUATION MATRIX (KEY PLAYERS), 2023
FIGURE 52 MARKET: COMPANY FOOTPRINT
FIGURE 53 MARKET: COMPANY EVALUATION MATRIX (STARTUPS/SMES), 2023
FIGURE 54 SCHNIEDER ELECTRIC: COMPANY SNAPSHOT
FIGURE 55 EATON: COMPANY SNAPSHOT
FIGURE 56 GE VERNOVA: COMPANY SNAPSHOT
FIGURE 57 ABB: COMPANY SNAPSHOT
FIGURE 58 HITACHI ENERGY LTD.: COMPANY SNAPSHOT

The study involved major activities in estimating the current size of the power factor correction market. Exhaustive secondary research was done to collect information on the peer and parent markets. The next step was to validate these findings, assumptions, and sizing with industry experts across the value chain through primary research. Both top-down and bottom-up approaches were employed to estimate the complete market size. Thereafter, market breakdown and data triangulation were used to estimate the market size of the segments and subsegments.

Secondary Research

This research study on the power factor correction market involved the use of extensive secondary sources, directories, and databases, such as Hoovers, Bloomberg, Businessweek, Factiva, International Energy Agency, and United States Energy Association, to identify and collect information useful for a technical, market-oriented, and commercial study of the global power factor correction market. The secondary sources referred to for this research study included annual reports, press releases, investor presentations of companies, white papers, certified publications, articles from recognized authors, and various companies and association databases. Secondary research was conducted to obtain key information about the industry’s supply chain, the market’s monetary chain, the total pool of key players, market classification and segmentation according to industry trends to the bottom-most level, country-level markets, and key developments from the market- and technology-oriented perspectives.

Primary Research

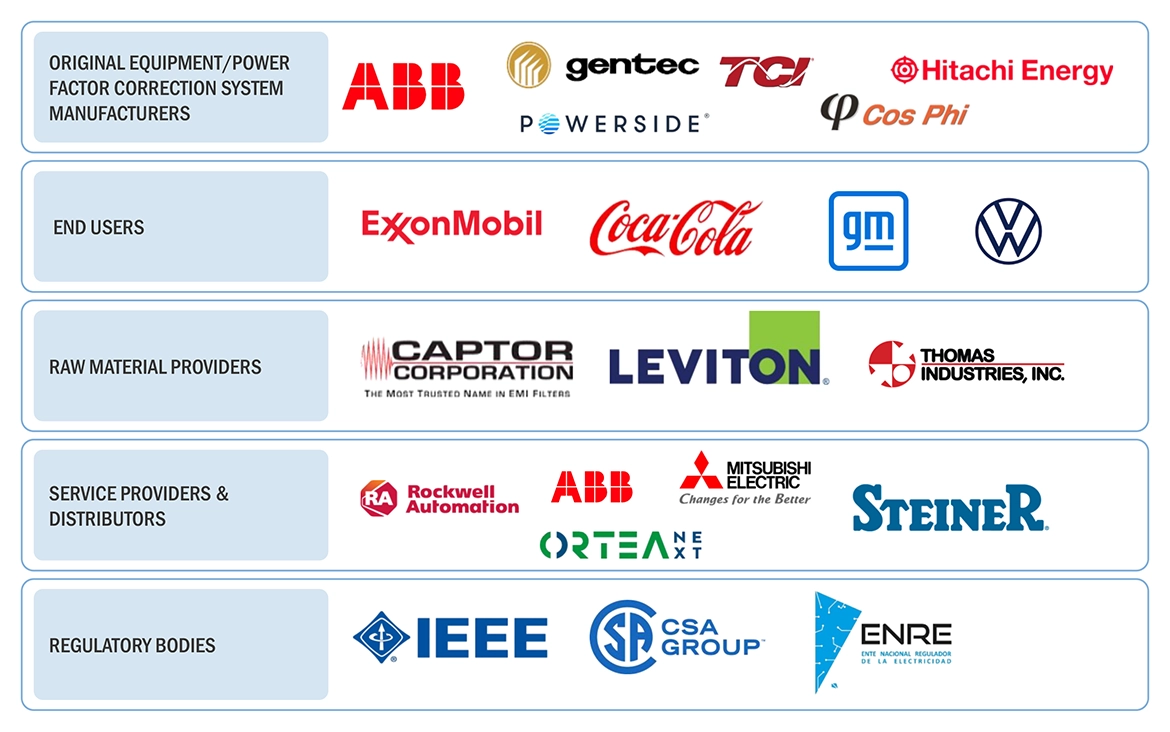
The power factor correction market comprises several stakeholders such as power factor correction manufacturers, suppliers and distributors of power factor correction in the supply chain. The demand side of this market is characterized by the adoption of power factor correction across various end use industries. The supply side is characterized by products offered by various power factor correction manufacturers and mergers & acquisitions among big players. Various primary sources from both the supply and demand sides of the market were interviewed to obtain qualitative and quantitative information.

Following is the breakdown of primary respondents: 

Power Factor Correction Market  Size, and Share

To know about the assumptions considered for the study, download the pdf brochure

Market Size Estimation

Both top-down and bottom-up approaches were used to estimate and validate the total size of the power factor correction market. These methods were also used extensively to estimate the size of various subsegments in the market. The research methodology used to estimate the market size includes the following:

  • The key players in the industry and market have been identified through extensive secondary research, and their market share in the respective regions has been determined through both secondary and primary research.
  • The industry’s supply chain and market size, in terms of value, have been determined through primary and secondary research processes.
  • All percentage shares, splits, and breakdowns have been determined using secondary sources and verified through primaries.

Global Power factor correction Market Size: Top-down Approach

Power Factor Correction Market Top Down Approach

To know about the assumptions considered for the study, Request for Free Sample Report

Global Power factor correction Market Size: Bottom-Up Approach

Power Factor Correction Market  Bottom Up Approach

Data Triangulation

After arriving at the overall market size from the estimation process explained above, the total market has been split into several segments and subsegments. The complete market engineering process is done to arrive at the exact statistics for all the segments and subsegments, also data triangulation and market breakdown processes have been employed, wherever applicable. The data has been triangulated by examining various factors and trends from both the demand- and supply sides. Along with this, the market has been validated through both the top-down and bottom-up approaches.

Market Definition

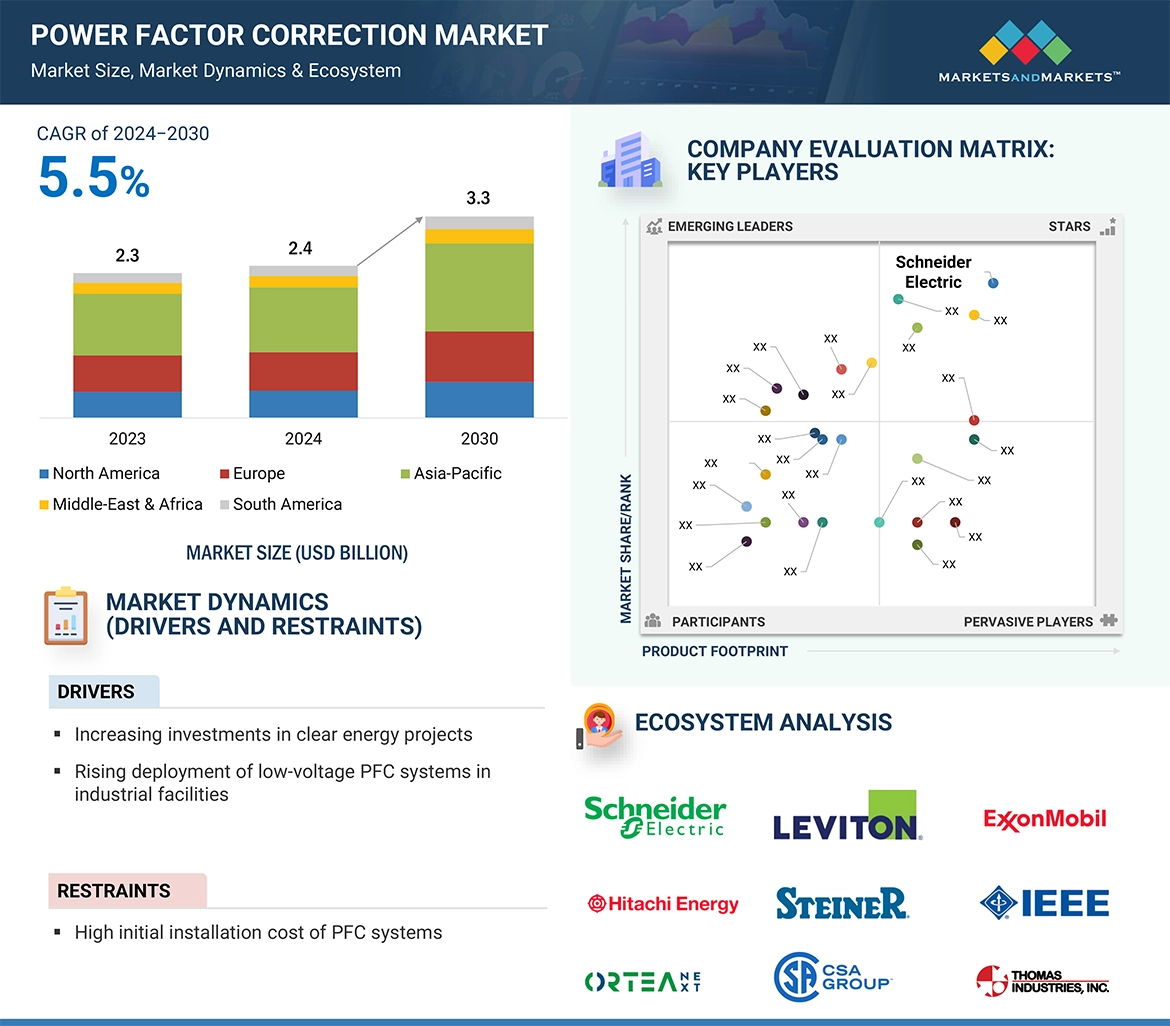
The power factor correction refers to the utilization of capacitor banks that are designed to improve the efficiency of an electrical power system by compensating for the lagging power factor caused by inductive loads such as motors, transformers, and other inductive devices. Capacitor banks are strategically installed to supply reactive power (KVARs) to the system, which reduces the amount of reactive power that needs to be supplied by the utility, thereby improving the power factor.

Key Stakeholders

  • Suppliers of raw materials
  • Technology investors
  • Manufacturers of wide variety of power factor correction systems
  • Integrator and service provider of power factor correction systems
  • Component providers
  • System integrators
  • Consulting service providers
  • Distributors, resellers, and traders
  • Organizations, forums, alliances, and associations
  • State and national regulatory authorities
  • Venture capital firms
  • Financial organizations
  • Healthcare organizations
  • Research Institutes and organizations
  • Energy associations
  • Environment associations
  • Energy efficiency consultants
  • State and national regulatory authorities

Objectives of the Study

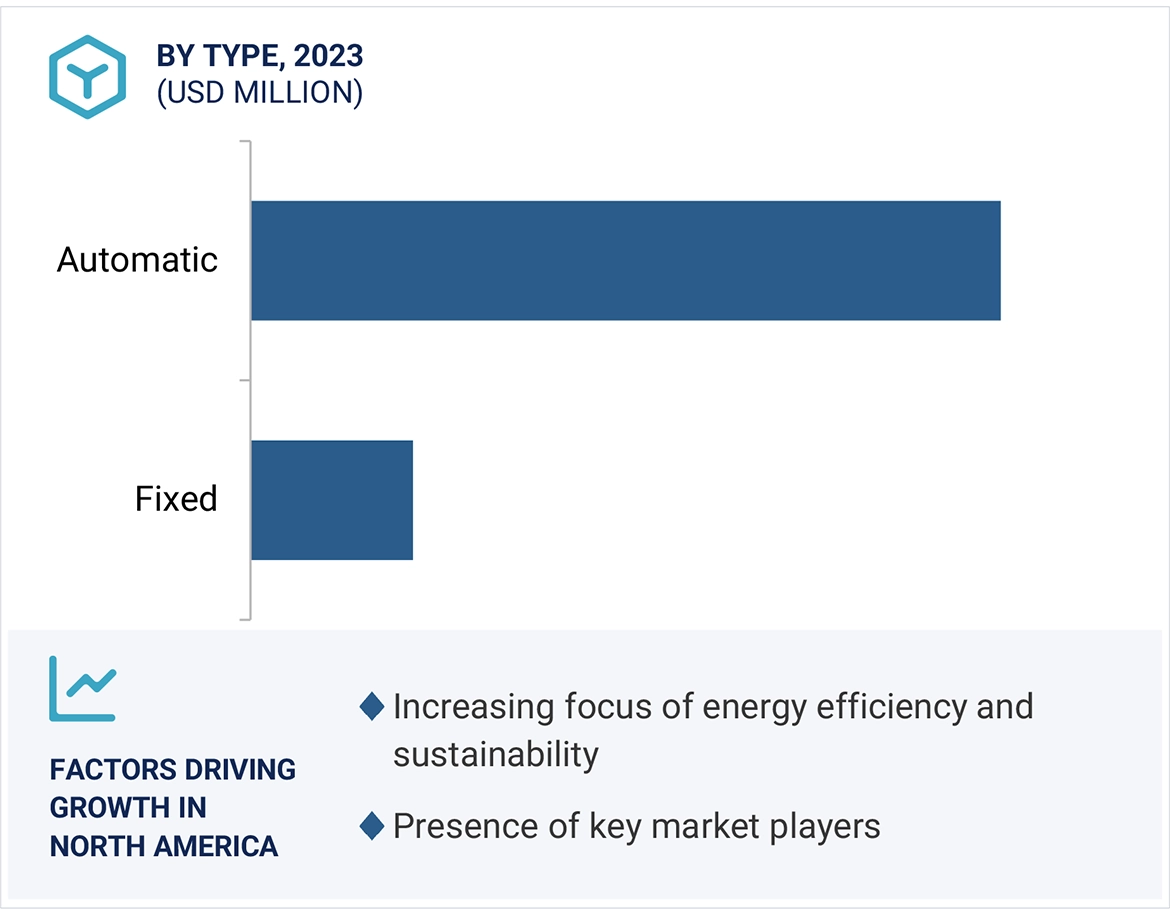
  • To describe and forecast the power factor correction market in terms of value and volume based on reactive power, type, sales channel, application, and region
  • To provide detailed information about the key factors such as drivers, restraints, opportunities, and challenges influencing the growth of the power factor correction market
  • To strategically analyze the subsegments with respect to individual growth trends, prospects, and contributions of each segment to the overall market size
  • To forecast the market size for five key regions: North America, Europe, Asia Pacific, Middle East & Africa, and South America, along with their key countries
  • To strategically analyze micromarkets1 with respect to individual growth trends, prospects, and contributions to the total market
  • To study the complete supply chain and allied industry segments and perform a supply chain analysis of the power factor correction market’ landscape
  • To study market trends, patent analysis, trade analysis, tariff and regulatory landscape, Porter’s five forces analysis, ecosystem mapping, technologies, investment and funding scenario, key stakeholders & buying criteria, case studies pertaining to off power factor correction market
  • To analyze the opportunities for various stakeholders by identifying the high-growth segments of the power factor correction market
  • To profile the key players and comprehensively analyze their market positions in terms of ranking and core competencies2, along with detailing the competitive landscape for the market leaders
  • To analyze competitive developments, such as contracts, collaborations, expansions, product launches, investments, and acquisitions, in the power factor correction market

Available Customizations:

With the given market data, MarketsandMarkets offers customizations as per the client’s specific needs. The following customization options are available for this report:

Geographic Analysis

  • Further breakdown of region or country-specific analysis

Company Information

  • Detailed analyses and profiling of additional market players (up to 5)
Custom Market Research Services

We will customize the research for you, in case the report listed above does not meet with your exact requirements. Our custom research will comprehensively cover the business information you require to help you arrive at strategic and profitable business decisions.

Request Customization
Report Code
EP 9162
Published ON
Sep, 2024
Choose License Type
BUY NOW
  • SHARE
X
Request Customization
Speak to Analyst
Speak to Analyst
OR FACE-TO-FACE MEETING
PERSONALIZE THIS RESEARCH
  • Triangulate with your Own Data
  • Get Data as per your Format and Definition
  • Gain a Deeper Dive on a Specific Application, Geography, Customer or Competitor
  • Any level of Personalization
REQUEST A FREE CUSTOMIZATION
LET US HELP YOU!
  • What are the Known and Unknown Adjacencies Impacting the Power Factor Correction Market
  • What will your New Revenue Sources be?
  • Who will be your Top Customer; what will make them switch?
  • Defend your Market Share or Win Competitors
  • Get a Scorecard for Target Partners
CUSTOMIZED WORKSHOP REQUEST
  • Call Us
  • +1-888-600-6441 (Corporate office hours)
  • +1-888-600-6441 (US/Can toll free)
  • +44-800-368-9399 (UK office hours)
CONNECT WITH US
ABOUT TRUST ONLINE
©2024 MarketsandMarkets Research Private Ltd. All rights reserved
DMCA.com Protection Status Website Feedback