Polyethyleneimine Market

Report Code CH 9001
Published in Apr, 2024, By MarketsandMarkets™
Download PDF

Choose License Type

Buy Report Now Inquire Before Buying

Polyethyleneimine Market by Type (Branched, Linear), Application (Detergents, Adhesives and Sealants, Water Treatment Chemicals, Cosmetics, Paper, Coatings, Inks, and Dyes), and Region - Global Forecast to 2029

Overview

The polyethyleneimine market is valued at USD 479 million in 2024 and is projected to reach USD 497 million by 2029, growing at 0.8% cagr from 2024 to 2029. Adhesives & Sealants and Detergent, by application segment in the Asia Pacific region is expecting a boom in the forecasted period and will lead to an increase in the demand for polyethyleneimine. As a highly effective polymer, polyethyleneimine finds extensive use in sectors such as adhesives, sealants, coatings, biomedical, and detergent formulations. Its ability to form strong bonds, enhance product performance, and provide solutions to diverse industrial challenges fuels its demand globally. Additionally, increasing research and development activities focused on exploring new applications and improving product characteristics further propel the growth of the polyethyleneimine market.

Attractive Opportunities in the Polyethyleneimine Market

ASIA PACIFIC

Market growth in Asia Pacific can be attributed to growing Adhesive and Sealant Market.

Growing demand for detergent and bio medical is driving the global polyethyleneimine market.

Mergers & acquisitions and investments & expansions are the key strategies adopted by companies operating in this market.

The adhesives and sealants, and detergents applications presents the two biggest opportunity for growth of the market.

The global polyethyleneimine market is projected to grow at a CAGR of 0.8% in terms of value, during the forecast period.

Global Polyethyleneimine Market Dynamics

DRIVERS: Application growth in adhesives and sealants

Polyethyleneimine plays a crucial role in enhancing adherence and serving as a coating or lamination material, particularly in water-based primers for metals, fabrics, and packaging films. This versatility aligns with the evolving needs of industries such as construction, automotive, and packaging, where demand for high-performance adhesives and sealants is steadily increasing. In adhesive formulations, Polyethyleneimine's cationic properties facilitate strong bonding between surfaces, ensuring improved adhesion and durability. This is particularly crucial in sectors like construction and automotive, where robust bonding is essential for structural integrity and performance. In the construction sector, Polyethyleneimine's ability to improve bonding strength and durability makes it indispensable for applications such as bonding building materials and sealing joints. Similarly, in the automotive industry, Polyethyleneimine is utilized in adhesive formulations for assembling vehicle components, contributing to enhanced vehicle performance and safety. Furthermore, in the packaging industry, Polyethyleneimine's use in extrusion coatings ensures the integrity and protection of packaged goods. The rising demand for Polyethyleneimine across these industries underscores its pivotal role in driving market growth, as industries continue to prioritize efficiency, durability, and performance in their adhesive and sealant applications.

RESTRAINTS: Raw material price instability

Instability in the availability and pricing of raw materials used in Polyethyleneimine production can disrupt the supply chain and significantly impact production costs for manufacturers. Fluctuations in raw material prices, driven by factors such as geopolitical tensions, or changes in supply and demand dynamics, directly affect the profitability of Polyethyleneimine manufacturers. Moreover, supply chain disruptions, whether due to logistical challenges or unexpected events, can lead to delays in production and distribution, further exacerbating market challenges. As a result, Polyethyleneimine manufacturers may face difficulty in maintaining competitive pricing and meeting customer demand, ultimately hindering market growth.The unpredictability in raw material availability and pricing creates a challenging environment for Polyethyleneimine manufacturers, making it difficult to forecast production costs accurately and maintain competitive pricing strategies. Sudden spikes in raw material prices can squeeze profit margins, impacting the overall financial health of companies operating in the Polyethyleneimine market. Additionally, supply chain disruptions, such as transportation delays or inventory shortages, can hinder the timely delivery of Polyethyleneimine products to customers, leading to potential dissatisfaction and loss of market share.


OPPORTUNITIES: Expanding polyethyleneimine application in shale inhibition

The utilization of graphene grafted with polyethyleneimine in water-based drilling fluids offers a myriad of benefits including enhanced shale inhibition properties, improved stability against water, advanced rheological features, and reduced fluid loss during drilling operations. By synergizing the unique attributes of graphene with the efficacy of polyethyleneimine, this technology effectively addresses key challenges encountered in unconventional gas drilling such as shale hydration, swelling, and borehole instability. Moreover, the adoption of polyethyleneimine-grafted graphene contributes to environmental sustainability by diminishing the reliance on oil-based drilling fluids. With the escalating demand for high-performance water-based drilling fluids, driven by the industry's shift towards eco-friendly practices, the integration of graphene-polyethyleneimine composites presents a promising growth opportunity for the polyethyleneimine market. This advanced solution not only enhances drilling efficiency but also resonates with the industry's increasing emphasis on pioneering innovative and environmentally conscious technologies for unconventional gas exploration and production.

CHALLENGES: Stringent regulatory policies

Environmental regulations pertaining to polymer usage and disposal have a significant impact on the polyethyleneimine market, as compliance with these regulations is essential for market players to ensure sustainable operations and maintain a positive reputation in the industry. These regulations often impose strict limits on the release of pollutants into the environment, including emissions during polyethyleneimine production processes and disposal of polyethyleneimine-containing products at the end of their lifecycle.One of the key challenges faced by polyethyleneimine manufacturers is the need to invest in advanced pollution control technologies and waste management systems to meet regulatory requirements. This often entails significant upfront costs and ongoing operational expenses, which can impact profit margins and competitiveness in the market. Additionally, regulatory compliance may require changes to manufacturing processes or formulations to reduce environmental impact, which can further add complexity and cost to operations.Moreover, the complexity and variability of environmental regulations across different regions and jurisdictions present a challenge for global polyethyleneimine manufacturers operating in multiple markets. Ensuring compliance with diverse regulatory frameworks requires comprehensive understanding and monitoring of local regulations, as well as proactive engagement with regulatory authorities to address any compliance issues.Furthermore, the growing public awareness and scrutiny of environmental issues place additional pressure on polyethyleneimine manufacturers to demonstrate their commitment to sustainability and environmental stewardship. Failure to meet regulatory requirements or address environmental concerns effectively can result in reputational damage and loss of market share.

Global Polyethyleneimine Market Ecosystem Analysis

Prominent companies in this market include well established, financially stable manufacturers of polyethyleneimine. These companies have been operating in the market for several years and possess a diversified product portfolio and strong global sales and marketing networks. Prominent companies in the market include Nippon Shokubai Co. Ltd (Japan), BASF SE (Germany), FUJIFILM Wako Pure Chemical Corporation (Japan), and Shanghai Holdenchem Co. (China).


“Branched type account the largest share of polyethyleneimine market in terms of value.”

Branched polyethyleneimine molecules have a higher number of amine groups, leading to increased reactivity compared to linear polyethyleneimine. This increased reactivity makes branched polyethyleneimine particularly effective as a crosslinking agent, adhesive, and flocculant in industries such as paper manufacturing, water treatment, and coatings. Additionally, branched polyethyleneimine exhibits better solubility in aqueous solutions, making it easier to handle and formulate in various industrial processes. Its wide-ranging applications and superior performance characteristics contribute to its dominance in the polyethyleneimine market.

“Paper is projected to be the second fastest growing application segment of polyethyleneimine market .”

Polyethyleneimine's cationic nature enables it to act as an effective retention aid and drainage aid in papermaking processes, improving paper quality and production efficiency. Additionally, its high molecular weight and charge density contribute to enhanced paper strength, retention of fines, and reduction of filler usage, resulting in cost savings for paper manufacturers. Furthermore, the increasing demand for eco-friendly and sustainable paper products drives the adoption of polyethyleneimine-based solutions as they offer alternatives to traditional chemicals with lower environmental impact. As paper industries continue to prioritize efficiency, quality, and sustainability, the demand for polyethyleneimine in paper applications is expected to grow significantly, further fueling its rapid expansion in this segment.

ASIA PACIFIC region holds the largest share of the Polyethyleneimine Market.

The country's expanding industrial sector, particularly in segments such as textiles, paper manufacturing, and water treatment, necessitates the use of polyethyleneimine for various applications. With rapid urbanization and infrastructure development projects underway, there is a growing demand for polyethyleneimine-based construction materials, coatings, and adhesives to meet the needs of modern urban living. Additionally, India's increasing emphasis on environmental sustainability and water conservation has led to a surge in the adoption of polyethyleneimine for water treatment applications, addressing the challenges of pollution and water scarcity.


Recent Developments of Polyethyleneimine Market industry

  • In January 2018, Nippon Shokubai Co., Ltd. expanded its production capacity for functional monomer “VEEA”, and functional polymers “EPOCROS” and “EPOMIN” to meet the strong growth in global demand. “EPOMIN” is a water-soluble polymer (Polyethyleneimine) with the highest cationic charge density among existing materials. “EPOMIN” has excellent reactivity and adhesiveness, and its demand is increasing for water treatment and pigment dispersion.
 

Key Market Players

Want to explore hidden markets that can drive new revenue in Polyethyleneimine Market?

Scope of the Report

Report Attribute Details
Market size available for years 2022-2029
Base year considered 2023
Forecast Period 2024-2029
Forecast Units Value (USD million/billion)
Segments Covered By Type, By Application, By Region
Geographies Covered Asia Pacific, Europe, North America, Middle East & Africa and South America
Companies covered Nippon Shokubai Co. Ltd  (Japan), BASF SE (Germany), FUJIFILM Wako Pure Chemical Corporation (Japan), and Shanghai Holdenchem Co. (China) A total of 25 players are covered.


Key Questions Addressed by the Report

What are the growth driving factors of polyethyleneimine market?
The growth driving factor for the polyethyleneimine market is the application growth in adhesives and sealants.
What are the major types of polyethyleneimine?
The major types of polyethyleneimine are Linear and Branched.
What are the major applications of polyethyleneimine?
The major applications of polyethyleneimine include detergents, adhesives & sealants, water treatment chemicals, cosmetics, paper, coatings, inks, and dyes.
Who are the major manufacturers?
Major manufacturers in the polyethyleneimine market include Nippon Shokubai Co. Ltd (Japan), BASF SE (Germany), FUJIFILM Wako Pure Chemical Corporation (Japan), and Shanghai Holdenchem Co. (China).
Which is the largest region in the polyethyleneimine market?
Asia Pacific is the largest region in the polyethyleneimine market.


Personalize This Research

  • Triangulate with your Own Data
  • Get Data as per your Format and Definition
  • Gain a Deeper Dive on a Specific Application, Geography, Customer or Competitor
  • Any level of Personalization
Request A Free Customisation

Let Us Help You

  • What are the Known and Unknown Adjacencies Impacting the Polyethyleneimine Market
  • What will your New Revenue Sources be?
  • Who will be your Top Customer; what will make them switch?
  • Defend your Market Share or Win Competitors
  • Get a Scorecard for Target Partners
Customized Workshop Request

Table of Contents

Exclusive indicates content/data unique to MarketsandMarkets and not available with any competitors.

TITLE
PAGE NO
INTRODUCTION
24
RESEARCH METHODOLOGY
29
EXECUTIVE SUMMARY
41
PREMIUM INSIGHTS
45
MARKET OVERVIEW
48
  • 5.1 INTRODUCTION
  • 5.2 MARKET DYNAMICS
    DRIVERS
    - Rising demand for adhesives and sealants
    - Increasing demand for water treatment chemicals and detergents
    RESTRAINTS
    - Raw material price instability
    OPPORTUNITIES
    - Utilization in biomedical and biotechnology applications
    - Expanding polyethyleneimine applications in shale inhibition
    CHALLENGES
    - Stringent regulatory policies
  • 5.3 PORTER'S FIVE FORCES ANALYSIS
    INTENSITY OF COMPETITIVE RIVALRY
    BARGAINING POWER OF BUYERS
    BARGAINING POWER OF SUPPLIERS
    THREAT OF SUBSTITUTES
    THREAT OF NEW ENTRANTS
  • 5.4 MACROECONOMIC INDICATORS
    INTRODUCTION
    GDP TRENDS AND FORECAST
    TRENDS IN GLOBAL BEAUTY MARKET
    TRENDS AND FORECAST OF GLOBAL CONSTRUCTION INDUSTRY
INDUSTRY TRENDS
58
  • 6.1 SUPPLY CHAIN ANALYSIS
  • 6.2 ECOSYSTEM ANALYSIS/MARKET MAP
  • 6.3 TRENDS AND DISRUPTIONS IMPACTING CUSTOMER BUSINESS
  • 6.4 KEY STAKEHOLDERS & BUYING CRITERIA
    KEY STAKEHOLDERS IN BUYING PROCESS
    BUYING CRITERIA
  • 6.5 PRICING ANALYSIS
  • 6.6 TRADE ANALYSIS
    EXPORT SCENARIO OF ETHYLENE
    IMPORT SCENARIO OF ETHYLENE
  • 6.7 GLOBAL ECONOMIC SCENARIO AFFECTING MARKET GROWTH
    RUSSIA-UKRAINE WAR
    CHINA
    - Decreasing investments lowering growth trajectory
    - Environmental commitments
    EUROPE
    - Political and economic instability in Germany
    - Energy crisis in Europe
  • 6.8 REGULATORY LANDSCAPE
    REGULATORY BODIES, GOVERNMENT AGENCIES, AND OTHER ORGANIZATIONS
  • 6.9 PATENT ANALYSIS
    LIST OF MAJOR PATENTS
  • 6.10 CASE STUDY ANALYSIS
  • 6.11 TECHNOLOGY ANALYSIS
    KEY TECHNOLOGIES
    - Adsorbent modification technologies
    - Water treatment technology
    COMPLEMENTARY TECHNOLOGIES
    - Smart materials
    ADJACENT TECHNOLOGIES
    - Biotechnology
  • 6.12 KEY CONFERENCES AND EVENTS, 2024
  • 6.13 INVESTMENT AND FUNDING SCENARIO
POLYETHYLENEIMINE MARKET, BY TYPE
81
  • 7.1 INTRODUCTION
  • 7.2 LINEAR
    EFFICIENT GENE DELIVERY FOR ENHANCED CELLULAR UPTAKE AND EXPRESSION TO DRIVE MARKET
  • 7.3 BRANCHED
    EFFICACY AS CROSSLINKING AGENT, ADHESIVE, AND FLOCCULANT TO DRIVE MARKET
POLYETHYLENEIMINE MARKET, BY APPLICATION
87
  • 8.1 INTRODUCTION
  • 8.2 DETERGENTS
    EFFECTIVE SOIL DISPERSION, PREVENTION FROM RE-DEPOSITING ONTO CLEANED SURFACES TO DRIVE MARKET
  • 8.3 ADHESIVES & SEALANTS
    EXCELLENT ADHESION TO VARIOUS SUBSTRATES TO DRIVE MARKET
  • 8.4 WATER TREATMENT CHEMICALS
    URGENT DEMAND FOR CLEAN DRINKING WATER DURING NATURAL DISASTERS TO DRIVE MARKET
  • 8.5 COSMETICS
    TAILORED FORMULATIONS OPTIMIZING PERFORMANCE AND EFFICACY OF COSMETIC PRODUCTS TO DRIVE MARKET
  • 8.6 PAPER
    RETENTION OF FIBERS AND ENHANCEMENT OF FORMATION AND UNIFORMITY OF PAPER TO DRIVE MARKET
  • 8.7 COATINGS, INKS & DYES
    ADHESION, CORROSION RESISTANCE, AND IMPROVED DURABILITY ON COATED SURFACES TO DRIVE MARKET
  • 8.8 OTHER APPLICATIONS
POLYETHYLENEIMINE MARKET, BY REGION
104
  • 9.1 INTRODUCTION
  • 9.2 NORTH AMERICA
    IMPACT OF RECESSION
    US
    - Technological advancements and development of eco-friendly applications to drive market
    CANADA
    - Investments in sustainable practices and technologies to propel market
    MEXICO
    - Integrating digital technologies, diversifying supply chains, and energy efficiency and resource management to drive market
  • 9.3 EUROPE
    IMPACT OF RECESSION
    GERMANY
    - Development and implementation of innovative processes and products to boost market
    UK
    - Government initiatives in chemical industry to drive demand
    FRANCE
    - Strong global cosmetics market to drive demand
    ITALY
    - Significant exports of active pharmaceutical ingredients and bio-based chemicals to drive market
    REST OF EUROPE
  • 9.4 ASIA PACIFIC
    IMPACT OF RECESSION
    CHINA
    - Strong manufacturing capabilities spanning entire value chain to drive market
    INDIA
    - Surging demand for petrochemicals and specialty chemicals to drive market
    JAPAN
    - Government subsidies aimed at green and digital investments to drive market
    SOUTH KOREA
    - Soaring domestic production and international demand to drive market
    REST OF ASIA PACIFIC
  • 9.5 MIDDLE EAST & AFRICA
    IMPACT OF RECESSION
    GCC COUNTRIES
    - Saudi Arabia
    - UAE
    - Rest of GCC countries
    REST OF MIDDLE EAST & AFRICA
  • 9.6 SOUTH AMERICA
    IMPACT OF RECESSION
    BRAZIL
    - Growth of chemical industry to drive market
    ARGENTINA
    - Opportunities for foreign businesses to invest to drive market
    REST OF SOUTH AMERICA
COMPETITIVE LANDSCAPE
165
  • 10.1 INTRODUCTION
  • 10.2 KEY PLAYER STRATEGIES
    OVERVIEW OF STRATEGIES ADOPTED BY KEY PLAYERS
  • 10.3 MARKET SHARE ANALYSIS
  • 10.4 MARKET RANKING ANALYSIS
  • 10.5 REVENUE ANALYSIS OF TOP FOUR PLAYERS
  • 10.6 COMPANY VALUATION AND FINANCIAL METRICS, 2023
    COMPANY VALUATION
    FINANCIAL METRICS
  • 10.7 BRAND/PRODUCT COMPARATIVE ANALYSIS
  • 10.8 COMPANY EVALUATION MATRIX: KEY PLAYERS, 2023
    STARS
    EMERGING LEADERS
    PERVASIVE PLAYERS
    PARTICIPANTS
    COMPANY FOOTPRINT: KEY PLAYERS, 2023
  • 10.9 COMPANY EVALUATION MATRIX: STARTUPS/SMES, 2023
    PROGRESSIVE COMPANIES
    RESPONSIVE COMPANIES
    DYNAMIC COMPANIES
    STARTING BLOCKS
    COMPETITIVE BENCHMARKING
    - Competitive benchmarking of key startups/SMEs
  • 10.10 COMPETITIVE SCENARIO AND TRENDS
    EXPANSIONS
COMPANY PROFILES
184
  • 11.1 MAJOR PLAYERS
    BASF SE
    - Business overview
    - Products/Services/Solutions offered
    - MnM view
    NIPPON SHOKUBAI CO., LTD.
    - Business overview
    - Products/Services/Solutions offered
    - Recent developments
    - MnM view
    DOW INC.
    - Business overview
    - Products/Services/Solutions offered
    - MnM view
    FUJIFILM WAKO PURE CHEMICAL CORPORATION
    - Business overview
    - Products/Services/Solutions offered
    - MnM view
    POLYSCIENCES, INC.
    - Business overview
    - Products/Services/Solutions offered
    - MnM view
    SERVA ELECTROPHORESIS GMBH
    - Business overview
    - Products/Services/Solutions offered
    SHANGHAI HOLDENCHEM CO., LTD.
    - Business overview
    - Products/Services/Solutions offered
    WUHAN BRIGHT CHEMICAL CO., LTD.
    - Business overview
    - Products/Services/Solutions offered
    THERMO FISHER SCIENTIFIC INC.
    - Business overview
    - Products/Services/Solutions offered
    TOKYO CHEMICAL INDUSTRY CO., LTD.
    - Business overview
    - Products/Services/Solutions offered
  • 11.2 OTHER PLAYERS
    HAIHANG INDUSTRY
    - Products/Services/Solutions offered
    SPECTRUM CHEMICAL
    - Products/Services/Solutions offered
    MOLEKULA GROUP
    - Products/Services/Solutions offered
    NANJING CHEMICAL MATERIAL CORP.
    - Products/Services/Solutions offered
    ACTYLIS
    - Products/Services/Solutions offered
    FENGCHEN GROUP CO., LTD.
    - Products/Services/Solutions offered
    UNILONG INDUSTRY CO., LTD.
    - Products/Services/Solutions offered
    HANGZHOU KEYING CHEM CO., LTD.
    - Products/Services/Solutions offered
    BOC SCIENCES
    - Products/Services/Solutions offered
    ALFA CHEMISTRY
    - Products/Services/Solutions offered
    MAHAVIR EXPOCHEM LTD.
    - Products/Services/Solutions offered
    SANTA CRUZ BIOTECHNOLOGY
    - Products/Services/Solutions offered
    NANJING DULY BIOTECHNOLOGY CO., LTD.
    - Products/Services/Solutions offered
    HENAN TIANFU CHEMICAL CO., LTD.
    - Products/Services/Solutions offered
    WUHAN QIANGLONG NEW CHEMICAL MATERIALS CO., LTD.
    - Products/Services/Solutions offered
ADJACENT & RELATED MARKETS
218
  • 12.1 LIMITATIONS
  • 12.2 ETHYLENEAMINES MARKET
    MARKET DEFINITION
  • 12.3 MARKET OVERVIEW
  • 12.4 ETHYLENEAMINES MARKET, BY TYPE
    ETHYLENEDIAMINE
    DIETHYLENETRIAMINE
    TRIETHYLENETETRAMINE
    OTHER TYPES
  • 12.5 ETHYLENEAMINES MARKET, BY APPLICATION
    CHELATING AGENTS
    CORROSION INHIBITORS
    LUBE OIL & FUEL ADDITIVES
    PROCESSING AIDS/ADDITIVES
    TEXTILE ADDITIVES
    CURING AGENTS
    OTHER APPLICATIONS
  • 12.6 ETHYLENEAMINES MARKET, BY END USE
    RESIN
    PAPER
    ADHESIVE
    AUTOMOTIVE
    WATER TREATMENT
    AGRO CHEMICALS
    PHARMACEUTICALS
    PERSONAL CARE
    TEXTILE CHEMICALS
    OTHER END USES
  • 12.7 ETHYLENEAMINES MARKET, BY REGION
    ASIA PACIFIC
    NORTH AMERICA
    EUROPE
    SOUTH AMERICA
    MIDDLE EAST & AFRICA
APPENDIX
233
  • 13.1 DISCUSSION GUIDE
  • 13.2 KNOWLEDGESTORE: MARKETSANDMARKETS’ SUBSCRIPTION PORTAL
  • 13.3 CUSTOMIZATION OPTIONS
  • 13.4 RELATED REPORTS
  • 13.5 AUTHOR DETAILS
LIST OF TABLES
 
  • TABLE 1 POLYETHYLENEIMINE MARKET: RISK ASSESSMENT
  • TABLE 2 POLYETHYLENEIMINE MARKET SNAPSHOT, 2024 VS. 2029
  • TABLE 3 POLYETHYLENEIMINE MARKET: PORTER’S FIVE FORCES ANALYSIS
  • TABLE 4 GDP PERCENTAGE (%) CHANGE, KEY COUNTRY, 2020–2028
  • TABLE 5 POLYETHYLENEIMINE MARKET: ROLE IN ECOSYSTEM
  • TABLE 6 INFLUENCE OF STAKEHOLDERS ON BUYING PROCESS FOR TOP THREE APPLICATIONS/END USERS (%)
  • TABLE 7 AVERAGE SELLING PRICE OF KEY PLAYERS, BY TOP 3 APPLICATIONS (USD/KG)
  • TABLE 8 COUNTRY-WISE EXPORT DATA, 2019–2023 (USD THOUSAND)
  • TABLE 9 COUNTRY-WISE IMPORT DATA, 2019–2023 (USD THOUSAND)
  • TABLE 10 NORTH AMERICA: LIST OF REGULATORY BODIES, GOVERNMENT AGENCIES, AND OTHER ORGANIZATIONS
  • TABLE 11 EUROPE: REGULATORY BODIES, GOVERNMENT AGENCIES, AND OTHER ORGANIZATIONS
  • TABLE 12 ASIA PACIFIC: REGULATORY BODIES, GOVERNMENT AGENCIES, AND OTHER ORGANIZATIONS
  • TABLE 13 POLYETHYLENEIMINE MARKET: KEY CONFERENCES AND EVENTS, 2024
  • TABLE 14 INVESTMENT AND FUNDING SCENARIO
  • TABLE 15 POLYETHYLENEIMINE MARKET, BY TYPE, 2022–2023 (USD MILLION)
  • TABLE 16 POLYETHYLENEIMINE MARKET, BY TYPE, 2024–2029 (USD MILLION)
  • TABLE 17 POLYETHYLENEIMINE MARKET, BY TYPE, 2022–2023 (KILOTON)
  • TABLE 18 POLYETHYLENEIMINE MARKET, BY TYPE, 2024–2029 (KILOTON)
  • TABLE 19 LINEAR: POLYETHYLENEIMINE MARKET, BY REGION, 2022–2023 (USD MILLION)
  • TABLE 20 LINEAR: POLYETHYLENEIMINE MARKET, BY REGION, 2024–2029 (USD MILLION)
  • TABLE 21 LINEAR: POLYETHYLENEIMINE MARKET, BY REGION, 2022–2023 (KILOTON)
  • TABLE 22 LINEAR: POLYETHYLENEIMINE MARKET, BY REGION, 2024–2029 (KILOTON)
  • TABLE 23 BRANCHED: POLYETHYLENEIMINE MARKET, BY REGION, 2022–2023 (USD MILLION)
  • TABLE 24 BRANCHED: POLYETHYLENEIMINE MARKET, BY REGION, 2024–2029 (USD MILLION)
  • TABLE 25 BRANCHED: POLYETHYLENEIMINE MARKET, BY REGION, 2022–2023 (KILOTON)
  • TABLE 26 BRANCHED: POLYETHYLENEIMINE MARKET, BY REGION, 2024–2029 (KILOTON)
  • TABLE 27 POLYETHYLENEIMINE MARKET, BY APPLICATION, 2022–2023 (USD MILLION)
  • TABLE 28 POLYETHYLENEIMINE MARKET, BY APPLICATION, 2024–2029 (USD MILLION)
  • TABLE 29 POLYETHYLENEIMINE MARKET, BY APPLICATION, 2022–2023 (KILOTON)
  • TABLE 30 POLYETHYLENEIMINE MARKET, BY APPLICATION, 2024–2029 (KILOTON)
  • TABLE 31 DETERGENTS: POLYETHYLENEIMINE MARKET, BY REGION, 2022–2023 (USD MILLION)
  • TABLE 32 DETERGENTS: POLYETHYLENEIMINE MARKET, BY REGION, 2024–2029 (USD MILLION)
  • TABLE 33 DETERGENTS: POLYETHYLENEIMINE MARKET, BY REGION, 2022–2023 (KILOTON)
  • TABLE 34 DETERGENTS: POLYETHYLENEIMINE MARKET, BY REGION, 2024–2029 (KILOTON)
  • TABLE 35 ADHESIVES & SEALANTS: POLYETHYLENEIMINE MARKET, BY REGION, 2022–2023 (USD MILLION)
  • TABLE 36 ADHESIVES & SEALANTS: POLYETHYLENEIMINE MARKET, BY REGION, 2024–2029 (USD MILLION)
  • TABLE 37 ADHESIVES & SEALANTS: POLYETHYLENEIMINE MARKET, BY REGION, 2022–2023 (KILOTON)
  • TABLE 38 ADHESIVES & SEALANTS: POLYETHYLENEIMINE MARKET, BY REGION, 2024–2029 (KILOTON)
  • TABLE 39 WATER TREATMENT CHEMICALS: POLYETHYLENEIMINE MARKET, BY REGION, 2022–2023 (USD MILLION)
  • TABLE 40 WATER TREATMENT CHEMICALS: POLYETHYLENEIMINE MARKET, BY REGION, 2024–2029 (USD MILLION)
  • TABLE 41 WATER TREATMENT CHEMICALS: POLYETHYLENEIMINE MARKET, BY REGION, 2022–2023 (KILOTON)
  • TABLE 42 WATER TREATMENT CHEMICALS: POLYETHYLENEIMINE MARKET, BY REGION, 2024–2029 (KILOTON)
  • TABLE 43 COSMETICS: POLYETHYLENEIMINE MARKET, BY REGION, 2022–2023 (USD MILLION)
  • TABLE 44 COSMETICS: POLYETHYLENEIMINE MARKET, BY REGION, 2024–2029 (USD MILLION)
  • TABLE 45 COSMETICS: POLYETHYLENEIMINE MARKET, BY REGION, 2022–2023 (KILOTON)
  • TABLE 46 COSMETICS: POLYETHYLENEIMINE MARKET, BY REGION, 2024–2029 (KILOTON)
  • TABLE 47 PAPER: POLYETHYLENEIMINE MARKET, BY REGION, 2022–2023 (USD MILLION)
  • TABLE 48 PAPER: POLYETHYLENEIMINE MARKET, BY REGION, 2024–2029 (USD MILLION)
  • TABLE 49 PAPER: POLYETHYLENEIMINE MARKET, BY REGION, 2022–2023 (KILOTON)
  • TABLE 50 PAPER: POLYETHYLENEIMINE MARKET, BY REGION, 2024–2029 (KILOTON)
  • TABLE 51 COATINGS, INKS & DYES: POLYETHYLENEIMINE MARKET, BY REGION, 2022–2023 (USD MILLION)
  • TABLE 52 COATINGS, INKS & DYES: POLYETHYLENEIMINE MARKET, BY REGION, 2024–2029 (USD MILLION)
  • TABLE 53 COATINGS, INKS & DYES: POLYETHYLENEIMINE MARKET, BY REGION, 2022–2023 (KILOTON)
  • TABLE 54 COATINGS, INKS & DYES: POLYETHYLENEIMINE MARKET, BY REGION, 2024–2029 (KILOTON)
  • TABLE 55 OTHER APPLICATIONS: POLYETHYLENEIMINE MARKET, BY REGION, 2022–2023 (USD MILLION)
  • TABLE 56 OTHER APPLICATIONS: POLYETHYLENEIMINE MARKET, BY REGION, 2024–2029 (USD MILLION)
  • TABLE 57 OTHER APPLICATIONS: POLYETHYLENEIMINE MARKET, BY REGION, 2022–2023 (KILOTON)
  • TABLE 58 OTHER APPLICATIONS: POLYETHYLENEIMINE MARKET, BY REGION, 2024–2029 (KILOTON)
  • TABLE 59 POLYETHYLENEIMINE MARKET, BY REGION, 2022–2023 (USD MILLION)
  • TABLE 60 POLYETHYLENEIMINE MARKET, BY REGION, 2024–2029 (USD MILLION)
  • TABLE 61 POLYETHYLENEIMINE MARKET, BY REGION, 2022–2023 (KILOTON)
  • TABLE 62 POLYETHYLENEIMINE MARKET, BY REGION, 2024–2029 (KILOTON)
  • TABLE 63 NORTH AMERICA: POLYETHYLENEIMINE MARKET, BY COUNTRY, 2022–2023 (USD MILLION)
  • TABLE 64 NORTH AMERICA: POLYETHYLENEIMINE MARKET, BY COUNTRY, 2024–2029 (USD MILLION)
  • TABLE 65 NORTH AMERICA: POLYETHYLENEIMINE MARKET, BY COUNTRY, 2022–2023 (KILOTON)
  • TABLE 66 NORTH AMERICA: POLYETHYLENEIMINE MARKET, BY COUNTRY, 2024–2029 (KILOTON)
  • TABLE 67 NORTH AMERICA: POLYETHYLENEIMINE MARKET, BY TYPE, 2022–2023 (USD MILLION)
  • TABLE 68 NORTH AMERICA: POLYETHYLENEIMINE MARKET, BY TYPE, 2024–2029 (USD MILLION)
  • TABLE 69 NORTH AMERICA: POLYETHYLENEIMINE MARKET, BY TYPE, 2022–2023 (KILOTON)
  • TABLE 70 NORTH AMERICA: POLYETHYLENEIMINE MARKET, BY TYPE, 2024–2029 (KILOTON)
  • TABLE 71 NORTH AMERICA: POLYETHYLENEIMINE MARKET, BY APPLICATION, 2022–2023 (USD MILLION)
  • TABLE 72 NORTH AMERICA: POLYETHYLENEIMINE MARKET, BY APPLICATION, 2024–2029 (USD MILLION)
  • TABLE 73 NORTH AMERICA: POLYETHYLENEIMINE MARKET, BY APPLICATION, 2022–2023 (KILOTON)
  • TABLE 74 NORTH AMERICA: POLYETHYLENEIMINE MARKET, BY APPLICATION, 2024–2029 (KILOTON)
  • TABLE 75 US: POLYETHYLENEIMINE MARKET, BY TYPE, 2022–2023 (USD MILLION)
  • TABLE 76 US: POLYETHYLENEIMINE MARKET, BY TYPE, 2024–2029 (USD MILLION)
  • TABLE 77 US: POLYETHYLENEIMINE MARKET, BY TYPE, 2022–2023 (KILOTON)
  • TABLE 78 US: POLYETHYLENEIMINE MARKET, BY TYPE, 2024–2029 (KILOTON)
  • TABLE 79 CANADA: POLYETHYLENEIMINE MARKET, BY TYPE, 2022–2023 (USD MILLION)
  • TABLE 80 CANADA: POLYETHYLENEIMINE MARKET, BY TYPE, 2024–2029 (USD MILLION)
  • TABLE 81 CANADA: POLYETHYLENEIMINE MARKET, BY TYPE, 2022–2023 (KILOTON)
  • TABLE 82 CANADA: POLYETHYLENEIMINE MARKET, BY TYPE, 2024–2029 (KILOTON)
  • TABLE 83 MEXICO: POLYETHYLENEIMINE MARKET, BY TYPE, 2022–2023 (USD MILLION)
  • TABLE 84 MEXICO: POLYETHYLENEIMINE MARKET, BY TYPE, 2024–2029 (USD MILLION)
  • TABLE 85 MEXICO: POLYETHYLENEIMINE MARKET, BY TYPE, 2022–2023 (KILOTON)
  • TABLE 86 MEXICO: POLYETHYLENEIMINE MARKET, BY TYPE, 2024–2029 (KILOTON)
  • TABLE 87 EUROPE: POLYETHYLENEIMINE MARKET, BY COUNTRY, 2022–2023 (USD MILLION)
  • TABLE 88 EUROPE: POLYETHYLENEIMINE MARKET, BY COUNTRY, 2024–2029 (USD MILLION)
  • TABLE 89 EUROPE: POLYETHYLENEIMINE MARKET, BY COUNTRY, 2022–2023 (KILOTON)
  • TABLE 90 EUROPE: POLYETHYLENEIMINE MARKET, BY COUNTRY, 2024–2029 (KILOTON)
  • TABLE 91 EUROPE: POLYETHYLENEIMINE MARKET, BY TYPE, 2022–2023 (USD MILLION)
  • TABLE 92 EUROPE: POLYETHYLENEIMINE MARKET, BY TYPE, 2024–2029 (USD MILLION)
  • TABLE 93 EUROPE: POLYETHYLENEIMINE MARKET, BY TYPE, 2022–2023 (KILOTON)
  • TABLE 94 EUROPE: POLYETHYLENEIMINE MARKET, BY TYPE, 2024–2029 (KILOTON)
  • TABLE 95 EUROPE: POLYETHYLENEIMINE MARKET, BY APPLICATION, 2022–2023 (USD MILLION)
  • TABLE 96 EUROPE: POLYETHYLENEIMINE MARKET, BY APPLICATION, 2024–2029 (USD MILLION)
  • TABLE 97 EUROPE: POLYETHYLENEIMINE MARKET, BY APPLICATION, 2022–2023 (KILOTON)
  • TABLE 98 EUROPE: POLYETHYLENEIMINE MARKET, BY APPLICATION, 2024–2029 (KILOTON)
  • TABLE 99 GERMANY: POLYETHYLENEIMINE MARKET, BY TYPE, 2022–2023 (USD MILLION)
  • TABLE 100 GERMANY: POLYETHYLENEIMINE MARKET, BY TYPE, 2024–2029 (USD MILLION)
  • TABLE 101 GERMANY: POLYETHYLENEIMINE MARKET, BY TYPE, 2022–2023 (KILOTON)
  • TABLE 102 GERMANY: POLYETHYLENEIMINE MARKET, BY TYPE, 2024–2029 (KILOTON)
  • TABLE 103 UK: POLYETHYLENEIMINE MARKET, BY TYPE, 2022–2023 (USD MILLION)
  • TABLE 104 UK: POLYETHYLENEIMINE MARKET, BY TYPE, 2024–2029 (USD MILLION)
  • TABLE 105 UK: POLYETHYLENEIMINE MARKET, BY TYPE, 2022–2023 (KILOTON)
  • TABLE 106 UK: POLYETHYLENEIMINE MARKET, BY TYPE, 2024–2029 (KILOTON)
  • TABLE 107 FRANCE: POLYETHYLENEIMINE MARKET, BY TYPE, 2022–2023 (USD MILLION)
  • TABLE 108 FRANCE: POLYETHYLENEIMINE MARKET, BY TYPE, 2024–2029 (USD MILLION)
  • TABLE 109 FRANCE: POLYETHYLENEIMINE MARKET, BY TYPE, 2022–2023 (KILOTON)
  • TABLE 110 FRANCE: POLYETHYLENEIMINE MARKET, BY TYPE, 2024–2029 (KILOTON)
  • TABLE 111 ITALY: POLYETHYLENEIMINE MARKET, BY TYPE, 2022–2023 (USD MILLION)
  • TABLE 112 ITALY: POLYETHYLENEIMINE MARKET, BY TYPE, 2024–2029 (USD MILLION)
  • TABLE 113 ITALY: POLYETHYLENEIMINE MARKET, BY TYPE, 2022–2023 (KILOTON)
  • TABLE 114 ITALY: POLYETHYLENEIMINE MARKET, BY TYPE, 2024–2029 (KILOTON)
  • TABLE 115 REST OF EUROPE: POLYETHYLENEIMINE MARKET, BY TYPE, 2022–2023 (USD MILLION)
  • TABLE 116 REST OF EUROPE: POLYETHYLENEIMINE MARKET, BY TYPE, 2024–2029 (USD MILLION)
  • TABLE 117 REST OF EUROPE: POLYETHYLENEIMINE MARKET, BY TYPE, 2022–2023 (KILOTON)
  • TABLE 118 REST OF EUROPE: POLYETHYLENEIMINE MARKET, BY TYPE, 2024–2029 (KILOTON)
  • TABLE 119 ASIA PACIFIC: POLYETHYLENEIMINE MARKET, BY COUNTRY, 2022–2023 (USD MILLION)
  • TABLE 120 ASIA PACIFIC: POLYETHYLENEIMINE MARKET, BY COUNTRY, 2024–2029 (USD MILLION)
  • TABLE 121 ASIA PACIFIC: POLYETHYLENEIMINE MARKET, BY COUNTRY, 2022–2023 (KILOTON)
  • TABLE 122 ASIA PACIFIC: POLYETHYLENEIMINE MARKET, BY COUNTRY, 2024–2029 (KILOTON)
  • TABLE 123 ASIA PACIFIC: POLYETHYLENEIMINE MARKET, BY TYPE, 2022–2023 (USD MILLION)
  • TABLE 124 ASIA PACIFIC: POLYETHYLENEIMINE MARKET, BY TYPE, 2024–2029 (USD MILLION)
  • TABLE 125 ASIA PACIFIC: POLYETHYLENEIMINE MARKET, BY TYPE, 2022–2023 (KILOTON)
  • TABLE 126 ASIA PACIFIC: POLYETHYLENEIMINE MARKET, BY TYPE, 2024–2029 (KILOTON)
  • TABLE 127 ASIA PACIFIC: POLYETHYLENEIMINE MARKET, BY APPLICATION, 2022–2023 (USD MILLION)
  • TABLE 128 ASIA PACIFIC: POLYETHYLENEIMINE MARKET, BY APPLICATION, 2024–2029 (USD MILLION)
  • TABLE 129 ASIA PACIFIC: POLYETHYLENEIMINE MARKET, BY APPLICATION, 2022–2023 (KILOTON)
  • TABLE 130 ASIA PACIFIC: POLYETHYLENEIMINE MARKET, BY APPLICATION, 2024–2029 (KILOTON)
  • TABLE 131 CHINA: POLYETHYLENEIMINE MARKET, BY TYPE, 2022–2023 (USD MILLION)
  • TABLE 132 CHINA: POLYETHYLENEIMINE MARKET, BY TYPE, 2024–2029 (USD MILLION)
  • TABLE 133 CHINA: POLYETHYLENEIMINE MARKET, BY TYPE, 2022–2023 (KILOTON)
  • TABLE 134 CHINA: POLYETHYLENEIMINE MARKET BY TYPE, 2024–2029 (KILOTON)
  • TABLE 135 INDIA: POLYETHYLENEIMINE MARKET, BY TYPE, 2022–2023 (USD MILLION)
  • TABLE 136 INDIA: POLYETHYLENEIMINE MARKET, BY TYPE, 2024–2029 (USD MILLION)
  • TABLE 137 INDIA: POLYETHYLENEIMINE MARKET, BY TYPE, 2022–2023 (KILOTON)
  • TABLE 138 INDIA: POLYETHYLENEIMINE MARKET, BY TYPE, 2024–2029 (KILOTON)
  • TABLE 139 JAPAN: POLYETHYLENEIMINE MARKET, BY TYPE, 2022–2023 (USD MILLION)
  • TABLE 140 JAPAN: POLYETHYLENEIMINE MARKET, BY TYPE, 2024–2029 (USD MILLION)
  • TABLE 141 JAPAN: POLYETHYLENEIMINE MARKET, BY TYPE, 2022–2023 (KILOTON)
  • TABLE 142 JAPAN: POLYETHYLENEIMINE MARKET, BY TYPE, 2024–2029 (KILOTON)
  • TABLE 143 SOUTH KOREA: POLYETHYLENEIMINE MARKET, BY TYPE, 2022–2023 (USD MILLION)
  • TABLE 144 SOUTH KOREA: POLYETHYLENEIMINE MARKET, BY TYPE, 2024–2029 (USD MILLION)
  • TABLE 145 SOUTH KOREA: POLYETHYLENEIMINE MARKET, BY TYPE, 2022–2023 (KILOTON)
  • TABLE 146 SOUTH KOREA: POLYETHYLENEIMINE MARKET, BY TYPE, 2024–2029 (KILOTON)
  • TABLE 147 REST OF ASIA PACIFIC: POLYETHYLENEIMINE MARKET, BY TYPE, 2022–2023 (USD MILLION)
  • TABLE 148 REST OF ASIA PACIFIC: POLYETHYLENEIMINE MARKET, BY TYPE, 2024–2029 (USD MILLION)
  • TABLE 149 REST OF ASIA PACIFIC: POLYETHYLENEIMINE MARKET, BY TYPE, 2022–2023 (KILOTON)
  • TABLE 150 REST OF ASIA PACIFIC: POLYETHYLENEIMINE MARKET, BY TYPE, 2024–2029 (KILOTON)
  • TABLE 151 MIDDLE EAST & AFRICA: POLYETHYLENEIMINE MARKET, BY COUNTRY, 2022–2023 (USD MILLION)
  • TABLE 152 MIDDLE EAST & AFRICA: POLYETHYLENEIMINE MARKET, BY COUNTRY, 2024–2029 (USD MILLION)
  • TABLE 153 MIDDLE EAST & AFRICA: POLYETHYLENEIMINE MARKET, BY COUNTRY, 2022–2023 (KILOTON)
  • TABLE 154 MIDDLE EAST & AFRICA: POLYETHYLENEIMINE MARKET, BY COUNTRY, 2024–2029 (KILOTON)
  • TABLE 155 MIDDLE EAST & AFRICA: POLYETHYLENEIMINE MARKET, BY TYPE, 2022–2023 (USD MILLION)
  • TABLE 156 MIDDLE EAST & AFRICA: POLYETHYLENEIMINE MARKET, BY TYPE, 2024–2029 (USD MILLION)
  • TABLE 157 MIDDLE EAST & AFRICA: POLYETHYLENEIMINE MARKET, BY TYPE, 2022–2023 (KILOTON)
  • TABLE 158 MIDDLE EAST & AFRICA: POLYETHYLENEIMINE MARKET, BY TYPE, 2024–2029 (KILOTON)
  • TABLE 159 MIDDLE EAST & AFRICA: POLYETHYLENEIMINE MARKET, BY APPLICATION, 2022–2023 (USD MILLION)
  • TABLE 160 MIDDLE EAST & AFRICA: POLYETHYLENEIMINE MARKET, BY APPLICATION, 2024–2029 (USD MILLION)
  • TABLE 161 MIDDLE EAST & AFRICA: POLYETHYLENEIMINE MARKET, BY APPLICATION, 2022–2023 (KILOTON)
  • TABLE 162 MIDDLE EAST & AFRICA: POLYETHYLENEIMINE MARKET, BY APPLICATION, 2024–2029 (KILOTON)
  • TABLE 163 GCC COUNTRIES: POLYETHYLENEIMINE MARKET, BY TYPE, 2022–2023 (USD MILLION)
  • TABLE 164 GCC COUNTRIES: POLYETHYLENEIMINE MARKET, BY TYPE, 2024–2029 (USD MILLION)
  • TABLE 165 GCC COUNTRIES: POLYETHYLENEIMINE MARKET, BY TYPE, 2022–2023 (KILOTON)
  • TABLE 166 GCC COUNTRIES: POLYETHYLENEIMINE MARKET, BY TYPE, 2024–2029 (KILOTON)
  • TABLE 167 REST OF MIDDLE EAST & AFRICA: POLYETHYLENEIMINE MARKET, BY TYPE, 2022–2023 (USD MILLION)
  • TABLE 168 REST OF MIDDLE EAST & AFRICA: POLYETHYLENEIMINE MARKET, BY TYPE, 2024–2029 (USD MILLION)
  • TABLE 169 REST OF MIDDLE EAST & AFRICA: POLYETHYLENEIMINE MARKET, BY TYPE, 2022–2023 (KILOTON)
  • TABLE 170 REST OF MIDDLE EAST & AFRICA: POLYETHYLENEIMINE MARKET, BY TYPE, 2024–2029 (KILOTON)
  • TABLE 171 SOUTH AMERICA: POLYETHYLENEIMINE MARKET, BY COUNTRY, 2022–2023 (USD MILLION)
  • TABLE 172 SOUTH AMERICA: POLYETHYLENEIMINE MARKET, BY COUNTRY, 2024–2029 (USD MILLION)
  • TABLE 173 SOUTH AMERICA: POLYETHYLENEIMINE MARKET, BY COUNTRY, 2022–2023 (KILOTON)
  • TABLE 174 SOUTH AMERICA: POLYETHYLENEIMINE MARKET, BY COUNTRY, 2024–2029 (KILOTON)
  • TABLE 175 SOUTH AMERICA: POLYETHYLENEIMINE MARKET, BY TYPE, 2022–2023 (USD MILLION)
  • TABLE 176 SOUTH AMERICA: POLYETHYLENEIMINE MARKET, BY TYPE, 2024–2029 (USD MILLION)
  • TABLE 177 SOUTH AMERICA: POLYETHYLENEIMINE MARKET, BY TYPE, 2022–2023 (KILOTON)
  • TABLE 178 SOUTH AMERICA: POLYETHYLENEIMINE MARKET, BY TYPE, 2024–2029 (KILOTON)
  • TABLE 179 SOUTH AMERICA: POLYETHYLENEIMINE MARKET, BY APPLICATION, 2022–2023 (USD MILLION)
  • TABLE 180 SOUTH AMERICA: POLYETHYLENEIMINE MARKET, BY APPLICATION, 2024–2029 (USD MILLION)
  • TABLE 181 SOUTH AMERICA: POLYETHYLENEIMINE MARKET, BY APPLICATION, 2022–2023 (KILOTON)
  • TABLE 182 SOUTH AMERICA: POLYETHYLENEIMINE MARKET, BY APPLICATION, 2024–2029 (KILOTON)
  • TABLE 183 BRAZIL: POLYETHYLENEIMINE MARKET, BY TYPE, 2022–2023 (USD MILLION)
  • TABLE 184 BRAZIL: POLYETHYLENEIMINE MARKET, BY TYPE, 2024–2029 (USD MILLION)
  • TABLE 185 BRAZIL: POLYETHYLENEIMINE MARKET, BY TYPE, 2022–2023 (KILOTON)
  • TABLE 186 BRAZIL: POLYETHYLENEIMINE MARKET, BY TYPE, 2024–2029 (KILOTON)
  • TABLE 187 ARGENTINA: POLYETHYLENEIMINE MARKET, BY TYPE, 2022–2023 (USD MILLION)
  • TABLE 188 ARGENTINA: POLYETHYLENEIMINE MARKET, BY TYPE, 2024–2029 (USD MILLION)
  • TABLE 189 ARGENTINA: POLYETHYLENEIMINE MARKET, BY TYPE, 2022–2023 (KILOTON)
  • TABLE 190 ARGENTINA: POLYETHYLENEIMINE MARKET, BY TYPE, 2024–2029 (KILOTON)
  • TABLE 191 REST OF SOUTH AMERICA: POLYETHYLENEIMINE MARKET, BY TYPE, 2022–2023 (USD MILLION)
  • TABLE 192 REST OF SOUTH AMERICA: POLYETHYLENEIMINE MARKET, BY TYPE, 2024–2029 (USD MILLION)
  • TABLE 193 REST OF SOUTH AMERICA: POLYETHYLENEIMINE MARKET, BY TYPE, 2022–2023 (KILOTON)
  • TABLE 194 REST OF SOUTH AMERICA: POLYETHYLENEIMINE MARKET, BY TYPE, 2024–2029 (KILOTON)
  • TABLE 195 POLYETHYLENEIMINE MARKET: OVERVIEW OF STRATEGIES ADOPTED BY KEY PLAYERS, 2018–2023
  • TABLE 196 POLYETHYLENEIMINE MARKET: DEGREE OF COMPETITION
  • TABLE 197 POLYETHYLENEIMINE MARKET: BRAND/PRODUCT COMPARATIVE ANALYSIS
  • TABLE 198 OVERALL COMPANY FOOTPRINT (25 COMPANIES)
  • TABLE 199 REGION: COMPANY FOOTPRINT (25 COMPANIES)
  • TABLE 200 TYPE: COMPANY FOOTPRINT (25 COMPANIES)
  • TABLE 201 APPLICATION: COMPANY FOOTPRINT (25 COMPANIES)
  • TABLE 202 POLYETHYLENEIMINE MARKET: KEY STARTUPS/SMES
  • TABLE 203 POLYETHYLENEIMINE MARKET: COMPETITIVE BENCHMARKING OF KEY STARTUPS/SMES
  • TABLE 204 POLYETHYLENEIMINE MARKET: EXPANSIONS, JANUARY 2018
  • TABLE 205 BASF SE: COMPANY OVERVIEW
  • TABLE 206 BASF SE: PRODUCTS/SERVICES/SOLUTIONS OFFERED
  • TABLE 207 NIPPON SHOKUBAI CO. LTD.: COMPANY OVERVIEW
  • TABLE 208 NIPPON SHOKUBAI CO. LTD.: PRODUCTS/SERVICES/SOLUTIONS OFFERED
  • TABLE 209 NIPPON SHOKUBAI CO. LTD.: EXPANSIONS, JANUARY 2018
  • TABLE 210 DOW INC.: PRODUCTS/SERVICES/SOLUTIONS OFFERED
  • TABLE 211 FUJIFILM WAKO PURE CHEMICAL CORPORATION: COMPANY OVERVIEW
  • TABLE 212 FUJIFILM WAKO PURE CHEMICAL CORPORATION: PRODUCTS/SERVICES/ SOLUTIONS OFFERED
  • TABLE 213 POLYSCIENCES, INC.: COMPANY OVERVIEW
  • TABLE 214 POLYSCIENCES, INC.: PRODUCTS/SERVICES/SOLUTIONS OFFERED
  • TABLE 215 SERVA ELECTROPHORESIS GMBH: COMPANY OVERVIEW
  • TABLE 216 SERVA ELECTROPHORESIS GMBH: PRODUCTS/SERVICES/SOLUTIONS OFFERED
  • TABLE 217 SHANGHAI HOLDENCHEM CO., LTD.: COMPANY OVERVIEW
  • TABLE 218 SHANGHAI HOLDENCHEM CO., LTD.: PRODUCTS/SERVICES/SOLUTIONS OFFERED
  • TABLE 219 WUHAN BRIGHT CHEMICAL CO., LTD. CORPORATION: COMPANY OVERVIEW
  • TABLE 220 WUHAN BRIGHT CHEMICAL CO., LTD.: PRODUCTS/SERVICES/SOLUTIONS OFFERED
  • TABLE 221 THERMO FISHER SCIENTIFIC INC.: COMPANY OVERVIEW
  • TABLE 222 THERMO FISHER SCIENTIFIC INC.: PRODUCTS/SERVICES/SOLUTIONS OFFERED
  • TABLE 223 TOKYO CHEMICAL INDUSTRY CO., LTD.: COMPANY OVERVIEW
  • TABLE 224 TOKYO CHEMICAL INDUSTRY CO., LTD.: PRODUCTS/SERVICES/ SOLUTIONS OFFERED
  • TABLE 225 HAIHANG INDUSTRY: COMPANY OVERVIEW
  • TABLE 226 HAIHANG INDUSTRY: PRODUCTS/SERVICES/SOLUTIONS OFFERED
  • TABLE 227 SPECTRUM CHEMICAL: COMPANY OVERVIEW
  • TABLE 228 SPECTRUM CHEMICAL: PRODUCTS/SERVICES/SOLUTIONS OFFERED
  • TABLE 229 MOLEKULA GROUP: COMPANY OVERVIEW
  • TABLE 230 MOLEKULA GROUP: PRODUCTS/SERVICES/SOLUTIONS OFFERED
  • TABLE 231 NANJING CHEMICAL MATERIAL CORP.: COMPANY OVERVIEW
  • TABLE 232 NANJING CHEMICAL MATERIAL CORP.: PRODUCTS/SERVICES/ SOLUTIONS OFFERED
  • TABLE 233 ACTYLIS: COMPANY OVERVIEW
  • TABLE 234 ACTYLIS: PRODUCTS/SERVICES/SOLUTIONS OFFERED
  • TABLE 235 FENGCHEN GROUP CO., LTD.: COMPANY OVERVIEW
  • TABLE 236 FENGCHEN GROUP CO., LTD.: PRODUCTS/SERVICES/SOLUTIONS OFFERED
  • TABLE 237 UNILONG INDUSTRY CO., LTD.: COMPANY OVERVIEW
  • TABLE 238 UNILONG INDUSTRY CO., LTD.: PRODUCTS/SERVICES/SOLUTIONS OFFERED
  • TABLE 239 HANGZHOU KEYING CHEM CO., LTD.: COMPANY OVERVIEW
  • TABLE 240 HANGZHOU KEYING CHEM CO., LTD.: PRODUCTS/SERVICES/SOLUTIONS OFFERED
  • TABLE 241 BOC SCIENCES: COMPANY OVERVIEW
  • TABLE 242 BOC SCIENCES: PRODUCTS/SERVICES/SOLUTIONS OFFERED
  • TABLE 243 ALFA CHEMISTRY: COMPANY OVERVIEW
  • TABLE 244 ALFA CHEMISTRY: PRODUCTS/SERVICES/SOLUTIONS OFFERED
  • TABLE 245 MAHAVIR EXPOCHEM LTD.: COMPANY OVERVIEW
  • TABLE 246 MAHAVIR EXPOCHEM LTD.: PRODUCTS/SERVICES/SOLUTIONS OFFERED
  • TABLE 247 SANTA CRUZ BIOTECHNOLOGY: COMPANY OVERVIEW
  • TABLE 248 SANTA CRUZ BIOTECHNOLOGY: PRODUCTS/SERVICES/SOLUTIONS OFFERED
  • TABLE 249 NANJING DULY BIOTECHNOLOGY CO., LTD.: COMPANY OVERVIEW
  • TABLE 250 NANJING DULY BIOTECHNOLOGY CO., LTD.: PRODUCTS/SERVICES/ SOLUTIONS OFFERED
  • TABLE 251 HENAN TIANFU CHEMICAL CO., LTD.: COMPANY OVERVIEW
  • TABLE 252 HENAN TIANFU CHEMICAL CO., LTD.: PRODUCTS/SERVICES/SOLUTIONS OFFERED
  • TABLE 253 WUHAN QIANGLONG NEW CHEMICAL MATERIALS CO., LTD.: COMPANY OVERVIEW
  • TABLE 254 WUHAN QIANGLONG NEW CHEMICAL MATERIALS CO., LTD.: PRODUCTS/SERVICES/SOLUTIONS OFFERED
  • TABLE 255 ETHYLENEAMINES MARKET, BY TYPE, 2021–2022 (USD MILLION)
  • TABLE 256 ETHYLENEAMINES MARKET, BY TYPE, 2023–2028 (USD MILLION)
  • TABLE 257 ETHYLENEAMINES MARKET, BY TYPE, 2021–2022 (KILOTON)
  • TABLE 258 ETHYLENEAMINES MARKET, BY TYPE, 2023–2028 (KILOTON)
  • TABLE 259 ETHYLENEAMINES MARKET, BY APPLICATION, 2021–2022 (USD MILLION)
  • TABLE 260 ETHYLENEAMINES MARKET, BY APPLICATION, 2023–2028 (USD MILLION)
  • TABLE 261 ETHYLENEAMINES MARKET, BY APPLICATION, 2021–2022 (KILOTON)
  • TABLE 262 ETHYLENEAMINES MARKET, BY APPLICATION, 2023–2028 (KILOTON)
  • TABLE 263 ETHYLENEAMINES MARKET, BY END USE, 2021–2022 (USD MILLION)
  • TABLE 264 ETHYLENEAMINES MARKET, BY END USE, 2023–2028 (USD MILLION)
  • TABLE 265 ETHYLENEAMINES MARKET, BY END USE, 2021–2022 (KILOTON)
  • TABLE 266 ETHYLENEAMINES MARKET, BY END USE, 2023–2028 (KILOTON)
  • TABLE 267 ETHYLENEAMINES MARKET, BY REGION, 2021–2022 (USD MILLION)
  • TABLE 268 ETHYLENEAMINES MARKET, BY REGION, 2023–2028 (USD MILLION)
  • TABLE 269 ETHYLENEAMINES MARKET, BY REGION, 2021–2022 (KILOTON)
  • TABLE 270 ETHYLENEAMINES MARKET, BY REGION, 2023–2028 (KILOTON)
LIST OF FIGURES
 
  • FIGURE 1 POLYETHYLENEIMINE MARKET SEGMENTATION
  • FIGURE 2 POLYETHYLENEIMINE MARKET: RESEARCH DESIGN
  • FIGURE 3 MARKET SIZE ESTIMATION: BOTTOM-UP APPROACH
  • FIGURE 4 MARKET SIZE ESTIMATION: TOP-DOWN APPROACH
  • FIGURE 5 POLYETHYLENEIMINE MARKET SIZE ESTIMATION, BY REGION
  • FIGURE 6 POLYETHYLENEIMINE MARKET, BY TYPE, 2023
  • FIGURE 7 POLYETHYLENEIMINE MARKET: SUPPLY-SIDE FORECAST
  • FIGURE 8 FACTOR ANALYSIS OF POLYETHYLENEIMINE MARKET
  • FIGURE 9 POLYETHYLENEIMINE MARKET: DATA TRIANGULATION
  • FIGURE 10 LINEAR TYPE TO REGISTER HIGHER CAGR IN POLYETHYLENEIMINE MARKET DURING FORECAST PERIOD
  • FIGURE 11 ADHESIVES & SEALANTS SEGMENT ACCOUNTED FOR LARGEST MARKET SHARE IN POLYETHYLENEIMINE MARKET
  • FIGURE 12 ASIA PACIFIC LED POLYETHYLENEIMINE MARKET IN 2023
  • FIGURE 13 POLYETHYLENEIMINE MARKET TO WITNESS SLUGGISH GROWTH DURING FORECAST PERIOD
  • FIGURE 14 LINEAR TO BE FASTER GROWING SEGMENT BETWEEN 2024 AND 2029
  • FIGURE 15 EMERGING ECONOMIES TO WITNESS HIGHER GROWTH DURING FORECAST PERIOD
  • FIGURE 16 CHINA ACCOUNTED FOR LARGEST MARKET SHARE
  • FIGURE 17 INDIA TO EMERGE AS LUCRATIVE MARKET FOR POLYETHYLENEIMINE
  • FIGURE 18 DRIVERS, RESTRAINTS, OPPORTUNITIES, AND CHALLENGES IN POLYETHYLENEIMINE MARKET
  • FIGURE 19 PORTER’S FIVE FORCES ANALYSIS: POLYETHYLENEIMINE MARKET
  • FIGURE 20 POLYETHYLENEIMINE MARKET: SUPPLY CHAIN ANALYSIS
  • FIGURE 21 POLYETHYLENEIMINE MARKET: ECOSYSTEM ANALYSIS
  • FIGURE 22 POLYETHYLENEIMINE MARKET: ECOSYSTEM
  • FIGURE 23 TRENDS IN END-USE INDUSTRIES IMPACTING BUSINESS OF POLYETHYLENEIMINE MANUFACTURERS
  • FIGURE 24 INFLUENCE OF STAKEHOLDERS ON BUYING PROCESS
  • FIGURE 25 KEY BUYING CRITERIA FOR POLYETHYLENEIMINE
  • FIGURE 26 AVERAGE SELLING PRICE TREND, BY REGION, 2023
  • FIGURE 27 AVERAGE SELLING PRICE TREND, BY TYPE, 2023
  • FIGURE 28 AVERAGE SELLING PRICE TREND, BY APPLICATION, 2023
  • FIGURE 29 AVERAGE SELLING PRICE TREND OF KEY PLAYERS, BY TOP APPLICATIONS, 2023
  • FIGURE 30 ETHYLENE EXPORT, BY KEY COUNTRY, 2019–2023 (USD THOUSAND)
  • FIGURE 31 ETHYLENE IMPORT, BY KEY COUNTRY, 2019–2023 (USD THOUSAND)
  • FIGURE 32 LIST OF MAJOR PATENTS FOR POLYETHYLENEIMINE, 2015–2024
  • FIGURE 33 BRANCHED TYPE TO BE LEADING SEGMENT IN POLYETHYLENEIMINE MARKET
  • FIGURE 34 ADHESIVES & SEALANTS APPLICATION TO LEAD POLYETHYLENEIMINE MARKET
  • FIGURE 35 ASIA PACIFIC TO REGISTER HIGHEST CAGR BETWEEN 2024 AND 2029 FOR POLYETHYLENEIMINE MARKET
  • FIGURE 36 NORTH AMERICA: POLYETHYLENEIMINE MARKET SNAPSHOT
  • FIGURE 37 EUROPE: POLYETHYLENEIMINE MARKET SNAPSHOT
  • FIGURE 38 ASIA PACIFIC: POLYETHYLENEIMINE MARKET SNAPSHOT
  • FIGURE 39 MIDDLE EAST & AFRICA: POLYETHYLENEIMINE MARKET SNAPSHOT
  • FIGURE 40 SOUTH AMERICA: POLYETHYLENEIMINE MARKET SNAPSHOT
  • FIGURE 41 POLYETHYLENEIMINE MARKET: MARKET SHARE ANALYSIS, 2023
  • FIGURE 42 RANKING OF POLYETHYLENEIMINE MANUFACTURERS IN 2023
  • FIGURE 43 POLYETHYLENEIMINE MARKET: REVENUE ANALYSIS OF TOP FOUR PLAYERS
  • FIGURE 44 POLYETHYLENEIMINE MARKET: COMPANY VALUATION
  • FIGURE 45 POLYETHYLENEIMINE MARKET: FINANCIAL METRICS
  • FIGURE 46 POLYETHYLENEIMINE MARKET: COMPANY EVALUATION MATRIX (KEY PLAYERS), 2023
  • FIGURE 47 COMPANY FOOTPRINT (25 COMPANIES)
  • FIGURE 48 POLYETHYLENEIMINE MARKET: COMPANY EVALUATION MATRIX (STARTUPS/SMES), 2023
  • FIGURE 49 BASF SE: COMPANY SNAPSHOT
  • FIGURE 50 NIPPON SHOKUBAI CO. LTD.: COMPANY SNAPSHOT
  • FIGURE 51 DOW INC.: COMPANY SNAPSHOT
  • FIGURE 52 FUJIFILM WAKO PURE CHEMICAL CORPORATION: COMPANY SNAPSHOT
  • FIGURE 53 THERMO FISHER SCIENTIFIC INC.: COMPANY SNAPSHOT

The study involved four major activities in order to estimate the current size of the polyethyleneimine market. Exhaustive secondary research was conducted to gather information on the market. The next step was to conduct primary research to validate these findings, assumptions, and sizing with the industry experts across the value chain. Both top-down and bottom-up approaches were used to estimate the total market size. The market size of segments and subsegments was then estimated using market breakdown and data triangulation.

Secondary Research

Secondary sources include annual reports of companies, press releases, investor presentations, white papers, articles by recognized authors, and databases, such as D&B, Bloomberg, Chemical Weekly, and Factiva; and publications and databases from associations, Chemical & Petrochemicals Manufacturers Association, European Ethylene Producers Committee, American Chemical Society, and International Council of Chemical Associations.

Primary Research

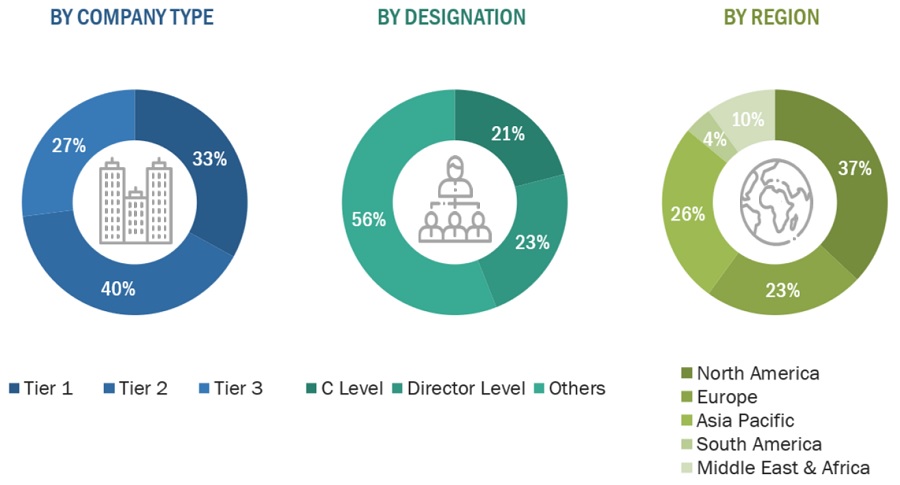
Extensive primary research was carried out after gathering information about polyethyleneimine market through secondary research. In the primary research process, experts from the supply and demand sides have been interviewed to obtain qualitative and quantitative information and validate the data for this report. Questionnaires, emails, and telephonic interviews were used to collect primary data. Primary sources from the supply side include industry experts, such as chief executive officers (CEOs), vice presidents (VPs), marketing directors, technology and innovation directors, and related key executives from various key companies and organizations operating in the polyethyleneimine market. Primary interviews were conducted to elicit information such as market statistics, revenue data collected from the products and services, market breakdowns, market size estimations, market forecasting, and data triangulation. Primary research also assisted in comprehending the various trends associated to type, application, and region.

The Breakup of Primary Research:
Polyethyleneimine Market Size, and Share

To know about the assumptions considered for the study, download the pdf brochure

COMPANY NAME

DESIGNATION

Shanghai Holdenchem Co.

Sales Manager

Basf SE

Project Manager

WUHAN BRIGHT CHEMICAL Co. Ltd

Individual Industry Expert

Dow

Manager

Market Size Estimation

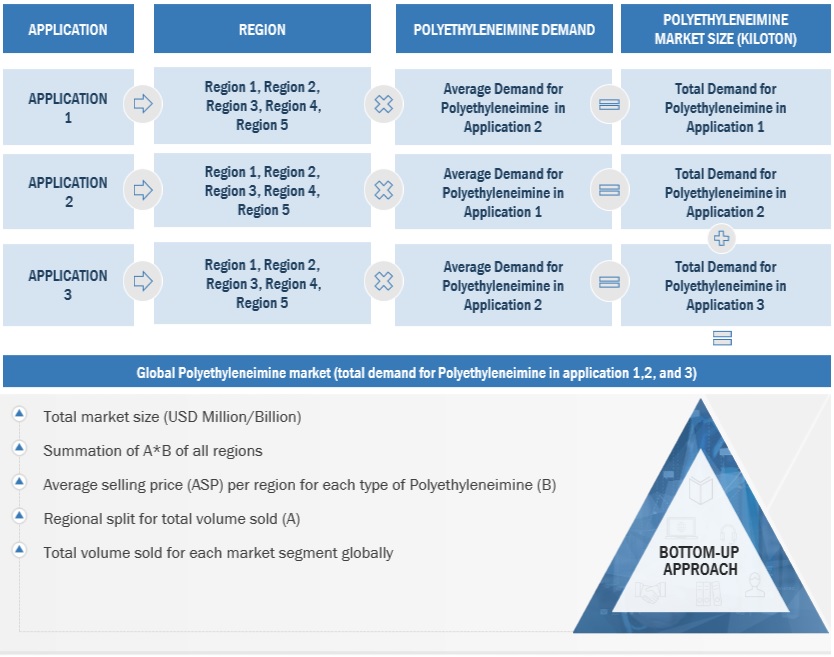
The following information is part of the research methodology used to estimate the size of the polyethyleneimine market. The market sizing of the polyethyleneimine market was undertaken from the demand side. The market size was estimated based on market size for polyethyleneimine in various technology.

Global Polyethyleneimine Market Size: Bottom Up Approach
Polyethyleneimine Market Size, and Share

To know about the assumptions considered for the study, Request for Free Sample Report

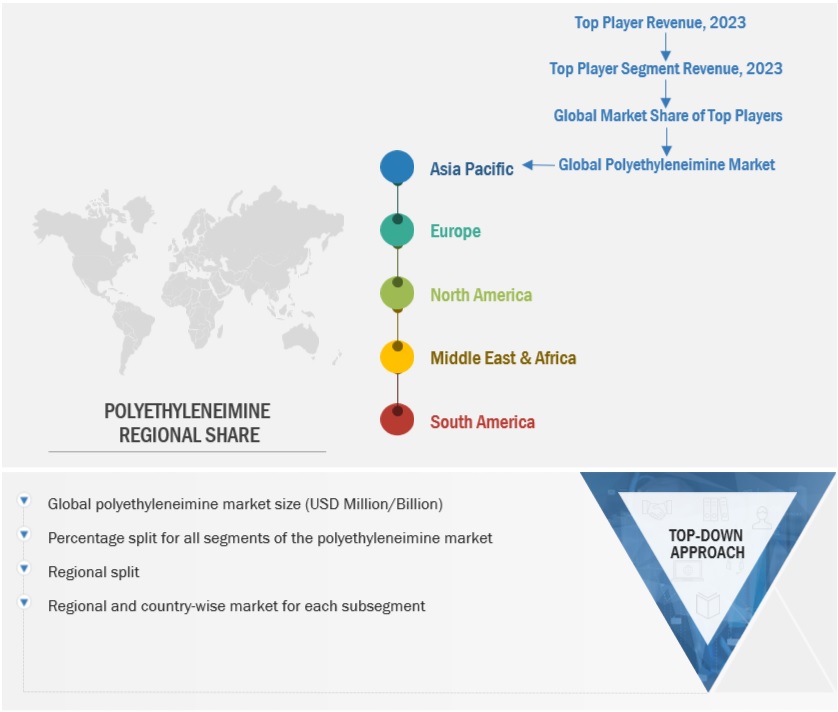
Global Polyethyleneimine Market Size: Top-Down Approach
Polyethyleneimine Market Size, and Share

Data Triangulation

After arriving at the overall market size, the market has been split into several segments. To complete the overall market engineering process and arrive at the exact statistics for all segments, the data triangulation and market breakdown procedures have been employed, wherever applicable. The data was triangulated by studying various factors and trends from the demand and supply sides. Along with this, the market size was validated using both the top-down and bottom-up approaches.

Market Definition

Polyethyleneimine (PEI), a versatile polymer known for its cationic properties and diverse applications, finds extensive use in sectors such as water treatment, detergents, cosmetics, Paper, and coatings. In water treatment, PEI-based polymers function as flocculants or coagulants, facilitating the removal of contaminants such as heavy metals, organic pollutants, and dyes from water sources. PEI provides adhesion to various substrates (e.g., metals, plastics) due to its strong bonding capabilities and PEI coatings provide protection against corrosion, abrasion, and chemical damage. In cosmetics it primarily acts as a binding agent, helping to stabilize formulations and improve the consistency and texture of cosmetic products such as creams, lotions, and gels.

Key Stakeholders

  • End User
  • Raw Material Suppliers
  • Senior Management
  • Procurement Department

Report Objectives

  • To define, describe, and forecast the size of the polyethyleneimine market in terms of value and volume
  • To provide detailed information about the drivers, restraints, opportunities, and challenges influencing the growth of the market
  • To forecast the market size by type and application
  • To forecast the market size with respect to five main regions: North America, Europe, Asia Pacific, South America, and Middle East & Africa
  • To strategically analyze micro-markets with respect to individual growth trends, prospects, and their contribution to the overall market
  • To analyze the opportunities in the market for stakeholders and provide a competitive landscape for the market leaders
  • To analyze competitive developments in the market, such as expansions
  • To strategically profile the key players and comprehensively analyze their market shares and core competencies

Available Customizations

MarketsandMarkets offers the following customizations for this market report:

  • Additional country-level analysis of the polyethyleneimine market
  • Profiling of additional market players (up to 5)

Product Analysis

  • Product matrix, which provides a detailed comparison of the product portfolio of each company in the polyethyleneimine Market

Previous Versions of this Report

"Our USP is "providing game-changing business opportunities reports with free customization" - so please feel free to provide us with your specific areas of interest / business challenges in much greater detail !!"

We appreciate your interest in this report. Once you fill out the form, you'll be immediately directed to an exclusive solution tailored to your needs. This high-value offering can help boost your revenue by 30% - a must-see opportunity for anyone looking to maximize growth.


By clicking the "Submit" button, you are agreeing to the Terms of Use and Privacy Policy.

Custom Market Research Services

We Will Customise The Research For You, In Case The Report Listed Above Does Not Meet With Your Requirements

Get 10% Free Customisation

Growth opportunities and latent adjacency in Polyethyleneimine Market

DMCA.com Protection Status