Plastic Compounds Market by Product (PVC, PP, PE, PS, PA, PC, PET, PU, ABS), Source, End-use Industry (Automotive, Packaging, Electrical & Electronics, Building & Construction, Consumer Goods, Medical), and Region - Global Forecast to 2029
Updated on : October 25, 2024
Plastic Compounds Market
The global plastic compounds market is valued at USD 70.8 billion in 2024 and is projected to reach USD 97.3 billion by 2029, growing at 6.6% cagr from 2024 to 2029. Plastic compounds refer to mixtures of plastic and various chemicals and materials known as additives, which are incorporated during the compounding stage to enhance the properties of the final product. These additives, which can include stabilizers, plasticizers, and dyes, help improve the lifespan, workability, or appearance of the plastic item. Plastic compounds have a wide range of end-uses across various industries due to their versatility, durability, and ability to be molded into different shapes and forms. These industries include automotive, building & construction, electrical & electronics, packaging, consumer goods, medical, and others. Over the past few years, the plastic compounds market has witnessed high growth. Plastic compounds exhibit exceptional durability and resistance to environmental factors like adverse weather conditions, rot, and corrosion. They can withstand harsh conditions and do not degrade easily, reducing maintenance needs and increasing the lifespan of structures.
Attractive Opportunities in the Plastic Compounds Market
Note: e-estimated p-projected.
Source: Expert Interviews, Secondary Sources, and MarketsandMarkets Analysis
To know about the assumptions considered for the study, Request for Free Sample Report
Plastic Compounds Market Dynamics
Driver: Increasing demand in packaging and building & construction industries
The packaging and building, & construction industries are seeing increasing demand for plastic compounds for various applications. In the packaging sector, the increased need for containers for food and beverages, and caps for various products has driven the demand for durable, flexible and cost-effective plastic compounds. In the building & construction industry, plastic compounds are widely used for insulators, pipe fittings, and other construction materials due to their affordability, strength, and versatility. The trend towards energy-efficient construction practices has further boosted the demand for plastic compounds in this industry. Overall, the adaptability and diverse properties of plastic compounds have made them indispensable in meeting the evolving needs of the packaging, and building, & construction industries, driving the growth of the global plastic compounds market.
Restraint: Volatility in raw material prices
The prices of key raw materials used in plastic compounds are heavily dependent on the volatility of crude oil and natural gas prices, The price of crude oil directly impacts the plastic compound market as it influences the cost of key raw materials used in plastic compounds. When the price of crude oil rises, the cost of producing these raw materials increases, leading to higher production costs for plastic compounds. For example, if the price of crude oil spikes due to geopolitical tensions or supply disruptions, the cost of producing polyethylene, a common material in plastic compounds, will also increase. This rise in raw material costs can put pressure on plastic compound manufacturers to either absorb the increased costs or pass them on to consumers, affecting the overall pricing and profitability of the plastic compound market.
Opportunities: Advancements in additive manufacturing
Advancements in additive manufacturing present significant opportunities for the plastic compounds market. Additive manufacturing, also known as 3D printing, is revolutionizing the manufacturing industry by enabling the creation of components without the need for traditional dies or tooling. This technology is widely used in prototyping, bridge production, and short-run production, offering flexibility and cost-effectiveness in manufacturing processes. The continuous improvement in the mechanical strength of plastic parts manufactured through additive manufacturing enhances their performance and durability, opening new possibilities for the application of plastic compounds in various industries. As additive manufacturing techniques evolve and become more sophisticated, they create opportunities for the plastic compounds market to develop specialized products tailored to specific requirements, such as improved impact resistance, thermal stability, and esthetic appeal.
Challenges: Plastic waste management crisis
Plastic management poses a critical challenge for the plastic compound market due to the global accumulation of plastic waste and its environmental impact. The mismanagement of plastic waste, especially post-consumer single-use items, is leading to severe environmental consequences worldwide. The uncontrolled disposal of plastic waste is encroaching on ecosystems, causing long-lasting pollution due to the inert nature of plastics. The lack of comprehensive plastic waste regulation and recycling infrastructure compounds the issue, resulting in plastic waste leakage into the environment as litter. This crisis highlights the urgent need for effective plastic waste management strategies, recycling initiatives, and the adoption of circular economy approaches to mitigate the environmental impact of plastic waste.
Based on product, polyvinyl chloride (PVC) is the second-largest growing segment in the plastic compounds market.
Polyvinyl chloride (PVC or vinyl) is a high-strength thermoplastic material widely used in various applications, including pipes, medical devices, and wire & cable insulation. It is produced by polymerizing vinyl chloride monomer (VCM), which is manufactured from the chlorination of ethylene and pyrolysis of ethylene dichloride (EDC). The material's electrical properties, durability, flame retardancy, cost-performance ratio, mechanical properties, and chemical resistance make it a preferred choice for many long-life and outdoor products. Additives such as plasticizers, heat stabilizers, fillers, and lubricants are used to enhance the properties of PVC, including its softness, thermal stability, stiffness, impact performance, color, opacity, and conductivity.
Based on source, recycled is the second-largest segment in the plastic compounds market.
Recycled plastic compounds offer a sustainable alternative to virgin plastic, reducing the environmental impact of plastic pollution and conserving natural resources. These compounds are created by reprocessing and reusing post-consumer or post-industrial plastic waste through a process involving collection, sorting, washing, shredding, identification, separation, and extrusion. Recycled plastic compounds can be tailored to meet specific color, property, and performance requirements by adding various additives during the compounding process. Additives used in recycled plastic compounds play a vital role in enhancing their properties and ensuring their suitability for various applications.
Based on end-use industry, packaging is the largest segment in the plastic compounds market.
Packaging is an indispensable process for preserving and transporting goods. It caters to various sectors such as retail, institutional, and industrial. Changing consumer lifestyles due to increasing disposable incomes have increased the use of plastic compounds in packaging products. Airtight plastic packaging is an indispensable part of modern life, preserving and protecting goods and ensuring that they are transported safely. The demand for plastic products, such as bottles, caps & closures, films & special films, transport crates, containers & drums, is expected to increase during the forecast period.
Asia Pacific is expected to be the largest market during the forecast period.
The Asia Pacific region has emerged as a leader in the global plastic compounds market due to several compelling factors. Firstly, rapid urbanization, economic growth, and increasing infrastructure development in countries like China, India, and Japan have propelled the demand for plastic compounds. The presence of populous countries, such as China and India, has benefited the plastic compounds market, owing to the increasing demand for high-quality medical, automotive, consumer, and electronic products. Additionally, favourable government initiatives, supportive regulatory frameworks, and a robust manufacturing ecosystem further contribute to the region's dominance in the plastic compounds market, making it a key hub for production, consumption, and export of plastic compounds materials and products.
To know about the assumptions considered for the study, download the pdf brochure
Plastic Compounds Market Players
The plastic compounds market is dominated by a few major players that have a wide regional presence. The key players in the plastic compounds market are BASF SE (Germany), The Dow Chemical Company (US), LyondellBasell Industries Holdings B.V. (Netherlands), SABIC (Saudi Arabia), Asahi Kasei Corporation (Japan), Covestro AG (Germany), Arkema (France), RTP Company (US), and Westlake Corporation (US). In the last few years, the companies have adopted growth strategies such as product launches, investments, acquisitions, and expansions to capture a larger share of the plastic compounds market.
Plastic Compounds Market Report Scope
Report Metric |
Details |
Years considered for the study |
2020-2029 |
Base Year |
2023 |
Forecast period |
2024–2029 |
Units considered |
Value (USD Million), Volume (Kiloton) |
Segments |
Product, Source, End-use Industry, and Region |
Regions |
Asia Pacific, North America, Europe, Middle East & Africa, and South America |
Companies |
BASF SE (Germany), The Dow Chemical Company (US), LyondellBasell Industries Holdings B.V. (Netherlands), SABIC (Saudi Arabia), Asahi Kasei Corporation (Japan), Covestro AG (Germany), Arkema (France), RTP Company (US), and Westlake Corporation (US) |
This report categorizes the global plastic compounds market based on product, source, end-use industry, and region.
On the basis of product, the plastic compounds market has been segmented as follows:
- Polyvinyl Chloride
- Polypropylene
- Polyethylene
- Polycarbonate
- Polystyrene
- Polyamide
- Polyethylene Terephthalate
- Polyurethane
- Acrylonitrile Butadiene Styrene
- Others
On the basis of source, the plastic compounds market has been segmented as follows:
- Fossil-based
- Bio-based
- Recycled
On the basis of end-use industry, the plastic compounds market has been segmented as follows:
- Automotive
- Passenger Cars
- Commercial Vehicles
- Packaging
- Electrical & Electronics
- Building & Construction
- Residential
- Commercial
- Industrial
- Consumer Goods
- Medical
- Others
On the basis of region, the plastic compounds market has been segmented as follows:
- Asia Pacific
- Europe
- North America
- Middle East & Africa
- South America
Recent Developments
- In February 2024, Arkema increased its global manufacturing capacity for Pebax elastomers by 40% at its Serquigny plant in France.
- In December 2023, Asahi Kasei Corporation obtained the prestigious international sustainability certification ISCC plus1 for a range of additional products like TPE, PVDC, PPE, PA, and styrene.
- In May 2023, SABIC, a renowned global player in the chemical industry, introduced the innovative LNP™ ELCRIN WF0051iQ compound. This cutting-edge compound offers thin-wall properties and non-brominated/non-chlorinated flame retardancy (FR), catering to the evolving needs of the market.
- In July 2023, LyondellBasell Industries Holdings acquired Mepol Group, a producer of recycled, high-performance technical compounds situated in Italy and Poland. Mepol S.r.l., along with its subsidiaries Polar S.r.l. and Industrial Technology Investments Poland Sp.z.o.o, will now operate as part of LyondellBasell Industries Holding’s Advanced Polymer Solutions (APS) business division.
- In July 2022, BASF SE and THOR GmbH leveraged their combined expertise in non-halogenated flame-retardant additives to offer customers a comprehensive solution. This collaboration aims to enhance the sustainability and performance of specific plastic compounds, while also helping customers meet stringent fire safety requirements.
Frequently Asked Questions (FAQ):
What are the factors influencing the growth of the plastic compounds market?
The growth of the plastic compounds market is influenced by factors such as the increasing demand in in packaging and building & construction industries, and rising adoption of recyclable plastic compounds.
Which are the key applications driving the plastic compounds market?
The key end-use industries driving the demand for plastic compounds are packaging, building & construction, and automotive.
Who are the major manufacturers?
Major manufacturers include BASF SE (Germany), The Dow Chemical Company (US), LyondellBasell Industries Holdings B.V. (Netherlands), SABIC (Saudi Arabia), Asahi Kasei Corporation (Japan), Covestro AG (Germany), Arkema (France), RTP Company (US), and Westlake Corporation (US).
What will be the growth prospects of the plastic compounds market?
The plastic compounds market is expected to witness robust growth due to rising demand from packaging and automotive industries.
What will be the growth prospects of the plastic compounds market in terms of CAGR in the next five years?
The CAGR of the market will be in between 6-7% in the next five years. .
To speak to our analyst for a discussion on the above findings, click Speak to Analyst
Exclusive indicates content/data unique to MarketsandMarkets and not available with any competitors.
- 5.1 INTRODUCTION
-
5.2 MARKET DYNAMICSDRIVERS- Increasing demand in packaging and building & construction industries- Rising adoption of recyclable plastic compoundsRESTRAINTS- Volatility in raw material prices- Availability of substitutesOPPORTUNITIES- Growth in automotive & transportation industry- Advancements in additive manufacturingCHALLENGES- Plastic waste management crisis
-
5.3 PORTER’S FIVE FORCES ANALYSISTHREAT OF NEW ENTRANTSTHREAT OF SUBSTITUTESBARGAINING POWER OF SUPPLIERSBARGAINING POWER OF BUYERSINTENSITY OF COMPETITIVE RIVALRY
-
5.4 MACROECONOMIC INDICATORSGLOBAL GDP TRENDSAUTOMOBILE PRODUCTION TRENDS
-
5.5 KEY STAKEHOLDERS AND BUYING CRITERIAKEY STAKEHOLDERS IN BUYING PROCESSBUYING CRITERIA
-
5.6 VALUE CHAIN ANALYSISRAW MATERIAL SUPPLIERSRESIN MANUFACTURERSCOMPOUNDERSMOLDERSEND USERS
- 5.7 ECOSYSTEM ANALYSIS
-
5.8 CASE STUDY ANALYSISOEM USES COVESTRO’S LIGHTWEIGHT MAKROLON TC POLYCARBONATE FOR FOG LAMP HOUSINGRTP COMPANY DEVELOPS INNOVATIVE SOLUTIONS TO REDUCE ABRASION AND NOISE IN CABLE CONVEYOR SYSTEM
-
5.9 REGULATORY LANDSCAPEREGULATIONS- North America- Europe- Asia Pacific
-
5.10 TECHNOLOGY ANALYSISKEY TECHNOLOGIES- High-shear and continuous mixers for consistent polymer compoundingCOMPLEMENTARY TECHNOLOGIES- Advanced twin-screw extruders for efficient polymer compoundingADJACENT TECHNOLOGIES- Technologies for compounding biodegradable and bio-based polymers
-
5.11 TRENDS/DISRUPTIONS IMPACTING CUSTOMER BUSINESSREVENUE SHIFTS AND NEW REVENUE POCKETS FOR PLASTIC COMPOUNDS MARKET
- 5.12 TRADE ANALYSIS
- 5.13 KEY CONFERENCES AND EVENTS, 2024–2025
-
5.14 PRICING TREND ANALYSISAVERAGE SELLING PRICE, BY REGIONAVERAGE SELLING PRICES OF KEY PLAYERS, BY PRODUCTAVERAGE SELLING PRICES OF KEY PLAYERS, BY SOURCEAVERAGE SELLING PRICES OF KEY PLAYERS, BY END-USE INDUSTRY
- 5.15 INVESTMENT AND FUNDING SCENARIO
-
5.16 PATENT ANALYSISMETHODOLOGYDOCUMENT TYPEPUBLICATION TRENDS - LAST 10 YEARSINSIGHTSLEGAL STATUS OF PATENTSJURISDICTION-WISE PATENT ANALYSISTOP 10 COMPANIES/APPLICANTSTOP 10 PATENT OWNERS IN LAST 10 YEARS
- 6.1 INTRODUCTION
-
6.2 POLYVINYL CHLORIDE (PVC)IDEAL CHOICE FOR OUTDOOR APPLICATIONS
-
6.3 POLYETHYLENE (PE)WIDE APPLICATIONS IN FOOD PACKAGING
-
6.4 POLYSTYRENE (PS)VERSATILE MATERIAL USED ACROSS INDUSTRIES
-
6.5 POLYAMIDE (PA)HIGH-PERFORMANCE THERMOPLASTIC WITH MULTIPLE APPLICATIONS
-
6.6 POLYETHYLENE TEREPHTHALATE (PET)HIGH DEMAND DUE TO WIDE-RANGING PROPERTIES
-
6.7 POLYPROPYLENE (PP)WIDE ADOPTION IN AUTOMOTIVE AND PACKING INDUSTRIES
-
6.8 POLYCARBONATE (PC)HIGH-PERFORMANCE MATERIAL SUITED TO HARSH CONDITIONS
-
6.9 POLYURETHANE (PU)VERSATILITY TO DRIVE DEMAND ACROSS INDUSTRIES
-
6.10 ACRYLONITRILE BUTADIENE STYRENE (ABS)DRIVES EFFICIENCY AND PERFORMANCE IN KEY INDUSTRIES
- 6.11 OTHER PRODUCTS
- 7.1 INTRODUCTION
-
7.2 FOSSIL-BASEDGROWING USE IN PACKAGING AND INDUSTRIAL APPLICATIONS
-
7.3 BIO-BASEDSUSTAINABLE ALTERNATIVES WITH WIDE-RANGING APPLICATIONS
-
7.4 RECYCLEDFACILITATE PLASTIC WASTE REDUCTION ACROSS INDUSTRIES
- 8.1 INTRODUCTION
-
8.2 AUTOMOTIVEGROWING DEMAND TO REDUCE VEHICLE WEIGHT AND ENHANCE FUEL CONSUMPTIONPASSENGER CARSCOMMERCIAL VEHICLES
-
8.3 BUILDING & CONSTRUCTIONWIDE-RANGING APPLICATIONS DUE TO DURABILITY AND COST-EFFECTIVENESSRESIDENTIALCOMMERCIALINDUSTRIAL
-
8.4 ELECTRICAL & ELECTRONICSINCREASING USE DUE TO IMPROVED SAFETY AND HIGH HEAT RESISTANCE
-
8.5 PACKAGINGHIGH DEMAND FOR LIGHTWEIGHT PLASTIC MATERIALS
-
8.6 CONSUMER GOODSGROWING PREFERENCE FOR DURABLE AND COST-EFFECTIVE MATERIALS
-
8.7 MEDICALRISING DEMAND FOR PLASTICS WITH HIGH CHEMICAL RESISTANCE
- 8.8 OTHER INDUSTRIES
- 9.1 INTRODUCTION
-
9.2 NORTH AMERICANORTH AMERICA: IMPACT OF RECESSIONUS- Strict environment-related regulations to drive demandCANADA- Thriving automotive industry to drive demandMEXICO- Presence of leading automobile companies to drive market
-
9.3 ASIA PACIFICASIA PACIFIC: IMPACT OF RECESSIONCHINA- Strong demand in manufacturing sector to propel marketINDIA- Easy availability of raw materials to boost marketJAPAN- Rising demand in healthcare sector to drive marketSOUTH KOREA- High-performing manufacturing sector to boost marketMALAYSIA- Rising demand across industries to fuel marketPHILIPPINES- Government initiatives to drive marketTHAILAND- Industrial growth and focus on innovation to fuel marketINDONESIA- Industrial expansion to drive demandAUSTRALIA- Rising demand in key sectors to boost marketREST OF ASIA PACIFIC
-
9.4 EUROPEEUROPE: IMPACT OF RECESSIONGERMANY- Strong demand in packaging industry to drive marketFRANCE- Growing pharmaceutical industry to drive demandUK- Increasing investments in manufacturing sector to boost marketITALY- Presence of global players to propel market growthSPAIN- Rising demand for packaging across industries to boost marketREST OF EUROPE
-
9.5 MIDDLE EAST & AFRICAMIDDLE EAST & AFRICA: IMPACT OF RECESSION- GCC Countries- Saudi Arabia- UAEREST OF GCCSOUTH AFRICA- Growing government initiatives to drive demandREST OF MIDDLE EAST & AFRICA
-
9.6 SOUTH AMERICASOUTH AMERICA: IMPACT OF RECESSIONBRAZIL- Growing automotive industry to fuel marketARGENTINA- Rising demand across industries to propel marketREST OF SOUTH AMERICA
- 10.1 INTRODUCTION
- 10.2 KEY PLAYER STRATEGIES/RIGHT TO WIN, JANUARY 2019–APRIL 2024
- 10.3 MARKET SHARE ANALYSIS
- 10.4 REVENUE ANALYSIS
- 10.5 MARKET RANKING ANALYSIS
- 10.6 COMPANY VALUATION AND FINANCIAL METRICS
- 10.7 BRAND/PRODUCT COMPARISON
-
10.8 COMPANY EVALUATION MATRIX: KEY PLAYERS, 2023STARSEMERGING LEADERSPERVASIVE PLAYERSPARTICIPANTSCOMPANY FOOTPRINT, KEY PLAYERS, 2023- Company footprint- Region footprint- Product footprint- Source footprint- End-use industry footprint
-
10.9 COMPANY EVALUATION MATRIX: STARTUPS/SMES, 2023PROGRESSIVE COMPANIESRESPONSIVE COMPANIESDYNAMIC COMPANIESSTARTING BLOCKSCOMPETITIVE BENCHMARKING
-
10.10 COMPETITIVE SCENARIO AND TRENDSPRODUCT LAUNCHESDEALSEXPANSIONS
-
11.1 MAJOR PLAYERSBASF SE- Business overview- Products/Solutions/Services offered- Recent developments- MnM viewTHE DOW CHEMICAL COMPANY- Business overview- Products/Solutions/Services offered- Recent developments- MnM viewLYONDELLBASELL INDUSTRIES HOLDINGS- Business overview- Products/Solutions/Services offered- Recent developments- MnM viewSABIC- Business overview- Products/Solutions/Services offered- Recent developments- MnM viewASAHI KASEI CORPORATION- Business overview- Products/Solutions/Services offered- Recent developments- MnM viewCOVESTRO AG- Business overview- Products/Solutions/Services offered- Recent developments- MnM viewCELANESE CORPORATION- Business overview- Products /Solutions/Services offered- Recent developments- MnM viewARKEMA- Business overview- Products/Solutions/Services offered.- Recent developments- MnM viewRTP COMPANY- Business overview- Products/Solutions/Services offered- MnM viewWESTLAKE CORPORATION- Business overview- Products/Solutions/Services offered- Recent developments- MnM view
-
11.2 OTHER PLAYERSAVIENT CORPORATIONGEON PERFORMANCE SOLUTIONSRAVAGOAURORA MATERIAL SOLUTIONSORBIAAMERICHEMPOLYKEMIRIKEN AMERICAS CORPORATIONTEKNI-PLEX, INC.SHINTECH INC.MANNER POLYMERSEIQSAPOLYMER ASIADENKA CHEMICALS HOLDINGSRADICI PARTECIPAZIONI SPA
- 12.1 DISCUSSION GUIDE
- 12.2 KNOWLEDGESTORE: MARKETSANDMARKETS’ SUBSCRIPTION PORTAL
- 12.3 CUSTOMIZATION OPTIONS
- 12.4 RELATED REPORTS
- 12.5 AUTHOR DETAILS
- TABLE 1 PLASTIC COMPOUNDS MARKET: INCLUSIONS AND EXCLUSIONS
- TABLE 2 PLASTIC COMPOUNDS MARKET: PORTER’S FIVE FORCES ANALYSIS
- TABLE 3 PROJECTED REAL GDP GROWTH (ANNUAL PERCENTAGE CHANGE) OF KEY COUNTRIES, 2021–2029
- TABLE 4 AUTOMOBILE PRODUCTION IN KEY COUNTRIES, 2021–2023
- TABLE 5 INFLUENCE OF STAKEHOLDERS ON BUYING PROCESS FOR THREE KEY END-USE INDUSTRIES (%)
- TABLE 6 BUYING CRITERIA FOR THREE KEY END-USE INDUSTRIES
- TABLE 7 PLASTIC COMPOUNDS MARKET: ROLE IN ECOSYSTEM
- TABLE 8 IMPORT TRADE DATA FOR PVC, BY COUNTRY, 2019–2023 (USD THOUSAND)
- TABLE 9 EXPORT TRADE DATA FOR PVC, BY COUNTRY, 2019–2023 (USD THOUSAND)
- TABLE 10 IMPORT TRADE DATA FOR PLASTICS, BY COUNTRY, 2019–2023 (USD THOUSAND)
- TABLE 11 EXPORT TRADE DATA FOR PLASTICS, BY COUNTRY, 2019–2023 (USD THOUSAND)
- TABLE 12 IMPORT TRADE DATA FOR PP, BY COUNTRY, 2019–2023 (USD THOUSAND)
- TABLE 13 EXPORT TRADE DATA FOR PP, BY COUNTRY, 2019–2023 (USD THOUSAND)
- TABLE 14 IMPORT TRADE DATA FOR PA, BY COUNTRY, 2019–2023 (USD THOUSAND)
- TABLE 15 EXPORT TRADE DATA FOR PA, BY COUNTRY, 2019–2023 (USD THOUSAND)
- TABLE 16 PLASTIC COMPOUNDS MARKET: KEY CONFERENCES & EVENTS, 2024–2025
- TABLE 17 AVERAGE SELLING PRICE, BY REGION (USD/KG)
- TABLE 18 AVERAGE SELLING PRICES OF KEY PLAYERS, BY PRODUCT (USD/KG)
- TABLE 19 AVERAGE SELLING PRICES OF KEY PLAYERS, BY SOURCE (USD/KG)
- TABLE 20 AVERAGE SELLING PRICES OF KEY PLAYERS, BY END-USE INDUSTRY (USD/KG)
- TABLE 21 PATENTS: SEMICONDUCTOR ENERGY LABORATORY CO., LTD.
- TABLE 22 PATENTS: SAMSUNG DISPLAY
- TABLE 23 PATENTS: BASF SE
- TABLE 24 TOP TEN PATENT OWNERS
- TABLE 25 PLASTIC COMPOUNDS MARKET, BY PRODUCT, 2021–2023 (USD MILLION)
- TABLE 26 PLASTIC COMPOUNDS MARKET, BY PRODUCT, 2024–2029 (USD MILLION)
- TABLE 27 PLASTIC COMPOUNDS MARKET, BY PRODUCT, 2021–2023 (KILOTON)
- TABLE 28 PLASTIC COMPOUNDS MARKET, BY PRODUCT, 2024–2029 (KILOTON)
- TABLE 29 PLASTIC COMPOUNDS MARKET, BY SOURCE, 2021–2023 (USD MILLION)
- TABLE 30 PLASTIC COMPOUNDS MARKET, BY SOURCE, 2024–2029 (USD MILLION)
- TABLE 31 PLASTIC COMPOUNDS MARKET, BY SOURCE, 2021–2023 (KILOTON)
- TABLE 32 PLASTIC COMPOUNDS MARKET, BY SOURCE, 2024–2029 (KILOTON)
- TABLE 33 PLASTIC COMPOUNDS MARKET, BY END-USE INDUSTRY, 2021–2023 (USD MILLION)
- TABLE 34 PLASTIC COMPOUNDS MARKET, BY END-USE INDUSTRY, 2024–2029 (USD MILLION)
- TABLE 35 PLASTIC COMPOUNDS MARKET, BY END-USE INDUSTRY, 2021–2023 (KILOTON)
- TABLE 36 PLASTIC COMPOUNDS MARKET, BY END-USE INDUSTRY, 2024–2029 (KILOTON)
- TABLE 37 PLASTIC COMPOUNDS MARKET, BY REGION, 2021–2023 (USD MILLION)
- TABLE 38 PLASTIC COMPOUNDS MARKET, BY REGION, 2024–2029 (USD MILLION)
- TABLE 39 PLASTIC COMPOUNDS MARKET, BY REGION, 2021–2023 (KILOTON)
- TABLE 40 PLASTIC COMPOUNDS MARKET, BY REGION, 2024–2029 (KILOTON)
- TABLE 41 NORTH AMERICA: PLASTIC COMPOUNDS MARKET, BY COUNTRY, 2021–2023 (USD MILLION)
- TABLE 42 NORTH AMERICA: PLASTIC COMPOUNDS MARKET, BY COUNTRY, 2024–2029 (USD MILLION)
- TABLE 43 NORTH AMERICA: PLASTIC COMPOUNDS MARKET, BY COUNTRY, 2021–2023 (KILOTON)
- TABLE 44 NORTH AMERICA: PLASTIC COMPOUNDS MARKET, BY COUNTRY, 2024–2029 (KILOTON)
- TABLE 45 NORTH AMERICA: PLASTIC COMPOUNDS MARKET, BY PRODUCT, 2021–2023 (USD MILLION)
- TABLE 46 NORTH AMERICA: PLASTIC COMPOUNDS MARKET, BY PRODUCT, 2024–2029 (USD MILLION)
- TABLE 47 NORTH AMERICA: PLASTIC COMPOUNDS MARKET, BY PRODUCT, 2021–2023 (KILOTON)
- TABLE 48 NORTH AMERICA: PLASTIC COMPOUNDS MARKET, BY PRODUCT, 2024–2029 (KILOTON)
- TABLE 49 NORTH AMERICA: PLASTIC COMPOUNDS MARKET, BY SOURCE, 2021–2023 (USD MILLION)
- TABLE 50 NORTH AMERICA: PLASTIC COMPOUNDS MARKET, BY SOURCE, 2024–2029 (USD MILLION)
- TABLE 51 NORTH AMERICA: PLASTIC COMPOUNDS MARKET, BY SOURCE, 2021–2023 (KILOTON)
- TABLE 52 NORTH AMERICA: PLASTIC COMPOUNDS MARKET, BY SOURCE, 2024–2029 (KILOTON)
- TABLE 53 NORTH AMERICA: PLASTIC COMPOUNDS MARKET, BY END-USE INDUSTRY, 2021–2023 (USD MILLION)
- TABLE 54 NORTH AMERICA: PLASTIC COMPOUNDS MARKET, BY END-USE INDUSTRY, 2024–2029 (USD MILLION)
- TABLE 55 NORTH AMERICA: PLASTIC COMPOUNDS MARKET, BY END-USE INDUSTRY, 2021–2023 (KILOTON)
- TABLE 56 NORTH AMERICA: PLASTIC COMPOUNDS MARKET, BY END-USE INDUSTRY, 2024–2029 (KILOTON)
- TABLE 57 US: PLASTIC COMPOUNDS MARKET, BY END-USE INDUSTRY, 2021–2023 (USD MILLION)
- TABLE 58 US: PLASTIC COMPOUNDS MARKET, BY END-USE INDUSTRY, 2024–2029 (USD MILLION)
- TABLE 59 US: PLASTIC COMPOUNDS MARKET, BY END-USE INDUSTRY, 2021–2023 (KILOTON)
- TABLE 60 US: PLASTIC COMPOUNDS MARKET, BY END-USE INDUSTRY, 2024–2029 (KILOTON)
- TABLE 61 CANADA: PLASTIC COMPOUNDS MARKET, BY END-USE INDUSTRY, 2021–2023 (USD MILLION)
- TABLE 62 CANADA: PLASTIC COMPOUNDS MARKET, BY END-USE INDUSTRY, 2024–2029 (USD MILLION)
- TABLE 63 CANADA: PLASTIC COMPOUNDS MARKET, BY END-USE INDUSTRY, 2021–2023 (KILOTON)
- TABLE 64 CANADA: PLASTIC COMPOUNDS MARKET, BY END-USE INDUSTRY, 2024–2029 (KILOTON)
- TABLE 65 MEXICO: PLASTIC COMPOUNDS MARKET, BY END-USE INDUSTRY, 2021–2023 (USD MILLION)
- TABLE 66 MEXICO: PLASTIC COMPOUNDS MARKET, BY END-USE INDUSTRY, 2024–2029 (USD MILLION)
- TABLE 67 MEXICO: PLASTIC COMPOUNDS MARKET, BY END-USE INDUSTRY, 2021–2023 (KILOTON)
- TABLE 68 MEXICO: PLASTIC COMPOUNDS MARKET, BY END-USE INDUSTRY, 2024–2029 (KILOTON)
- TABLE 69 ASIA PACIFIC: PLASTIC COMPOUNDS MARKET, BY COUNTRY, 2021–2023 (USD MILLION)
- TABLE 70 ASIA PACIFIC: PLASTIC COMPOUNDS MARKET, BY COUNTRY, 2024–2029 (USD MILLION)
- TABLE 71 ASIA PACIFIC: PLASTIC COMPOUNDS MARKET, BY COUNTRY, 2021–2023 (KILOTON)
- TABLE 72 ASIA PACIFIC: PLASTIC COMPOUNDS MARKET, BY COUNTRY, 2024–2029 (KILOTON)
- TABLE 73 ASIA PACIFIC: PLASTIC COMPOUNDS MARKET, BY PRODUCT, 2021–2023 (USD MILLION)
- TABLE 74 ASIA PACIFIC: PLASTIC COMPOUNDS MARKET, BY PRODUCT, 2024–2029 (USD MILLION)
- TABLE 75 ASIA PACIFIC: PLASTIC COMPOUNDS MARKET, BY PRODUCT, 2021–2023 (KILOTON)
- TABLE 76 ASIA PACIFIC: PLASTIC COMPOUNDS MARKET, BY PRODUCT, 2024–2029 (KILOTON)
- TABLE 77 ASIA PACIFIC: PLASTIC COMPOUNDS MARKET, BY SOURCE, 2021–2023 (USD MILLION)
- TABLE 78 ASIA PACIFIC: PLASTIC COMPOUNDS MARKET, BY SOURCE, 2024–2029 (USD MILLION)
- TABLE 79 ASIA PACIFIC: PLASTIC COMPOUNDS MARKET, BY SOURCE, 2021–2023 (KILOTON)
- TABLE 80 ASIA PACIFIC: PLASTIC COMPOUNDS MARKET, BY SOURCE, 2024–2029 (KILOTON)
- TABLE 81 ASIA PACIFIC: PLASTIC COMPOUNDS MARKET, BY END-USE INDUSTRY, 2021–2023 (USD MILLION)
- TABLE 82 ASIA PACIFIC: PLASTIC COMPOUNDS MARKET, BY END-USE INDUSTRY, 2024–2029 (USD MILLION)
- TABLE 83 ASIA PACIFIC: PLASTIC COMPOUNDS MARKET, BY END-USE INDUSTRY, 2021–2023 (KILOTON)
- TABLE 84 ASIA PACIFIC: PLASTIC COMPOUNDS MARKET, BY END-USE INDUSTRY, 2024–2029 (KILOTON)
- TABLE 85 CHINA: PLASTIC COMPOUNDS MARKET, BY END-USE INDUSTRY, 2021–2023 (USD MILLION)
- TABLE 86 CHINA: PLASTIC COMPOUNDS MARKET, BY END-USE INDUSTRY, 2024–2029 (USD MILLION)
- TABLE 87 CHINA: PLASTIC COMPOUNDS MARKET, BY END-USE INDUSTRY, 2021–2023 (KILOTON)
- TABLE 88 CHINA: PLASTIC COMPOUNDS MARKET, BY END-USE INDUSTRY, 2024–2029 (KILOTON)
- TABLE 89 INDIA: PLASTIC COMPOUNDS MARKET, BY END-USE INDUSTRY, 2021–2023 (USD MILLION)
- TABLE 90 INDIA: PLASTIC COMPOUNDS MARKET, BY END-USE INDUSTRY, 2024–2029 (USD MILLION)
- TABLE 91 INDIA: PLASTIC COMPOUNDS MARKET, BY END-USE INDUSTRY, 2021–2023 (KILOTON)
- TABLE 92 INDIA: PLASTIC COMPOUNDS MARKET, BY END-USE INDUSTRY, 2024–2029 (KILOTON)
- TABLE 93 JAPAN: PLASTIC COMPOUNDS MARKET, BY END-USE INDUSTRY, 2021–2023 (USD MILLION)
- TABLE 94 JAPAN: PLASTIC COMPOUNDS MARKET, BY END-USE INDUSTRY, 2024–2029 (USD MILLION)
- TABLE 95 JAPAN: PLASTIC COMPOUNDS MARKET, BY END-USE INDUSTRY, 2021–2023 (KILOTON)
- TABLE 96 JAPAN: PLASTIC COMPOUNDS MARKET, BY END-USE INDUSTRY, 2024–2029 (KILOTON)
- TABLE 97 SOUTH KOREA: PLASTIC COMPOUNDS MARKET, BY END-USE INDUSTRY, 2021–2023 (USD MILLION)
- TABLE 98 SOUTH KOREA: PLASTIC COMPOUNDS MARKET, BY END-USE INDUSTRY, 2024–2029 (USD MILLION)
- TABLE 99 SOUTH KOREA: PLASTIC COMPOUNDS MARKET, BY END-USE INDUSTRY, 2021–2023 (KILOTON)
- TABLE 100 SOUTH KOREA: PLASTIC COMPOUNDS MARKET, BY END-USE INDUSTRY, 2024–2029 (KILOTON)
- TABLE 101 MALAYSIA: PLASTIC COMPOUNDS MARKET, BY END-USE INDUSTRY, 2021–2023 (USD MILLION)
- TABLE 102 MALAYSIA: PLASTIC COMPOUNDS MARKET, BY END-USE INDUSTRY, 2024–2029 (USD MILLION)
- TABLE 103 MALAYSIA: PLASTIC COMPOUNDS MARKET, BY END-USE INDUSTRY, 2021–2023 (KILOTON)
- TABLE 104 MALAYSIA: PLASTIC COMPOUNDS MARKET, BY END-USE INDUSTRY, 2024–2029 (KILOTON)
- TABLE 105 PHILIPPINES: PLASTIC COMPOUNDS MARKET, BY END-USE INDUSTRY, 2021–2023 (USD MILLION)
- TABLE 106 PHILIPPINES: PLASTIC COMPOUNDS MARKET, BY END-USE INDUSTRY, 2024–2029 (USD MILLION)
- TABLE 107 PHILIPPINES: PLASTIC COMPOUNDS MARKET, BY END-USE INDUSTRY, 2021–2023 (KILOTON)
- TABLE 108 PHILIPPINES: PLASTIC COMPOUNDS MARKET, BY END-USE INDUSTRY, 2024–2029 (KILOTON)
- TABLE 109 THAILAND: PLASTIC COMPOUNDS MARKET, BY END-USE INDUSTRY, 2021–2023 (USD MILLION)
- TABLE 110 THAILAND: PLASTIC COMPOUNDS MARKET, BY END-USE INDUSTRY, 2024–2029 (USD MILLION)
- TABLE 111 THAILAND: PLASTIC COMPOUNDS MARKET, BY END-USE INDUSTRY, 2021–2023 (KILOTON)
- TABLE 112 THAILAND: PLASTIC COMPOUNDS MARKET, BY END-USE INDUSTRY, 2024–2029 (KILOTON)
- TABLE 113 INDONESIA: PLASTIC COMPOUNDS MARKET, BY END-USE INDUSTRY, 2021–2023 (USD MILLION)
- TABLE 114 INDONESIA: PLASTIC COMPOUNDS MARKET, BY END-USE INDUSTRY, 2024–2029 (USD MILLION)
- TABLE 115 INDONESIA: PLASTIC COMPOUNDS MARKET, BY END-USE INDUSTRY, 2021–2023 (KILOTON)
- TABLE 116 INDONESIA: PLASTIC COMPOUNDS MARKET, BY END-USE INDUSTRY, 2024–2029 (KILOTON)
- TABLE 117 AUSTRALIA: PLASTIC COMPOUNDS MARKET, BY END-USE INDUSTRY, 2021–2023 (USD MILLION)
- TABLE 118 AUSTRALIA: PLASTIC COMPOUNDS MARKET, BY END-USE INDUSTRY, 2024–2029 (USD MILLION)
- TABLE 119 AUSTRALIA: PLASTIC COMPOUNDS MARKET, BY END-USE INDUSTRY, 2021–2023 (KILOTON)
- TABLE 120 AUSTRALIA: PLASTIC COMPOUNDS MARKET, BY END-USE INDUSTRY, 2024–2029 (KILOTON)
- TABLE 121 REST OF ASIA PACIFIC: PLASTIC COMPOUNDS MARKET, BY END-USE INDUSTRY, 2021–2023 (USD MILLION)
- TABLE 122 REST OF ASIA PACIFIC: PLASTIC COMPOUNDS MARKET, BY END-USE INDUSTRY, 2024–2029 (USD MILLION)
- TABLE 123 REST OF ASIA PACIFIC: PLASTIC COMPOUNDS MARKET, BY END-USE INDUSTRY, 2021–2023 (KILOTON)
- TABLE 124 REST OF ASIA PACIFIC: PLASTIC COMPOUNDS MARKET, BY END-USE INDUSTRY, 2024–2029 (KILOTON)
- TABLE 125 EUROPE: PLASTIC COMPOUNDS MARKET, BY COUNTRY, 2021–2023 (USD MILLION)
- TABLE 126 EUROPE: PLASTIC COMPOUNDS MARKET, BY COUNTRY, 2024–2029 (USD MILLION)
- TABLE 127 EUROPE: PLASTIC COMPOUNDS MARKET, BY COUNTRY, 2021–2023 (KILOTON)
- TABLE 128 EUROPE: PLASTIC COMPOUNDS MARKET, BY COUNTRY, 2024–2029 (KILOTON)
- TABLE 129 EUROPE: PLASTIC COMPOUNDS MARKET, BY PRODUCT, 2021–2023 (USD MILLION)
- TABLE 130 EUROPE: PLASTIC COMPOUNDS MARKET, BY PRODUCT, 2024–2029 (USD MILLION)
- TABLE 131 EUROPE: PLASTIC COMPOUNDS MARKET, BY PRODUCT, 2021–2023 (KILOTON)
- TABLE 132 EUROPE: PLASTIC COMPOUNDS MARKET, BY PRODUCT, 2024–2029 (KILOTON)
- TABLE 133 EUROPE: PLASTIC COMPOUNDS MARKET, BY SOURCE, 2021–2023 (USD MILLION)
- TABLE 134 EUROPE: PLASTIC COMPOUNDS MARKET, BY SOURCE, 2024–2029 (USD MILLION)
- TABLE 135 EUROPE: PLASTIC COMPOUNDS MARKET, BY SOURCE, 2021–2023 (KILOTON)
- TABLE 136 EUROPE: PLASTIC COMPOUNDS MARKET, BY SOURCE, 2024–2029 (KILOTON)
- TABLE 137 EUROPE: PLASTIC COMPOUNDS MARKET, BY END-USE INDUSTRY, 2021–2023 (USD MILLION)
- TABLE 138 EUROPE: PLASTIC COMPOUNDS MARKET, BY END-USE INDUSTRY, 2024–2029 (USD MILLION)
- TABLE 139 EUROPE: PLASTIC COMPOUNDS MARKET, BY END-USE INDUSTRY, 2021–2023 (KILOTON)
- TABLE 140 EUROPE: PLASTIC COMPOUNDS MARKET, BY END-USE INDUSTRY, 2024–2029 (KILOTON)
- TABLE 141 GERMANY: PLASTIC COMPOUNDS MARKET, BY END-USE INDUSTRY, 2021–2023 (USD MILLION)
- TABLE 142 GERMANY: PLASTIC COMPOUNDS MARKET, BY END-USE INDUSTRY, 2024–2029 (USD MILLION)
- TABLE 143 GERMANY: PLASTIC COMPOUNDS MARKET, BY END-USE INDUSTRY, 2021–2023 (KILOTON)
- TABLE 144 GERMANY: PLASTIC COMPOUNDS MARKET, BY END-USE INDUSTRY, 2024–2029 (KILOTON)
- TABLE 145 FRANCE: PLASTIC COMPOUNDS MARKET, BY END-USE INDUSTRY, 2021–2023 (USD MILLION)
- TABLE 146 FRANCE: PLASTIC COMPOUNDS MARKET, BY END-USE INDUSTRY, 2024–2029 (USD MILLION)
- TABLE 147 FRANCE: PLASTIC COMPOUNDS MARKET, BY END-USE INDUSTRY, 2021–2023 (KILOTON)
- TABLE 148 FRANCE: PLASTIC COMPOUNDS MARKET, BY END-USE INDUSTRY, 2024–2029 (KILOTON)
- TABLE 149 UK: PLASTIC COMPOUNDS MARKET, BY END-USE INDUSTRY, 2021–2023 (USD MILLION)
- TABLE 150 UK: PLASTIC COMPOUNDS MARKET, BY END-USE INDUSTRY, 2024–2029 (USD MILLION)
- TABLE 151 UK: PLASTIC COMPOUNDS MARKET, BY END-USE INDUSTRY, 2021–2023 (KILOTON)
- TABLE 152 UK: PLASTIC COMPOUNDS MARKET, BY END-USE INDUSTRY, 2024–2029 (KILOTON)
- TABLE 153 ITALY: PLASTIC COMPOUNDS MARKET, BY END-USE INDUSTRY, 2021–2023 (USD MILLION)
- TABLE 154 ITALY: PLASTIC COMPOUNDS MARKET, BY END-USE INDUSTRY, 2024–2029 (USD MILLION)
- TABLE 155 ITALY: PLASTIC COMPOUNDS MARKET, BY END-USE INDUSTRY, 2021–2023 (KILOTON)
- TABLE 156 ITALY: PLASTIC COMPOUNDS MARKET, BY END-USE INDUSTRY, 2024–2029 (KILOTON)
- TABLE 157 SPAIN: PLASTIC COMPOUNDS MARKET, BY END-USE INDUSTRY, 2021–2023 (USD MILLION)
- TABLE 158 SPAIN: PLASTIC COMPOUNDS MARKET, BY END-USE INDUSTRY, 2024–2029 (USD MILLION)
- TABLE 159 SPAIN: PLASTIC COMPOUNDS MARKET, BY END-USE INDUSTRY, 2021–2023 (KILOTON)
- TABLE 160 SPAIN: PLASTIC COMPOUNDS MARKET, BY END-USE INDUSTRY, 2024–2029 (KILOTON)
- TABLE 161 REST OF EUROPE: PLASTIC COMPOUNDS MARKET, BY END-USE INDUSTRY, 2021–2023 (USD MILLION)
- TABLE 162 REST OF EUROPE: PLASTIC COMPOUNDS MARKET, BY END-USE INDUSTRY, 2024–2029 (USD MILLION)
- TABLE 163 REST OF EUROPE: PLASTIC COMPOUNDS MARKET, BY END-USE INDUSTRY, 2021–2023 (KILOTON)
- TABLE 164 REST OF EUROPE: PLASTIC COMPOUNDS MARKET, BY END-USE INDUSTRY, 2024–2029 (KILOTON)
- TABLE 165 MIDDLE EAST & AFRICA: PLASTIC COMPOUNDS MARKET, BY COUNTRY, 2021–2023 (USD MILLION)
- TABLE 166 MIDDLE EAST & AFRICA: PLASTIC COMPOUNDS MARKET, BY COUNTRY, 2024–2029 (USD MILLION)
- TABLE 167 MIDDLE EAST & AFRICA: PLASTIC COMPOUNDS MARKET, BY COUNTRY, 2021–2023 (KILOTON)
- TABLE 168 MIDDLE EAST & AFRICA: PLASTIC COMPOUNDS MARKET, BY COUNTRY, 2024–2029 (KILOTON)
- TABLE 169 MIDDLE EAST & AFRICA: PLASTIC COMPOUNDS MARKET, BY PRODUCT, 2021–2023 (USD MILLION)
- TABLE 170 MIDDLE EAST & AFRICA: PLASTIC COMPOUNDS MARKET, BY PRODUCT, 2024–2029 (USD MILLION)
- TABLE 171 MIDDLE EAST & AFRICA: PLASTIC COMPOUNDS MARKET, BY PRODUCT, 2021–2023 (KILOTON)
- TABLE 172 MIDDLE EAST & AFRICA: PLASTIC COMPOUNDS MARKET, BY PRODUCT, 2024–2029 (KILOTON)
- TABLE 173 MIDDLE EAST & AFRICA: PLASTIC COMPOUNDS MARKET, BY SOURCE, 2021–2023 (USD MILLION)
- TABLE 174 MIDDLE EAST & AFRICA: PLASTIC COMPOUNDS MARKET, BY SOURCE, 2024–2029 (USD MILLION)
- TABLE 175 MIDDLE EAST & AFRICA: PLASTIC COMPOUNDS MARKET, BY SOURCE, 2021–2023 (KILOTON)
- TABLE 176 MIDDLE EAST & AFRICA: PLASTIC COMPOUNDS MARKET, BY SOURCE, 2024–2029 (KILOTON)
- TABLE 177 MIDDLE EAST & AFRICA: PLASTIC COMPOUNDS MARKET, BY END-USE INDUSTRY, 2021–2023 (USD MILLION)
- TABLE 178 MIDDLE EAST & AFRICA: PLASTIC COMPOUNDS MARKET, BY END-USE INDUSTRY, 2024–2029 (USD MILLION)
- TABLE 179 MIDDLE EAST & AFRICA: PLASTIC COMPOUNDS MARKET, BY END-USE INDUSTRY, 2021–2023 (KILOTON)
- TABLE 180 MIDDLE EAST & AFRICA: PLASTIC COMPOUNDS MARKET, BY END-USE INDUSTRY, 2024–2029 (KILOTON)
- TABLE 181 SAUDI ARABIA: PLASTIC COMPOUNDS MARKET, BY END-USE INDUSTRY, 2021–2023 (USD MILLION)
- TABLE 182 SAUDI ARABIA: PLASTIC COMPOUNDS MARKET, BY END-USE INDUSTRY, 2024–2029 (USD MILLION)
- TABLE 183 SAUDI ARABIA: PLASTIC COMPOUNDS MARKET, BY END-USE INDUSTRY, 2021–2023 (KILOTON)
- TABLE 184 SAUDI ARABIA: PLASTIC COMPOUNDS MARKET, BY END-USE INDUSTRY, 2024–2029 (KILOTON)
- TABLE 185 UAE: PLASTIC COMPOUNDS MARKET, BY END-USE INDUSTRY, 2021–2023 (USD MILLION)
- TABLE 186 UAE: PLASTIC COMPOUNDS MARKET, BY END-USE INDUSTRY, 2024–2029 (USD MILLION)
- TABLE 187 UAE: PLASTIC COMPOUNDS MARKET, BY END-USE INDUSTRY, 2021–2023 (KILOTON)
- TABLE 188 UAE: PLASTIC COMPOUNDS MARKET, BY END-USE INDUSTRY, 2024–2029 (KILOTON)
- TABLE 189 REST OF GCC: PLASTIC COMPOUNDS MARKET, BY END-USE INDUSTRY, 2021–2023 (USD MILLION)
- TABLE 190 REST OF GCC: PLASTIC COMPOUNDS MARKET, BY END-USE INDUSTRY, 2024–2029 (USD MILLION)
- TABLE 191 EST OF GCC: PLASTIC COMPOUNDS MARKET, BY END-USE INDUSTRY, 2021–2023 (KILOTON)
- TABLE 192 REST OF GCC: PLASTIC COMPOUNDS MARKET, BY END-USE INDUSTRY, 2024–2029 (KILOTON)
- TABLE 193 SOUTH AFRICA: PLASTIC COMPOUNDS MARKET, BY END-USE INDUSTRY, 2021–2023 (USD MILLION)
- TABLE 194 SOUTH AFRICA: PLASTIC COMPOUNDS MARKET, BY END-USE INDUSTRY, 2024–2029 (USD MILLION)
- TABLE 195 SOUTH AFRICA: PLASTIC COMPOUNDS MARKET, BY END-USE INDUSTRY, 2021–2023 (KILOTON)
- TABLE 196 SOUTH AFRICA: PLASTIC COMPOUNDS MARKET, BY END-USE INDUSTRY, 2024–2029 (KILOTON)
- TABLE 197 REST OF MIDDLE EAST & AFRICA: PLASTIC COMPOUNDS MARKET, BY END-USE INDUSTRY, 2021–2023 (USD MILLION)
- TABLE 198 REST OF MIDDLE EAST & AFRICA: PLASTIC COMPOUNDS MARKET, BY END-USE INDUSTRY, 2024–2029 (USD MILLION)
- TABLE 199 REST OF MIDDLE EAST & AFRICA: PLASTIC COMPOUNDS MARKET, BY END-USE INDUSTRY, 2021–2023 (KILOTON)
- TABLE 200 REST OF MIDDLE EAST & AFRICA: PLASTIC COMPOUNDS MARKET, BY END-USE INDUSTRY, 2024–2029 (KILOTON)
- TABLE 201 SOUTH AMERICA: PLASTIC COMPOUNDS MARKET, BY COUNTRY, 2021–2023 (USD MILLION)
- TABLE 202 SOUTH AMERICA: PLASTIC COMPOUNDS MARKET, BY COUNTRY, 2024–2029 (USD MILLION)
- TABLE 203 SOUTH AMERICA: PLASTIC COMPOUNDS MARKET, BY COUNTRY, 2021–2023 (KILOTON)
- TABLE 204 SOUTH AMERICA: PLASTIC COMPOUNDS MARKET, BY COUNTRY, 2024–2029 (KILOTON)
- TABLE 205 SOUTH AMERICA: PLASTIC COMPOUNDS MARKET, BY PRODUCT, 2021–2023 (USD MILLION)
- TABLE 206 SOUTH AMERICA: PLASTIC COMPOUNDS MARKET, BY PRODUCT, 2024–2029 (USD MILLION)
- TABLE 207 SOUTH AMERICA: PLASTIC COMPOUNDS MARKET, BY PRODUCT, 2021–2023 (KILOTON)
- TABLE 208 SOUTH AMERICA: PLASTIC COMPOUNDS MARKET, BY PRODUCT, 2024–2029 (KILOTON)
- TABLE 209 SOUTH AMERICA: PLASTIC COMPOUNDS MARKET, BY SOURCE, 2021–2023 (USD MILLION)
- TABLE 210 SOUTH AMERICA: PLASTIC COMPOUNDS MARKET, BY SOURCE, 2024–2029 (USD MILLION)
- TABLE 211 SOUTH AMERICA: PLASTIC COMPOUNDS MARKET, BY SOURCE, 2021–2023 (KILOTON)
- TABLE 212 SOUTH AMERICA: PLASTIC COMPOUNDS MARKET, BY SOURCE, 2024–2029 (KILOTON)
- TABLE 213 SOUTH AMERICA: PLASTIC COMPOUNDS MARKET, BY END-USE INDUSTRY, 2021–2023 (USD MILLION)
- TABLE 214 SOUTH AMERICA: PLASTIC COMPOUNDS MARKET, BY END-USE INDUSTRY, 2024–2029 (USD MILLION)
- TABLE 215 SOUTH AMERICA: PLASTIC COMPOUNDS MARKET, BY END-USE INDUSTRY, 2021–2023 (KILOTON)
- TABLE 216 SOUTH AMERICA: PLASTIC COMPOUNDS MARKET, BY END-USE INDUSTRY, 2024–2029 (KILOTON)
- TABLE 217 BRAZIL: PLASTIC COMPOUNDS MARKET, BY END-USE INDUSTRY, 2021–2023 (USD MILLION)
- TABLE 218 BRAZIL: PLASTIC COMPOUNDS MARKET, BY END-USE INDUSTRY, 2024–2029 (USD MILLION)
- TABLE 219 BRAZIL: PLASTIC COMPOUNDS MARKET, BY END-USE INDUSTRY, 2021–2023 (KILOTON)
- TABLE 220 BRAZIL: PLASTIC COMPOUNDS MARKET, BY END-USE INDUSTRY, 2024–2029 (KILOTON)
- TABLE 221 ARGENTINA: PLASTIC COMPOUNDS MARKET, BY END-USE INDUSTRY, 2021–2023 (USD MILLION)
- TABLE 222 ARGENTINA: PLASTIC COMPOUNDS MARKET, BY END-USE INDUSTRY, 2024–2029 (USD MILLION)
- TABLE 223 ARGENTINA: PLASTIC COMPOUNDS MARKET, BY END-USE INDUSTRY, 2021–2023 (KILOTON)
- TABLE 224 ARGENTINA: PLASTIC COMPOUNDS MARKET, BY END-USE INDUSTRY, 2024–2029 (KILOTON)
- TABLE 225 REST OF SOUTH AMERICA: PLASTIC COMPOUNDS MARKET, BY END-USE INDUSTRY, 2021–2023 (USD MILLION)
- TABLE 226 REST OF SOUTH AMERICA: PLASTIC COMPOUNDS MARKET, BY END-USE INDUSTRY, 2024–2029 (USD MILLION)
- TABLE 227 REST OF SOUTH AMERICA: PLASTIC COMPOUNDS MARKET, BY END-USE INDUSTRY, 2021–2023 (KILOTON)
- TABLE 228 REST OF SOUTH AMERICA: PLASTIC COMPOUNDS MARKET, BY END-USE INDUSTRY, 2024–2029 (KILOTON)
- TABLE 229 PLASTIC COMPOUNDS MARKET: DEGREE OF COMPETITION
- TABLE 230 PLASTIC COMPOUNDS MARKET: KEY STARTUPS/SMES
- TABLE 231 PLASTIC COMPOUNDS MARKET: COMPETITIVE BENCHMARKING OF STARTUPS/SMES
- TABLE 232 PLASTIC COMPOUNDS MARKET: PRODUCT LAUNCHES, JANUARY 2019–APRIL 2024
- TABLE 233 PLASTIC COMPOUNDS MARKET: DEALS, JANUARY 2019–APRIL 2024
- TABLE 234 PLASTIC COMPOUNDS MARKET: EXPANSIONS, JANUARY 2019–APRIL 2024
- TABLE 235 BASF SE: COMPANY OVERVIEW
- TABLE 236 THE DOW CHEMICAL COMPANY: COMPANY OVERVIEW
- TABLE 237 LYONDELLBASELL INDUSTRIES HOLDINGS: COMPANY OVERVIEW
- TABLE 238 SABIC: COMPANY OVERVIEW
- TABLE 239 ASAHI KASEI CORPORATION: COMPANY OVERVIEW
- TABLE 240 COVESTRO AG: COMPANY OVERVIEW
- TABLE 241 CELANESE CORPORATION: COMPANY OVERVIEW
- TABLE 242 ARKEMA: COMPANY OVERVIEW
- TABLE 243 RTP COMPANY: COMPANY OVERVIEW
- TABLE 244 WESTLAKE CORPORATION: COMPANY OVERVIEW
- TABLE 245 AVIENT CORPORATION: BUSINESS OVERVIEW
- TABLE 246 GEON PERFORMANCE SOLUTIONS: BUSINESS OVERVIEW
- TABLE 247 RAVAGO: BUSINESS OVERVIEW
- TABLE 248 AURORA MATERIAL SOLUTIONS: BUSINESS OVERVIEW
- TABLE 249 ORBIA: BUSINESS OVERVIEW
- TABLE 250 AMERICHEM: BUSINESS OVERVIEW
- TABLE 251 POLYKEMI: BUSINESS OVERVIEW
- TABLE 252 RIKEN AMERICAS CORPORATION: BUSINESS OVERVIEW
- TABLE 253 TEKNI-PLEX, INC.: BUSINESS OVERVIEW
- TABLE 254 SHINTECH INC.: BUSINESS OVERVIEW
- TABLE 255 MANNER POLYMERS: BUSINESS OVERVIEW
- TABLE 256 EIQSA: BUSINESS OVERVIEW
- TABLE 257 POLYMER ASIA: BUSINESS OVERVIEW
- TABLE 258 DENKA CHEMICALS HOLDINGS: BUSINESS OVERVIEW
- TABLE 259 RADICI PARTECIPAZIONI SPA: BUSINESS OVERVIEW
- FIGURE 1 PLASTIC COMPOUNDS MARKET SEGMENTATION
- FIGURE 2 PLASTIC COMPOUNDS MARKET: RESEARCH DESIGN
- FIGURE 3 MARKET SIZE ESTIMATION APPROACH: DEMAND SIDE
- FIGURE 4 MARKET SIZE ESTIMATION: BOTTOM-UP APPROACH
- FIGURE 5 MARKET SIZE ESTIMATION: TOP-DOWN APPROACH
- FIGURE 6 PLASTIC COMPOUNDS MARKET: DATA TRIANGULATION
- FIGURE 7 PP SEGMENT TO ACCOUNT FOR LARGEST MARKET SHARE DURING FORECAST PERIOD
- FIGURE 8 FOSSIL-BASED SEGMENT TO LEAD MARKET DURING FORECAST PERIOD
- FIGURE 9 AUTOMOTIVE SEGMENT TO RECORD FASTEST GROWTH DURING FORECAST PERIOD
- FIGURE 10 ASIA PACIFIC MARKET TO REGISTER FASTEST GROWTH DURING FORECAST PERIOD
- FIGURE 11 RAPID INDUSTRIALIZATION IN EMERGING ECONOMIES TO DRIVE MARKET DURING FORECAST PERIOD
- FIGURE 12 PP SEGMENT TO LEAD PLASTIC COMPOUNDS MARKET DURING FORECAST PERIOD
- FIGURE 13 BIO-BASED SEGMENT TO WITNESS HIGHEST GROWTH DURING FORECAST PERIOD
- FIGURE 14 PACKAGING SEGMENT TO ACCOUNT FOR LARGEST MARKET SHARE DURING FORECAST PERIOD
- FIGURE 15 CHINA AND INDIA TO REGISTER HIGHEST CAGR DURING FORECAST PERIOD
- FIGURE 16 DRIVERS, RESTRAINTS, OPPORTUNITIES, AND CHALLENGES IN PLASTIC COMPOUNDS MARKET
- FIGURE 17 YOY PERCENTAGE INCREASE IN AUTOMOTIVE & TRANSPORT INDUSTRY, 2022–2023
- FIGURE 18 GLOBAL PLASTIC MATERIAL PRODUCTION SHARE IN 2022, BY REGION
- FIGURE 19 PORTER’S FIVE FORCES ANALYSIS OF PLASTIC COMPOUNDS MARKET
- FIGURE 20 INFLUENCE OF STAKEHOLDERS ON BUYING PROCESS FOR THREE KEY END-USE INDUSTRIES
- FIGURE 21 BUYING CRITERIA FOR THREE KEY END-USE INDUSTRIES
- FIGURE 22 PLASTIC COMPOUNDS MARKET: VALUE CHAIN ANALYSIS
- FIGURE 23 PLASTIC COMPOUNDS MARKET: ECOSYSTEM ANALYSIS
- FIGURE 24 REVENUE SHIFT FOR PLASTIC COMPOUNDS MARKET
- FIGURE 25 INVESTMENT AND FUNDING SCENARIO, 2023
- FIGURE 26 GRANTED PATENTS
- FIGURE 27 TOTAL NUMBER OF PATENTS PUBLISHED FROM 2013 TO 2023
- FIGURE 28 PATENT ANALYSIS, BY LEGAL STATUS
- FIGURE 29 TOP JURISDICTIONS FOR PATENTS RELATED TO PLASTIC COMPOUNDS
- FIGURE 30 COMPANIES/APPLICANTS WITH HIGHEST NUMBER OF PATENTS
- FIGURE 31 POLYPROPYLENE (PP) SEGMENT TO LEAD MARKET DURING FORECAST PERIOD
- FIGURE 32 FOSSIL-BASED SEGMENT TO LEAD PLASTIC COMPOUNDS MARKET DURING FORECAST PERIOD
- FIGURE 33 PACKAGING TO BE LARGEST END-USE INDUSTRY FOR PLASTIC COMPOUNDS DURING FORECAST PERIOD
- FIGURE 34 PLASTIC COMPOUNDS MARKET: GEOGRAPHIC SNAPSHOT
- FIGURE 35 NORTH AMERICA: PLASTIC COMPOUNDS MARKET SNAPSHOT
- FIGURE 36 ASIA PACIFIC: PLASTIC COMPOUNDS MARKET SNAPSHOT
- FIGURE 37 OVERVIEW OF STRATEGIES ADOPTED BY KEY PLAYERS IN PLASTIC COMPOUNDS MARKET, JANUARY 2019–APRIL 2024
- FIGURE 38 SHARE OF LEADING COMPANIES IN PLASTIC COMPOUNDS MARKET, 2023
- FIGURE 39 REVENUE ANALYSIS OF KEY COMPANIES IN PLASTIC COMPOUNDS MARKET, 2023
- FIGURE 40 RANKING OF KEY PLAYERS IN PLASTIC COMPOUNDS MARKET, 2023
- FIGURE 41 COMPANY VALUATION OF LEADING COMPANIES IN PLASTIC COMPOUNDS MARKET, 2023
- FIGURE 42 FINANCIAL METRICS OF LEADING COMPANIES IN PLASTIC COMPOUNDS MARKET, 2023
- FIGURE 43 PLASTIC COMPOUNDS MARKET: BRAND/PRODUCT COMPARISON
- FIGURE 44 PLASTIC COMPOUNDS MARKET: COMPANY EVALUATION MATRIX (KEY PLAYERS), 2023
- FIGURE 45 PLASTIC COMPOUNDS MARKET: COMPANY EVALUATION MATRIX (STARTUPS/SMES), 2023
- FIGURE 46 BASF SE: COMPANY SNAPSHOT
- FIGURE 47 THE DOW CHEMICAL COMPANY: COMPANY SNAPSHOT
- FIGURE 48 LYONDELLBASELL INDUSTRIES HOLDINGS: COMPANY SNAPSHOT
- FIGURE 49 SABIC: COMPANY SNAPSHOT
- FIGURE 50 ASAHI KASEI CORPORATION: COMPANY SNAPSHOT
- FIGURE 51 COVESTRO AG: COMPANY SNAPSHOT
- FIGURE 52 CELANESE CORPORATION: COMPANY SNAPSHOT
- FIGURE 53 ARKEMA: COMPANY SNAPSHOT
- FIGURE 54 WESTLAKE CORPORATION: COMPANY SNAPSHOT
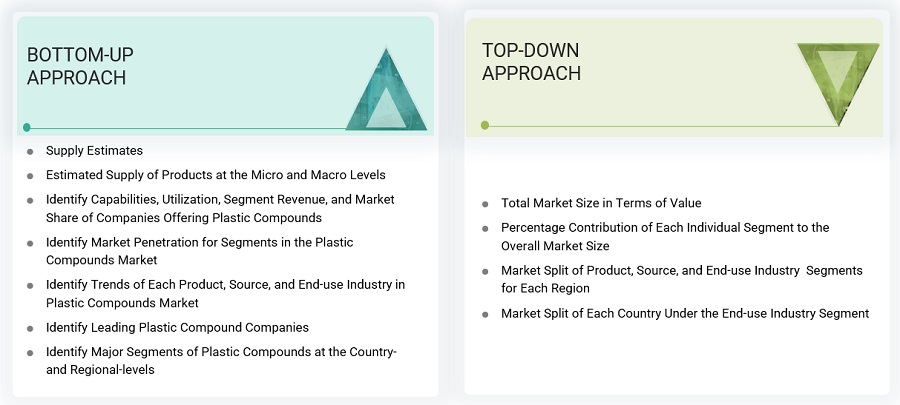
The study involved four major activities in estimating the market size of the plastic compounds market. Exhaustive secondary research was done to collect information on the market, the peer market, and the parent market. The next step was to validate these findings, assumptions, and sizing with industry experts across the value chain through primary research. Both top-down and bottom-up approaches were employed to estimate the complete market size. Thereafter, the market breakdown and data triangulation procedures were used to estimate the market size of the segments and subsegments.
Secondary Research
In the secondary research process, various secondary sources have been referred to for identifying and collecting information for this study. These secondary sources include annual reports, press releases, investor presentations of companies, white papers, certified publications, trade directories, certified publications, articles from recognized authors, gold standard and silver standard websites, and databases.
Secondary research has been used to obtain key information about the value chain of the industry, monetary chain of the market, the total pool of key plastic compounds, market classification and segmentation according to industry trends to the bottom-most level, and regional markets. It was also used to obtain information about the key developments from a market-oriented perspective.
Primary Research
The plastic compounds market comprises several stakeholders in the value chain, which include raw material suppliers, manufacturers, and end users. Various primary sources from the supply and demand sides of the plastic compounds market have been interviewed to obtain qualitative and quantitative information. The primary interviewees from the demand side include key opinion leaders in end-use sectors. The primary sources from the supply side include manufacturers, associations, and institutions involved in the plastic compounds industry.
Primary interviews were conducted to gather insights such as market statistics, data of revenue collected from the products and services, market breakdowns, market size estimations, market forecasting, and data triangulation. Primary research also helped in understanding the various trends related to product, source, end-use industry, and region. Stakeholders from the demand side, such as CIOs, CTOs, and CSOs were interviewed to understand the buyer’s perspective on the suppliers, products, component providers, and their current usage of plastic compounds and future outlook of their business which will affect the overall market.
The breakdown of profiles of the primary interviewees is illustrated in the figure below:
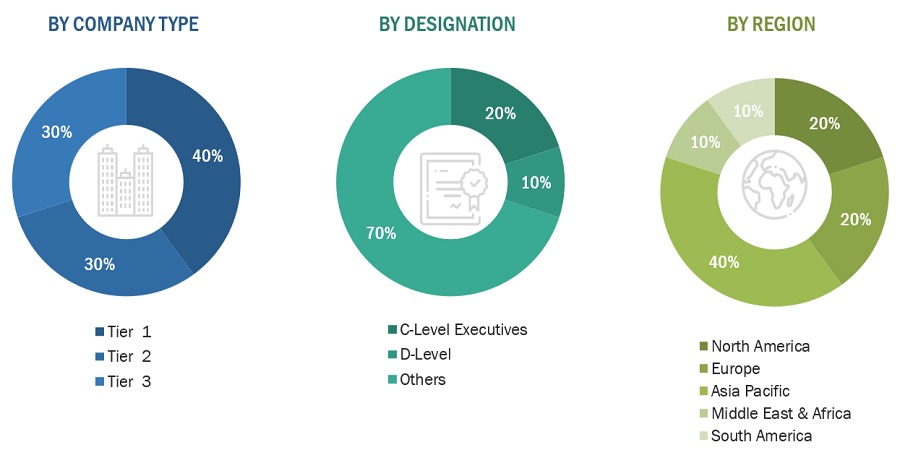
Note: Tier 1, Tier 2, and Tier 3 companies are classified based on their market revenue in 2023 available in the public domain, product portfolios, and geographical presence.
Other designations include sales representatives, production heads, and technicians.
To know about the assumptions considered for the study, download the pdf brochure
Market Size Estimation
The top-down approach was used to estimate and validate the size of various submarkets for plastic compounds for each region. The research methodology used to estimate the market size included the following steps:
- The key players in the industry have been identified through extensive secondary research.
- The supply chain of the industry has been determined through primary and secondary research.
- The global market was then segmented into five major regions and validated by industry experts.
- All percentage shares, splits, and breakdowns based on product, source, end-use industry, and region were determined using secondary sources and verified through primary sources.
- All possible parameters that affect the markets covered in this research study were accounted for, viewed in extensive detail, verified through primary research, and analyzed to get the final quantitative and qualitative data. This data was consolidated and added with detailed inputs and analysis and presented in this report.
Plastic Compounds Market: Bottum-Up Approach
Source: Secondary Research, Interviews with Experts, and MarketsandMarkets Analysis
To know about the assumptions considered for the study, Request for Free Sample Report
Plastic Compounds Market: Top-Down Approach
Source: Secondary Research, Interviews with Experts, and MarketsandMarkets Analysis
Data Triangulation
After arriving at the total market size from the estimation process plastic compounds above, the overall market has been split into several segments and sub-segments. To complete the overall market engineering process and arrive at the exact statistics for all the segments and sub-segments, the data triangulation and market breakdown procedures have been employed, wherever applicable. The data has been triangulated by studying various factors and trends from both the demand and supply sides. Along with this, the market size has been validated by using both the top-down and bottom-up approaches and primary interviews. Hence, for every data segment, there have been three sources—top-down approach, bottom-up approach, and expert interviews. The data was assumed correct when the values arrived from the three sources matched.
Market Definition
Plastic compounds are materials created by combining multiple polymers and various additives to achieve specific properties and characteristics. The compounding process involves mixing and blending polymers and additives in a molten state to produce a homogeneous blend with desired features. The compounding process enhances the properties of the final plastic product, including durability, strength, UV resistance, or flame retardancy. Common compounding methods include extrusion, co-kneading, and twin-screw mixing. Plastic compounds are tailored to specific applications and can be customized to meet customer requirements. They are widely used in industries like automotive, electronics, construction, and packaging.
Key Stakeholders
- Plastic Compounds Manufacturers
- Plastic Compounds Traders, Distributors, and Suppliers
- Raw Type Suppliers
- Government and Private Research Organizations
- Associations and Industrial Bodies
- R&D Institutions
- Environmental Support Agencies
Report Objectives
- To define, describe, and forecast the size of the plastic compounds market, in terms of value and volume.
- To provide detailed information regarding the major factors (drivers, opportunities, restraints, and challenges) influencing the growth of the market.
- To estimate and forecast the market size based on product, source, end-use industry, and region.
- To forecast the size of the market with respect to major regions, namely, Europe, North America, Asia Pacific, Middle East & Africa, and South America, along with their key countries.
- To strategically analyze micromarkets1 with respect to individual growth trends, prospects, and their contribution to the overall market.
- To analyze opportunities in the market for stakeholders and provide a competitive landscape of market leaders.
- To track and analyze recent developments such as expansions, new product launches, partnerships & agreements, and acquisitions in the market.
- To strategically profile key market players and comprehensively analyze their core competencies.
Available Customizations
Along with the given market data, MarketsandMarkets offers customizations according to the company’s specific needs. The following customization options are available for the report:
Regional Analysis
- Further breakdown of a region with respect to a particular country or additional application
Company Information
- Detailed analysis and profiles of additional market players
Tariff & Regulations
- Regulations and impact on plastic compounds market
Growth opportunities and latent adjacency in Plastic Compounds Market