Penetration Testing as a Service Market

Report Code TC 9087
Published in Jul, 2024, By MarketsandMarkets™
Download PDF

Choose License Type

Buy Report Now Inquire Before Buying

Penetration Testing as a Service Market by Offering (Solution and Managed Services), Organization Size, Testing Types, Verticals (BFSI, Healthcare, IT & ITES, Telecommunications, Retail & E-Commerce, Manufacturing, Education) - Global Forecast to 2029

Overview

The global Penetration Testing as a Service Market size was valued at $118 million in 2024 and it is projected to reach $301 billion by the end of 2029 at a CAGR of 20.5% during the forecast period. Several key factors are propelling the PTaaS market. Cyberattacks' rising frequency and sophistication have heightened the need for proactive security measures, prompting organizations to seek continuous and comprehensive testing solutions. Regulatory and compliance mandates, such as GDPR, HIPAA, and PCI DSS, require regular security assessments, further driving demand for PTaaS. The widespread adoption of digital transformation initiatives, including cloud computing, IoT, and mobile technologies, has expanded the digital attack surface, necessitating advanced penetration testing to safeguard sensitive data and systems. Additionally, the growing complexity of IT infrastructures and the shortage of skilled cybersecurity professionals make outsourced PTaaS solutions an attractive and cost-effective option for many organizations. The ability of PTaaS to provide scalable, flexible, and real-time security testing tailored to specific business needs is also a significant driver of its market growth. Multiple factors encourage the need for the PTaaS market. The escalating number and complexity of cyber threats make organizations need to identify and remediate vulnerabilities continuously. Regulatory and compliance pressures from standards like GDPR, HIPAA, and PCI DSS necessitate regular security assessments to avoid penalties and ensure data protection. The rapid adoption of digital technologies, such as cloud computing, IoT, and mobile applications, has expanded the attack surface, increasing the potential for security breaches. Additionally, the shortage of skilled cybersecurity professionals and the high costs associated with in-house security teams drive organizations to seek outsourced, cost-effective, and scalable PTaaS solutions. This approach allows businesses to leverage specialized expertise and advanced technologies to maintain a robust security posture in an ever-evolving threat landscape. Finally, the rise of global collaboration and partnerships among enterprises fuels the market.

Attractive Opportunities in the Penetration Testing as a Service Market

ASIA PACIFIC:

Market growth in Asia is driven by rapid digital transformation across industries, increasing awareness of cybersecurity risks, and strong government initiatives for data protection regulations

Increasing cyber threats and security breaches, regulatory and compliance requirements, digital transformation with the adoption of cloud services and IoT devices, and a shift towards remote work drive the market.

Technological advancements and automation, expansion into new verticals and alignment of PTaaS with DevSecOps practices are factors expected to provide lucrative opportunities.

The PTaaS market in Europe is propelled by a stringent regulatory environment, particularly the GDPR, the increasing incidence of cyber threats across the region, and the growing adoption of technologies like the IoT, AI, and ML.

Balancing automation and human expertise, maintaining data confidentiality and security, and lack of skilled security professionals pose a challenge to the PTaaS market

Global Penetration Testing as a Service Market Dynamics

DRIVER: Increasing cyber threats and security breaches

As cyberattacks become more advanced, targeting critical infrastructures, financial institutions, healthcare systems, and other vital sectors, organizations are compelled to adopt proactive security measures. These escalating threats highlight the inadequacy of traditional security approaches, necessitating continuous and comprehensive penetration testing to identify and mitigate vulnerabilities before they can be exploited. PTaaS provides the expertise and advanced tools needed to simulate real-world cyberattacks, offering businesses crucial insights into their security posture and enabling them to strengthen defenses effectively. This heightened need for robust and dynamic security solutions drives the PTaaS market.

RESTRAINT: High costs and budget constraints

High costs and budget constraints represent a significant restraint for the PTaaS market. Many organizations, especially SMEs, struggle to allocate sufficient financial resources for comprehensive penetration testing services. The advanced technologies and specialized expertise required for effective PTaaS can be expensive, making it difficult for cost-sensitive businesses to justify the investment. Additionally, budget constraints often lead to prioritizing immediate operational needs over proactive cybersecurity measures, leaving organizations vulnerable to cyber threats. The perceived high costs associated with PTaaS can deter potential clients from adopting these crucial services, limiting the market's growth potential. Addressing these financial barriers is essential to expanding the adoption of PTaaS solutions across various organizations.


OPPORTUNITY: Technological advancements and automation

Innovations in AI and ML are transforming penetration testing processes by automating routine tasks, increasing the speed and accuracy of vulnerability detection, and enabling continuous security assessments. Automation tools can simulate complex attack scenarios, providing more comprehensive insights into potential security gaps while reducing the time and effort required for manual testing. These advancements allow PTaaS providers to offer more scalable and cost-effective solutions, making robust security testing accessible to various organizations. As technology continues to evolve, integrating AI and ML into PTaaS will enhance the ability to anticipate and mitigate emerging threats, creating market growth and adoption opportunities.

CHALLENGE: Lack of skilled security professionals

As the demand for advanced cybersecurity measures grows, there is a pronounced shortage of experts with the specialized skills required to conduct effective penetration testing. This skills gap hinders PTaaS providers' ability to deliver high-quality services and meet the increasing demand from organizations seeking to enhance their security posture. Moreover, the complexity of modern cyber threats necessitates continuous training and expertise, further exacerbating the challenge. To address this issue, PTaaS providers must invest in training programs, leverage automation and AI to augment human capabilities and explore partnerships to expand their talent pool. Overcoming this challenge is crucial for sustaining the growth and effectiveness of the PTaaS market.

Global Penetration Testing as a Service Market Ecosystem Analysis

By vertical, the healthcare vertical accounts for the highest CAGR during the forecast period. Due to several critical factors, the healthcare segment is anticipated to experience the highest CAGR in the PTaaS market. The healthcare industry is increasingly becoming a prime target for cyberattacks due to the sensitive nature of the data it handles, including personal health information (PHI) and medical records. The rapid digitization of healthcare services, accelerated by adopting electronic health records (EHRs), telemedicine, and connected medical devices, has expanded the digital attack surface. Regulatory requirements such as HIPAA and GDPR mandate stringent security measures and regular vulnerability assessments to protect patient data and ensure compliance. Additionally, data breaches' financial and reputational impact in the healthcare sector drives the need for proactive and continuous security testing. The integration of advanced technologies and the shift towards remote healthcare services further amplify the need for robust PTaaS solutions to safeguard critical healthcare infrastructure and maintain patient trust. These factors collectively contribute to the accelerated growth of the PTaaS market within the healthcare sector.


NORTH AMERICA Region Holds the Largest Share of the Penetration Testing as a Service Market.

North America accounts for the largest market size in the PTaaS market due to several critical factors. The region's advanced digital infrastructure and widespread adoption of cutting-edge technologies like cloud computing, IoT, and mobile applications have significantly expanded the attack surface, necessitating robust security measures. The increasing frequency and sophistication of cyberattacks targeting businesses and critical infrastructure in North America have heightened the demand for continuous and comprehensive penetration testing services. Additionally, stringent regulatory frameworks such as HIPAA and PCI DSS mandate regular security assessments to ensure compliance and protect sensitive data. The presence of numerous large enterprises and technology firms, coupled with substantial cybersecurity budgets, further drives the adoption of PTaaS solutions. Furthermore, the growing awareness of cybersecurity threats and the need for proactive risk management among organizations in North America contribute to the region's dominance in the PTaaS market.


Recent Developments of Penetration Testing as a Service Market industry

  • In May 2024, Bugcrowd (US) acquired Informer (Germany). This acquisition enhances Bugcrowd's platform capabilities, combining continuous asset discovery, vulnerability scanning, and expert penetration testing. Informer's integration will bring improved security insights and continuous monitoring to Bugcrowd's customers, providing a competitive edge in the crowdsourced security industry. In January 2024, Trustwave (US) partnered with Aquion (Australia). This collaboration bolsters cybersecurity in Australia and New Zealand, leveraging Trustwave's advanced technologies. Trustwave will now offer a comprehensive range of cybersecurity services through Aquion, aligning with Aquion's focus on delivering innovative security solutions and expanding revenue streams. In June 2023, Edgescan released its new External Attack Surface Management solution, which provides unprecedented visibility and continuous monitoring to help secure organizations of all sizes. This solution inventories, monitors, manages and protects corporate assets across a digital footprint using a hybrid approach that combines automated risk-based vulnerability intelligence with incident validation leveraging cyber analytics and human expertise. Integrated with Edgescan's Penetration Testing as a Service (PTaaS) and Risk-based Vulnerability Management (RBVM) capabilities, EASM offers complete visibility and assessment across multi-cloud and on-premises infrastructures, facilitating faster remediation and optimized incident response.
  • In September 2022, HackerOne announced enhancements to its PTaaS offering, including self-service capabilities for scoping and launching tests and new automation features to streamline the pen testing experience. These updates enable large enterprises to manage engagements more efficiently, gain real-time insights from expert pentester, and reduce security risks. The enhancements ensure faster test launches, maintain program efficiency with new automation, and deliver critical results in real-time, closing security gaps more swiftly. In November 2021, GuidePoint Security launched its Penetration Testing as a Service (PTaaS) offering. This new service combines traditional penetration tests with recurring, automated testing and continuous reporting, delivering immediate results. The PTaaS solution is designed to help organizations quickly identify and remediate security vulnerabilities, ensuring robust cybersecurity defenses.

Key Market Players

KEY PLAYERS IN THE Penetration Testing as a Service Market INCLUDE

  • Synack (US)
  • HackerOne (US)
  • Synopsys (US)
  • Intervision (US)
  • Edgescan (Ireland)
  • Bugcrowd (US)
  • Guidepoint Security (US)
  • Trustwave (US)
  • Cobalt (US)
  • NetSPI (US)
  • Veracode (US)
  • Yogosha (France)
  • Software Secured (Canada)
  • Raxis (US)
  • Vumetric Cybersecurity (Canada)
  • NowSecure (US)
  • Breachlock (US)
  • Astra Security (India)
  • Strobes Security (US)
  • Pentest People (UK)
  • Rootshell Security (UK)
  • SafeAeon (US)
  • Immuniweb (Switzerland)
  • Cyberhunter Solutions (Canada)

Want to explore hidden markets that can drive new revenue in Penetration Testing as a Service Market?

Scope of the Report

Report Attribute Details
Market size available for years 2019-2022
Base year considered 2023
Forecast period 2024–2029
Forecast units Value (USD Million)
Segments Covered Offerings, Organization Size, Testing Type, Vertical, and Region
Geographies covered North America, Europe, Asia Pacific, Middle East and Africa, and Latin America  
Companies covered Major vendors in the global PTaaS market include Synack (US), HackerOne (US), Synopsys (US), Intervision (US), Edgescan (Ireland), Bugcrowd (US), Guidepoint Security (US), Trustwave (US), Cobalt (US), NetSPI (US), Veracode (US), Yogosha (France), Software Secured (Canada), Raxis (US), Vumetric Cybersecurity (Canada), Nowsecure (US), Breachlock (US), Astra Security (India), Strobes Security (US), Pentest People (UK), Rootshell Security (UK), SafeAeon (US), Immuniweb (Switzerland), and Cyberhunter Solutions (Canada).    


Personalize This Research

  • Triangulate with your Own Data
  • Get Data as per your Format and Definition
  • Gain a Deeper Dive on a Specific Application, Geography, Customer or Competitor
  • Any level of Personalization
Request A Free Customisation

Let Us Help You

  • What are the Known and Unknown Adjacencies Impacting the Penetration Testing as a Service Market
  • What will your New Revenue Sources be?
  • Who will be your Top Customer; what will make them switch?
  • Defend your Market Share or Win Competitors
  • Get a Scorecard for Target Partners
Customized Workshop Request

Table of Contents

Exclusive indicates content/data unique to MarketsandMarkets and not available with any competitors.

TITLE
PAGE NO
INTRODUCTION
30
RESEARCH METHODOLOGY
35
EXECUTIVE SUMMARY
45
PREMIUM INSIGHTS
48
MARKET OVERVIEW AND INDUSTRY TRENDS
51
  • 5.1 INTRODUCTION
  • 5.2 MARKET DYNAMICS
    DRIVERS
    - Increasing cyber threats and security breaches
    - Need for thorough security testing and detailed reports demonstrating adherence to industry standards
    - Rising digital transformation initiatives and widespread adoption of cloud services and IoT devices
    - Shift toward remote work
    RESTRAINTS
    - High costs and budget constraints
    - Complexity in integration with existing security workflows
    OPPORTUNITIES
    - Technological advancements and automation
    - Expansion into new verticals
    - Alignment of PTaaS with DevSecOps practices
    CHALLENGES
    - Balancing automation and human expertise
    - Maintaining data confidentiality and security
    - Lack of skilled security professionals
  • 5.3 TRENDS/DISRUPTIONS IMPACTING CUSTOMERS’ BUSINESSES
  • 5.4 PRICING ANALYSIS
    AVERAGE SELLING PRICE TREND OF KEY PLAYERS, BY OFFERING
    INDICATIVE PRICING ANALYSIS, BY VENDOR
  • 5.5 VALUE CHAIN ANALYSIS
    PENETRATION TESTING AS A SERVICE PROVIDERS
    TECHNOLOGY PROVIDERS
    CONSULTANTS AND INTEGRATORS
    REGULATORY BODIES AND STANDARDS
    DISTRIBUTORS, RESELLERS, AND VALUE-ADDED RESELLERS (CONSULTATION)
    END USERS
  • 5.6 ECOSYSTEM
  • 5.7 TECHNOLOGY ANALYSIS
    KEY TECHNOLOGIES
    - Vulnerability scanners
    - Exploitation tools
    - Web Application Security Scanners (WAST)
    COMPLEMENTARY TECHNOLOGIES
    - SIEM
    - Vulnerability Management Platforms (VMPs)
    - CSPM
    - SOAR
    ADJACENT TECHNOLOGIES
    - Endpoint Detection and Response (EDR)
    - Next-Generation Firewalls (NGFWs)
    - IAM
  • 5.8 TECHNOLOGY ROADMAP
    PHASES OF PENETRATION TESTING AS A SERVICE MARKET
  • 5.9 PATENT ANALYSIS
    LIST OF MAJOR PATENTS
  • 5.10 KEY CONFERENCES AND EVENTS, 2024–2025
  • 5.11 REGULATORY LANDSCAPE
    REGULATORY BODIES, GOVERNMENT AGENCIES, AND OTHER ORGANIZATIONS
  • 5.12 PORTER’S FIVE FORCES ANALYSIS
    THREAT OF NEW ENTRANTS
    THREAT OF SUBSTITUTES
    BARGAINING POWER OF SUPPLIERS
    BARGAINING POWER OF BUYERS
    INTENSITY OF COMPETITIVE RIVALRY
  • 5.13 KEY STAKEHOLDERS & BUYING CRITERIA
    KEY STAKEHOLDERS IN BUYING PROCESS
    BUYING CRITERIA
  • 5.14 BEST PRACTICES IN PENETRATION TESTING AS A SERVICE MARKET
  • 5.15 EVOLUTION OF PENETRATION TESTING AS A SERVICE TECHNOLOGY
    EARLY FOUNDATIONS AND EVOLUTION
    RISE OF AGILE AND DEVOPS
    EMERGENCE OF PENETRATION AS A SERVICE
    MODERN APPLICATIONS AND FUTURE TRENDS
  • 5.16 BUSINESS MODEL ANALYSIS
    PROJECT-BASED PENETRATION TESTING
    SUBSCRIPTION-BASED PENETRATION TESTING
    CROWDSOURCED PENETRATION TESTING
    PENETRATION TESTING AS A SERVICE (PTAAS)
    HYBRID PENETRATION TESTING MODEL
  • 5.17 INVESTMENT AND FUNDING SCENARIO
  • 5.18 CASE STUDY ANALYSIS
    BUGCROWD HELPED RAPYD ELEVATE SECURITY WITH PENETRATION AS A SERVICE AND BUG BOUNTY PROGRAMS
    PARSEUR ACHIEVED ROBUST SECURITY WITH ASTRA SECURITY’S PENETRATION TESTING AS A SERVICE
    GONG ENHANCED SECURITY WITH NETSPI’S PENETRATION TESTING AS A SERVICE
PENETRATION TESTING AS A SERVICE MARKET, BY OFFERING
94
  • 6.1 INTRODUCTION
    OFFERINGS: MARKET DRIVERS
  • 6.2 SOLUTIONS
    COMPLIANCE WITH STRINGENT REGULATORY REQUIREMENTS AND FLEXIBILITY TO INTEGRATE WITH EXISTING SECURITY INFRASTRUCTURES TO DRIVE MARKET
  • 6.3 MANAGED SERVICES
    NEED FOR EXPERT-DRIVEN AND COMPREHENSIVE SECURITY ASSESSMENTS TO FUEL MARKET GROWTH
PENETRATION TESTING AS A SERVICE MARKET, BY ORGANIZATION SIZE
99
  • 7.1 INTRODUCTION
    ORGANIZATION SIZES: MARKET DRIVERS
  • 7.2 SMALL AND MEDIUM-SIZED ENTERPRISES
    INCREASING NEED FOR AFFORDABLE AND EFFECTIVE CYBERSECURITY SOLUTIONS TO BOOST MARKET GROWTH
  • 7.3 LARGE ENTERPRISES
    COMPLEX AND EXPANSIVE IT INFRASTRUCTURES TO FOSTER DEMAND FOR PEN-TEST SERVICES
PENETRATION TESTING AS A SERVICE MARKET, BY TESTING TYPE
104
  • 8.1 INTRODUCTION
    TESTING TYPES: MARKET DRIVERS
  • 8.2 WEB APPLICATION TESTING
    NEED TO IDENTIFY AND MITIGATE VULNERABILITIES IN WEB-BASED APPLICATIONS TO BOOST MARKET
  • 8.3 MOBILE APPLICATION TESTING
    RISING ADOPTION OF MOBILE APPLICATIONS FOR BUSINESS OPERATIONS, CUSTOMER ENGAGEMENT, AND TRANSACTION PROCESSING TO DRIVE DEMAND
  • 8.4 NETWORK/DEVICE TESTING
    INCREASING COMPLEXITY OF IT INFRASTRUCTURES AND PROLIFERATION OF IOT DEVICES TO ACCELERATE MARKET GROWTH
  • 8.5 CLOUD TESTING
    WIDESPREAD ADOPTION OF CLOUD AND INCREASING RELIANCE ON CLOUD INFRASTRUCTURE TO PROPEL MARKET
  • 8.6 SOCIAL ENGINEERING
    INCREASING SOPHISTICATION AND FREQUENCY OF SOCIAL ENGINEERING ATTACKS TO BOOST MARKET GROWTH
PENETRATION TESTING AS A SERVICE MARKET, BY VERTICAL
112
  • 9.1 INTRODUCTION
    VERTICALS: MARKET DRIVERS
  • 9.2 BANKING, FINANCIAL SERVICES, AND INSURANCE (BFSI)
    STRINGENT REGULATORY REQUIREMENTS AND NEED TO PROTECT SENSITIVE FINANCIAL DATA TO FOSTER MARKET GROWTH
  • 9.3 HEALTHCARE
    GROWTH IN CYBERATTACKS AND NEED FOR CONFIDENTIALITY OF DATA TO DRIVE ADOPTION OF PEN-TEST SOLUTIONS
  • 9.4 IT & ITES
    INCREASED ADOPTION OF CLOUD, IOT, AND AI AND BY SURGE IN CYBERATTACKS TO STRENGTHEN MARKET
  • 9.5 TELECOMMUNICATIONS
    INCREASING DEMAND FOR HIGH-SPEED INTERNET, ROLLOUT OF 5G TECHNOLOGY, AND PROLIFERATION OF IOT DEVICES TO FUEL MARKET GROWTH
  • 9.6 RETAIL & ECOMMERCE
    EXPONENTIAL GROWTH IN ONLINE SHOPPING AND DIGITAL PAYMENTS AND NEED TO ENSURE INTEGRITY OF ONLINE TRANSACTIONS TO DRIVE MARKET GROWTH
  • 9.7 MANUFACTURING
    NEED TO SECURE DIGITAL INFRASTRUCTURE, ENHANCE COMPLIANCE, AND SAFEGUARD AGAINST DISRUPTIONS TO ELEVATE MARKET GROWTH
  • 9.8 EDUCATION
    GROWING RELIANCE ON DIGITAL PLATFORMS FOR LEARNING, ADMINISTRATION, AND RESEARCH TO DRIVE MARKET
  • 9.9 OTHER VERTICALS
PENETRATION TESTING AS A SERVICE MARKET, BY REGION
123
  • 10.1 INTRODUCTION
  • 10.2 NORTH AMERICA
    NORTH AMERICA: MARKET DRIVERS
    NORTH AMERICA: RECESSION IMPACT
    US
    - Increasing cyberattacks and large presence of PTaaS vendors to fuel market
    CANADA
    - Increasing need for robust cybersecurity measures amidst rising cyber threats to foster market growth
  • 10.3 EUROPE
    EUROPE: MARKET DRIVERS
    EUROPE: RECESSION IMPACT
    UK
    - Rising instances of cybercrime and strict cybersecurity regulations to drive market
    GERMANY
    - Technological advancements and growing industrial automation to propel market
    FRANCE
    - Increased investment in digitalization by government and enterprises and rising regulatory scrutiny to boost market growth
    ITALY
    - Increasing awareness of cybersecurity threats and need for robust defense mechanism to accelerate market growth
    REST OF EUROPE
  • 10.4 ASIA PACIFIC
    ASIA PACIFIC: MARKET DRIVERS
    ASIA PACIFIC: RECESSION IMPACT
    CHINA
    - Rising digitization, stringent regulations, and growing cyber threats to enhance market growth
    JAPAN
    - Increased investments in penetration testing services and government initiatives to elevate market
    INDIA
    - Digitalization and rapidly increasing internet penetration to fuel demand for PTaaS solutions
    REST OF ASIA PACIFIC
  • 10.5 MIDDLE EAST & AFRICA
    MIDDLE EAST & AFRICA: PENETRATION TESTING AS A SERVICE MARKET DRIVERS
    MIDDLE EAST & AFRICA: RECESSION IMPACT
    MIDDLE EAST
    - Highest social media penetration rates, digitalization initiatives, and growing instances of cyberattacks to propel market
    - GCC countries
    - Rest of Middle East
    AFRICA
    - Rising digitalization, internet usage, and increasing cyber threats to drive market
  • 10.6 LATIN AMERICA
    LATIN AMERICA: MARKET DRIVERS
    LATIN AMERICA: RECESSION IMPACT
    BRAZIL
    - Largest eCommerce industry and strict data protection laws to boost market growth
    MEXICO
    - Trade agreements with US and Canada to fuel market growth
    REST OF LATIN AMERICA
COMPETITIVE LANDSCAPE
205
  • 11.1 INTRODUCTION
  • 11.2 KEY PLAYER STRATEGIES/RIGHT TO WIN
    OVERVIEW OF STRATEGIES ADOPTED BY KEY PENETRATION TESTING AS A SERVICE VENDORS
  • 11.3 REVENUE ANALYSIS
  • 11.4 MARKET SHARE ANALYSIS
  • 11.5 COMPANY EVALUATION MATRIX: KEY PLAYERS, 2023
    STARS
    EMERGING LEADERS
    PERVASIVE PLAYERS
    PARTICIPANTS
    COMPANY FOOTPRINT: KEY PLAYERS, 2023
    - Company footprint
    - Offering footprint
    - Testing type footprint
    - Vertical footprint
    - Regional footprint
  • 11.6 COMPANY EVALUATION MATRIX: START-UPS/SMES, 2023
    PROGRESSIVE COMPANIES
    RESPONSIVE COMPANIES
    DYNAMIC COMPANIES
    STARTING BLOCKS
    COMPETITIVE BENCHMARKING: START-UPS/SMES, 2023
    - Key start-ups/SMEs
    - Competitive benchmarking of key start-ups/SMEs
  • 11.7 COMPANY VALUATION AND FINANCIAL METRICS OF KEY PENETRATION TESTING AS A SERVICE VENDORS
  • 11.8 BRAND/PRODUCT COMPARISON
  • 11.9 COMPETITIVE SCENARIO AND TRENDS
    PRODUCT LAUNCHES AND ENHANCEMENTS
    DEALS
COMPANY PROFILES
233
  • 12.1 KEY PLAYERS
    SYNACK
    - Business overview
    - Products/Solutions/Services offered
    - Recent developments
    - MnM view
    HACKERONE
    - Business overview
    - Products/Solutions/Services offered
    - Recent developments
    - MnM view
    SYNOPSYS
    - Business overview
    - Products/Solutions/Services offered
    - Recent developments
    - MnM view
    INTERVISION SYSTEMS
    - Business overview
    - Products/Solutions/Services offered
    - Recent developments
    - MnM view
    EDGESCAN
    - Business overview
    - Products/Solutions/Services offered
    - Recent developments
    - MnM view
    BUGCROWD
    - Business overview
    - Products/Solutions/Services offered
    - Recent developments
    - MnM view
    GUIDEPOINT SECURITY
    - Business overview
    - Products/Solutions/Services offered
    - Recent developments
    - MnM view
    TRUSTWAVE
    - Business overview
    - Products/Solutions/Services offered
    - Recent developments
    - MnM view
    COBALT
    - Business overview
    - Products/Solutions/Services offered
    - Recent developments
    NETSPI
    - Business overview
    - Products/Solutions/Services offered
    - Recent developments
    VERACODE
    - Business overview
    - Products/Solutions/Services offered
    - Recent developments
    YOGOSHA
    - Business overview
    - Products/Solutions/Services offered
    - Recent developments
    SOFTWARE SECURED
    - Business overview
    - Products/Solutions/Services offered
    RAXIS
    - Business overview
    - Products/Solutions/Services offered
    VUMETRIC CYBERSECURITY
    - Business overview
    - Products/Solutions/Services offered
    - Recent developments
    NOWSECURE
    - Business overview
    - Products/Solutions/Services offered
    - Recent developments
  • 12.2 OTHER PLAYERS
    BREACHLOCK
    ASTRA SECURITY
    STROBES SECURITY
    PENTEST PEOPLE
    ROOTSHELL SECURITY
    SAFEAEON
    IMMUNIWEB
    CYBERHUNTER SOLUTIONS
ADJACENT MARKETS
283
  • 13.1 INTRODUCTION
  • 13.2 LIMITATIONS
  • 13.3 PENETRATION TESTING MARKET
  • 13.4 AUTOMATED BREACH AND ATTACK SIMULATION MARKET
  • 13.5 SECURITY TESTING MARKET
APPENDIX
297
  • 14.1 DISCUSSION GUIDE
  • 14.2 KNOWLEDGESTORE: MARKETSANDMARKETS’ SUBSCRIPTION PORTAL
  • 14.3 CUSTOMIZATION OPTIONS
  • 14.4 RELATED REPORTS
  • 14.5 AUTHOR DETAILS
LIST OF TABLES
 
  • TABLE 1 USD EXCHANGE RATES, 2020–2023
  • TABLE 2 FACTOR ANALYSIS
  • TABLE 3 TYPES OF PENETRATION TESTING AND THEIR COSTS
  • TABLE 4 PENETRATION TESTING METHODOLOGIES AND THEIR PRICING
  • TABLE 5 AVERAGE SELLING PRICE OF KEY PLAYERS, BY OFFERING
  • TABLE 6 INDICATIVE PRICING LEVELS OF PENETRATION TESTING AS A SERVICE SOLUTIONS, BY VENDOR
  • TABLE 7 PENETRATION TESTING AS A SERVICE MARKET: ECOSYSTEM
  • TABLE 8 PENETRATION TESTING AS A SERVICE MARKET: CONFERENCES AND EVENTS, 2024–2025
  • TABLE 9 NORTH AMERICA: LIST OF REGULATORY BODIES, GOVERNMENT AGENCIES, AND OTHER ORGANIZATIONS
  • TABLE 10 EUROPE: LIST OF REGULATORY BODIES, GOVERNMENT AGENCIES, AND OTHER ORGANIZATIONS
  • TABLE 11 ASIA PACIFIC: LIST OF REGULATORY BODIES, GOVERNMENT AGENCIES, AND OTHER ORGANIZATIONS
  • TABLE 12 MIDDLE EAST & AFRICA: LIST OF REGULATORY BODIES, GOVERNMENT AGENCIES, AND OTHER ORGANIZATIONS
  • TABLE 13 LATIN AMERICA: LIST OF REGULATORY BODIES, GOVERNMENT AGENCIES, AND OTHER ORGANIZATIONS
  • TABLE 14 PORTER’S FIVE FORCES IMPACT ON PENETRATION TESTING AS A SERVICE MARKET
  • TABLE 15 INFLUENCE OF STAKEHOLDERS ON BUYING PROCESS FOR TOP THREE VERTICALS
  • TABLE 16 KEY BUYING CRITERIA FOR TOP VERTICALS
  • TABLE 17 MARKET, BY OFFERING, 2019–2023 (USD MILLION)
  • TABLE 18 PENETRATION TESTING AS A SERVICE MARKET, BY OFFERING, 2024–2029 (USD MILLION)
  • TABLE 19 SOLUTIONS: MARKET, BY REGION, 2019–2023 (USD MILLION)
  • TABLE 20 SOLUTIONS: MARKET, BY REGION, 2024–2029 (USD MILLION)
  • TABLE 21 MANAGED SERVICES: MARKET, BY REGION, 2019–2023 (USD MILLION)
  • TABLE 22 MANAGED SERVICES: MARKET, BY REGION, 2024–2029 (USD MILLION)
  • TABLE 23 MARKET, BY ORGANIZATION SIZE, 2019–2023 (USD MILLION)
  • TABLE 24 PENETRATION TESTING AS A SERVICE MARKET, BY ORGANIZATION SIZE, 2024–2029 (USD MILLION)
  • TABLE 25 SMES: MARKET, BY REGION, 2019–2023 (USD MILLION)
  • TABLE 26 SMES: MARKET, BY REGION, 2024–2029 (USD MILLION)
  • TABLE 27 LARGE ENTERPRISES: MARKET, BY REGION, 2019–2023 (USD MILLION)
  • TABLE 28 LARGE ENTERPRISES: MARKET, BY REGION, 2024–2029 (USD MILLION)
  • TABLE 29 MARKET, BY TESTING TYPE, 2019–2023 (USD MILLION)
  • TABLE 30 PENETRATION TESTING AS A SERVICE MARKET, BY TESTING TYPE, 2024–2029 (USD MILLION)
  • TABLE 31 WEB APPLICATION TESTING: MARKET, BY REGION, 2019–2023 (USD MILLION)
  • TABLE 32 WEB APPLICATION TESTING: MARKET, BY REGION, 2024–2029 (USD MILLION)
  • TABLE 33 MOBILE APPLICATION TESTING: MARKET, BY REGION, 2019–2023 (USD MILLION)
  • TABLE 34 MOBILE APPLICATION TESTING: MARKET, BY REGION, 2024–2029 (USD MILLION)
  • TABLE 35 NETWORK/DEVICE TESTING: MARKET, BY REGION, 2019–2023 (USD MILLION)
  • TABLE 36 NETWORK/DEVICE TESTING: MARKET, BY REGION, 2024–2029 (USD MILLION)
  • TABLE 37 CLOUD TESTING: MARKET, BY REGION, 2019–2023 (USD MILLION)
  • TABLE 38 CLOUD TESTING: MARKET, BY REGION, 2024–2029 (USD MILLION)
  • TABLE 39 SOCIAL ENGINEERING: MARKET, BY REGION, 2019–2023 (USD MILLION)
  • TABLE 40 SOCIAL ENGINEERING: MARKET, BY REGION, 2024–2029 (USD MILLION)
  • TABLE 41 MARKET, BY VERTICAL, 2019–2023 (USD MILLION)
  • TABLE 42 PENETRATION TESTING AS A SERVICE MARKET, BY VERTICAL, 2024–2029 (USD MILLION)
  • TABLE 43 BANKING, FINANCIAL SERVICES, AND INSURANCE (BFSI): MARKET, BY REGION, 2019–2023 (USD MILLION)
  • TABLE 44 BANKING, FINANCIAL SERVICES, AND INSURANCE (BFSI): MARKET, BY REGION, 2024–2029 (USD MILLION)
  • TABLE 45 HEALTHCARE: MARKET, BY REGION, 2019–2023 (USD MILLION)
  • TABLE 46 HEALTHCARE: MARKET, BY REGION, 2024–2029 (USD MILLION)
  • TABLE 47 IT & ITES: MARKET, BY REGION, 2019–2023 (USD MILLION)
  • TABLE 48 IT & ITES: MARKET, BY REGION, 2024–2029 (USD MILLION)
  • TABLE 49 TELECOMMUNICATIONS: MARKET, BY REGION, 2019–2023 (USD MILLION)
  • TABLE 50 TELECOMMUNICATIONS: MARKET, BY REGION, 2024–2029 (USD MILLION)
  • TABLE 51 RETAIL & ECOMMERCE: MARKET, BY REGION, 2019–2023 (USD MILLION)
  • TABLE 52 RETAIL & ECOMMERCE: MARKET, BY REGION, 2024–2029 (USD MILLION)
  • TABLE 53 MANUFACTURING: MARKET, BY REGION, 2019–2023 (USD MILLION)
  • TABLE 54 MANUFACTURING: MARKET, BY REGION, 2024–2029 (USD MILLION)
  • TABLE 55 EDUCATION: MARKET, BY REGION, 2019–2023 (USD MILLION)
  • TABLE 56 EDUCATION: MARKET, BY REGION, 2024–2029 (USD MILLION)
  • TABLE 57 PENETRATION TESTING AS A SERVICE MARKET, BY REGION, 2019–2023 (USD MILLION)
  • TABLE 58 MARKET, BY REGION, 2024–2029 (USD MILLION)
  • TABLE 59 NORTH AMERICA: MARKET, BY OFFERING, 2019–2023 (USD MILLION)
  • TABLE 60 NORTH AMERICA: MARKET, BY OFFERING, 2024–2029 (USD MILLION)
  • TABLE 61 NORTH AMERICA: MARKET, BY ORGANIZATION SIZE, 2019–2023 (USD MILLION)
  • TABLE 62 NORTH AMERICA: PENETRATION TESTING AS A SERVICE MARKET, BY ORGANIZATION SIZE, 2024–2029 (USD MILLION)
  • TABLE 63 NORTH AMERICA: MARKET, BY TESTING TYPE, 2019–2023 (USD MILLION)
  • TABLE 64 NORTH AMERICA: MARKET, BY TESTING TYPE, 2024–2029 (USD MILLION)
  • TABLE 65 NORTH AMERICA: MARKET, BY VERTICAL, 2019–2023 (USD MILLION)
  • TABLE 66 NORTH AMERICA: MARKET, BY VERTICAL, 2024–2029 (USD MILLION)
  • TABLE 67 NORTH AMERICA: MARKET, BY COUNTRY, 2019–2023 (USD MILLION)
  • TABLE 68 NORTH AMERICA: MARKET, BY COUNTRY, 2024–2029 (USD MILLION)
  • TABLE 69 US: MARKET, BY OFFERING, 2019–2023 (USD MILLION)
  • TABLE 70 US: MARKET, BY OFFERING, 2024–2029 (USD MILLION)
  • TABLE 71 US: MARKET, BY ORGANIZATION SIZE, 2019–2023 (USD MILLION)
  • TABLE 72 US: MARKET, BY ORGANIZATION SIZE, 2024–2029 (USD MILLION)
  • TABLE 73 US: MARKET, BY TESTING TYPE, 2019–2023 (USD MILLION)
  • TABLE 74 US: MARKET, BY TESTING TYPE, 2024–2029 (USD MILLION)
  • TABLE 75 US: MARKET, BY VERTICAL, 2019–2023 (USD MILLION)
  • TABLE 76 US: MARKET, BY VERTICAL, 2024–2029 (USD MILLION)
  • TABLE 77 CANADA: MARKET, BY OFFERING, 2019–2023 (USD MILLION)
  • TABLE 78 CANADA: MARKET, BY OFFERING, 2024–2029 (USD MILLION)
  • TABLE 79 CANADA: MARKET, BY ORGANIZATION SIZE, 2019–2023 (USD MILLION)
  • TABLE 80 CANADA: MARKET, BY ORGANIZATION SIZE, 2024–2029 (USD MILLION)
  • TABLE 81 CANADA: MARKET, BY TESTING TYPE, 2019–2023 (USD MILLION)
  • TABLE 82 CANADA: MARKET, BY TESTING TYPE, 2024–2029 (USD MILLION)
  • TABLE 83 CANADA: MARKET, BY VERTICAL, 2019–2023 (USD MILLION)
  • TABLE 84 CANADA: MARKET, BY VERTICAL, 2024–2029 (USD MILLION)
  • TABLE 85 EUROPE: PENETRATION TESTING AS A SERVICE MARKET, BY OFFERING, 2019–2023 (USD MILLION)
  • TABLE 86 EUROPE: MARKET, BY OFFERING, 2024–2029 (USD MILLION)
  • TABLE 87 EUROPE: MARKET, BY ORGANIZATION SIZE, 2019–2023 (USD MILLION)
  • TABLE 88 EUROPE: MARKET, BY ORGANIZATION SIZE, 2024–2029 (USD MILLION)
  • TABLE 89 EUROPE: MARKET, BY TESTING TYPE, 2019–2023 (USD MILLION)
  • TABLE 90 EUROPE: MARKET, BY TESTING TYPE, 2024–2029 (USD MILLION)
  • TABLE 91 EUROPE: MARKET, BY VERTICAL, 2019–2023 (USD MILLION)
  • TABLE 92 EUROPE: MARKET, BY VERTICAL, 2024–2029 (USD MILLION)
  • TABLE 93 EUROPE: MARKET, BY COUNTRY, 2019–2023 (USD MILLION)
  • TABLE 94 EUROPE: MARKET, BY COUNTRY, 2024–2029 (USD MILLION)
  • TABLE 95 UK: MARKET, BY OFFERING, 2019–2023 (USD MILLION)
  • TABLE 96 UK: MARKET, BY OFFERING, 2024–2029 (USD MILLION)
  • TABLE 97 UK: MARKET, BY ORGANIZATION SIZE, 2019–2023 (USD MILLION)
  • TABLE 98 UK: MARKET, BY ORGANIZATION SIZE, 2024–2029 (USD MILLION)
  • TABLE 99 UK: MARKET, BY TESTING TYPE, 2019–2023 (USD MILLION)
  • TABLE 100 UK: MARKET, BY TESTING TYPE, 2024–2029 (USD MILLION)
  • TABLE 101 UK: MARKET, BY VERTICAL, 2019–2023 (USD MILLION)
  • TABLE 102 UK: MARKET, BY VERTICAL, 2024–2029 (USD MILLION)
  • TABLE 103 GERMANY: PENETRATION TESTING AS A SERVICE MARKET, BY OFFERING, 2019–2023 (USD MILLION)
  • TABLE 104 GERMANY: MARKET, BY OFFERING, 2024–2029 (USD MILLION)
  • TABLE 105 GERMANY: MARKET, BY ORGANIZATION SIZE, 2019–2023 (USD MILLION)
  • TABLE 106 GERMANY: MARKET, BY ORGANIZATION SIZE, 2024–2029 (USD MILLION)
  • TABLE 107 GERMANY: MARKET, BY TESTING TYPE, 2019–2023 (USD MILLION)
  • TABLE 108 GERMANY: MARKET, BY TESTING TYPE, 2024–2029 (USD MILLION)
  • TABLE 109 GERMANY: MARKET, BY VERTICAL, 2019–2023 (USD MILLION)
  • TABLE 110 GERMANY: MARKET, BY VERTICAL, 2024–2029 (USD MILLION)
  • TABLE 111 FRANCE: MARKET, BY OFFERING, 2019–2023 (USD MILLION)
  • TABLE 112 FRANCE: MARKET, BY OFFERING, 2024–2029 (USD MILLION)
  • TABLE 113 FRANCE: MARKET, BY ORGANIZATION SIZE, 2019–2023 (USD MILLION)
  • TABLE 114 FRANCE: MARKET, BY ORGANIZATION SIZE, 2024–2029 (USD MILLION)
  • TABLE 115 FRANCE: MARKET, BY TESTING TYPE, 2019–2023 (USD MILLION)
  • TABLE 116 FRANCE: MARKET, BY TESTING TYPE, 2024–2029 (USD MILLION)
  • TABLE 117 FRANCE: MARKET, BY VERTICAL, 2019–2023 (USD MILLION)
  • TABLE 118 FRANCE: MARKET, BY VERTICAL, 2024–2029 (USD MILLION)
  • TABLE 119 ITALY: MARKET, BY OFFERING, 2019–2023 (USD MILLION)
  • TABLE 120 ITALY: MARKET, BY OFFERING, 2024–2029 (USD MILLION)
  • TABLE 121 ITALY: MARKET, BY ORGANIZATION SIZE, 2019–2023 (USD MILLION)
  • TABLE 122 ITALY: MARKET, BY ORGANIZATION SIZE, 2024–2029 (USD MILLION)
  • TABLE 123 ITALY: MARKET, BY TESTING TYPE, 2019–2023 (USD MILLION)
  • TABLE 124 ITALY: MARKET, BY TESTING TYPE, 2024–2029 (USD MILLION)
  • TABLE 125 ITALY: MARKET, BY VERTICAL, 2019–2023 (USD MILLION)
  • TABLE 126 ITALY: MARKET, BY VERTICAL, 2024–2029 (USD MILLION)
  • TABLE 127 REST OF EUROPE: MARKET, BY OFFERING, 2019–2023 (USD MILLION)
  • TABLE 128 REST OF EUROPE: PENETRATION TESTING AS A SERVICE MARKET, BY OFFERING, 2024–2029 (USD MILLION)
  • TABLE 129 REST OF EUROPE: MARKET, BY ORGANIZATION SIZE, 2019–2023 (USD MILLION)
  • TABLE 130 REST OF EUROPE: MARKET, BY ORGANIZATION SIZE, 2024–2029 (USD MILLION)
  • TABLE 131 REST OF EUROPE: MARKET, BY TESTING TYPE, 2019–2023 (USD MILLION)
  • TABLE 132 REST OF EUROPE: MARKET, BY TESTING TYPE, 2024–2029 (USD MILLION)
  • TABLE 133 REST OF EUROPE: MARKET, BY VERTICAL, 2019–2023 (USD MILLION)
  • TABLE 134 REST OF EUROPE: MARKET, BY VERTICAL, 2024–2029 (USD MILLION)
  • TABLE 135 ASIA PACIFIC: MARKET, BY OFFERING, 2019–2023 (USD MILLION)
  • TABLE 136 ASIA PACIFIC: PENETRATION TESTING AS A SERVICE MARKET, BY OFFERING, 2024–2029 (USD MILLION)
  • TABLE 137 ASIA PACIFIC: MARKET, BY ORGANIZATION SIZE, 2019–2023 (USD MILLION)
  • TABLE 138 ASIA PACIFIC: MARKET, BY ORGANIZATION SIZE, 2024–2029 (USD MILLION)
  • TABLE 139 ASIA PACIFIC: MARKET, BY TESTING TYPE, 2019–2023 (USD MILLION)
  • TABLE 140 ASIA PACIFIC: MARKET, BY TESTING TYPE, 2024–2029 (USD MILLION)
  • TABLE 141 ASIA PACIFIC: MARKET, BY VERTICAL, 2019–2023 (USD MILLION)
  • TABLE 142 ASIA PACIFIC: MARKET, BY VERTICAL, 2024–2029 (USD MILLION)
  • TABLE 143 ASIA PACIFIC: MARKET, BY COUNTRY, 2019–2023 (USD MILLION)
  • TABLE 144 ASIA PACIFIC: MARKET, BY COUNTRY, 2024–2029 (USD MILLION)
  • TABLE 145 CHINA: MARKET, BY OFFERING, 2019–2023 (USD MILLION)
  • TABLE 146 CHINA: MARKET, BY OFFERING, 2024–2029 (USD MILLION)
  • TABLE 147 CHINA: MARKET, BY ORGANIZATION SIZE, 2019–2023 (USD MILLION)
  • TABLE 148 CHINA: MARKET, BY ORGANIZATION SIZE, 2024–2029 (USD MILLION)
  • TABLE 149 CHINA: MARKET, BY TESTING TYPE, 2019–2023 (USD MILLION)
  • TABLE 150 CHINA: MARKET, BY TESTING TYPE, 2024–2029 (USD MILLION)
  • TABLE 151 CHINA: MARKET, BY VERTICAL, 2019–2023 (USD MILLION)
  • TABLE 152 CHINA: MARKET, BY VERTICAL, 2024–2029 (USD MILLION)
  • TABLE 153 JAPAN: MARKET, BY OFFERING, 2019–2023 (USD MILLION)
  • TABLE 154 JAPAN: PENETRATION TESTING AS A SERVICE MARKET, BY OFFERING, 2024–2029 (USD MILLION)
  • TABLE 155 JAPAN: MARKET, BY ORGANIZATION SIZE, 2019–2023 (USD MILLION)
  • TABLE 156 JAPAN: MARKET, BY ORGANIZATION SIZE, 2024–2029 (USD MILLION)
  • TABLE 157 JAPAN: MARKET, BY TESTING TYPE, 2019–2023 (USD MILLION)
  • TABLE 158 JAPAN: MARKET, BY TESTING TYPE, 2024–2029 (USD MILLION)
  • TABLE 159 JAPAN: MARKET, BY VERTICAL, 2019–2023 (USD MILLION)
  • TABLE 160 JAPAN: MARKET, BY VERTICAL, 2024–2029 (USD MILLION)
  • TABLE 161 INDIA: MARKET, BY OFFERING, 2019–2023 (USD MILLION)
  • TABLE 162 INDIA: MARKET, BY OFFERING, 2024–2029 (USD MILLION)
  • TABLE 163 INDIA: MARKET, BY ORGANIZATION SIZE, 2019–2023 (USD MILLION)
  • TABLE 164 INDIA: MARKET, BY ORGANIZATION SIZE, 2024–2029 (USD MILLION)
  • TABLE 165 INDIA: MARKET, BY TESTING TYPE, 2019–2023 (USD MILLION)
  • TABLE 166 INDIA: MARKET, BY TESTING TYPE, 2024–2029 (USD MILLION)
  • TABLE 167 INDIA: MARKET, BY VERTICAL, 2019–2023 (USD MILLION)
  • TABLE 168 INDIA: MARKET, BY VERTICAL, 2024–2029 (USD MILLION)
  • TABLE 169 REST OF ASIA PACIFIC: MARKET, BY OFFERING, 2019–2023 (USD MILLION)
  • TABLE 170 REST OF ASIA PACIFIC: PENETRATION TESTING AS A SERVICE MARKET, BY OFFERING, 2024–2029 (USD MILLION)
  • TABLE 171 REST OF ASIA PACIFIC: MARKET, BY ORGANIZATION SIZE, 2019–2023 (USD MILLION)
  • TABLE 172 REST OF ASIA PACIFIC: MARKET, BY ORGANIZATION SIZE, 2024–2029 (USD MILLION)
  • TABLE 173 REST OF ASIA PACIFIC: MARKET, BY TESTING TYPE, 2019–2023 (USD MILLION)
  • TABLE 174 REST OF ASIA PACIFIC: MARKET, BY TESTING TYPE, 2024–2029 (USD MILLION)
  • TABLE 175 REST OF ASIA PACIFIC: MARKET, BY VERTICAL, 2019–2023 (USD MILLION)
  • TABLE 176 REST OF ASIA PACIFIC: MARKET, BY VERTICAL, 2024–2029 (USD MILLION)
  • TABLE 177 MIDDLE EAST & AFRICA: MARKET, BY OFFERING, 2019–2023 (USD MILLION)
  • TABLE 178 MIDDLE EAST & AFRICA: MARKET, BY OFFERING, 2024–2029 (USD MILLION)
  • TABLE 179 MIDDLE EAST & AFRICA: MARKET, BY ORGANIZATION SIZE, 2019–2023 (USD MILLION)
  • TABLE 180 MIDDLE EAST & AFRICA: MARKET, BY ORGANIZATION SIZE, 2024–2029 (USD MILLION)
  • TABLE 181 MIDDLE EAST & AFRICA: PENETRATION TESTING AS A SERVICE MARKET, BY TESTING TYPE, 2019–2023 (USD MILLION)
  • TABLE 182 MIDDLE EAST & AFRICA: MARKET, BY TESTING TYPE, 2024–2029 (USD MILLION)
  • TABLE 183 MIDDLE EAST & AFRICA: MARKET, BY VERTICAL, 2019–2023 (USD MILLION)
  • TABLE 184 MIDDLE EAST & AFRICA: MARKET, BY VERTICAL, 2024–2029 (USD MILLION)
  • TABLE 185 MIDDLE EAST & AFRICA: MARKET, BY SUBREGION, 2019–2023 (USD MILLION)
  • TABLE 186 MIDDLE EAST & AFRICA: MARKET, BY SUBREGION, 2024–2029 (USD MILLION)
  • TABLE 187 MIDDLE EAST: MARKET, BY OFFERING, 2019–2023 (USD MILLION)
  • TABLE 188 MIDDLE EAST: MARKET, BY OFFERING, 2024–2029 (USD MILLION)
  • TABLE 189 MIDDLE EAST: MARKET, BY ORGANIZATION SIZE, 2019–2023 (USD MILLION)
  • TABLE 190 MIDDLE EAST: PENETRATION TESTING AS A SERVICE MARKET, BY ORGANIZATION SIZE, 2024–2029 (USD MILLION)
  • TABLE 191 MIDDLE EAST: MARKET, BY TESTING TYPE, 2019–2023 (USD MILLION)
  • TABLE 192 MIDDLE EAST: MARKET, BY TESTING TYPE, 2024–2029 (USD MILLION)
  • TABLE 193 MIDDLE EAST: MARKET, BY VERTICAL, 2019–2023 (USD MILLION)
  • TABLE 194 MIDDLE EAST: MARKET, BY VERTICAL, 2024–2029 (USD MILLION)
  • TABLE 195 MIDDLE EAST: MARKET, BY COUNTRY/SUBREGION, 2019–2023 (USD MILLION)
  • TABLE 196 MIDDLE EAST: MARKET, BY COUNTRY/SUBREGION, 2024–2029 (USD MILLION)
  • TABLE 197 GCC COUNTRIES: MARKET, BY OFFERING, 2019–2023 (USD MILLION)
  • TABLE 198 GCC COUNTRIES: PENETRATION TESTING AS A SERVICE MARKET, BY OFFERING, 2024–2029 (USD MILLION)
  • TABLE 199 GCC COUNTRIES: MARKET, BY ORGANIZATION SIZE, 2019–2023 (USD MILLION)
  • TABLE 200 GCC COUNTRIES: MARKET, BY ORGANIZATION SIZE, 2024–2029 (USD MILLION)
  • TABLE 201 GCC COUNTRIES: MARKET, BY TESTING TYPE, 2019–2023 (USD MILLION)
  • TABLE 202 GCC COUNTRIES: MARKET, BY TESTING TYPE, 2024–2029 (USD MILLION)
  • TABLE 203 GCC COUNTRIES: MARKET, BY VERTICAL, 2019–2023 (USD MILLION)
  • TABLE 204 GCC COUNTRIES: MARKET, BY VERTICAL, 2024–2029 (USD MILLION)
  • TABLE 205 REST OF MIDDLE EAST: MARKET, BY OFFERING, 2019–2023 (USD MILLION)
  • TABLE 206 REST OF MIDDLE EAST: MARKET, BY OFFERING, 2024–2029 (USD MILLION)
  • TABLE 207 REST OF MIDDLE EAST: MARKET, BY ORGANIZATION SIZE, 2019–2023 (USD MILLION)
  • TABLE 208 REST OF MIDDLE EAST: MARKET, BY ORGANIZATION SIZE, 2024–2029 (USD MILLION)
  • TABLE 209 REST OF MIDDLE EAST: MARKET, BY TESTING TYPE, 2019–2023 (USD MILLION)
  • TABLE 210 REST OF MIDDLE EAST: PENETRATION TESTING AS A SERVICE MARKET, BY TESTING TYPE, 2024–2029 (USD MILLION)
  • TABLE 211 REST OF MIDDLE EAST: MARKET, BY VERTICAL, 2019–2023 (USD MILLION)
  • TABLE 212 REST OF MIDDLE EAST: MARKET, BY VERTICAL, 2024–2029 (USD MILLION)
  • TABLE 213 AFRICA: MARKET, BY OFFERING, 2019–2023 (USD MILLION)
  • TABLE 214 AFRICA: MARKET, BY OFFERING, 2024–2029 (USD MILLION)
  • TABLE 215 AFRICA: MARKET, BY ORGANIZATION SIZE, 2019–2023 (USD MILLION)
  • TABLE 216 AFRICA: MARKET, BY ORGANIZATION SIZE, 2024–2029 (USD MILLION)
  • TABLE 217 AFRICA: MARKET, BY TESTING TYPE, 2019–2023 (USD MILLION)
  • TABLE 218 AFRICA: MARKET, BY TESTING TYPE, 2024–2029 (USD MILLION)
  • TABLE 219 AFRICA: MARKET, BY VERTICAL, 2019–2023 (USD MILLION)
  • TABLE 220 AFRICA: MARKET, BY VERTICAL, 2024–2029 (USD MILLION)
  • TABLE 221 LATIN AMERICA: MARKET, BY OFFERING, 2019–2023 (USD MILLION)
  • TABLE 222 LATIN AMERICA: PENETRATION TESTING AS A SERVICE MARKET, BY OFFERING, 2024–2029 (USD MILLION)
  • TABLE 223 LATIN AMERICA: MARKET, BY ORGANIZATION SIZE, 2019–2023 (USD MILLION)
  • TABLE 224 LATIN AMERICA: MARKET, BY ORGANIZATION SIZE, 2024–2029 (USD MILLION)
  • TABLE 225 LATIN AMERICA: MARKET, BY TESTING TYPE, 2019–2023 (USD MILLION)
  • TABLE 226 LATIN AMERICA: MARKET, BY TESTING TYPE, 2024–2029 (USD MILLION)
  • TABLE 227 LATIN AMERICA: MARKET, BY VERTICAL, 2019–2023 (USD MILLION)
  • TABLE 228 LATIN AMERICA: MARKET, BY VERTICAL, 2024–2029 (USD MILLION)
  • TABLE 229 LATIN AMERICA: MARKET, BY COUNTRY, 2019–2023 (USD MILLION)
  • TABLE 230 LATIN AMERICA: MARKET, BY COUNTRY, 2024–2029 (USD MILLION)
  • TABLE 231 BRAZIL: MARKET, BY OFFERING, 2019–2023 (USD MILLION)
  • TABLE 232 BRAZIL: MARKET, BY OFFERING, 2024–2029 (USD MILLION)
  • TABLE 233 BRAZIL: MARKET, BY ORGANIZATION SIZE, 2019–2023 (USD MILLION)
  • TABLE 234 BRAZIL: MARKET, BY ORGANIZATION SIZE, 2024–2029 (USD MILLION)
  • TABLE 235 BRAZIL: MARKET, BY TESTING TYPE, 2019–2023 (USD MILLION)
  • TABLE 236 BRAZIL: MARKET, BY TESTING TYPE, 2024–2029 (USD MILLION)
  • TABLE 237 BRAZIL: MARKET, BY VERTICAL, 2019–2023 (USD MILLION)
  • TABLE 238 BRAZIL: MARKET, BY VERTICAL, 2024–2029 (USD MILLION)
  • TABLE 239 MEXICO: MARKET, BY OFFERING, 2019–2023 (USD MILLION)
  • TABLE 240 MEXICO: MARKET, BY OFFERING, 2024–2029 (USD MILLION)
  • TABLE 241 MEXICO: MARKET, BY ORGANIZATION SIZE, 2019–2023 (USD MILLION)
  • TABLE 242 MEXICO: MARKET, BY ORGANIZATION SIZE, 2024–2029 (USD MILLION)
  • TABLE 243 MEXICO: MARKET, BY TESTING TYPE, 2019–2023 (USD MILLION)
  • TABLE 244 MEXICO: MARKET, BY TESTING TYPE, 2024–2029 (USD MILLION)
  • TABLE 245 MEXICO: MARKET, BY VERTICAL, 2019–2023 (USD MILLION)
  • TABLE 246 MEXICO: MARKET, BY VERTICAL, 2024–2029 (USD MILLION)
  • TABLE 247 REST OF LATIN AMERICA: MARKET, BY OFFERING, 2019–2023 (USD MILLION)
  • TABLE 248 REST OF LATIN AMERICA: PENETRATION TESTING AS A SERVICE MARKET, BY OFFERING, 2024–2029 (USD MILLION)
  • TABLE 249 REST OF LATIN AMERICA: MARKET, BY ORGANIZATION SIZE, 2019–2023 (USD MILLION)
  • TABLE 250 REST OF LATIN AMERICA: MARKET, BY ORGANIZATION SIZE, 2024–2029 (USD MILLION)
  • TABLE 251 REST OF LATIN AMERICA: MARKET, BY TESTING TYPE, 2019–2023 (USD MILLION)
  • TABLE 252 REST OF LATIN AMERICA: MARKET, BY TESTING TYPE, 2024–2029 (USD MILLION)
  • TABLE 253 REST OF LATIN AMERICA: MARKET, BY VERTICAL, 2019–2023 (USD MILLION)
  • TABLE 254 REST OF LATIN AMERICA: MARKET, BY VERTICAL, 2024–2029 (USD MILLION)
  • TABLE 255 MARKET: DEGREE OF COMPETITION
  • TABLE 256 PENETRATION TESTING AS A SERVICE MARKET: OFFERING FOOTPRINT
  • TABLE 257 MARKET: TESTING TYPE FOOTPRINT
  • TABLE 258 MARKET: VERTICAL FOOTPRINT
  • TABLE 259 PENETRATION TESTING AS A SERVICE MARKET: REGIONAL FOOTPRINT
  • TABLE 260 MARKET: KEY START-UPS/SMES
  • TABLE 261 MARKET: COMPETITIVE BENCHMARKING OF KEY START-UPS/SMES
  • TABLE 262 MARKET: REGIONAL FOOTPRINT OF START-UPS/SMES
  • TABLE 263 PENETRATION TESTING AS A SERVICE MARKET: PRODUCT LAUNCHES AND ENHANCEMENTS, NOVEMBER 2021–MAY 2024
  • TABLE 264 PENETRATION TESTING AS A SERVICE MARKET: DEALS, OCTOBER 2021–MAY 2024
  • TABLE 265 SYNACK: BUSINESS OVERVIEW
  • TABLE 266 SYNACK: PRODUCTS/SOLUTIONS/SERVICES OFFERED
  • TABLE 267 SYNACK: PRODUCT LAUNCHES
  • TABLE 268 HACKERONE: BUSINESS OVERVIEW
  • TABLE 269 HACKERONE: PRODUCTS/SOLUTIONS/SERVICES OFFERED
  • TABLE 270 HACKERONE: PRODUCT ENHANCEMENTS
  • TABLE 271 SYNOPSYS: BUSINESS OVERVIEW
  • TABLE 272 SYNOPSYS: PRODUCTS/SOLUTIONS/SERVICES OFFERED
  • TABLE 273 SYNOPSYS: PRODUCT LAUNCHES AND ENHANCEMENTS
  • TABLE 274 SYNOPSYS: DEALS
  • TABLE 275 INTERVISION SYSTEMS: BUSINESS OVERVIEW
  • TABLE 276 INTERVISION SYSTEMS: PRODUCTS/SOLUTIONS/SERVICES OFFERED
  • TABLE 277 INTERVISION SYSTEMS: DEALS
  • TABLE 278 EDGESCAN: BUSINESS OVERVIEW
  • TABLE 279 EDGESCAN: PRODUCTS/SOLUTIONS/SERVICES OFFERED
  • TABLE 280 EDGESCAN: PRODUCT LAUNCHES
  • TABLE 281 EDGESCAN: DEALS
  • TABLE 282 BUGCROWD: BUSINESS OVERVIEW
  • TABLE 283 BUGCROWD: PRODUCTS/SOLUTIONS/SERVICES OFFERED
  • TABLE 284 BUGCROWD: PRODUCT LAUNCHES AND ENHANCEMENTS
  • TABLE 285 BUGCROWD: DEALS
  • TABLE 286 BUGCROWD: EXPANSIONS
  • TABLE 287 GUIDEPOINT SECURITY: BUSINESS OVERVIEW
  • TABLE 288 GUIDEPOINT SECURITY: PRODUCTS/SOLUTIONS/SERVICES OFFERED
  • TABLE 289 GUIDEPOINT SECURITY: PRODUCT LAUNCHES
  • TABLE 290 TRUSTWAVE: BUSINESS OVERVIEW
  • TABLE 291 TRUSTWAVE: PRODUCTS/SOLUTIONS/SERVICES OFFERED
  • TABLE 292 TRUSTWAVE: PRODUCT LAUNCHES AND ENHANCEMENTS
  • TABLE 293 TRUSTWAVE: DEALS
  • TABLE 294 COBALT: BUSINESS OVERVIEW
  • TABLE 295 COBALT: PRODUCTS/SOLUTIONS/SERVICES OFFERED
  • TABLE 296 COBALT: PRODUCT LAUNCHES
  • TABLE 297 COBALT: DEALS
  • TABLE 298 NETSPI: BUSINESS OVERVIEW
  • TABLE 299 NETSPI: PRODUCTS/SOLUTIONS/SERVICES OFFERED
  • TABLE 300 NETSPI: PRODUCT LAUNCHES
  • TABLE 301 NETSPI: DEALS
  • TABLE 302 VERACODE: BUSINESS OVERVIEW
  • TABLE 303 VERACODE: PRODUCTS/SOLUTIONS/SERVICES OFFERED
  • TABLE 304 VERACODE: PRODUCT LAUNCHES
  • TABLE 305 VERACODE: DEALS
  • TABLE 306 YOGOSHA: BUSINESS OVERVIEW
  • TABLE 307 YOGOSHA: PRODUCTS/SOLUTIONS/SERVICES OFFERED
  • TABLE 308 YOGOSHA: DEALS
  • TABLE 309 SOFTWARE SECURED: BUSINESS OVERVIEW
  • TABLE 310 SOFTWARE SECURED: PRODUCTS/SOLUTIONS/SERVICES OFFERED
  • TABLE 311 RAXIS: BUSINESS OVERVIEW
  • TABLE 312 RAXIS: PRODUCTS/SOLUTIONS/SERVICES OFFERED
  • TABLE 313 VUMETRIC CYBERSECURITY: BUSINESS OVERVIEW
  • TABLE 314 VUMETRIC CYBERSECURITY: PRODUCTS/SOLUTIONS/SERVICES OFFERED
  • TABLE 315 VUMETRIC CYBERSECURITY: PRODUCT LAUNCHES
  • TABLE 316 VUMETRIC CYBERSECURITY: DEALS
  • TABLE 317 NOWSECURE: BUSINESS OVERVIEW
  • TABLE 318 NOWSECURE: PRODUCTS/SOLUTIONS/SERVICES OFFERED
  • TABLE 319 NOWSECURE: PRODUCT LAUNCHES
  • TABLE 320 NOWSECURE: DEALS
  • TABLE 321 ADJACENT MARKETS AND FORECASTS
  • TABLE 322 PENETRATION TESTING MARKET, BY OFFERING, 2019–2023 (USD MILLION)
  • TABLE 323 PENETRATION TESTING MARKET, BY OFFERING, 2024–2029 (USD MILLION)
  • TABLE 324 PENETRATION TESTING MARKET, BY SERVICE, 2019–2023 (USD MILLION)
  • TABLE 325 PENETRATION TESTING MARKET, BY SERVICE, 2024–2029 (USD MILLION)
  • TABLE 326 PENETRATION TESTING MARKET, BY DEPLOYMENT MODE, 2019–2023 (USD MILLION)
  • TABLE 327 PENETRATION TESTING MARKET, BY DEPLOYMENT MODE, 2024–2029 (USD MILLION)
  • TABLE 328 PENETRATION TESTING MARKET, BY ORGANIZATION SIZE, 2019–2023 (USD MILLION)
  • TABLE 329 PENETRATION TESTING MARKET, BY ORGANIZATION SIZE, 2024–2029 (USD MILLION)
  • TABLE 330 PENETRATION TESTING MARKET, BY TYPE, 2019–2023 (USD MILLION)
  • TABLE 331 PENETRATION TESTING MARKET, BY TYPE, 2024–2029 (USD MILLION)
  • TABLE 332 PENETRATION TESTING MARKET, BY VERTICAL, 2019–2023 (USD MILLION)
  • TABLE 333 PENETRATION TESTING MARKET, BY VERTICAL, 2024–2029 (USD MILLION)
  • TABLE 334 PENETRATION TESTING MARKET, BY REGION, 2019–2023 (USD MILLION)
  • TABLE 335 PENETRATION TESTING MARKET, BY REGION, 2024–2029 (USD MILLION)
  • TABLE 336 AUTOMATED BREACH AND ATTACK SIMULATION MARKET, BY OFFERING, 2017–2019 (USD THOUSAND)
  • TABLE 337 PRE-COVID-19 - AUTOMATED BREACH AND ATTACK SIMULATION MARKET, BY OFFERING, 2019–2025 (USD THOUSAND)
  • TABLE 338 POST-COVID-19- AUTOMATED BREACH AND ATTACK SIMULATION MARKET, BY OFFERING, 2019–2025 (USD THOUSAND)
  • TABLE 339 AUTOMATED BREACH AND ATTACK SIMULATION MARKET, BY SERVICE, 2017–2019 (USD THOUSAND)
  • TABLE 340 PRE-COVID-19: AUTOMATED BREACH AND ATTACK SIMULATION MARKET, BY SERVICE, 2019–2025 (USD THOUSAND)
  • TABLE 341 POST-COVID-19: AUTOMATED BREACH AND ATTACK SIMULATION MARKET, BY SERVICE, 2019–2025 (USD THOUSAND)
  • TABLE 342 AUTOMATED BREACH AND ATTACK SIMULATION MARKET, BY DEPLOYMENT MODE, 2017–2019 (USD THOUSAND)
  • TABLE 343 PRE-COVID-19: AUTOMATED BREACH AND ATTACK SIMULATION MARKET, BY DEPLOYMENT MODE, 2019–2025 (USD THOUSAND)
  • TABLE 344 POST-COVID-19: AUTOMATED BREACH AND ATTACK SIMULATION MARKET, BY DEPLOYMENT MODE, 2019–2025 (USD THOUSAND)
  • TABLE 345 AUTOMATED BREACH AND ATTACK SIMULATION MARKET, BY APPLICATION, 2017–2019 (USD THOUSAND)
  • TABLE 346 PRE-COVID-19: AUTOMATED BREACH AND ATTACK SIMULATION MARKET, BY APPLICATION, 2019–2025 (USD THOUSAND)
  • TABLE 347 POST-COVID-19: AUTOMATED BREACH AND ATTACK SIMULATION MARKET, BY APPLICATION, 2019–2025 (USD THOUSAND)
  • TABLE 348 AUTOMATED BREACH AND ATTACK SIMULATION MARKET, BY END USER, 2017–2019 (USD THOUSAND)
  • TABLE 349 PRE-COVID-19: AUTOMATED BREACH AND ATTACK SIMULATION MARKET, BY END USER, 2019–2025 (USD THOUSAND)
  • TABLE 350 POST0COVID-19: AUTOMATED BREACH AND ATTACK SIMULATION MARKET, BY END USER, 2019–2025 (USD THOUSAND)
  • TABLE 351 AUTOMATED BREACH AND ATTACK SIMULATION MARKET, BY REGION, 2017–2019 (USD THOUSAND)
  • TABLE 352 AUTOMATED BREACH AND ATTACK SIMULATION MARKET, BY REGION, 2019–2025 (USD THOUSAND)
  • TABLE 353 SECURITY TESTING MARKET, BY TESTING TYPE, 2014–2019 (USD MILLION)
  • TABLE 354 SECURITY TESTING MARKET, BY TESTING TYPE, 2019–2025 (USD MILLION)
  • TABLE 355 SECURITY TESTING MARKET, BY DEPLOYMENT MODE, 2014–2019 (USD MILLION)
  • TABLE 356 SECURITY TESTING MARKET, BY DEPLOYMENT MODE, 2019–2025 (USD MILLION)
  • TABLE 357 SECURITY TESTING MARKET, BY ORGANIZATION SIZE, 2014–2019 (USD MILLION)
  • TABLE 358 SECURITY TESTING MARKET, BY ORGANIZATION SIZE, 2019–2025 (USD MILLION)
  • TABLE 359 SECURITY TESTING MARKET, BY VERTICAL, 2014–2019 (USD MILLION)
  • TABLE 360 PRE-COVID-19: SECURITY TESTING MARKET, BY VERTICAL, 2019–2025 (USD MILLION)
  • TABLE 361 SECURITY TESTING MARKET, BY REGION, 2014–2019 (USD MILLION)
  • TABLE 362 POST-COVID-19: SECURITY TESTING MARKET, BY REGION, 2019–2025 (USD MILLION)
LIST OF FIGURES
 
  • FIGURE 1 PENETRATION TESTING AS A SERVICE MARKET: RESEARCH DESIGN
  • FIGURE 2 MARKET: DATA TRIANGULATION
  • FIGURE 3 APPROACH 1 (SUPPLY SIDE): REVENUE FROM SOLUTIONS/SERVICES OF PENETRATION TESTING AS A SERVICE VENDORS
  • FIGURE 4 APPROACH 1: SUPPLY-SIDE ANALYSIS
  • FIGURE 5 PENETRATION TESTING AS A SERVICE MARKET ESTIMATION: RESEARCH FLOW
  • FIGURE 6 APPROACH 2 - BOTTOM-UP (DEMAND SIDE): SOLUTIONS/SERVICES
  • FIGURE 7 COMPANY EVALUATION MATRIX (KEY PLAYERS): CRITERIA WEIGHTAGE
  • FIGURE 8 COMPANY EVALUATION MATRIX (START-UPS): CRITERIA WEIGHTAGE
  • FIGURE 9 GLOBAL PENETRATION TESTING AS A SERVICE MARKET SIZE AND Y-O-Y GROWTH RATE
  • FIGURE 10 SEGMENTS WITH HIGH GROWTH RATES DURING FORECAST PERIOD
  • FIGURE 11 NORTH AMERICA TO ACCOUNT FOR LARGEST SHARE IN 2024
  • FIGURE 12 RISING INSTANCES OF CYBER THREATS, DIGITAL TRANSFORMATION, AND RAPID ADOPTION OF CLOUD SERVICES AND IOT DEVICES TO FUEL MARKET GROWTH
  • FIGURE 13 PENETRATION TESTING AS A SERVICE SOLUTIONS TO ACCOUNT FOR LARGER MARKET DURING FORECAST PERIOD
  • FIGURE 14 LARGE ENTERPRISES SEGMENT TO ACCOUNT FOR LARGER MARKET DURING FORECAST PERIOD
  • FIGURE 15 WEB APPLICATION TESTING TO ACCOUNT FOR LARGEST MARKET DURING FORECAST PERIOD
  • FIGURE 16 BFSI SECTOR TO ACCOUNT FOR LARGEST MARKET DURING FORECAST PERIOD
  • FIGURE 17 ASIA PACIFIC TO EMERGE AS BEST MARKET FOR INVESTMENTS IN NEXT FIVE YEARS
  • FIGURE 18 PENETRATION TESTING AS A SERVICE MARKET: DRIVERS, RESTRAINTS, OPPORTUNITIES, AND CHALLENGES
  • FIGURE 19 TRENDS/DISRUPTIONS IMPACTING CUSTOMERS’ BUSINESSES
  • FIGURE 20 AVERAGE SELLING PRICES OF KEY PLAYERS, BY OFFERING
  • FIGURE 21 MARKET: VALUE CHAIN ANALYSIS
  • FIGURE 22 KEY PLAYERS IN PENETRATION TESTING AS A SERVICE MARKET ECOSYSTEM
  • FIGURE 23 PHASES OF PENETRATION TESTING AS A SERVICE
  • FIGURE 24 LIST OF MAJOR PATENTS FOR PENETRATION TESTING AS A SERVICE VENDORS
  • FIGURE 25 REGIONAL ANALYSIS OF PATENTS GRANTED FOR PENETRATION TESTING AS A SERVICE MARKET, 2013–2023
  • FIGURE 26 PORTER’S FIVE FORCES ANALYSIS: MARKET
  • FIGURE 27 INFLUENCE OF STAKEHOLDERS ON BUYING PROCESS FOR TOP THREE VERTICALS
  • FIGURE 28 KEY BUYING CRITERIA FOR TOP THREE VERTICALS
  • FIGURE 29 LEADING GLOBAL PENETRATION TESTING AS A SERVICE START-UPS/SMES, BY NUMBER OF INVESTORS AND FUNDING ROUNDS
  • FIGURE 30 SOLUTIONS SEGMENT TO GROW AT HIGHER CAGR DURING FORECAST PERIOD
  • FIGURE 31 SMES SEGMENT TO GROW AT HIGHER CAGR DURING FORECAST PERIOD
  • FIGURE 32 CLOUD TESTING SEGMENT TO GROW AT HIGHEST CAGR DURING FORECAST PERIOD
  • FIGURE 33 HEALTHCARE SEGMENT TO GROW AT HIGHEST CAGR DURING FORECAST PERIOD
  • FIGURE 34 ASIA PACIFIC TO GROW AT HIGHEST CAGR DURING FORECAST PERIOD
  • FIGURE 35 NORTH AMERICA: MARKET SNAPSHOT
  • FIGURE 36 ASIA PACIFIC: MARKET SNAPSHOT
  • FIGURE 37 TOP FIVE PLAYERS DOMINATING MARKET IN 2023
  • FIGURE 38 SHARE OF LEADING COMPANIES IN PENETRATION TESTING AS A SERVICE MARKET SHARE, 2023
  • FIGURE 39 MARKET: COMPANY EVALUATION MATRIX (KEY PLAYERS), 2023
  • FIGURE 40 PENETRATION TESTING AS A SERVICE MARKET: COMPANY FOOTPRINT
  • FIGURE 41 PENETRATION TESTING AS A SERVICE MARKET: COMPANY EVALUATION MATRIX (START-UPS/SMES), 2023
  • FIGURE 42 COMPANY VALUATION OF KEY PENETRATION TESTING AS A SERVICE VENDORS (USD BILLION) TILL 2024
  • FIGURE 43 BRAND/PRODUCT COMPARISON
  • FIGURE 44 SYNOPSYS: COMPANY SNAPSHOT


The study involved significant activities in estimating the current market size for PTaaS. Intensive secondary research was conducted to collect information about PTaaS and related ecosystems. The industry executives validated these findings and assumptions and sized them across the value chain using a primary research process as a next step. Top-down and bottom-up market estimation approaches were used to estimate the market size globally, followed by the market breakup and data triangulation procedures to assess the market segment and sub-segments in PTaaS.

Secondary Research Process:

Various sources were referred to in the secondary research process to identify and collect PTaaS information. These sources include annual reports, press releases, PTaaS software and service vendor investor presentations, forums, vendor-certified publications, and industry/association white papers. These secondary sources were utilized to obtain critical information about PTaaS's solutions and services supply & value chain, a list of 100+ key players and SMEs, market classification, and segmentation per the industry trends and regional markets. The secondary research also gives us insights into the key developments from market and technology perspectives, which primary respondents further validated.

The factors considered for estimating the regional market size include technological initiatives undertaken by governments of different countries, GDP growth, ICT spending, recent market developments, and market ranking analysis of primary PTaaS solutions and service vendors.

Primary Research Process:

We have conducted primary research with industry executives from both the supply and demand sides. The primary sources from the supply side include chief executive officers (CEOs), vice presidents (VPs), marketing directors, and technology and innovation executives of key companies operating in the PTaaS market. We have conducted primary interviews with the executives to obtain qualitative and quantitative information for PTaaS.

The market engineering process implemented the top-down and bottom-up approaches and various data triangulation methods to estimate and forecast the market segments and subsegments. During the post-market engineering process, we conducted primary research to verify and validate the critical numbers we arrived at. The primary analysis was also undertaken to identify the segmentation types, industry trends, the competitive landscape of the PTaaS market players, and fundamental market dynamics, such as drivers, restraints, opportunities, challenges, industry trends, and key strategies.
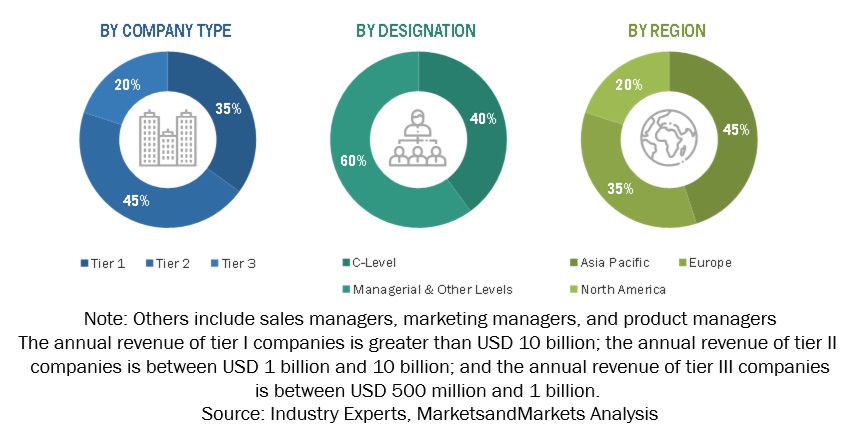
Penetration Testing as a Service Market  Size, and Share

Market Size Estimation Process:

Both top-down and bottom-up approaches were implemented for market size estimation to estimate, project, and forecast the size of the global and other dependent sub-segments in the overall PTaaS market.

The research methodology used to estimate the market size includes these steps:

  • The key players, SMEs, and startups were identified through secondary sources. Their revenue contributions in the market were determined through primary and secondary sources.
  • Annual and financial reports of the publicly listed market players were considered for the company's revenue details, and,
  • Primary interviews were also conducted with industry leaders to collect information about their companies, competitors, and key players in the market.
  • All percentage splits and breakups were determined using secondary sources and verified through primary sources. 

INFOGRAPHIC DEPICTING BOTTOM-UP AND TOP-DOWN APPROACHES

Penetration Testing as a Service Market  Top Down Approach

To know about the assumptions considered for the study, download the pdf brochure
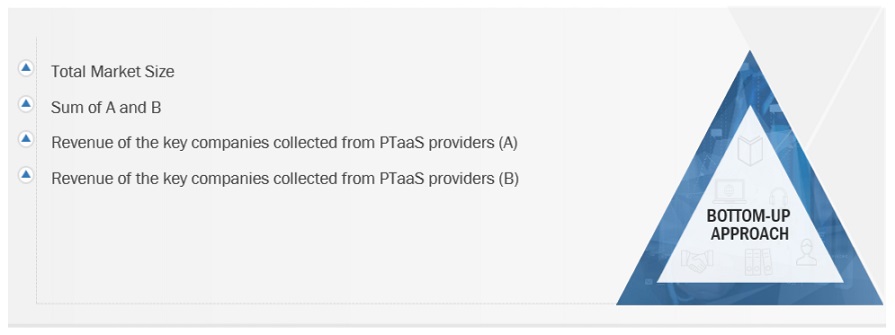
Penetration Testing as a Service Market  Bottom Up Approach

Data Triangulation

Data triangulation is a crucial step in the market engineering process for PTaaS. It involves utilizing multiple data sources and methodologies to validate and cross-reference findings, thereby enhancing the reliability and accuracy of the market segment and subsegment statistics. To conduct data triangulation, various factors and trends related to the PTaaS market are studied from both the demand and supply sides. It includes analyzing data from diverse sources such as market research reports, industry publications, regulatory bodies, financial institutions, and technology providers. By examining data from different perspectives and sources, data triangulation helps mitigate potential biases and discrepancies. It provides a more comprehensive understanding of the market dynamics, including the size, growth rate, market trends, and customer preferences.

Furthermore, data triangulation aids in identifying any inconsistencies or outliers in the data, enabling researchers to refine their analysis and make informed decisions. It strengthens the credibility of the market engineering process by ensuring the conclusions drawn are based on robust and corroborated data. Data triangulation is a rigorous and systematic approach to enhancing the reliability and validity of market segment and subsegment statistics in PTaaS. It provides a solid foundation for informed decision-making and strategic planning within the industry.

Market Definition

Penetration Testing as a Service (PTaaS) is a cloud-based security solution that combines human assessments and automation to test for vulnerabilities. It's a Software as a Service (SaaS) model that allows organizations to run automated tests and view data on demand.

Key Stakeholders

  • Government bodies and public safety agencies
  • Project managers
  • Developers
  • Business analysts
  • Quality Assurance (QA)/test engineers
  • Providers of penetration testing as a service solution and services
  • Consulting firms
  • Third-party vendors
  • Investors and venture capitalists
  • Technology providers

Report Objectives

  • To define, describe, and forecast the Penetration Testing as a Service (PTaaS) market based on offerings, organization size, testing type, vertical, and region
  • To provide detailed information about the major factors (drivers, opportunities, restraints, and challenges) influencing the growth of the PTaaS market
  • To forecast the PTaaS market size across five main regions: North America, Europe, Asia Pacific, Middle East & Africa, and Latin America
  • To analyze subsegments of the market with respect to individual growth trends, prospects, and contributions to the overall market
  • To profile the key players of the PTaaS market and comprehensively analyze their market size, market ranking, and core competencies
  • To map the companies to get competitive intelligence based on company profiles, key player strategies, and game-changing developments such as product developments, collaborations, and acquisitions
  • To track and analyze the competitive developments in the PTaaS market globally, such as product enhancements and new product launches, acquisitions, partnerships, and collaborations. 

Customization options

With the given market data, MarketsandMarkets offers customizations based on company-specific needs. The following customization options are available for the report:

Geographic analysis

  • Further breakup of the Asia Pacific market into countries contributing 75% to the regional market size
  • Further breakup of the North American market into countries contributing 75% to the regional market size
  • Further breakup of the Latin American market into countries contributing 75% to the regional market size
  • Further breakup of the Middle Eastern and African market into countries contributing 75% to the regional market size
  • Further breakup of the European market into countries contributing 75% to the regional market size

Company information

Detailed analysis and profiling of additional market players (up to 5)

Previous Versions of this Report

"Our USP is "providing game-changing business opportunities reports with free customization" - so please feel free to provide us with your specific areas of interest / business challenges in much greater detail !!"

We appreciate your interest in this report. Once you fill out the form, you'll be immediately directed to an exclusive solution tailored to your needs. This high-value offering can help boost your revenue by 30% - a must-see opportunity for anyone looking to maximize growth.


By clicking the "Submit" button, you are agreeing to the Terms of Use and Privacy Policy.

Custom Market Research Services

We Will Customise The Research For You, In Case The Report Listed Above Does Not Meet With Your Requirements

Get 10% Free Customisation

Growth opportunities and latent adjacency in Penetration Testing as a Service Market

DMCA.com Protection Status