Particle Size Analysis Market by Technology (Laser Diffraction, DLS, Imaging, Coulter Principle, Sieving, Nanoparticle Tracking), Dispersion (Wet, Dry, Spray), End User (Pharma-Biotech, Cosmeceutical, Chemicals, Food, Academia) & Region - Global Forecast to 2028
The global particle size analysis market in terms of revenue was estimated to be worth $446 million in 2023 and is poised to reach $596 million by 2028, growing at a CAGR of 6.0% from 2023 to 2028. The new research study consists of an industry trend analysis of the market. The new research study consists of industry trends, pricing analysis, patent analysis, conference and webinar materials, key stakeholders, and buying behaviour in the market. The particle size market is poised for The market's robust growth is primarily propelled by factors like the expansion of research in nanotechnology, augmented investments in pharmaceutical research and development, and the implementation of rigorous regulatory standards for product quality across diverse industries. Nevertheless, the imposition of substantial import duties on particle size analyzers in developing nations and constraints in the particle characterization range are anticipated to impede market growth in the forecast period.
Particle Size Analysis Market
To know about the assumptions considered for the study, Request for Free Sample Report
e- Estimated; p- Projected
Particle Size Analysis Market: Market Dynamics
Driver: The growth in research endeavors within the field of nanotechnology.
Due to its significant potential, the utilization of nanotechnology is rapidly expanding across various industries, including healthcare, food and beverage, and the chemical sector. Continuous research on nanomaterials and their importance in multiple industries is also fostering the development of nanotechnology applications. As particle size analyzers play a crucial role in nanoparticle analysis, the increasing research in nanotechnology, combined with the growing adoption of this technology, will propel market growth.
Restraint: The price of particle size analyzers is high
Particle size analysis instruments are becoming increasingly popular due to technological advances and new applications. However, their high cost is a major barrier to market growth. Customers must make significant investments to purchase and implement these instruments. For example, a dynamic light scattering particle size analyzer can cost between $30,000 and $60,000, depending on the accessories. Additionally, nanotechnology-based particle size analyzers require highly skilled technicians to operate, which adds to the overall cost.
Opportunity: Growing number of conferences and events.
Over the past decade, there has been a surge in the number of national and international nanotechnology events, trade shows, and conferences. For example, the 23rd IEEE International Conference on Nanotechnology (IEEE-NANO 2023) will be held from July 2-5, 2023 in Jeju Island, Korea, with a focus on the latest advances in nanotechnology and its applications. Many market players also organize and exhibit their products at these events, which helps to raise awareness of the latest nanoparticle analysis technologies. These seminars showcase the latest developments in nanoparticle characterization technologies, such as NTA, DLS, GPC, rheology, and RMM. These events also help to increase awareness of novel nanoparticle characterization techniques among research professionals.
Challenge: SMEs lack the infrastructure to distribute their products effectively.
In addition to large, established companies, there are many small and medium-sized businesses (SMEs) that offer specialized technologies. However, SMEs often have difficulty marketing and distributing their products due to limited budgets. This can hurt their sales and even threaten their survival. To overcome their inability to grow organically due to insufficient funds, many SMEs are focusing on expanding their geographic reach through inorganic growth strategies, such as mergers and acquisitions and partnerships.
Market Ecosystem/Map
By technology, the the nanoparticle tracking analysis segment of the particle size analysis industry is expected to grow at the highest rate during the forecast period.
Based on technology, the particle size analysis market can be categorized into various segments, including laser diffraction, dynamic light scattering, imaging, coulter principle, nanoparticle tracking analysis, and other related technologies. Anticipatedly, the Nanoparticle Tracking Analysis (NTA) sector is projected to exhibit the most significant growth within the particle size analysis technologies market during the forecast period spanning from 2023 to 2028. This segment is growing rapidly due to new and advanced applications of particle size analyzers, as well as increasing research in nanotechnology. Additionally, NTA is primarily used in biopharma and biotech applications, and this market segment is expected to grow during the forecast period due to increasing R&D activities in the biopharmaceutical industry.
By dispersion, the wet dispersion segment of the particle size analysis industry is expected to grow at the highest rate during the forecast period.
Based on dispersion, the particle size analysis market is segmented into dispersion- wet dispersion, dry dispersion, and spray dispersion. The wet dispersion segment of the particle size market by wet dispersion registers the highest growth rate during the forecast period 2023 to 2028. The wet dispersion market is growing due to the increasing use of nanoparticles and the launch of new wet particle size analyzers by several companies.
By end user, the healthcare industry segment of the particle size analysis industry is expected to grow at the highest rate during the forecast period.
Based on end users, the particle size analysis market is segmented into healthcare industry, cosmetics industry, chemical & petroleum industry, mining, minerals, and cement industry, food & beverage industry, and other industries. The healthcare industry segment of the particle size market by end user registers the highest growth rate during the forecast period 2023 to 2028. Growing pharmaceutical R&D spending in developing Asian countries, unmet patient needs for treatments for specific diseases (such as cancer), and government support for drug development are driving pharmaceutical research studies. This, along with the increasing number of biotechnology companies, continuous technological advancements by key players, company initiatives to raise awareness of new particle characterization solutions, and the growing number of conferences and events, is further propelling the demand for particle size analyzers in the biopharmaceutical and drug discovery industries.
By region, North America is expected to be the largest market in the particle size analysis industry in 2022.
North America, comprising the US and Canada, accounted for the largest market share of the particle size analysis market in 2022. The North American region is experiencing growth in the particle size analysis market due to factors Rising nanotechnology awareness, the presence of major nanotechnology companies in North America, government reforms and regulations to improve product quality, high industry standards, and the gradual shift of manufacturing and pharmaceutical R&D from developed markets to the United States are fueling the growth of the North American particle size analysis market.
To know about the assumptions considered for the study, download the pdf brochure
As of 2023 The vendors operating in the global particle size analysis market include Spectris (UK), HORIBA (Japan), Danaher (US), Anton Paar GmbH (Austria), Bettersize Instruments Ltd. (China), Brookhaven Instruments (US), Fritsch GmbH (Germany), LS Instruments (Switzerland), Metller Toledo (US), Micromeritics Instrument Corporation (US), Microtrac Retsch GmbH (Germany), Shimadzu Corporation (Japan), Sympatec GmbH (Germany), and TSI (US), and among others.
Scope of the Particle Size Analysis Industry
Report Metric |
Details |
Market Revenue in 2023 |
$446 million |
Projected Revenue by 2028 |
$596 million |
Revenue Rate |
Poised to Grow at a CAGR of 6.0% |
Market Driver |
The growth in research endeavors within the field of nanotechnology |
Market Opportunity |
Growing number of conferences and events |
This report has segmented the particle size analysis market to forecast revenue and analyze trends in each of the following submarkets:
By Technology
- Laser Diffraction
- Dynamic Light scattering
- Imaging
- Dynamic Imaging
- Static Imaging
- Nanoparticle Tracking Analysis (NTA)
- Coulter Principle
- Sieve Analysis
- Other Technologies
By Dispersion
- Wet Dispersion
- Dry Dispersion
- Spray Dispersion
By Type
- Bench-Top Analyzers
- Portable Analyzers
By End User
-
Healthcare Industry
- Pharmaceutical & Biotechnology Companies
- Public & Private Institutions
- Academic Institutions
- Cosmetic Industry
- Chemicals & Petroleum Industry
- Mining, Minerals and Cement Industry
- Food & Beverage Industry
- Other Industries
By Region
-
North America
- US
- Canada
-
Europe
- Germany
- France
- UK
- Spain
- Italy
- Rest of Europe
-
Asia Pacific
- Japan
- China
- India
- Australia
- South Korea
- Rest of Asia Pacific
-
Latin America
- Brazil
- Mexico
- Rest of Latin America
- Middle East and Africa
Recent Developments of Particle Size Analysis Industry
- In August 2023, Anton Paar GmbH introduced Litesizer DIA 500, the latest addition to the Particle Analysis & Surface Charge (PC) product line. This innovative instrument brings dynamic image analysis to your fingertips, allowing for precise measurement of particle size and shape within the range of 0.8 µm to 8,000 µm. With 1 µm equaling 0.001 millimeter.
- In May 2023, The Verder Group has acquired France's Formulaction S.A. and will integrate it into Microtrac MRB, a prominent manufacturer of Particle Characterization Systems within the group's Scientific Division.
- In March 2022, Aerolase is expanding its services beyond aesthetic treatments to help dermatologists with different focuses. They will now offer treatments for conditions like vitiligo, leukoderma, and atopic dermatitis. They're also working on getting FDA clearance for treating alopecia areata in 2023, using technology that has already been proven effective in Europe and other places. These additions will complement their existing treatments for acne, psoriasis, and rosacea.
Frequently Asked Questions (FAQ):
What is the projected market revenue value of the global particle size analysis market?
The global particle size analysis market boasts a total revenue value of $596 million by 2028.
What is the estimated growth rate (CAGR) of the global particle size analysis market?
The global particle size analysis market has an estimated compound annual growth rate (CAGR) of 6.0% and a revenue size in the region of $446 million in 2023.
To speak to our analyst for a discussion on the above findings, click Speak to Analyst
Exclusive indicates content/data unique to MarketsandMarkets and not available with any competitors.
- 5.1 INTRODUCTION
-
5.2 MARKET DYNAMICSMAJOR DRIVERS- Increasing research activities in nanotechnology- Increasing investments in pharmaceutical R&D- Development of technologically advanced nanoparticle instruments- Stringent regulatory guidelines for product quality across industries- Increasing funding for research institutionsRESTRAINTS- High cost of particle size analyzers- Limitations in particle characterization rangeOPPORTUNITIES- Increasing number of conferences and events- Emerging marketsCHALLENGES- Lack of well-established distribution network among SMEs- Limitations of laser diffraction technologyREGULATORY ANALYSIS- Key regulatory bodies and government agenciesKEY REGULATORY GUIDELINES
-
5.3 ISO 13320:2020 PARTICLE SIZE ANALYSIS — LASER DIFFRACTION METHODSTECHNICAL COMMITTEE: ISO/TC 24/SC 4 PARTICLE CHARACTERIZATION
- 5.4 ISO/TR 22814:2020 PARTICLE SIZE ANALYSIS — DYNAMIC LIGHT SCATTERING (DLS)
-
5.5 ISO 22412:2017 PARTICLE SIZE ANALYSIS — DYNAMIC LIGHT SCATTERING (DLS)TECHNICAL COMMITTEE: ISO/TC 24/SC 4 PARTICLE CHARACTERIZATION
-
5.6 ISO 13322-1:2014 PARTICLE SIZE ANALYSIS — IMAGE ANALYSIS METHODS — PART 1: STATIC IMAGE ANALYSIS METHODSTECHNICAL COMMITTEE: ISO/TC 24/SC 4 PARTICLE CHARACTERIZATION
-
5.7 ISO 13322-2:2006 PARTICLE SIZE ANALYSIS — IMAGE ANALYSIS METHODS — PART 2: DYNAMIC IMAGE ANALYSIS METHODSTECHNICAL COMMITTEE: ISO/TC 24/SC 4 PARTICLE CHARACTERIZATION
-
5.8 ISO 19430:2016 PARTICLE SIZE ANALYSIS — PARTICLE TRACKING ANALYSIS (PTA) METHODTECHNICAL COMMITTEE: ISO/TC 24/SC 4 PARTICLE CHARACTERIZATION
- 5.9 TECHNICAL COMMITTEE: ISO/TC 24/SC 4 PARTICLE CHARACTERIZATION
-
5.10 ISO 565:1990 TEST SIEVES — METAL WIRE CLOTH, PERFORATED METAL PLATE, AND ELECTROFORMED SHEET — NOMINAL SIZES OF OPENINGSTECHNICAL COMMITTEE: ISO/TC 24/SC 8 TEST SIEVES, SIEVING, AND INDUSTRIAL SCREENS
-
5.11 ISO 2395:1990 TEST SIEVES AND TEST SIEVING — VOCABULARYTECHNICAL COMMITTEE: ISO/TC 24/SC 8 TEST SIEVES, SIEVING, AND INDUSTRIAL SCREENS
-
5.12 ISO 2591-1:1988 TEST SIEVING — PART 1: METHODS USING TEST SIEVES OF WOVEN WIRE CLOTH AND PERFORATED METAL PLATETECHNICAL COMMITTEE: ISO/TC 24/SC 8 TEST SIEVES, SIEVING, AND INDUSTRIAL SCREENS
-
5.13 ISO 3310-1:2016 TEST SIEVES — TECHNICAL REQUIREMENTS AND TESTING — PART 1: TEST SIEVES OF METAL WIRE CLOTHTECHNICAL COMMITTEE: ISO/TC 24/SC 8 TEST SIEVES, SIEVING, AND INDUSTRIAL SCREENS
-
5.14 ISO 3310-2:2013 TEST SIEVES — TECHNICAL REQUIREMENTS AND TESTING — PART 2: TEST SIEVES OF PERFORATED METAL PLATETECHNICAL COMMITTEE: ISO/TC 24/SC 8 TEST SIEVES, SIEVING, AND INDUSTRIAL SCREENS
-
5.15 ISO 3310-3:1990 TEST SIEVES — TECHNICAL REQUIREMENTS AND TESTING — PART 3: TEST SIEVES OF ELECTROFORMED SHEETSTECHNICAL COMMITTEE: ISO/TC 24/SC 8 TEST SIEVES, SIEVING, AND INDUSTRIAL SCREENS
-
5.16 SUPPLY CHAIN ANALYSISPROMINENT COMPANIESSMALL AND MEDIUM-SIZED ENTERPRISESEND USERS
- 5.17 ECOSYSTEM MARKET MAP
- 5.18 PRICING ANALYSIS
-
5.19 TRADE ANALYSISTRADE ANALYSIS OF PARTICLE SIZE ANALYSIS
- 5.20 PATENT ANALYSIS
-
5.21 PORTER’S FIVE FORCES ANALYSISTHREAT OF NEW ENTRANTSTHREAT OF SUBSTITUTESBARGAINING POWER OF SUPPLIERSBARGAINING POWER OF BUYERSINTENSITY OF COMPETITIVE RIVALRY
- 5.22 KEY CONFERENCES AND EVENTS IN 2023–2024
- 5.23 TECHNOLOGY ANALYSIS
- 5.24 TRENDS/DISRUPTIONS IMPACTING CUSTOMER BUSINESSES
-
5.25 KEY STAKEHOLDERS & BUYING CRITERIAKEY STAKEHOLDERSIMPACT ANALYSIS OF KEY BUYING CRITERIACUSTOMER UNMET NEEDS AND KEY PAIN POINTS
-
5.26 CASE STUDY ANALYSISTECHNOLOGY SOLUTIONQUALITY CONTROL OF MEDICAL CERAMICS THROUGH PARTICLE SIZE ANALYSIS
- 6.1 INTRODUCTION
-
6.2 LASER DIFFRACTIONTECHNOLOGICAL ADVANTAGES RESULT IN HIGHER ADOPTION AMONG END USERS
-
6.3 DYNAMIC LIGHT SCATTERINGNANOTECHNOLOGICAL APPLICATIONS TO DRIVE GROWTH OF SEGMENT
-
6.4 IMAGINGDYNAMIC IMAGING- USER-FRIENDLINESS AND HIGH SPEED DRIVE MARKET GROWTHSTATIC IMAGING- HIGH-RESOLUTION PARTICLE SIZE AND SHAPE INFORMATION OUTPUT TO PUSH MARKET GROWTH
-
6.5 NANOPARTICLE TRACKING ANALYSIS (NTA)USE IN ADVANCED APPLICATIONS DRIVES DEMAND
-
6.6 COULTER PRINCIPLEWIDELY ADOPTED IN HEALTHCARE INDUSTRY FOR CELLULAR SIZE ANALYSIS
-
6.7 SIEVE ANALYSISDEVELOPMENT OF OTHER ADVANCED AND ACCURATE TECHNIQUES DISRUPTS GROWTH OF SEGMENT
- 6.8 OTHER TECHNOLOGIES
- 7.1 INTRODUCTION
-
7.2 WET DISPERSIONWELL-ESTABLISHED DISPERSION METHOD, ESPECIALLY FOR TOUGH SAMPLES/MATERIALS
-
7.3 DRY DISPERSIONEASE OF USE COMPARED TO WET DISPERSION METHODS TO DRIVE MARKET GROWTH
-
7.4 SPRAY DISPERSIONINCREASED USE IN PHARMACEUTICAL INDUSTRY TO DRIVE MARKET GROWTH
- 8.1 INTRODUCTION
-
8.2 BENCHTOP ANALYZERSFIND WIDE-SCALE USE FOR ENHANCED PRECISION AND EFFICIENCY IN MODERN LABORATORIES
-
8.3 PORTABLE ANALYZERSREVOLUTIONIZING LANDSCAPE OF PARTICLE SIZE ANALYSIS
- 9.1 INTRODUCTION
-
9.2 HEALTHCARE INDUSTRYPHARMACEUTICAL & BIOTECHNOLOGY COMPANIES- Crucial for raw material assessment & quality controlPUBLIC & PRIVATE RESEARCH INSTITUTIONS- Active government investment to support nanotechnology researchACADEMIC INSTITUTIONS- Increasing focus on nanotechnology-related research and studies
-
9.3 COSMETICS INDUSTRYAPPLICATION IN MANUFACTURING AND QUALITY CONTROL OF FINAL PRODUCTS TO SUPPORT MARKET GROWTH
-
9.4 CHEMICALS & PETROLEUM INDUSTRYEXPANDING CHEMICALS & PETROLEUM INDUSTRY TO REFLECT INCREASING DEMAND
-
9.5 MINING, MINERALS, AND CEMENT INDUSTRYGROWING MARKET SUSTAINED BY WIDE-RANGING PARTICLE SIZE ANALYSIS APPLICATIONS
-
9.6 FOOD & BEVERAGE INDUSTRYGROWING CONCERNS OVER FOOD QUALITY SAFETY AND COMPLIANCE IN EMERGING ECONOMIES TO PUSH MARKET
- 9.7 OTHER INDUSTRIES
- 10.1 INTRODUCTION
-
10.2 NORTH AMERICANORTH AMERICA: RECESSION IMPACTUS- Presence of large pharmaceutical and biotechnological companies to support market growthCANADA- Increasing number of conferences on nanotechnology to drive growth of market
-
10.3 EUROPEEUROPE: RECESSION IMPACTGERMANY- Increasing number of conferences and workshops to push adoption of particle size analyzersUK- Academia and research institutions to play major role in demand for particle size analyzersFRANCE- Public-private investments in biotechnology to support adoption of particle size analyzersITALY- Well-established manufacturing and research infrastructure to push utilization of particle size analyzersSPAIN- Favorable environment for pharma and biotech companies and SMEs to support demandREST OF EUROPE
-
10.4 ASIA PACIFICASIA PACIFIC: RECESSION IMPACTCHINA- Growing end user base to push demand for particle size analysisJAPAN- Rising R&D expenditure to drive marketINDIA- Growing pharmaceutical manufacturing base to boost demandAUSTRALIA- Strong focus on biotechnology-based manufacturing and research to fuel market growthSOUTH KOREA- Strong focus on research & development activities to drive market growthREST OF ASIA PACIFIC
-
10.5 LATIN AMERICALATIN AMERICA: RECESSION IMPACTBRAZIL- Lack of stringent government guidelines to hinder market growthMEXICO- Well-established mining and petroleum industry base in country to boost market growthREST OF LATIN AMERICA
-
10.6 MIDDLE EAST & AFRICAMULTIPLE CONFERENCES AND EXHIBITIONS TO PROMOTE UTILIZATION OF PARTICLE SIZE ANALYZERS IN REGIONMIDDLE EAST & AFRICA: RECESSION IMPACT
- 11.1 OVERVIEW
-
11.2 KEY PLAYER STRATEGIESOVERVIEW OF STRATEGIES ADOPTED BY PLAYERS IN PARTICLE SIZE ANALYSIS MARKET
- 11.3 REVENUE SHARE ANALYSIS
-
11.4 MARKET SHARE ANALYSISPARTICLE SIZE ANALYSIS MARKET SHARE, BY KEY PLAYER, 2022
-
11.5 COMPANY EVALUATION MATRIXSTARSEMERGING LEADERSPERVASIVE PLAYERSPARTICIPANTS
-
11.6 START-UP/SME EVALUATION MATRIXPROGRESSIVE COMPANIESRESPONSIVE COMPANIESDYNAMIC COMPANIESSTARTING BLOCKS
-
11.7 COMPETITIVE BENCHMARKINGPRODUCT AND GEOGRAPHIC FOOTPRINT ANALYSIS- Regional footprint
- 11.8 COMPETITIVE SCENARIO AND TRENDS
-
12.1 KEY PLAYERSSPECTRIS- Business overview- Conversion Rate (EURO TO USD)- Products offered- MnM viewDANAHER- Business overview- Products offered- Recent developments- MnM viewHORIBA- Business overview- Conversion Rate (YEN TO USD)- Products offered- Recent developments- MnM viewANTON PAAR GMBH- Business overview- Products offered- Recent developmentsBETTERSIZE INSTRUMENTS LTD.- Business overview- Products offered- Recent developmentsNOVA VENTURES GROUP- Business overview- Products offeredFRITSCH GMBH- Business overview- Products offered- Recent developmentsLS INSTRUMENTS- Business overview- Products offered- Recent developmentsMETTLER TOLEDO- Business overview- Products offeredVERDER SCIENTIFIC GMBH & CO. KG- Business overview- Products offered- Recent developmentsSYMPATEC GMBH- Business overview- Products offered- Recent developmentsSHIMADZU CORPORATION- Business overview- Conversion Rate (YEN TO USD)- Products offeredTSI- Business overview- Products offered- Recent developmentsDANDONG HMKTEST INSTRUMENT CO., LTD.- Business overview- Products offeredMICROMERITICS INSTRUMENT CORPORATION- Business overview- Products offered- Recent developments
-
12.2 OTHER PLAYERSPAMAS PARTIKELMESS – UND ANALYSESYTEME GMBHJINAN WINNER PARTICLE INSTRUMENT STOCK CO., LTD.3P INSTRUMENTSIZON SCIENCE LIMITEDCSC SCIENTIFIC COMPANY, INC.INPROCESS-LSPYOKOGAWA FLUID IMAGING TECHNOLOGIES, INCAPIX ANALYTICSGENIZER LLCTECHNOVALUE
- 13.1 DISCUSSION GUIDE
- 13.2 KNOWLEDGESTORE: MARKETSANDMARKETS’ SUBSCRIPTION PORTAL
- 13.3 CUSTOMIZATION OPTIONS
- 13.4 RELATED REPORTS
- 13.5 AUTHOR DETAILS
- TABLE 1 NORTH AMERICA: REGULATORY BODIES, GOVERNMENT AGENCIES, AND OTHER ORGANIZATIONS
- TABLE 2 EUROPE: REGULATORY BODIES, GOVERNMENT AGENCIES, AND OTHER ORGANIZATIONS
- TABLE 3 ASIA PACIFIC: REGULATORY BODIES, GOVERNMENT AGENCIES, AND OTHER ORGANIZATIONS
- TABLE 4 REST OF THE WORLD: REGULATORY BODIES, GOVERNMENT AGENCIES, AND OTHER ORGANIZATIONS
- TABLE 5 ISO STANDARDS FOR PARTICLE SIZE ANALYSIS INSTRUMENTS
- TABLE 6 PARTICLE SIZE ANALYSIS MARKET: ROLE IN ECOSYSTEM
- TABLE 7 IMPORT DATA FOR INSTRUMENTS, APPLIANCES, AND MACHINES FOR MEASURING OR CHECKING (HS CODE 903180), BY COUNTRY, 2018–2022 (USD THOUSAND)
- TABLE 8 EXPORT DATA FOR INSTRUMENTS, APPLIANCES, AND MACHINES FOR MEASURING OR CHECKING (HS CODE 903180), BY COUNTRY, 2018–2022 (USD THOUSAND)
- TABLE 9 IMPORT DATA FOR INSTRUMENTS AND APPARATUS FOR PHYSICAL OR CHEMICAL ANALYSIS OR FOR MEASURING OR CHECKING VISCOSITY (HS CODE 902780), BY COUNTRY, 2018–2022 (USD THOUSAND)
- TABLE 10 EXPORT DATA FOR INSTRUMENTS AND APPARATUS FOR PHYSICAL OR CHEMICAL ANALYSIS OR FOR MEASURING OR CHECKING VISCOSITY (HS CODE 902780), BY COUNTRY, 2018–2022 (USD THOUSAND)
- TABLE 11 PORTER’S FIVE FORCES ANALYSIS: PARTICLE SIZE ANALYSIS MARKET
- TABLE 12 MAJOR CONFERENCES AND EVENTS IN PARTICLE SIZE ANALYSIS MARKET, 2023–2024
- TABLE 13 EMERGING TECHNOLOGIES
- TABLE 14 KEY REQUIREMENTS OF STAKEHOLDERS ON BUYING CRITERIA OF PARTICLE SIZE ANALYSIS SYSTEMS
- TABLE 15 KEY REQUIREMENTS OF STAKEHOLDERS ON BUYING CRITERIA AND THEIR IMPACT ON PURCHASE DECISION
- TABLE 16 MULTI-METHOD ANALYSIS OF NANOPARTICLES: BET SURFACE AREA, TEM, AND DLS INSIGHTS
- TABLE 17 MEASURING PSD OF ALUMINA POWDER SAMPLES AUTOMATICALLY
- TABLE 18 PARTICLE SIZE ANALYSIS MARKET, BY TECHNOLOGY, 2021–2028 (USD MILLION)
- TABLE 19 LASER DIFFRACTION: PARTICLE SIZE ANALYSIS MARKET, BY REGION, 2021–2028 (USD MILLION)
- TABLE 20 LASER DIFFRACTION: PARTICLE SIZE ANALYSIS MARKET, BY END USER, 2021–2028 (USD MILLION)
- TABLE 21 DYNAMIC LIGHT SCATTERING: PARTICLE SIZE ANALYSIS MARKET, BY REGION, 2021–2028 (USD MILLION)
- TABLE 22 DYNAMIC LIGHT SCATTERING: PARTICLE SIZE ANALYSIS MARKET, BY END USER, 2021–2028 (USD MILLION)
- TABLE 23 IMAGING: PARTICLE SIZE ANALYSIS MARKET, BY TYPE, 2021–2028 (USD MILLION)
- TABLE 24 IMAGING: PARTICLE SIZE ANALYSIS MARKET, BY END USER, 2021–2028 (USD MILLION)
- TABLE 25 DYNAMIC IMAGING: PARTICLE SIZE ANALYSIS MARKET, BY REGION, 2021–2028 (USD MILLION)
- TABLE 26 STATIC IMAGING: PARTICLE SIZE ANALYSIS MARKET, BY REGION, 2021–2028 (USD MILLION)
- TABLE 27 NANOPARTICLE TRACKING ANALYSIS: PARTICLE SIZE ANALYSIS MARKET, BY REGION, 2021–2028 (USD MILLION)
- TABLE 28 NANOPARTICLE TRACKING ANALYSIS: PARTICLE SIZE ANALYSIS MARKET, BY END USER, 2021–2028 (USD MILLION)
- TABLE 29 COULTER PRINCIPLE: PARTICLE SIZE ANALYSIS MARKET, BY REGION, 2021–2028 (USD MILLION)
- TABLE 30 COULTER PRINCIPLE: PARTICLE SIZE ANALYSIS MARKET, BY END USER, 2021–2028 (USD MILLION)
- TABLE 31 SIEVE ANALYSIS: PARTICLE SIZE ANALYSIS MARKET, BY REGION, 2021–2028 (USD MILLION)
- TABLE 32 SIEVE ANALYSIS: PARTICLE SIZE ANALYSIS MARKET, BY END USER, 2021–2028 (USD MILLION)
- TABLE 33 OTHER TECHNOLOGIES: PARTICLE SIZE ANALYSIS MARKET, BY REGION, 2021–2028 (USD MILLION)
- TABLE 34 OTHER TECHNOLOGIES: PARTICLE SIZE ANALYSIS MARKET, BY END USER, 2021–2028 (USD MILLION)
- TABLE 35 PARTICLE SIZE ANALYSIS MARKET, BY DISPERSION, 2021–2028 (USD MILLION)
- TABLE 36 WET DISPERSION: PARTICLE SIZE ANALYSIS MARKET, BY REGION, 2021–2028 (USD MILLION)
- TABLE 37 DRY DISPERSION: PARTICLE SIZE ANALYSIS MARKET, BY REGION, 2021–2028 (USD MILLION)
- TABLE 38 SPRAY DISPERSION: PARTICLE SIZE ANALYSIS MARKET, BY REGION, 2021–2028 (USD MILLION)
- TABLE 39 PARTICLE SIZE ANALYSIS MARKET, BY TYPE, 2021–2028 (USD MILLION)
- TABLE 40 BENCHTOP ANALYZERS: PARTICLE SIZE ANALYSIS MARKET, BY REGION, 2021–2028 (USD MILLION)
- TABLE 41 PORTABLE ANALYZERS: PARTICLE SIZE ANALYSIS MARKET, BY REGION, 2021–2028 (USD MILLION)
- TABLE 42 PARTICLE SIZE ANALYSIS MARKET, BY END USER, 2021–2028 (USD MILLION)
- TABLE 43 HEALTHCARE INDUSTRY: PARTICLE SIZE ANALYSIS MARKET, BY END USER, 2021–2028 (USD MILLION)
- TABLE 44 HEALTHCARE INDUSTRY: PARTICLE SIZE ANALYSIS MARKET, BY REGION, 2021–2028 (USD MILLION)
- TABLE 45 PARTICLE SIZE ANALYSIS MARKET FOR PHARMACEUTICAL & BIOTECHNOLOGY COMPANIES, BY REGION, 2021–2028 (USD MILLION)
- TABLE 46 PARTICLE SIZE ANALYSIS MARKET FOR PUBLIC & PRIVATE RESEARCH INSTITUTIONS, BY REGION, 2021–2028 (USD MILLION)
- TABLE 47 PARTICLE SIZE ANALYSIS MARKET FOR ACADEMIC INSTITUTIONS, BY REGION, 2021–2028 (USD MILLION)
- TABLE 48 COSMETICS: PARTICLE SIZE ANALYSIS MARKET, BY REGION, 2021–2028 (USD MILLION)
- TABLE 49 CHEMICALS & PETROLEUM INDUSTRY: PARTICLE SIZE ANALYSIS MARKET, BY REGION, 2021–2028 (USD MILLION)
- TABLE 50 MINING, MINERALS, AND CEMENT INDUSTRY: PARTICLE SIZE ANALYSIS MARKET, BY REGION, 2021–2028 (USD MILLION)
- TABLE 51 FOOD & BEVERAGE INDUSTRY: PARTICLE SIZE ANALYSIS MARKET, BY REGION, 2021–2028 (USD MILLION)
- TABLE 52 OTHER INDUSTRIES: PARTICLE SIZE ANALYSIS MARKET, BY REGION, 2021–2028 (USD MILLION)
- TABLE 53 PARTICLE SIZE ANALYSIS MARKET, BY REGION, 2021–2028 (USD MILLION)
- TABLE 54 NORTH AMERICA: PARTICLE SIZE ANALYSIS MARKET, BY COUNTRY, 2021–2028 (USD MILLION)
- TABLE 55 NORTH AMERICA: PARTICLE SIZE ANALYSIS MARKET, BY TECHNOLOGY, 2021–2028 (USD MILLION)
- TABLE 56 NORTH AMERICA: PARTICLE SIZE ANALYSIS MARKET FOR IMAGING, BY TYPE, 2021–2028 (USD MILLION)
- TABLE 57 NORTH AMERICA: PARTICLE SIZE ANALYSIS MARKET, BY DISPERSION, 2021–2028 (USD MILLION)
- TABLE 58 NORTH AMERICA: PARTICLE SIZE ANALYSIS MARKET, BY TYPE, 2021–2028 (USD MILLION)
- TABLE 59 NORTH AMERICA: PARTICLE SIZE ANALYSIS MARKET, BY END USER, 2021–2028 (USD MILLION)
- TABLE 60 NORTH AMERICA: PARTICLE SIZE ANALYSIS MARKET FOR HEALTHCARE INDUSTRY, BY END USER, 2021–2028 (USD MILLION)
- TABLE 61 US: PARTICLE SIZE ANALYSIS MARKET, BY TECHNOLOGY, 2021–2028 (USD MILLION)
- TABLE 62 US: PARTICLE SIZE ANALYSIS MARKET FOR IMAGING, BY TYPE, 2021–2028 (USD MILLION)
- TABLE 63 CANADA: PARTICLE SIZE ANALYSIS MARKET, BY TECHNOLOGY, 2021–2028 (USD MILLION)
- TABLE 64 CANADA: PARTICLE SIZE ANALYSIS MARKET FOR IMAGING, BY TYPE, 2021–2028 (USD MILLION)
- TABLE 65 EUROPE: PARTICLE SIZE ANALYSIS MARKET, BY COUNTRY, 2021–2028 (USD MILLION)
- TABLE 66 EUROPE: PARTICLE SIZE ANALYSIS MARKET, BY TECHNOLOGY, 2021–2028 (USD MILLION)
- TABLE 67 EUROPE: PARTICLE SIZE ANALYSIS MARKET FOR IMAGING, BY TYPE, 2021–2028 (USD MILLION)
- TABLE 68 EUROPE: PARTICLE SIZE ANALYSIS MARKET, BY DISPERSION, 2021–2028 (USD MILLION)
- TABLE 69 EUROPE: PARTICLE SIZE ANALYSIS MARKET, BY TYPE, 2021–2028 (USD MILLION)
- TABLE 70 EUROPE: PARTICLE SIZE ANALYSIS MARKET, BY END USER, 2021–2028 (USD MILLION)
- TABLE 71 EUROPE: PARTICLE SIZE ANALYSIS MARKET FOR HEALTHCARE INDUSTRY, BY END USER, 2021–2028 (USD MILLION)
- TABLE 72 GERMANY: PARTICLE SIZE ANALYSIS MARKET, BY TECHNOLOGY, 2021–2028 (USD MILLION)
- TABLE 73 GERMANY: PARTICLE SIZE ANALYSIS MARKET FOR IMAGING, BY TYPE, 2021–2028 (USD MILLION)
- TABLE 74 UK: PARTICLE SIZE ANALYSIS MARKET, BY TECHNOLOGY, 2021–2028 (USD MILLION)
- TABLE 75 UK: PARTICLE SIZE ANALYSIS MARKET FOR IMAGING, BY TYPE, 2021–2028 (USD MILLION)
- TABLE 76 FRANCE: PARTICLE SIZE ANALYSIS MARKET, BY TECHNOLOGY, 2021–2028 (USD MILLION)
- TABLE 77 FRANCE: PARTICLE SIZE ANALYSIS MARKET FOR IMAGING, BY TYPE, 2021–2028 (USD MILLION)
- TABLE 78 ITALY: PARTICLE SIZE ANALYSIS MARKET, BY TECHNOLOGY, 2021–2028 (USD MILLION)
- TABLE 79 ITALY: PARTICLE SIZE ANALYSIS MARKET FOR IMAGING, BY TYPE, 2021–2028 (USD MILLION)
- TABLE 80 SPAIN: PARTICLE SIZE ANALYSIS MARKET, BY TECHNOLOGY, 2021–2028 (USD MILLION)
- TABLE 81 SPAIN: PARTICLE SIZE ANALYSIS MARKET FOR IMAGING, BY TYPE, 2021–2028 (USD MILLION)
- TABLE 82 REST OF EUROPE: PARTICLE SIZE ANALYSIS MARKET, BY TECHNOLOGY, 2021–2028 (USD MILLION)
- TABLE 83 REST OF EUROPE: PARTICLE SIZE ANALYSIS MARKET FOR IMAGING, BY TYPE, 2021–2028 (USD MILLION)
- TABLE 84 ASIA PACIFIC: PARTICLE SIZE ANALYSIS MARKET, BY COUNTRY, 2021–2028 (USD MILLION)
- TABLE 85 ASIA PACIFIC: PARTICLE SIZE ANALYSIS MARKET, BY TECHNOLOGY, 2021–2028 (USD MILLION)
- TABLE 86 ASIA PACIFIC: PARTICLE SIZE ANALYSIS MARKET FOR IMAGING, BY TYPE, 2021–2028 (USD MILLION)
- TABLE 87 ASIA PACIFIC: PARTICLE SIZE ANALYSIS MARKET, BY DISPERSION, 2021–2028 (USD MILLION)
- TABLE 88 ASIA PACIFIC: PARTICLE SIZE ANALYSIS MARKET, BY TYPE, 2021–2028 (USD MILLION)
- TABLE 89 ASIA PACIFIC: PARTICLE SIZE ANALYSIS MARKET, BY END USER, 2021–2028 (USD MILLION)
- TABLE 90 ASIA PACIFIC: PARTICLE SIZE ANALYSIS MARKET FOR HEALTHCARE INDUSTRY, BY END USER, 2021–2028 (USD MILLION)
- TABLE 91 CHINA: PARTICLE SIZE ANALYSIS MARKET, BY TECHNOLOGY, 2021–2028 (USD MILLION)
- TABLE 92 CHINA: PARTICLE SIZE ANALYSIS MARKET FOR IMAGING, BY TYPE, 2021–2028 (USD MILLION)
- TABLE 93 JAPAN: PARTICLE SIZE ANALYSIS MARKET, BY TECHNOLOGY, 2021–2028 (USD MILLION)
- TABLE 94 JAPAN: PARTICLE SIZE ANALYSIS MARKET FOR IMAGING, BY TYPE, 2021–2028 (USD MILLION)
- TABLE 95 INDIA: PARTICLE SIZE ANALYSIS MARKET, BY TECHNOLOGY, 2021–2028 (USD MILLION)
- TABLE 96 INDIA: PARTICLE SIZE ANALYSIS MARKET FOR IMAGING, BY TYPE, 2021–2028 (USD MILLION)
- TABLE 97 AUSTRALIA: PARTICLE SIZE ANALYSIS MARKET, BY TECHNOLOGY, 2021–2028 (USD MILLION)
- TABLE 98 AUSTRALIA: PARTICLE SIZE ANALYSIS MARKET FOR IMAGING, BY TYPE, 2021–2028 (USD MILLION)
- TABLE 99 SOUTH KOREA: PARTICLE SIZE ANALYSIS MARKET, BY TECHNOLOGY, 2021–2028 (USD MILLION)
- TABLE 100 SOUTH KOREA: PARTICLE SIZE ANALYSIS MARKET FOR IMAGING, BY TYPE, 2021–2028 (USD MILLION)
- TABLE 101 REST OF ASIA PACIFIC: PARTICLE SIZE ANALYSIS MARKET, BY TECHNOLOGY, 2021–2028 (USD MILLION)
- TABLE 102 REST OF ASIA PACIFIC: PARTICLE SIZE ANALYSIS MARKET FOR IMAGING, BY TYPE, 2021–2028 (USD MILLION)
- TABLE 103 LATIN AMERICA: PARTICLE SIZE ANALYSIS MARKET, BY COUNTRY, 2021–2028 (USD MILLION)
- TABLE 104 LATIN AMERICA: PARTICLE SIZE ANALYSIS MARKET, BY TECHNOLOGY, 2021–2028 (USD MILLION)
- TABLE 105 LATIN AMERICA: PARTICLE SIZE ANALYSIS MARKET FOR IMAGING, BY TYPE, 2021–2028 (USD MILLION)
- TABLE 106 LATIN AMERICA: PARTICLE SIZE ANALYSIS MARKET, BY DISPERSION, 2021–2028(USD MILLION)
- TABLE 107 LATIN AMERICA: PARTICLE SIZE ANALYSIS MARKET, BY TYPE, 2021–2028 (USD MILLION)
- TABLE 108 LATIN AMERICA: PARTICLE SIZE ANALYSIS MARKET, BY END USER, 2021–2028 (USD MILLION)
- TABLE 109 LATIN AMERICA: PARTICLE SIZE ANALYSIS MARKET FOR HEALTHCARE INDUSTRY, BY END USER, 2021–2028 (USD MILLION)
- TABLE 110 BRAZIL: PARTICLE SIZE ANALYSIS MARKET, BY TECHNOLOGY, 2021–2028 (USD MILLION)
- TABLE 111 BRAZIL: PARTICLE SIZE ANALYSIS MARKET FOR IMAGING, BY TYPE, 2021–2028 (USD MILLION)
- TABLE 112 MEXICO: PARTICLE SIZE ANALYSIS MARKET, BY TECHNOLOGY, 2021–2028 (USD MILLION)
- TABLE 113 MEXICO: PARTICLE SIZE ANALYSIS MARKET FOR IMAGING, BY TYPE, 2021–2028 (USD MILLION)
- TABLE 114 REST OF LATIN AMERICA: PARTICLE SIZE ANALYSIS MARKET, BY TECHNOLOGY, 2021–2028 (USD MILLION)
- TABLE 115 REST OF LATIN AMERICA: PARTICLE SIZE ANALYSIS MARKET FOR IMAGING, BY TYPE, 2021–2028 (USD MILLION)
- TABLE 116 MIDDLE EAST & AFRICA: PARTICLE SIZE ANALYSIS MARKET, BY TECHNOLOGY, 2021–2028 (USD MILLION)
- TABLE 117 MIDDLE EAST & AFRICA: PARTICLE SIZE ANALYSIS MARKET FOR IMAGING, BY TYPE, 2021–2028 (USD MILLION)
- TABLE 118 MIDDLE EAST & AFRICA: PARTICLE SIZE ANALYSIS MARKET, BY DISPERSION, 2021–2028 (USD MILLION)
- TABLE 119 MIDDLE EAST & AFRICA: PARTICLE SIZE ANALYSIS MARKET, BY TYPE, 2021–2028 (USD MILLION)
- TABLE 120 MIDDLE EAST & AFRICA: PARTICLE SIZE ANALYSIS MARKET, BY END USER, 2021–2028 (USD MILLION)
- TABLE 121 MIDDLE EAST & AFRICA: PARTICLE SIZE ANALYSIS MARKET FOR HEALTHCARE INDUSTRY, BY END USER, 2021–2028 (USD MILLION)
- TABLE 122 OVERVIEW OF STRATEGIES DEPLOYED BY KEY MANUFACTURING COMPANIES
- TABLE 123 PARTICLE SIZE ANALYSIS MARKET: DEGREE OF COMPETITION
- TABLE 124 PRODUCT AND GEOGRAPHIC FOOTPRINT ANALYSIS OF TOP PLAYERS IN PARTICLE SIZE ANALYSIS MARKET
- TABLE 125 PRODUCT FOOTPRINT
- TABLE 126 PRODUCT LAUNCHES & APPROVALS (2020–SEPTEMBER 2023)
- TABLE 127 DEALS (2020–SEPTEMBER 2023)
- TABLE 128 OTHER DEVELOPMENTS (2020–SEPTEMBER 2023)
- TABLE 129 SPECTRIS: COMPANY OVERVIEW
- TABLE 130 DANAHER: COMPANY OVERVIEW
- TABLE 131 HORIBA: COMPANY OVERVIEW
- TABLE 132 ANTON PAAR GMBH: COMPANY OVERVIEW
- TABLE 133 BETTERSIZE INSTRUMENTS LTD.: COMPANY OVERVIEW
- TABLE 134 NOVA VENTURES GROUP: COMPANY OVERVIEW
- TABLE 135 FRITSCH GMBH: COMPANY OVERVIEW
- TABLE 136 LS INSTRUMENTS: COMPANY OVERVIEW
- TABLE 137 METTLER TOLEDO: COMPANY OVERVIEW
- TABLE 138 VERDER SCIENTIFIC GMBH & CO. KG: COMPANY OVERVIEW
- TABLE 139 SYMPATEC GMBH: COMPANY OVERVIEW
- TABLE 140 SHIMADZU CORPORATION: COMPANY OVERVIEW
- TABLE 141 TSI: COMPANY OVERVIEW
- TABLE 142 DANDONG HMKTEST INSTRUMENT CO., LTD.: COMPANY OVERVIEW
- TABLE 143 MICROMERITICS INSTRUMENT CORPORATION: COMPANY OVERVIEW
- FIGURE 1 RESEARCH DESIGN
- FIGURE 2 PARTICLE SIZE ANALYSIS MARKET: BREAKDOWN OF PRIMARIES
- FIGURE 3 RESEARCH METHODOLOGY: HYPOTHESIS BUILDING
- FIGURE 4 MARKET SIZE ESTIMATION: BOTTOM-UP APPROACH
- FIGURE 5 PARTICLE SIZE ANALYSIS MARKET: END USER-BASED ESTIMATION
- FIGURE 6 DATA TRIANGULATION METHODOLOGY
- FIGURE 7 PARTICLE SIZE ANALYSIS MARKET, BY TECHNOLOGY, 2023 VS. 2028 (USD MILLION)
- FIGURE 8 PARTICLE SIZE ANALYSIS MARKET, BY DISPERSION, 2023 VS. 2028 (USD MILLION)
- FIGURE 9 PARTICLE SIZE ANALYSIS MARKET, BY TYPE, 2023 VS. 2028 (USD MILLION)
- FIGURE 10 PARTICLE SIZE ANALYSIS MARKET, BY END USER, 2023 VS. 2028 (USD MILLION)
- FIGURE 11 PARTICLE SIZE ANALYSIS MARKET SHARE FOR HEALTHCARE INDUSTRY, BY END USER (2023 VS. 2028)
- FIGURE 12 PARTICLE SIZE ANALYSIS MARKET: REGIONAL SNAPSHOT
- FIGURE 13 INCREASING RESEARCH ACTIVITIES IN NANOTECHNOLOGY TO DRIVE MARKET GROWTH
- FIGURE 14 LASER DIFFRACTION SEGMENT TO DOMINATE MARKET DURING 2023–2028
- FIGURE 15 NORTH AMERICA - KEY MARKET FOR ALL END USER SEGMENTS IN 2022
- FIGURE 16 INDIA TO BE FASTEST-GROWING MARKET FOR PARTICLE SIZE ANALYSIS PRODUCTS DURING FORECAST PERIOD
- FIGURE 17 PARTICLE SIZE ANALYSIS MARKET: DRIVERS, RESTRAINTS, OPPORTUNITIES, AND CHALLENGES
- FIGURE 18 SUPPLY CHAIN ANALYSIS: PARTICLE SIZE ANALYSIS MARKET
- FIGURE 19 PATENT DETAILS FOR PARTICLE SIZE ANALYSIS (JANUARY 2013–AUGUST 2023)
- FIGURE 20 NORTH AMERICA: PARTICLE SIZE ANALYSIS MARKET SNAPSHOT
- FIGURE 21 ASIA PACIFIC: PARTICLE SIZE ANALYSIS MARKET SNAPSHOT
- FIGURE 22 REVENUE SHARE ANALYSIS OF TOP THREE PLAYERS IN PARTICLE SIZE ANALYSIS MARKET (2021–2028)
- FIGURE 23 MARKET SHARE ANALYSIS OF TOP PLAYERS IN PARTICLE SIZE ANALYSIS MARKET, 2022
- FIGURE 24 PARTICLE SIZE ANALYSIS MARKET: COMPANY EVALUATION MATRIX, 2022
- FIGURE 25 PARTICLE SIZE ANALYSIS MARKET: START-UP/SME EVALUATION MATRIX, 2022
- FIGURE 26 SPECTRIS: COMPANY SNAPSHOT (2022)
- FIGURE 27 DANAHER: COMPANY SNAPSHOT (2022)
- FIGURE 28 HORIBA: COMPANY SNAPSHOT (2022)
- FIGURE 29 METTLER TOLEDO: COMPANY SNAPSHOT (2022)
- FIGURE 30 SHIMADZU CORPORATION: COMPANY SNAPSHOT
The study involved four major activities in estimating the current size of the particle size analysis market. Exhaustive secondary research was done to collect information on the market, peer, and parent markets. The next step was to validate these findings, assumptions, and sizing with industry experts across the value chain through primary research. Both top-down and bottom-up approaches were employed to estimate the complete market size. After that, market breakdown and data triangulation were used to estimate the market size of segments and subsegments.
Secondary Research
The secondary research process involves the widespread use of secondary sources, directories, databases (such as Bloomberg Businessweek, Factiva, and D&B Hoovers), white papers, annual reports, company house documents, investor presentations, and SEC filings of companies. Secondary research was used to identify and collect information useful for the extensive, technical, market-oriented, and commercial particle size analysis market study. It was also used to obtain important information about the key players and market classification & segmentation according to industry trends to the bottom-most level and key developments related to market and technology perspectives. A database of the key industry leaders was also prepared using secondary research.
Primary Research
In the primary research process, various supply and demand sources were interviewed to obtain qualitative and quantitative information for this report. The primary sources from the supply side include industry experts such as CEOs, vice presidents, marketing and sales directors, technology & innovation directors, and related key executives from various key companies and organizations in the particle size analysis market. The primary sources from the demand side include medical OEMs, CDMOs, and service providers, managers, CXO and directors, and Executives. Primary research was conducted to validate the market segmentation, identify key players, and gather insights on key industry trends & key market dynamics.
A breakdown of the primary respondents is provided below:
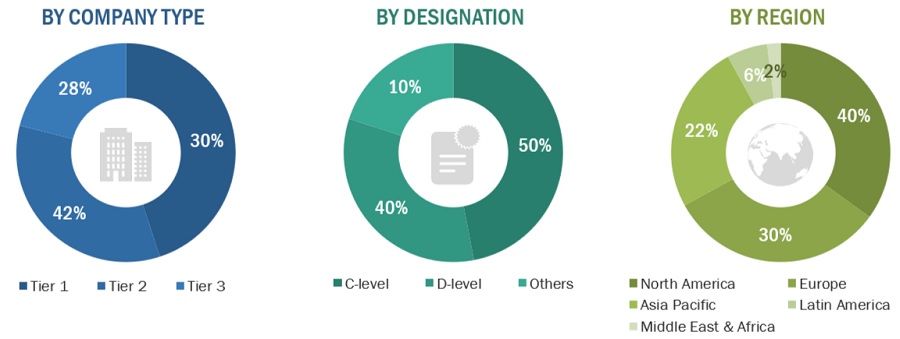
*Others include sales managers, marketing managers, business development managers, product managers, distributors, and suppliers.
Note: Companies are classified into tiers based on their total revenue. As of 2022, Tier 1 = >USD 1,000 million, Tier 2 = USD 500–1,000 million, and Tier 3 = <USD 500 million.
To know about the assumptions considered for the study, download the pdf brochure
Market Estimation Methodology
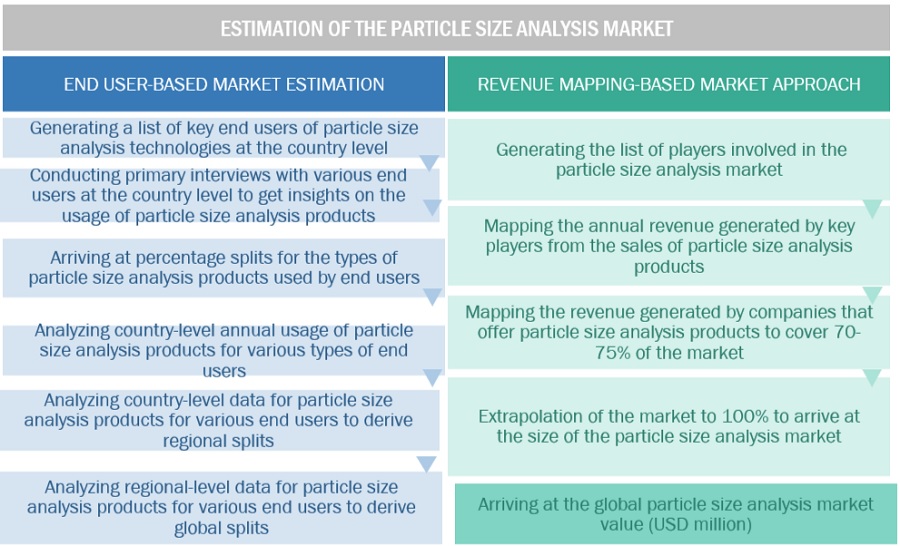
In this report, the size of the particle size analysis market’s size was determined using the revenue share analysis of leading players. For this purpose, key players in the market were identified, and their revenues from the market business were determined through various insights gathered during the primary and secondary research phases. Secondary research included the study of the annual and financial reports of the top market players. In contrast, primary research included extensive interviews with key opinion leaders, such as CEOs, directors, and key marketing executives.
Segmental revenues were calculated based on the revenue mapping of major solution/service providers to calculate the global market value. This process involved the following steps:
- Generating a list of major global players operating in the particle size analysis market.
- Mapping annual revenues generated by major global players from the product segment (or nearest reported business unit/category)
- Revenue mapping of major players to cover a major share of the global market share as of 2022
- Extrapolating the global value of the particle size analysis market industry
Data Triangulation
After arriving at the overall market size from the market size estimation process explained above, the particle size analysis market was split into segments and subsegments. Data triangulation and market breakdown procedures were employed to complete the overall market engineering process and arrive at the exact statistics for all segments and subsegments. The data was triangulated by studying various factors and trends from both the demand and supply sides. Additionally, the particle size analysis market was validated using top-down and bottom-up approaches.
Market Definition
Particle size analysis, particle size measurement, or particle characterization entails a complex procedure encompassing sample collection, dispersion, and the precise utilization of analytical tools and instruments. Its primary purpose is to assess the size distribution of particles within a given sample, with applicability to solid materials, suspensions, emulsions, and aerosols.
Particle size analysis plays a crucial role in material analysis and quality control, as the size of particles within a material significantly influences its stability, appearance, flow properties, and chemical reactivity. Consequently, particle size analyzers find extensive utilization in the development and production of a wide array of products in industries including pharmaceuticals, chemicals, food, cosmetics, petroleum, mining, and coatings.
Key Stakeholders
- Senior Management
- Academic institutions
- Cosmetic manufacturers
- Chemicals and petroleum manufacturers
- Mining, minerals, and cement manufacturers
- Food and beverage manufacturers
- Pharmaceutical/biopharmaceutical companies
- Research laboratories
- Clinical research organizations (CROS)
- Contract testing laboratories
- Academic universities and medical research center
- R&D Department
- Finance/Procurement Department
Objectives of the Study
- To define, describe, and forecast the size of the particle size analysis market based on technology, dispersion, type, end user, and region
- To provide detailed information regarding the major factors influencing the growth potential of the particle size analysis market (drivers, restraints, opportunities, challenges, and trends)
- To analyze the micro markets with respect to individual growth trends, prospects, and contributions to the particle size analysis market.
- To analyze key growth opportunities in the particle size analysis market for key stakeholders and provide details of the competitive landscape for market leaders
- To forecast the size of market segments and/or subsegments with respect to five major regions, namely, North America (US and Canada), Europe (Germany, France, UK, Spain, Italy, and the RoE), Asia Pacific (Japan, China, India, Australia, South Korea, and the RoAPAC), Latin America (Brazil, Mexico, RoLA), and Middle East and Africa.
- To profile the key players in the particle size analysis market and comprehensively analyze their market shares and core competencies
- To track and analyze the competitive developments undertaken in the particle size analysis market, such as product launches, agreements, expansions, and mergers & acquisitions.
Available Customizations
With the given market data, MarketsandMarkets offers customizations per the company’s specific needs. The following customization options are available for the present particle size analysis market report:
Product Analysis
- Product matrix, which gives a detailed comparison of the product portfolios of the top five companies
Company Information
- Detailed analysis and profiling of additional market players (up to five)
Geographic Analysis
- Further breakdown of the Rest of Europe particle size analysis market into Russia, Belgium, the Netherlands, Switzerland, Austria, Finland, Sweden, Poland, and Portugal, among others
- Further breakdown of the Rest of Asia Pacific diagnostic imaging market into Singapore, Taiwan, New Zealand, Philippines, Malaysia, and other APAC countries
Growth opportunities and latent adjacency in Particle Size Analysis Market