The study involved four major activities for estimating the current global size of the oxygen-free copper market. Exhaustive secondary research was conducted to gather information on the market, the peer market, and the parent market. The next step was to validate these findings, assumptions, and sizes with the industry experts across the value chain of oxygen-free copper through primary research. Both the top-down and bottom-up approaches were employed to estimate the overall size of the oxygen-free copper market. After that, market breakdown and data triangulation procedures were used to determine the size of different segments and sub-segments of the market.
Secondary Research
In the secondary research process, various secondary sources such as Hoovers, Factiva, Bloomberg BusinessWeek, and Dun & Bradstreet were referred to, to identify and collect information for this study on the oxygen free copper market. These secondary sources included annual reports, press releases & investor presentations of companies, white papers, certified publications, articles by recognized authors, regulatory bodies, trade directories, and databases.
Primary Research
Various primary sources from both the supply and demand sides of the oxygen free copper market were interviewed to obtain qualitative and quantitative information. The primary sources from the supply side included industry experts, such as Chief Executive Officers (CEOs), vice presidents, marketing directors, sales professionals, and related key executives from various leading companies and organizations operating in the oxygen free copper industry. The breakdown of the profiles of primary respondents is as follows:
Breakdown of Primary Interviews

Notes: Companies are classified based on their revenue–Tier 1 = >USD 7 billion, Tier 2 = USD 500 million to USD 7 billion, and Tier 3 = <USD 500 million.
Others include sales, marketing, and product managers.
To know about the assumptions considered for the study, download the pdf brochure
Market Size Estimation
Both the top-down and bottom-up approaches were used to estimate and validate the global size of the oxygen-free copper market. These approaches were also used extensively to estimate the size of various dependent segments of the market. The research methodology used to estimate the market size included the following details:
-
The key players were identified through extensive secondary research.
-
The industry’s supply chain and market size, in terms of value, were determined through primary and secondary research processes.
-
All percentage shares, splits, and breakdowns were determined using secondary sources and verified through primary sources.
-
All possible parameters that affect the markets covered in this research study were accounted for, viewed in extensive detail, verified through primary research, and analyzed to obtain the final quantitative and qualitative data.
-
The research includes the study of reports, reviews, and newsletters of key industry players, along with extensive interviews with key officials, such as directors and marketing executives.

To know about the assumptions considered for the study, Request for Free Sample Report

Data Triangulation
After arriving at the overall market size from the estimation process explained above, the total market was split into several segments and sub-segments. The data triangulation and market breakdown procedures were employed, wherever applicable, to complete the overall market engineering process and arrive at the exact statistics for all segments and sub-segments of the oxygen-free copper market. The data was triangulated by studying various factors and trends from both the demand- and supply-side.
In addition, the market size was validated by using both the top-down and bottom-up approaches. Then, it was verified through primary interviews. Hence, for every data segment, there are three sources—top-down approach, bottom-up approach, and expert interviews. The data were assumed to be correct when the values arrived at from the three sources matched.
Market Definition
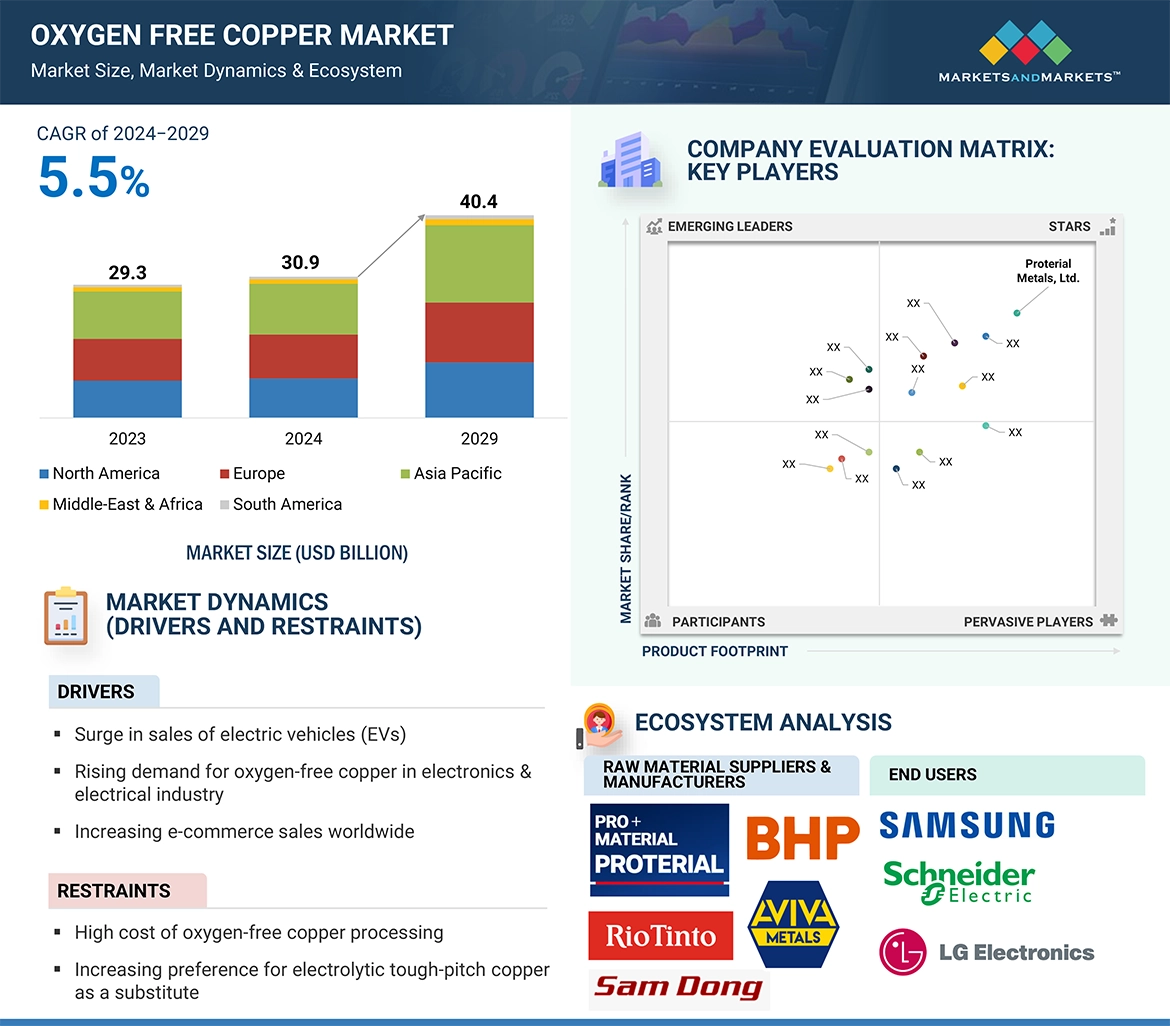
Oxygen-free copper (OFC) is a specialized grade of copper characterized by extremely low oxygen content, typically less than 0.001%. This high-purity copper is produced through a vacuum melting and casting process to eliminate oxygen, resulting in a material with superior electrical conductivity and minimal impurities. Oxygen-free copper is distinguished by its high thermal conductivity, resistance to hydrogen embrittlement, and excellent electrical properties, making it ideal for applications requiring high-performance copper, such as advanced electronics, telecommunications, automotive components, and renewable energy systems. The oxygen-free copper market encompasses the production, distribution, and consumption of this specialized copper grade, serving various industries that demand high-quality materials for critical applications.
Key Stakeholders
-
Raw material suppliers
-
Oxygen-free copper manufacturers
-
Government & regulatory bodies
-
Research organizations
-
Associations and industry bodies
-
End-use industries
-
Traders and distributors
Research Objectives
-
To estimate and forecast the oxygen-free copper market, in terms of value and volume
-
To provide detailed information about the major factors (drivers, restraints, opportunities, and challenges) influencing the market growth
-
To define, describe, and forecast the market size, based on grade, product form, end-use industry, and region
-
To forecast the market size along with segments and submarkets, in key regions: North America, Europe, Asia Pacific (APAC), Middle East & Africa (MEA), and South America along with their key countries
-
To strategically analyze micro markets, with respect to individual growth trends, prospects, and their contribution to the total market
-
To analyze growth opportunities in the market for stakeholders and provide details on the competitive landscape for market leaders
-
To strategically profile key players and comprehensively analyze their market shares and core competencies
-
To analyze competitive developments, such as merger & acquisition, expansion & investment, and agreements in the oxygen free copper market
Available Customizations
With the given market data, MarketsandMarkets offers customizations according to client-specific needs.
The following customization options are available for the oxygen free copper report:
Product Analysis
-
Product matrix, which offers a detailed comparison of the product portfolio of companies
Regional Analysis
-
Further analysis of the oxygen free copper market for additional countries
Company Information
-
Detailed analysis and profiling of additional market players (up to five)


Growth opportunities and latent adjacency in Oxygen-Free Copper Market