Offsite Data Center Power Infrastructure Market

Offsite Data Center Power Infrastructure Market by Component (Solutions and Services), Vertical (BFSI, Media & Entertainment, Government & Defence, Healthcare, Manufacturing, IT & Telecom, Retail) and Region - Global Forecast to 2030

Report Code: EP 9108 Aug, 2024, by marketsandmarkets.com

[285 Pages Report] The global offsite data center power infrastructure market is estimated at USD 13.4 billion in 2024, with a projected growth to USD 35.4 billion by 2030, exhibiting a Compound Annual Growth Rate (CAGR) of 17.6%. The major drivers of the global offsite data center power infrastructure market are multifaceted, including increasing demand for data processing, storage and processing across industries Rapid proliferation of digital transformation initiatives and data generation from cloud computing, IoT , the rise of big data analytics etc. are key catalysts for market growth Invest in offsite data centers to ensure efficiency, scalability and improved security. The growing need for energy efficient and sustainable electricity solutions is another important factor. Governments and businesses are prioritizing green energy and energy-efficient technologies to reduce carbon footprints and operating costs, and to accommodate advanced power systems in data centers.

Furthermore, the offsite data center power infrastructure industry's landscape is changing because of the  advancements in technologies such as AI and ML. This has enabled more effective forecasting and operational maintenance. Sophisticated power systems are increasingly important as edge computing requiring reliable and decentralized data processing gains greater attention The market is driven by the expansion of 5G networks and the resulting departure high in data transport in terms of energy-efficient solutions to support demand applications and high-performance computing Since these features drive the market for tremendous growth in the coming years.

Offsite Data Center Power Infrastructure Market

To know about the assumptions considered for the study, Request for Free Sample Report

Offsite Data Center Power Infrastructure Market Opportunities

To know about the assumptions considered for the study, download the pdf brochure

Offsite Data Center Power Infrastructure Market Dynamics

Driver: Rising demand for data storage and processing

Increasing data storage and processing requirements are an important factor in the off-site data center power infrastructure market, driven by significant growth in data generation from various industries such as IT, telecom and media era with businesses and consumers turning to cloud services, big data analytics, IoT. There is an increase in demand for reliant applications, scalable and efficient data storage solutions. With the increase in the demand, there has been a significant rise in the investments in the offsite data center power infrastructure market.

Restraints: High initial capital expenditure

Initial capital costs are a notable limitation in the  data center electrical systems market, as setting up and maintaining data centers requires significant capital investments This includes land acquisition, construction, running electrical systems front, cooling technologies and high-capacity infrastructure. For new competitors catering to this market, high start-up costs can be deterrent, thereby limiting their ability to grow and compete. Economic constraints can also affect the overall return on investment, so decision makers need to take this into account.

Opportunities: Adoption of Renewable Energy Solutions

The adoption of renewable power answers creates widespread possibilities within the offsite facts middle strength infrastructure marketplace. As records facilities face pressure to lessen their carbon footprint and growth sustainability, integrating renewable electricity consisting of solar, wind, and hydropower is a bonus the method no longer handiest that these adjustments assist meet regulatory and corporate sustainability dreams however additionally lessen energy expenses and lengthy-term electricity intake -Reduce related danger of fee fluctuations Furthermore, the blessings of renewable energy can growth the marketplace capability of facts center offerings for environmentally aware clients, boosting growth and competitiveness variations have emerged in a hastily evolving enterprise environment.

Challenges: Regulatory and compliance challenges

One of the key challenges associated with the global on-premises data center power infrastructure market is the challenge of regulatory compliance. With an increasing emphasis on sustainable solutions and energy efficiency, data centers must comply with these stringent regulations, leading to higher operating costs and flows thus, this compliance varies from region to region. This increases the complexity associated with this market. Hence, players catering to this market must need to invest in advance technological solutions which adhere to such regulatory frameworks.

Offsite Data Center Power Infrastructure Market Ecosystem

The market for Offsite Data Center Power Infrastructure marked by the participation of leading companies that are firmly established, financially robust, and possess substantial expertise in the offsite data center power infrastructrue. These companies hold a significant market presence and provide a wide array of product offerings. They harness advanced technologies and maintain extensive global sales and marketing networks. Among the notable players in this market are ABB (Switzerland), Schneider Electric (France), Eaton (Ireland), Vertiv (US), Comfort Systems USA (UK), Johnson Controls (US), Yondr (Netherlands), Hubbell (US), Modubuild (Ireland), Altron A.S. (Czech Republic), InnovIT AG (Germany), MAVAB (Sweden).

Top Companies in Offsite Data Center Power Infrastructure Market

Solutions segment, by Component, to have the largest market share during forecast period.

The solutions segment holds the largest market share in the global offsite data center power infrastructure market, primarily due to its key role in the installation and maintenance of data center core infrastructure, including supply units (UPS), PDUs, cooling, and other critical services. They are key to ensure reliable and efficient data center operations. As organizations seek to increase their business flexibility and energy consumption efficiency has increased, investment in advanced energy solutions continues to expand, giving Solutions segment a dominant position in the market.

Asia Pacific segment, by Region, to be the third-largest market from 2024 to 2030.

The Asia Pacific place holds the third largest market share within the international offsite statistics middle energy infrastructure market due to rapid digital transformation, growing adoption of cloud offerings, and the expansion of information-intensive industries along with e-commerce, finance, and telecommunications. There is an increase in the investment pertaining to power infrastructure in countries such as China, India, and Japan. This is creating immense opportunities for the players in this market. Also, governments in countries are giving emphasis on digitalization and sustainable initiatives. All these factors are creating a favorable environment for the players catering to the offsite data center power infrastructure market.

Offsite Data Center Power Infrastructure Market  Size, and Share

Key Market Players

ABB (Switzerland), Schneider Electric (France), Eaton (Ireland),Vertiv (US), Huawei Digital Power Technologies Co., Ltd. (China), Comfort Systems USA (UK), Johnson Controls (US), Yondr (Netherlands), Hubbell (US), Modubuild (Ireland), Altron A.S. (Czech Republic), InnovIT AG (Germany), MAVAB (Sweden), and Delta Electronics, Inc. (Norway).

Get online access to the report on the World's First Market Intelligence Cloud

  • Easy to Download Historical Data & Forecast Numbers
  • Company Analysis Dashboard for high growth potential opportunities
  • Research Analyst Access for customization & queries
  • Competitor Analysis with Interactive dashboard
  • Latest News, Updates & Trend analysis
Request Sample

Scope of the Report

Report Metric

Details

Market Size available for years

2021–2030

Base year considered

2023

Forecast period

2024–2030

Forecast units

Value (USD Million/Billion)

Segments covered

By Vertical, By Offering

Geographies covered

Asia Pacific, North America, Europe, and Rest of World 

Companies covered

ABB (Switzerland), Schneider Electric (France), Eaton (Ireland), Vertiv (US), Eaton (Ireland), Huawei Digital Power Technologies Co., Ltd. (China), Comfort Systems USA (UK), Johnson Controls (US), Yondr (Netherlands), Hubbell (US), Modubuild (Ireland), Altron A.S. (Czech Republic), InnovIT AG (Germany), MAVAB (Sweden), Delta Electronics, Inc. (Norway), Rittal (Germany).

The offsite data center power infrastructure market is classified in this research report based on offering, vertical, and region.

Based on offering:
  • Services
  • Solutions
Based on vertical:
  • BFSI
  • IT & Telecom
  • Media & Entertainment
  • Healthcare
  • Government & Defense
  • Retail
  • Manufacturing
  • Others
Based on regions:
  • North America
  • Asia Pacific
  • Europe
  • Middle East & Africa
  • South America

Recent Developments

  • Comfort Systems USA, Inc. announced that it has entered into a definitive agreement to acquire Summit Industrial Construction, LLC (“Summit”) headquartered in Houston, Texas. The transaction was closed in the first quarter of 2024..
  • Johnson Controls acquires Tempered Networks to bring zero trust cybersecurity to connected buildings worldwide.
  • EdgeCore, Stack Infrastructure, and Yondr have launched a Data Center Safety Council in the US.

Frequently Asked Questions (FAQ):

To speak to our analyst for a discussion on the above findings, click Speak to Analyst

TABLE OF CONTENTS
 
1 INTRODUCTION (Page No. - 26)
    1.1 STUDY OBJECTIVES 
    1.2 MARKET DEFINITION 
    1.3 STUDY SCOPE 
           1.3.1 MARKETS COVERED AND REGIONAL SCOPE
           1.3.2 YEARS CONSIDERED
           1.3.3 INCLUSIONS AND EXCLUSIONS
    1.4 LIMITATIONS 
    1.5 CURRENCY CONSIDERED 
    1.6 STAKEHOLDERS 
 
2 RESEARCH METHODOLOGY (Page No. - 30)
    2.1 RESEARCH DATA 
           2.1.1 PRIMARY AND SECONDARY RESEARCH
    2.2 DATA TRIANGULATION 
           2.2.1 SECONDARY DATA
                    2.2.1.1 Key data from secondary sources
                    2.2.1.2 Key secondary sources
           2.2.2 PRIMARY DATA
                    2.2.2.1 Intended participants and key opinion leaders in primary interviews
                    2.2.2.2 Key data from primary sources
                    2.2.2.3 Key industry insights
                    2.2.2.4 Breakdown of primaries
    2.3 MARKET SCOPE 
    2.4 MARKET SIZE ESTIMATION 
           2.4.1 BOTTOM-UP APPROACH
           2.4.2 TOP-DOWN APPROACH
           2.4.3 DEMAND-SIDE ANALYSIS
                    2.4.3.1 Demand-side assumptions
                    2.4.3.2 Demand-side calculations
           2.4.4 SUPPLY-SIDE ANALYSIS
                    2.4.4.1 Supply-side assumptions
                    2.4.4.2 Supply-side calculations
           2.4.5 GROWTH FORECAST
    2.5 RESEARCH ASSUMPTIONS 
    2.6 RESEARCH LIMITATIONS 
    2.7 RISK ANALYSIS 
 
3 EXECUTIVE SUMMARY (Page No. - 43)
 
4 PREMIUM INSIGHTS (Page No. - 48)
    4.1 ATTRACTIVE OPPORTUNITIES FOR PLAYERS IN MARKET 
    4.2 MARKET, BY REGION 
    4.3 MARKET IN NORTH AMERICA, BY OFFERING AND VERTICAL 
    4.4 MARKET, BY OFFERING 
    4.5 MARKET, BY VERTICAL 
 
5 MARKET OVERVIEW (Page No. - 52)
    5.1 INTRODUCTION 
    5.2 MARKET DYNAMICS 
           5.2.1 DRIVERS
                    5.2.1.1 Rising demand to store expanding digital data
                    5.2.1.2 Increasing adoption of cloud computing services
                    5.2.1.3 Growing demand for data center colocation services
           5.2.2 RESTRAINTS
                    5.2.2.1 High cost of establishing data center infrastructure
                    5.2.2.2 Energy-intensive data storage infrastructure
                    5.2.2.3 Susceptibility to cyberattacks
           5.2.3 OPPORTUNITIES
                    5.2.3.1 Government-led initiatives to encourage adoption of environment-friendly technologies
                    5.2.3.2 Energy optimization with innovative technologies
                    5.2.3.3 Integration of smart grid and microgrid technologies into data center operations
                    5.2.3.4 Incorporating renewable energy sources in data center operations
                    5.2.3.5 Economic growth and urbanization in emerging markets
           5.2.4 CHALLENGES
                    5.2.4.1 Regulatory and compliance-related challenges
                    5.2.4.2 High carbon emissions
    5.3 TRENDS/DISRUPTIONS IMPACTING CUSTOMER BUSINESS 
    5.4 ECOSYSTEM ANALYSIS 
    5.5 INVESTMENT AND FUNDING SCENARIO 
    5.6 SUPPLY CHAIN ANALYSIS 
    5.7 IMPACT OF AI/GENERATIVE AI ON MARKET 
           5.7.1 RATIONALE FOR IMPACT LEVELS
    5.8 TECHNOLOGY ANALYSIS 
           5.8.1 KEY TECHNOLOGIES
                    5.8.1.1 AI and ML
           5.8.2 COMPLEMENTARY TECHNOLOGIES
                    5.8.2.1 Edge computing
    5.9 PRICING ANALYSIS 
           5.9.1 AVERAGE SELLING PRICE TREND OF KEY PLAYERS, BY OFFERING
           5.9.2 INDICATIVE PRICING TREND OF MODULAR DATA CENTER SOLUTIONS
    5.1 KEY CONFERENCES AND EVENTS, 2024–2025 
    5.11 TARIFF AND REGULATORY LANDSCAPE 
           5.11.1 TARIFFS ANALYSIS
           5.11.2 REGULATORY BODIES, GOVERNMENT AGENCIES, AND OTHER ORGANIZATIONS
           5.11.3 CODES AND REGULATIONS RELATED TO MARKET
           5.11.4 STANDARDS RELATED TO MARKET
    5.12 TRADE ANALYSIS 
           5.12.1 IMPORT DATA (HS CODE 8544)
           5.12.2 EXPORT DATA (HS CODE 8544)
    5.13 PATENT ANALYSIS 
    5.14 PORTER’S FIVE FORCES ANALYSIS 
           5.14.1 THREAT OF SUBSTITUTES
           5.14.2 BARGAINING POWER OF SUPPLIERS
           5.14.3 BARGAINING POWER OF BUYERS
           5.14.4 THREAT OF NEW ENTRANTS
           5.14.5 INTENSITY OF COMPETITIVE RIVALRY
    5.15 KEY STAKEHOLDERS AND BUYING CRITERIA 
           5.15.1 KEY STAKEHOLDERS IN BUYING PROCESS
           5.15.2 BUYING CRITERIA
    5.16 CASE STUDY ANALYSIS 
           5.16.1 AMDOCS COLLABORATED WITH EATON TO TRANSFORM DATA CENTER IN LONDON
           5.16.2 POWER & TEL COLLABORATED WITH VERTIV TO MEET DEMANDS OF EXPANDING CUSTOMER BASE
           5.16.3 DIGITAL REALTY HELPED IBM DEPLOY SECURED PRIVATE CLOUD SOLUTIONS DELIVERING LOW LATENCY AND HIGH THROUGHPUT TO CUSTOMERS
           5.16.4 SCHNEIDER ELECTRIC LEVERAGED SMART GRID TECHNOLOGIES TO ENABLE PROACTIVE MANAGEMENT OF ELECTRICAL NETWORKS
 
6 MARKET, BY OFFERING (Page No. - 109)
    6.1 INTRODUCTION 
    6.2 SOLUTIONS 
           6.2.1 INCREASING EMPHASIS ON BOOSTING ENERGY EFFICIENCY WITH REDUCED OPERATIONAL COSTS TO DRIVE MARKET
    6.3 SERVICES 
           6.3.1 DESIGN & CONSULTING
                    6.3.1.1 Rising demand for robust and efficient power infrastructure to foster segmental growth
           6.3.2 INSTALLATION & IMPLEMENTATION
                    6.3.2.1 Ability to reduce downtime and mitigate operational inefficiencies to boost demand
           6.3.3 SUPPORT & MAINTENANCE
                    6.3.3.1 Rising need to ensure optimum functioning of systems to drive market
 
7 MARKET, BY VERTICAL (Page No. - 117)
    7.1 INTRODUCTION 
    7.2 BFSI 
           7.2.1 GROWING SHIFT TOWARD ONLINE AND MOBILE BANKING TO OFFER LUCRATIVE GROWTH OPPORTUNITIES
    7.3 IT & TELECOM 
           7.3.1 EXPANSION OF 5G NETWORK TO FOSTER SEGMENTAL GROWTH
    7.4 MEDIA & ENTERTAINMENT 
           7.4.1 RISING POPULARITY OF DIGITAL CONTENT AND STREAMING SERVICES TO ACCELERATE DEMAND
    7.5 HEALTHCARE 
           7.5.1 INCREASING RELIANCE ON DIGITAL TECHNOLOGIES AND DATA-DRIVEN SOLUTIONS TO EXPEDITE SEGMENTAL GROWTH
    7.6 GOVERNMENT & DEFENSE 
           7.6.1 PRESSING NEED TO ENSURE NATIONAL SECURITY AND EFFICIENT PUBLIC ADMINISTRATION TO DRIVE MARKET
    7.7 RETAIL 
           7.7.1 SURGING DEPLOYMENT OF ADVANCED TECHNOLOGIES TO OPTIMIZE SUPPLY CHAIN OPERATIONS TO FUEL SEGMENTAL GROWTH
    7.8 MANUFACTURING 
           7.8.1 RISING FOCUS ON PREDICTIVE MAINTENANCE AND ADVANCED ANALYTICS TO SPUR DEMAND
    7.9 OTHERS 
 
8 MARKET, BY REGION (Page No. - 131)
    8.1 INTRODUCTION 
    8.2 NORTH AMERICA 
           8.2.1 US
                    8.2.1.1 Rising number of energy-efficient data centers to spike demand
           8.2.2 CANADA
                    8.2.2.1 Growing focus on boosting cybersecurity and technological advancements to fuel market growth
           8.2.3 MEXICO
                    8.2.3.1 Increasing foreign investments in technology sector to offer lucrative growth opportunities
    8.3 EUROPE 
           8.3.1 UK
                    8.3.1.1 Escalating deployment of AI, ML, and IoT in data center infrastructure to foster segmental growth
           8.3.2 GERMANY
                    8.3.2.1 Government-led initiatives to boost digital transformation to drive market
           8.3.3 FRANCE
                    8.3.3.1 Increasing electricity generation using renewable resources to drive market
           8.3.4 ITALY
                    8.3.4.1 Growing focus on boosting digital infrastructure and promoting technological developments to foster segmental growth
           8.3.5 RUSSIA
                    8.3.5.1 Abundance of natural resources to offer lucrative growth opportunities
           8.3.6 REST OF EUROPE
    8.4 ASIA PACIFIC 
           8.4.1 CHINA
                    8.4.1.1 Growing adoption of cloud-based solutions due to exponential increase in data volumes to drive demand
           8.4.2 INDIA
                    8.4.2.1 Government-led initiatives to boost digital infrastructure to accelerate demand
           8.4.3 JAPAN
                    8.4.3.1 Increasing FDI from tech giants to foster market growth
           8.4.4 AUSTRALIA
                    8.4.4.1 Rising integration of renewable energy into data centers to offer lucrative growth opportunities
           8.4.5 REST OF ASIA PACIFIC
    8.5 MIDDLE EAST & AFRICA 
           8.5.1 GCC
                    8.5.1.1 Saudi Arabia
                               8.5.1.1.1 Rising focus on improving energy infrastructure to boost demand
                    8.5.1.2 UAE
                               8.5.1.2.1 Growing demand for digital services to fuel market growth
                    8.5.1.3 Rest of GCC
           8.5.2 SOUTH AFRICA
                    8.5.2.1 Government-led initiatives to boost data center infrastructure development to drive market
           8.5.3 REST OF MIDDLE EAST & AFRICA
    8.6 SOUTH AMERICA 
           8.6.1 BRAZIL
                    8.6.1.1 Increasing emphasis on promoting digital economy to fuel market growth
           8.6.2 ARGENTINA
                    8.6.2.1 Rising emphasis on technology exports to drive market
           8.6.3 REST OF SOUTH AMERICA
 
9 COMPETITIVE LANDSCAPE (Page No. - 192)
    9.1 OVERVIEW 
    9.2 KEY PLAYER STRATEGIES/RIGHT TO WIN, 2020–2024 
    9.3 MARKET SHARE ANALYSIS, 2023 
    9.4 MARKET RANKING, 2023 
    9.5 REVENUE ANALYSIS, 2019–2023 
    9.6 COMPANY EVALUATION MATRIX: KEY PLAYERS, 2023 
           9.6.1 STARS
           9.6.2 EMERGING LEADERS
           9.6.3 PERVASIVE PLAYERS
           9.6.4 PARTICIPANTS
           9.6.5 COMPANY FOOTPRINT: KEY PLAYERS, 2023
                    9.6.5.1 Company footprint
                    9.6.5.2 Offering footprint
                    9.6.5.3 Vertical footprint
                    9.6.5.4 Region footprint
    9.7 COMPANY EVALUATION MATRIX: STARTUPS/SMES, 2023 
           9.7.1 PROGRESSIVE COMPANIES
           9.7.2 RESPONSIVE COMPANIES
           9.7.3 DYNAMIC COMPANIES
           9.7.4 STARTING BLOCKS
           9.7.5 COMPETITIVE BENCHMARKING: STARTUPS/SMES, 2023
                    9.7.5.1 Detailed list of key startups/SMEs
                    9.7.5.2 Competitive benchmarking of key startups/SMEs
    9.8 COMPANY VALUATION AND FINANCIAL METRICS 
    9.9 BRAND/PRODUCT COMPARISON 
    9.1 COMPETITIVE SCENARIO 
           9.10.1 PRODUCT LAUNCHES
           9.10.2 DEALS
           9.10.3 EXPANSIONS
 
10 COMPANY PROFILES (Page No. - 218)
     10.1 KEY PLAYERS 
             10.1.1 ABB
                       10.1.1.1 Business overview
                       10.1.1.2 Products/Services/Solutions offered
                       10.1.1.3 Recent developments
                                   10.1.1.3.1 Product launches
                                   10.1.1.3.2 Deals
                       10.1.1.4 MnM view
                                   10.1.1.4.1 Key strengths/Right to win
                                   10.1.1.4.2 Strategic choices
                                   10.1.1.4.3 Weaknesses/Competitive threats
             10.1.2 SCHNEIDER ELECTRIC
                       10.1.2.1 Business overview
                       10.1.2.2 Products/Services/Solutions offered
                       10.1.2.3 Recent developments
                                   10.1.2.3.1 Product launches
                                   10.1.2.3.2 Deals
                       10.1.2.4 MnM view
                                   10.1.2.4.1 Key strengths/Right to win
                                   10.1.2.4.2 Strategic choices
                                   10.1.2.4.3 Weaknesses/Competitive strengths
             10.1.3 VERTIV GROUP CORP.
                       10.1.3.1 Business overview
                       10.1.3.2 Products/Services/Solutions offered
                       10.1.3.3 Recent developments
                                   10.1.3.3.1 Product launches
                                   10.1.3.3.2 Deals
                       10.1.3.4 MnM view
                                   10.1.3.4.1 Key strengths/Right to win
                                   10.1.3.4.2 Strategic choices
                                   10.1.3.4.3 Weaknesses/Competitive strengths
             10.1.4 EATON
                       10.1.4.1 Business overview
                       10.1.4.2 Products/Services/Solutions offered
                       10.1.4.3 Recent developments
                                   10.1.4.3.1 Product launches
                                   10.1.4.3.2 Deals
                                   10.1.4.3.3 Expansions
                       10.1.4.4 MnM view
              
                     10.1.4.4.1 Key strengths/Right to win
                                   10.1.4.4.2 Strategic choices
                                   10.1.4.4.3 Weaknesses/Competitive strengths
             10.1.5 HUAWEI DIGITAL POWER TECHNOLOGIES CO., LTD.
                       10.1.5.1 Business overview
                       10.1.5.2 Products/Services/Solutions offered
                       10.1.5.3 Recent developments
                                   10.1.5.3.1 Product launches
                                   10.1.5.3.2 Deals
                       10.1.5.4 MnM view
                                   10.1.5.4.1 Key strengths/Right to win
                                   10.1.5.4.2 Strategic choices
                                   10.1.5.4.3 Weaknesses/Competitive strengths
             10.1.6 COMFORT SYSTEMS USA
                       10.1.6.1 Business overview
                       10.1.6.2 Products/Services/Solutions offered
                       10.1.6.3 Recent developments
                                   10.1.6.3.1 Deals
             10.1.7 JOHNSON CONTROLS INC.
                       10.1.7.1 Business overview
                       10.1.7.2 Products/Services/Solutions offered
                       10.1.7.3 Recent developments
                                   10.1.7.3.1 Product launches
                                   10.1.7.3.2 Deals
             10.1.8 YONDR
                       10.1.8.1 Business overview
                       10.1.8.2 Products/Services/Solutions offered
                       10.1.8.3 Recent developments
                                   10.1.8.3.1 Deals
                                   10.1.8.3.2 Expansions
             10.1.9 HUBBELL
                       10.1.9.1 Business overview
                       10.1.9.2 Products/Services/Solutions offered
                       10.1.9.3 Recent developments
                                   10.1.9.3.1 Deals
               10.1.10 MODUBUILD
            10.1.10.1 Business overview
            10.1.10.2 Products/Services/Solutions offered
               10.1.11 ALTRON A.S.
            10.1.11.1 Business overview
            10.1.11.2 Products/Services/Solutions offered
            10.1.11.3 Recent developments
                     10.1.11.3.1 Product launches
               10.1.12 INNOVIT AG
            10.1.12.1 Business overview
            10.1.12.2 Products/Services/Solutions offered
               10.1.13 MAVAB
            10.1.13.1 Business overview
            10.1.13.2 Products/Services/Solutions offered
               10.1.14 RITTAL GMBH & CO. KG
            10.1.14.1 Business overview
            10.1.14.2 Products/Services/Solutions offered
            10.1.14.3 Recent developments
                     10.1.14.3.1 Product launches
                     10.1.14.3.2 Deals
               10.1.15 INVT POWER SYSTEM(SHENZHEN) CO., LTD.
            10.1.15.1 Business overview
            10.1.15.2 Products/Services/Solutions offered
               10.1.16 DELTA ELECTRONICS, INC.
            10.1.16.1 Business overview
            10.1.16.2 Products/Services/Solutions offered
               10.1.17 DATA SPECIALTIES, INC.
            10.1.17.1 Business overview
            10.1.17.2 Products/Services/Solutions offered
               10.1.18 PRASA INFOCOM AND POWER SOLUTIONS PVT. LTD.
            10.1.18.1 Business overview
            10.1.18.2 Products/Services/Solutions offered
               10.1.19 BLADEROOM GROUP LIMITED
            10.1.19.1 Business overview
            10.1.19.2 Products/Services/Solutions offered
               10.1.20 CUPERTINO ELECTRIC, INC.
            10.1.20.1 Business overview
            10.1.20.2 Products/Services/Solutions offered
     10.2 OTHER PLAYERS 
             10.2.1 DATAXENTER
             10.2.2 ICT FACILITIES GMBH
             10.2.3 MASCO GROUP
             10.2.4 INTEGRA MISSION CRITICAL, LLC.
             10.2.5 BOX MODUL
 
11 APPENDIX (Page No. - 278)
     11.1 INSIGHTS FROM INDUSTRY EXPERTS 
     11.2 DISCUSSION GUIDE 
     11.3 KNOWLEDGESTORE: MARKETSANDMARKETS’ SUBSCRIPTION PORTAL 
     11.4 CUSTOMIZATION OPTIONS 
     11.5 RELATED REPORTS 
     11.6 AUTHOR DETAILS 
 
 
LIST OF TABLES (256 Tables) 
 
TABLE 1 INCLUSIONS AND EXCLUSIONS: BY OFFERING
TABLE 2 INCLUSIONS AND EXCLUSIONS: BY VERTICAL
TABLE 3 MARKET SNAPSHOT
TABLE 4 GLOBAL TRENDS IN DIGITAL AND ENERGY INDICATORS, 2015–2022
TABLE 5 ROLES OF COMPANIES IN OFFSITE DATA CENTER POWER INFRASTRUCTURE ECOSYSTEM
TABLE 6 INDICATIVE PRICING ANALYSIS OF MODULAR DATA CENTER SOLUTIONS OFFERED BY KEY PLAYERS
TABLE 7 INDICATIVE PRICING ANALYSIS OF MODULAR DATA CENTER SOLUTIONS
TABLE 8 MARKET: LIST OF CONFERENCES AND EVENTS, 2024–2025
TABLE 9 TARIFF DATA FOR HS 8544-COMPLIANT PRODUCTS
TABLE 10 NORTH AMERICA: REGULATORY BODIES, GOVERNMENT AGENCIES, AND OTHER ORGANIZATIONS
TABLE 11 EUROPE: REGULATORY BODIES, GOVERNMENT AGENCIES, AND OTHER ORGANIZATIONS
TABLE 12 ASIA PACIFIC: REGULATORY BODIES, GOVERNMENT AGENCIES, AND OTHER ORGANIZATIONS
TABLE 13 MIDDLE EAST & AFRICA: REGULATORY BODIES, GOVERNMENT AGENCIES, AND OTHER ORGANIZATIONS
TABLE 14 SOUTH AMERICA: REGULATORY BODIES, GOVERNMENT AGENCIES, AND OTHER ORGANIZATIONS
TABLE 15 CODES AND REGULATIONS RELATED TO OFFSITE DATA CENTER POWER INFRASTRUCTURE
TABLE 16 STANDARDS RELATED TO OFFSITE DATA CENTER POWER INFRASTRUCTURE
TABLE 17 LIST OF APPLIED/GRANTED PATENTS RELATED TO OFFSITE DATA CENTER POWER INFRASTRUCTURE, 2018–2023
TABLE 18 MARKET: PORTER’S FIVE FORCES ANALYSIS
TABLE 19 INFLUENCE OF KEY STAKEHOLDERS ON BUYING PROCESS, BY VERTICAL (%)
TABLE 20 KEY BUYING CRITERIA FOR TOP FOUR VERTICALS
TABLE 21 MARKET, BY OFFERING, 2021–2023 (USD MILLION)
TABLE 22 MARKET, BY OFFERING, 2024–2030 (USD MILLION)
TABLE 23 MARKET, BY SERVICE, 2021–2023 (USD MILLION)
TABLE 24 MARKET, BY SERVICE, 2024–2030 (USD MILLION)
TABLE 25 SOLUTIONS: MARKET, BY REGION 2021–2023 (USD MILLION)
TABLE 26 SOLUTIONS: MARKET, BY REGION, 2024–2030 (USD MILLION)
TABLE 27 SERVICES: MARKET, BY REGION, 2021–2023 (USD MILLION)
TABLE 28 SERVICES: MARKET, BY REGION, 2024–2030 (USD MILLION)
TABLE 29 DESIGN & CONSULTING: MARKET, BY REGION, 2021–2023 (USD MILLION)
TABLE 30 DESIGN & CONSULTING: MARKET, BY REGION, 2024–2030 (USD MILLION)
TABLE 31 INSTALLATION & IMPLEMENTATION: MARKET, BY REGION, 2021–2023 (USD MILLION)
TABLE 32 INSTALLATION & IMPLEMENTATION: MARKET, BY REGION, 2024–2030 (USD MILLION)
TABLE 33 SUPPORT & MAINTENANCE: MARKET, BY REGION, 2021–2023 (USD MILLION)
TABLE 34 SUPPORT & MAINTENANCE: MARKET, BY REGION, 2024–2030 (USD MILLION)
TABLE 35 MARKET, BY VERTICAL, 2021–2023 (USD MILLION)
TABLE 36 MARKET, BY VERTICAL, 2024–2030 (USD MILLION)
TABLE 37 BFSI: MARKET, BY REGION, 2021–2023 (USD MILLION)
TABLE 38 BFSI: MARKET, BY REGION, 2024–2030 (USD MILLION)
TABLE 39 IT & TELECOM: MARKET, BY REGION, 2021–2023 (USD MILLION)
TABLE 40 IT & TELECOM: MARKET, BY REGION, 2024–2030 (USD MILLION)
TABLE 41 MEDIA & ENTERTAINMENT: MARKET, BY REGION, 2021–2023 (USD MILLION)
TABLE 42 MEDIA & ENTERTAINMENT: MARKET, BY REGION, 2024–2030 (USD MILLION)
TABLE 43 HEALTHCARE: MARKET, BY REGION, 2021–2023 (USD MILLION)
TABLE 44 HEALTHCARE: MARKET, BY REGION, 2024–2030 (USD MILLION)
TABLE 45 GOVERNMENT & DEFENSE: MARKET, BY REGION, 2021–2023 (USD MILLION)
TABLE 46 GOVERNMENT & DEFENSE: MARKET, BY REGION, 2024–2030 (USD MILLION)
TABLE 47 RETAIL: MARKET, BY REGION, 2021–2023 (USD MILLION)
TABLE 48 RETAIL: MARKET, BY REGION, 2024–2030 (USD MILLION)
TABLE 49 MANUFACTURING: MARKET, BY REGION, 2021–2023 (USD MILLION)
TABLE 50 MANUFACTURING: MARKET, BY REGION, 2024–2030 (USD MILLION)
TABLE 51 OTHERS: MARKET, BY REGION, 2021–2023 (USD MILLION)
TABLE 52 OTHERS: MARKET, BY REGION, 2024–2030 (USD MILLION)
TABLE 53 MARKET, BY REGION, 2021–2023 (USD MILLION)
TABLE 54 MARKET, BY REGION, 2024–2030 (USD MILLION)
TABLE 55 NORTH AMERICA: MARKET, BY OFFERING, 2021–2023 (USD MILLION)
TABLE 56 NORTH AMERICA: MARKET, BY OFFERING, 2024–2030 (USD MILLION)
TABLE 57 NORTH AMERICA: MARKET, BY SERVICE, 2021–2023 (USD MILLION)
TABLE 58 NORTH AMERICA: MARKET, BY SERVICE, 2024–2030 (USD MILLION)
TABLE 59 NORTH AMERICA: MARKET, BY VERTICAL, 2021–2023 (USD MILLION)
TABLE 60 NORTH AMERICA: MARKET, BY VERTICAL, 2024–2030 (USD MILLION)
TABLE 61 NORTH AMERICA: MARKET, BY COUNTRY, 2021–2023 (USD MILLION)
TABLE 62 NORTH AMERICA: MARKET, BY COUNTRY, 2024–2030 (USD MILLION)
TABLE 63 US: MARKET, BY OFFERING, 2021–2023 (USD MILLION)
TABLE 64 US: MARKET, BY OFFERING, 2024–2030 (USD MILLION)
TABLE 65 US: MARKET, BY SERVICE, 2021–2023 (USD MILLION)
TABLE 66 US: MARKET, BY SERVICE, 2024–2030 (USD MILLION)
TABLE 67 CANADA: MARKET, BY OFFERING, 2021–2023 (USD MILLION)
TABLE 68 CANADA: MARKET, BY OFFERING, 2024–2030 (USD MILLION)
TABLE 69 CANADA: MARKET, BY SERVICE, 2021–2023 (USD MILLION)
TABLE 70 CANADA: MARKET, BY SERVICE, 2024–2030 (USD MILLION)
TABLE 71 MEXICO: MARKET, BY OFFERING, 2021–2023 (USD MILLION)
TABLE 72 MEXICO: MARKET, BY OFFERING, 2024–2030 (USD MILLION)
TABLE 73 MEXICO: MARKET, BY SERVICE, 2021–2023 (USD MILLION)
TABLE 74 MEXICO: MARKET, BY SERVICE, 2024–2030 (USD MILLION)
TABLE 75 EUROPE: MARKET, BY OFFERING, 2021–2023 (USD MILLION)
TABLE 76 EUROPE: MARKET, BY OFFERING, 2024–2030 (USD MILLION)
TABLE 77 EUROPE: MARKET, BY SERVICE, 2021–2023 (USD MILLION)
TABLE 78 EUROPE: MARKET, BY SERVICE, 2024–2030 (USD MILLION)
TABLE 79 EUROPE: MARKET, BY VERTICAL, 2021–2023 (USD MILLION)
TABLE 80 EUROPE: MARKET, BY VERTICAL, 2024–2030 (USD MILLION)
TABLE 81 EUROPE: MARKET, BY COUNTRY, 2021–2023 (USD MILLION)
TABLE 82 EUROPE: MARKET, BY COUNTRY, 2024–2030 (USD MILLION)
TABLE 83 UK: MARKET, BY OFFERING, 2021–2023 (USD MILLION)
TABLE 84 UK: MARKET, BY OFFERING, 2024–2030 (USD MILLION)
TABLE 85 UK: MARKET, BY SERVICE, 2021–2023 (USD MILLION)
TABLE 86 UK: MARKET, BY SERVICE, 2024–2030 (USD MILLION)
TABLE 87 GERMANY: MARKET, BY OFFERING, 2021–2023 (USD MILLION)
TABLE 88 GERMANY: MARKET, BY OFFERING, 2024–2030 (USD MILLION)
TABLE 89 GERMANY: MARKET, BY SERVICE, 2021–2023 (USD MILLION)
TABLE 90 GERMANY: MARKET, BY SERVICE, 2024–2030 (USD MILLION)
TABLE 91 FRANCE: MARKET, BY OFFERING, 2021–2023 (USD MILLION)
TABLE 92 FRANCE: MARKET, BY OFFERING, 2024–2030 (USD MILLION)
TABLE 93 FRANCE: MARKET, BY SERVICE, 2021–2023 (USD MILLION)
TABLE 94 FRANCE: MARKET, BY SERVICE, 2024–2030 (USD MILLION)
TABLE 95 ITALY: MARKET, BY OFFERING, 2021–2023 (USD MILLION)
TABLE 96 ITALY: MARKET, BY OFFERING, 2024–2030 (USD MILLION)
TABLE 97 ITALY: MARKET, BY SERVICE, 2021–2023 (USD MILLION)
TABLE 98 ITALY: MARKET, BY SERVICE, 2024–2030 (USD MILLION)
TABLE 99 RUSSIA: MARKET, BY OFFERING, 2021–2023 (USD MILLION)
TABLE 100 RUSSIA: MARKET, BY OFFERING, 2024–2030 (USD MILLION)
TABLE 101 RUSSIA: MARKET, BY SERVICE, 2021–2023 (USD MILLION)
TABLE 102 RUSSIA: MARKET, BY SERVICE, 2024–2030 (USD MILLION)
TABLE 103 REST OF EUROPE: MARKET, BY OFFERING, 2021–2023 (USD MILLION)
TABLE 104 REST OF EUROPE: MARKET, BY OFFERING, 2024–2030 (USD MILLION)
TABLE 105 REST OF EUROPE: MARKET, BY SERVICE, 2021–2023 (USD MILLION)
TABLE 106 REST OF EUROPE: MARKET, BY SERVICE, 2024–2030 (USD MILLION)
TABLE 107 ASIA PACIFIC: MARKET, BY OFFERING, 2021–2023 (USD MILLION)
TABLE 108 ASIA PACIFIC: MARKET, BY OFFERING, 2024–2030 (USD MILLION)
TABLE 109 ASIA PACIFIC: MARKET, BY SERVICE, 2021–2023 (USD MILLION)
TABLE 110 ASIA PACIFIC: MARKET, BY SERVICE, 2024–2030 (USD MILLION)
TABLE 111 ASIA PACIFIC: MARKET, BY VERTICAL, 2021–2023 (USD MILLION)
TABLE 112 ASIA PACIFIC: MARKET, BY VERTICAL, 2024–2030 (USD MILLION)
TABLE 113 ASIA PACIFIC: MARKET, BY COUNTRY, 2021–2023 (USD MILLION)
TABLE 114 ASIA PACIFIC: MARKET, BY COUNTRY, 2024–2030 (USD MILLION)
TABLE 115 CHINA: MARKET, BY OFFERING, 2021–2023 (USD MILLION)
TABLE 116 CHINA: MARKET, BY OFFERING, 2024–2030 (USD MILLION)
TABLE 117 CHINA: MARKET, BY SERVICE, 2021–2023 (USD MILLION)
TABLE 118 CHINA: MARKET, BY SERVICE, 2024–2030 (USD MILLION)
TABLE 119 INDIA: MARKET, BY OFFERING, 2021–2023 (USD MILLION)
TABLE 120 INDIA: MARKET, BY OFFERING, 2024–2030 (USD MILLION)
TABLE 121 INDIA: MARKET, BY SERVICE, 2021–2023 (USD MILLION)
TABLE 122 INDIA: MARKET, BY SERVICE, 2024–2030 (USD MILLION)
TABLE 123 JAPAN: MARKET, BY OFFERING, 2021–2023 (USD MILLION)
TABLE 124 JAPAN: MARKET, BY OFFERING, 2024–2030 (USD MILLION)
TABLE 125 JAPAN: MARKET, BY SERVICE, 2021–2023 (USD MILLION)
TABLE 126 JAPAN: MARKET, BY SERVICE, 2024–2030 (USD MILLION)
TABLE 127 AUSTRALIA: MARKET, BY OFFERING, 2021–2023 (USD MILLION)
TABLE 128 AUSTRALIA: MARKET, BY OFFERING, 2024–2030 (USD MILLION)
TABLE 129 AUSTRALIA: MARKET, BY SERVICE, 2021–2023 (USD MILLION)
TABLE 130 AUSTRALIA: MARKET, BY SERVICE, 2024–2030 (USD MILLION)
TABLE 131 REST OF ASIA PACIFIC: MARKET, BY OFFERING, 2021–2023 (USD MILLION)
TABLE 132 REST OF ASIA PACIFIC: MARKET, BY OFFERING, 2024–2030 (USD MILLION)
TABLE 133 REST OF ASIA PACIFIC: MARKET, BY SERVICE, 2021–2023 (USD MILLION)
TABLE 134 REST OF ASIA PACIFIC: MARKET, BY SERVICE, 2024–2030 (USD MILLION)
TABLE 135 MIDDLE EAST & AFRICA: MARKET, BY OFFERING, 2021–2023 (USD MILLION)
TABLE 136 MIDDLE EAST & AFRICA: MARKET, BY OFFERING, 2024–2030 (USD MILLION)
TABLE 137 MIDDLE EAST & AFRICA: MARKET, BY SERVICE, 2021–2023 (USD MILLION)
TABLE 138 MIDDLE EAST & AFRICA: MARKET, BY SERVICE, 2024–2030 (USD MILLION)
TABLE 139 MIDDLE EAST & AFRICA: MARKET, BY VERTICAL, 2021–2023 (USD MILLION)
TABLE 140 MIDDLE EAST & AFRICA: MARKET, BY VERTICAL, 2024–2030 (USD MILLION)
TABLE 141 MIDDLE EAST & AFRICA: MARKET, BY COUNTRY, 2021–2023 (USD MILLION)
TABLE 142 MIDDLE EAST & AFRICA: MARKET, BY COUNTRY, 2024–2030 (USD MILLION)
TABLE 143 GCC: MARKET, BY OFFERING, 2021–2023 (USD MILLION)
TABLE 144 GCC: MARKET, BY OFFERING, 2024–2030 (USD MILLION)
TABLE 145 GCC: MARKET, BY SERVICE, 2021–2023 (USD MILLION)
TABLE 146 GCC: MARKET, BY SERVICE, 2024–2030 (USD MILLION)
TABLE 147 SAUDI ARABIA: MARKET, BY OFFERING, 2021–2023 (USD MILLION)
TABLE 148 SAUDI ARABIA: MARKET, BY OFFERING, 2024–2030 (USD MILLION)
TABLE 149 SAUDI ARABIA: MARKET, BY SERVICE, 2021–2023 (USD MILLION)
TABLE 150 SAUDI ARABIA: MARKET, BY SERVICE, 2024–2030 (USD MILLION)
TABLE 151 UAE: MARKET, BY OFFERING, 2021–2023 (USD MILLION)
TABLE 152 UAE: MARKET, BY OFFERING, 2024–2030 (USD MILLION)
TABLE 153 UAE: MARKET, BY SERVICE, 2021–2023 (USD MILLION)
TABLE 154 UAE: MARKET, BY SERVICE, 2024–2030 (USD MILLION)
TABLE 155 REST OF GCC: MARKET, BY OFFERING, 2021–2023 (USD MILLION)
TABLE 156 REST OF GCC: MARKET, BY OFFERING, 2024–2030 (USD MILLION)
TABLE 157 REST OF GCC: MARKET, BY SERVICE, 2021–2023 (USD MILLION)
TABLE 158 REST OF GCC: MARKET, BY SERVICE, 2024–2030 (USD MILLION)
TABLE 159 SOUTH AFRICA: MARKET, BY OFFERING, 2021–2023 (USD MILLION)
TABLE 160 SOUTH AFRICA: MARKET, BY OFFERING, 2024–2030 (USD MILLION)
TABLE 161 SOUTH AFRICA: MARKET, BY SERVICE, 2021–2023 (USD MILLION)
TABLE 162 SOUTH AFRICA: MARKET, BY SERVICE, 2024–2030 (USD MILLION)
TABLE 163 REST OF MIDDLE EAST & AFRICA: MARKET, BY OFFERING, 2021–2023 (USD MILLION)
TABLE 164 REST OF MIDDLE EAST & AFRICA: MARKET, BY OFFERING, 2024–2030 (USD MILLION)
TABLE 165 REST OF MIDDLE EAST & AFRICA: MARKET, BY SERVICE, 2021–2023 (USD MILLION)
TABLE 166 REST OF MIDDLE EAST & AFRICA: MARKET, BY SERVICE, 2024–2030 (USD MILLION)
TABLE 167 SOUTH AMERICA: MARKET, BY OFFERING, 2021–2023 (USD MILLION)
TABLE 168 SOUTH AMERICA: MARKET, BY OFFERING, 2024–2030 (USD MILLION)
TABLE 169 SOUTH AMERICA: MARKET, BY SERVICE, 2021–2023 (USD MILLION)
TABLE 170 SOUTH AMERICA: MARKET, BY SERVICE, 2024–2030 (USD MILLION)
TABLE 171 SOUTH AMERICA: MARKET, BY VERTICAL, 2021–2023 (USD MILLION)
TABLE 172 SOUTH AMERICA: MARKET, BY VERTICAL, 2024–2030 (USD MILLION)
TABLE 173 SOUTH AMERICA: MARKET, BY COUNTRY, 2021–2023 (USD MILLION)
TABLE 174 SOUTH AMERICA: MARKET, BY COUNTRY, 2024–2030 (USD MILLION)
TABLE 175 BRAZIL: MARKET, BY OFFERING, 2021–2023 (USD MILLION)
TABLE 176 BRAZIL: MARKET, BY OFFERING, 2024–2030 (USD MILLION)
TABLE 177 BRAZIL: MARKET, BY SERVICE, 2021–2023 (USD MILLION)
TABLE 178 BRAZIL: MARKET, BY SERVICE, 2024–2030 (USD MILLION)
TABLE 179 ARGENTINA: MARKET, BY OFFERING, 2021–2023 (USD MILLION)
TABLE 180 ARGENTINA: MARKET, BY OFFERING, 2024–2030 (USD MILLION)
TABLE 181 ARGENTINA: MARKET, BY SERVICE, 2021–2023 (USD MILLION)
TABLE 182 ARGENTINA: MARKET, BY SERVICE, 2024–2030 (USD MILLION)
TABLE 183 REST OF SOUTH AMERICA: MARKET, BY OFFERING, 2021–2023 (USD MILLION)
TABLE 184 REST OF SOUTH AMERICA: MARKET, BY OFFERING, 2024–2030 (USD MILLION)
TABLE 185 REST OF SOUTH AMERICA: MARKET, BY SERVICE, 2021–2023 (USD MILLION)
TABLE 186 REST OF SOUTH AMERICA: MARKET, BY SERVICE, 2024–2030 (USD MILLION)
TABLE 187 KEY PLAYER STRATEGIES/RIGHT TO WIN, 2020–2024
TABLE 188 MARKET: DEGREE OF COMPETITION, 2023
TABLE 189 MARKET: OFFERING FOOTPRINT, 2023
TABLE 190 MARKET: VERTICAL FOOTPRINT, 2023
TABLE 191 MARKET: REGION FOOTPRINT, 2023
TABLE 192 MARKET: LIST OF KEY STARTUPS/SMES, 2023
TABLE 193 MARKET: COMPETITIVE BENCHMARKING OF KEY STARTUPS/SMES
TABLE 194 MARKET: PRODUCT LAUNCHES, APRIL 2020–JUNE 2024
TABLE 195 MARKET: DEALS, APRIL 2020–JUNE 2024
TABLE 196 MARKET: EXPANSIONS, APRIL 2020–JUNE 2024
TABLE 197 ABB: COMPANY OVERVIEW
TABLE 198 ABB: PRODUCTS/SERVICES/SOLUTIONS OFFERED
TABLE 199 ABB: PRODUCT LAUNCHES
TABLE 200 ABB: DEALS
TABLE 201 SCHNEIDER ELECTRIC: COMPANY OVERVIEW
TABLE 202 SCHNEIDER ELECTRIC: PRODUCTS/SERVICES/SOLUTIONS OFFERED
TABLE 203 SCHNEIDER ELECTRIC: PRODUCT LAUNCHES
TABLE 204 SCHNEIDER ELECTRIC: DEALS
TABLE 205 VERTIV GROUP CORP.: COMPANY OVERVIEW
TABLE 206 VERTIV GROUP CORP.: PRODUCTS/SERVICES/SOLUTIONS OFFERED
TABLE 207 VERTIV GROUP CORP.: PRODUCT LAUNCHES
TABLE 208 VERTIV GROUP CORP.: DEALS
TABLE 209 EATON: COMPANY OVERVIEW
TABLE 210 EATON: PRODUCTS/SERVICES/SOLUTIONS OFFERED
TABLE 211 EATON: PRODUCT LAUNCHES
TABLE 212 EATON: DEALS
TABLE 213 EATON: EXPANSIONS
TABLE 214 HUAWEI DIGITAL POWER TECHNOLOGIES CO., LTD.: COMPANY OVERVIEW
TABLE 215 HUAWEI DIGITAL POWER TECHNOLOGIES CO., LTD.: PRODUCTS/SERVICES/SOLUTIONS OFFERED
TABLE 216 HUAWEI DIGITAL POWER TECHNOLOGIES CO., LTD.: PRODUCT LAUNCHES
TABLE 217 HUAWEI DIGITAL POWER TECHNOLOGIES CO., LTD.: DEALS
TABLE 218 COMFORT SYSTEMS USA: COMPANY OVERVIEW
TABLE 219 COMFORT SYSTEMS USA: PRODUCTS/SERVICES/SOLUTIONS OFFERED
TABLE 220 COMFORT SYSTEMS USA: DEALS
TABLE 221 JOHNSON CONTROLS INC.: COMPANY OVERVIEW
TABLE 222 JOHNSON CONTROLS INC.: PRODUCTS/SERVICES/SOLUTIONS OFFERED
TABLE 223 JOHNSON CONTROLS INC.: PRODUCT LAUNCHES
TABLE 224 JOHNSON CONTROLS INC.: DEALS
TABLE 225 YONDR: COMPANY OVERVIEW
TABLE 226 YONDR: PRODUCTS/SERVICES/SOLUTIONS OFFERED
TABLE 227 YONDR: DEALS
TABLE 228 YONDR: EXPANSIONS
TABLE 229 HUBBELL: COMPANY OVERVIEW
TABLE 230 HUBBELL: PRODUCTS/SERVICES/SOLUTIONS OFFERED
TABLE 231 HUBBELL: DEALS
TABLE 232 MODUBUILD: COMPANY OVERVIEW
TABLE 233 MODUBUILD: PRODUCTS/SERVICES/SOLUTIONS OFFERED
TABLE 234 ALTRON A.S.: COMPANY OVERVIEW
TABLE 235 ALTRON A.S.: PRODUCTS/SERVICES/SOLUTIONS OFFERED
TABLE 236 ALTRON A.S.: PRODUCT LAUNCHES
TABLE 237 INNOVIT AG: COMPANY OVERVIEW
TABLE 238 INNOVIT AG: PRODUCTS/SERVICES/SOLUTIONS OFFERED
TABLE 239 MAVAB: COMPANY OVERVIEW
TABLE 240 MAVAB: PRODUCTS/SERVICES/SOLUTIONS OFFERED
TABLE 241 RITTAL GMBH & CO. KG: COMPANY OVERVIEW
TABLE 242 RITTAL GMBH & CO. KG: PRODUCTS/SERVICES/SOLUTIONS OFFERED
TABLE 243 RITTAL GMBH & CO. KG: PRODUCT LAUNCHES
TABLE 244 RITTAL GMBH & CO. KG: DEALS
TABLE 245 INVT POWER SYSTEM(SHENZHEN) CO., LTD.: COMPANY OVERVIEW
TABLE 246 INVT POWER SYSTEM(SHENZHEN) CO., LTD.: PRODUCTS/SERVICES/SOLUTIONS OFFERED
TABLE 247 DELTA ELECTRONICS, INC.: COMPANY OVERVIEW
TABLE 248 DELTA ELECTRONICS, INC.: PRODUCTS/SERVICES/SOLUTIONS OFFERED
TABLE 249 DATA SPECIALTIES, INC.: COMPANY OVERVIEW
TABLE 250 DATA SPECIALTIES, INC.: PRODUCTS/SERVICES/SOLUTIONS OFFERED
TABLE 251 PRASA INFOCOM AND POWER SOLUTIONS PVT. LTD.: COMPANY OVERVIEW
TABLE 252 PRASA INFOCOM AND POWER SOLUTIONS PVT. LTD.: PRODUCTS/SERVICES/SOLUTIONS OFFERED
TABLE 253 BLADEROOM GROUP LIMITED: COMPANY OVERVIEW
TABLE 254 BLADEROOM GROUP LIMITED: PRODUCTS/SERVICES/SOLUTIONS OFFERED
TABLE 255 CUPERTINO ELECTRIC, INC.: COMPANY OVERVIEW
TABLE 256 CUPERTINO ELECTRIC, INC.: PRODUCTS/SERVICES/SOLUTIONS OFFERED
 
  
LIST OF FIGURES (60 Figures)
 
FIGURE 1 MARKET SEGMENTATION AND REGIONAL SCOPE
FIGURE 2 MARKET: RESEARCH DESIGN
FIGURE 3 DATA TRIANGULATION
FIGURE 4 MARKET: BOTTOM-UP APPROACH
FIGURE 5 MARKET: TOP-DOWN APPROACH
FIGURE 6 KEY STEPS CONSIDERED TO ASSESS SUPPLY OF OFFSITE DATA CENTER POWER INFRASTRUCTURE
FIGURE 7 MARKET: SUPPLY-SIDE ANALYSIS
FIGURE 8 NORTH AMERICA DOMINATED MARKET IN 2023
FIGURE 9 SOLUTIONS SEGMENT TO ACCOUNT FOR LARGER MARKET SHARE IN 2024
FIGURE 10 BFSI SEGMENT TO LEAD MARKET IN 2030
FIGURE 11 INCREASING DEMAND FOR CLOUD SERVICES AND DATA PROCESSING TO DRIVE MARKET
FIGURE 12 ASIA PACIFIC TO EXHIBIT HIGHEST CAGR DURING FORECAST PERIOD
FIGURE 13 SOLUTIONS AND BFSI SEGMENTS HELD LARGEST MARKET SHARE IN 2023
FIGURE 14 SOLUTIONS SEGMENT TO ACCOUNT FOR LARGER MARKET SHARE IN 2030
FIGURE 15 BFSI SEGMENT TO DOMINATE MARKET IN 2030
FIGURE 16 MARKET: DRIVERS, RESTRAINTS, OPPORTUNITIES, AND CHALLENGES
FIGURE 17 GLOBAL DATA ON ENERGY DEMAND, BY DATA CENTER TYPE, 2010–2022
FIGURE 18 BREAKDOWN OF POWER USAGE IN DATA CENTERS
FIGURE 19 GLOBAL POWER INVESTMENT, 2019–2023
FIGURE 20 GLOBAL CLEAN ENERGY INVESTMENT, 2017–2023
FIGURE 21 GLOBAL ENERGY INVESTMENT, 2019–2023
FIGURE 22 GLOBAL RENEWABLE ENERGY CAPACITY EXPANSION, BY GEOGRAPHY, 2005–2028
FIGURE 23 TOTAL CLEAN ENERGY EXPENDITURE IN DIFFERENT ECONOMIES, 2023
FIGURE 24 TRENDS/DISRUPTIONS IMPACTING CUSTOMER BUSINESS
FIGURE 25 MARKET: ECOSYSTEM ANALYSIS
FIGURE 26 INVESTMENT AND FUNDING SCENARIO
FIGURE 27 MARKET: SUPPLY CHAIN ANALYSIS
FIGURE 28 IMPACT OF AI/GENERATIVE AI ON MARKET SUPPLY CHAIN
FIGURE 29 AVERAGE SELLING PRICE TREND OF KEY PLAYERS, BY OFFERING
FIGURE 30 IMPORT DATA FOR HS CODE 8544-COMPLIANT PRODUCTS, BY COUNTRY, 2019–2023 (USD THOUSAND)
FIGURE 31 EXPORT DATA FOR HS CODE 8544-COMPLIANT PRODUCTS, BY COUNTRY, 2019–2023 (USD THOUSAND)
FIGURE 32 NUMBER OF PATENTS APPLIED AND GRANTED FOR OFFSITE DATA CENTER POWER INFRASTRUCTURE, 2013–2023
FIGURE 33 MARKET: PORTER’S FIVE FORCES ANALYSIS
FIGURE 34 INFLUENCE OF STAKEHOLDERS ON BUYING PROCESS, BY VERTICAL
FIGURE 35 KEY BUYING CRITERIA, BY VERTICAL
FIGURE 36 MARKET SHARE, BY OFFERING, 2023
FIGURE 37 MARKET SHARE, BY VERTICAL, 2023
FIGURE 38 MARKET SHARE, BY REGION
FIGURE 39 ASIA PACIFIC TO REGISTER HIGHEST CAGR DURING FORECAST PERIOD
FIGURE 40 NORTH AMERICA: MARKET SNAPSHOT
FIGURE 41 EUROPE: MARKET SNAPSHOT
FIGURE 42 ASIA PACIFIC: MARKET SNAPSHOT
FIGURE 43 MARKET SHARE ANALYSIS OF TOP COMPANIES IN MARKET, 2023
FIGURE 44 RANKING OF TOP FIVE COMPANIES IN MARKET, 2023
FIGURE 45 MARKET: REVENUE ANALYSIS OF FIVE KEY PLAYERS, 2019–2023
FIGURE 46 MARKET: COMPANY EVALUATION MATRIX (KEY PLAYERS), 2023
FIGURE 47 MARKET: COMPANY FOOTPRINT
FIGURE 48 MARKET: COMPANY EVALUATION MATRIX (STARTUPS/SMES), 2023
FIGURE 49 FINANCIAL METRICS, 2024 (EV/EBITDA)
FIGURE 50 COMPANY VALUATION, 2024 (USD BILLION)
FIGURE 51 BRAND/PRODUCT COMPARISON
FIGURE 52 ABB: COMPANY SNAPSHOT
FIGURE 53 SCHNEIDER ELECTRIC: COMPANY SNAPSHOT
FIGURE 54 VERTIV GROUP CORP.: COMPANY SNAPSHOT
FIGURE 55 EATON: COMPANY SNAPSHOT
FIGURE 56 HUAWEI DIGITAL POWER TECHNOLOGIES CO., LTD.: COMPANY SNAPSHOT
FIGURE 57 COMFORT SYSTEMS USA: COMPANY SNAPSHOT
FIGURE 58 JOHNSON CONTROLS INC.: COMPANY SNAPSHOT
FIGURE 59 HUBBELL: COMPANY SNAPSHOT
FIGURE 60 DELTA ELECTRONICS, INC.: COMPANY SNAPSHOT

This study encompassed significant efforts in determining the present size of the offsite data center power infrastructure market. It commenced with a thorough secondary research process to gather data related to the market, similar markets, and the overarching industry. Subsequently, these findings, assumptions, and market size calculations were rigorously validated by consulting industry experts across the entire supply chain through primary research. The total market size was assessed by conducting an analysis specific to each country. Following that, the market was further dissected, and the data was cross-referenced to estimate the size of various segments and sub-segments within the market.

Secondary Research

In this research study, a wide range of secondary sources were utilized, including directories, databases, and reputable references such as Hoover's, Bloomberg BusinessWeek, Factiva, World Bank, International Monetary Fund (IMF), the US Department of Energy (DOE), and the International Energy Agency (IEA). These sources played a crucial role in gathering valuable data for a comprehensive analysis of the global offsite data center power infrastructure market, covering technical, market-oriented, and commercial aspects. Additional secondary sources included annual reports, press releases, investor presentations, whitepapers, authoritative publications, articles authored by well-respected experts, information from industry associations, trade directories, and various database resources.

Primary Research

The offsite data center power infrastructure market involves a range of stakeholders, including IT service providers, support infrastructure equipment providers, component providers, software providers, system integrators, network service providers, financial organizations, and energy efficiency consultants within the supply chain. To gather qualitative and quantitative insights, various primary sources from both the supply and demand sides of the market were interviewed. The following breakdown presents the primary respondents involved in the research study.

Offsite Data Center Power Infrastructure Market  Size, and Share

To know about the assumptions considered for the study, download the pdf brochure

Market Size Estimation

The estimation and validation of the global offsite data center power infrastructure market size have been conducted using a bottom-up approach. This approach was rigorously employed to ascertain the dimensions of multiple subsegments within the market. The research process comprises the following key stages.

  • In this method, the statistics for each offering of offsite data center power infrastructure have been examined at both the country and regional levels.
  • Thorough secondary and primary research has been conducted to gain a comprehensive understanding of the global market landscape for various segments of offsite data center power infrastructure market.
  • When calculating and forecasting the market size, qualitative factors such as market drivers, limitations, opportunities, and challenges have been taken into account.

Global Offsite Data Center Power Infrastructure Market Size: Bottom-Up Approach

Offsite Data Center Power Infrastructure Market  Bottom Up Approach

To know about the assumptions considered for the study, Request for Free Sample Report

Data Triangulation

The process of determining the overall market size involved the methodologies described earlier, followed by segmenting the market into multiple segments and subsegments. To finalize the comprehensive market analysis and obtain precise statistics for each market segment and subsegment, data triangulation and market segmentation techniques were applied, as appropriate. Data triangulation was accomplished by examining various factors and trends from both the demand and supply perspectives within the ecosystem of the offsite data center power infrastructure market.

Market Definition

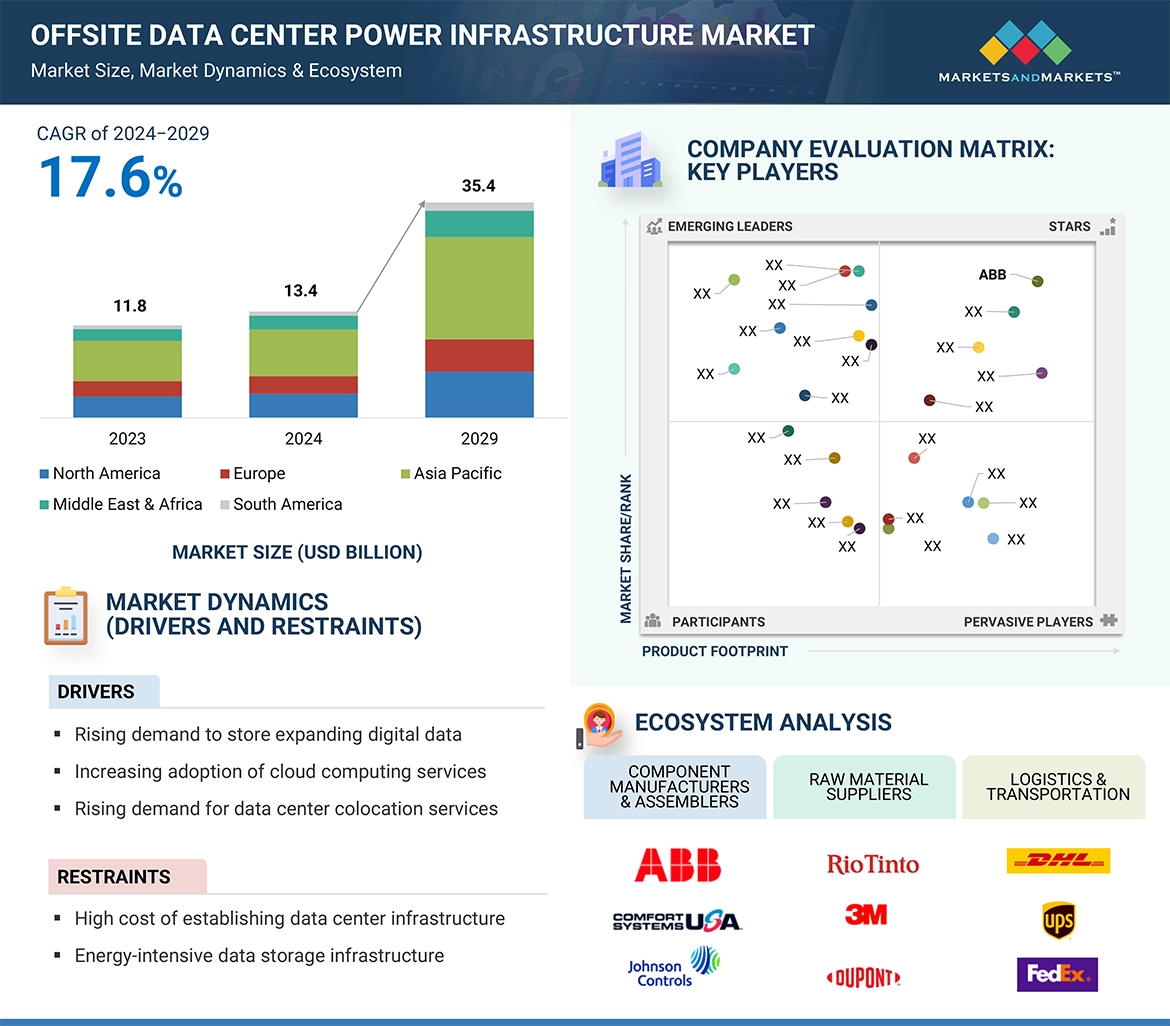
The global offsite data center power infrastructure market involves the comprehensive range of power solutions assembled by the system integrators at their facility which is either integrated with other data center modules at the system integrator’s facility or can be transported to and integrated with the remaining data center modules at the customers’ premises.

Key Stakeholders

  • IT service providers
  • Support infrastructure equipment providers
  • Component providers
  • Software providers
  • System integrators
  • Network service providers
  • Consulting service providers
  • Organizations, forums, alliances, and associations
  • State and national regulatory authorities
  • Venture capital firms
  • Financial organizations
  • Healthcare organizations
  • Energy associations
  • Environment associations
  • Energy efficiency consultants

Objectives of the Study

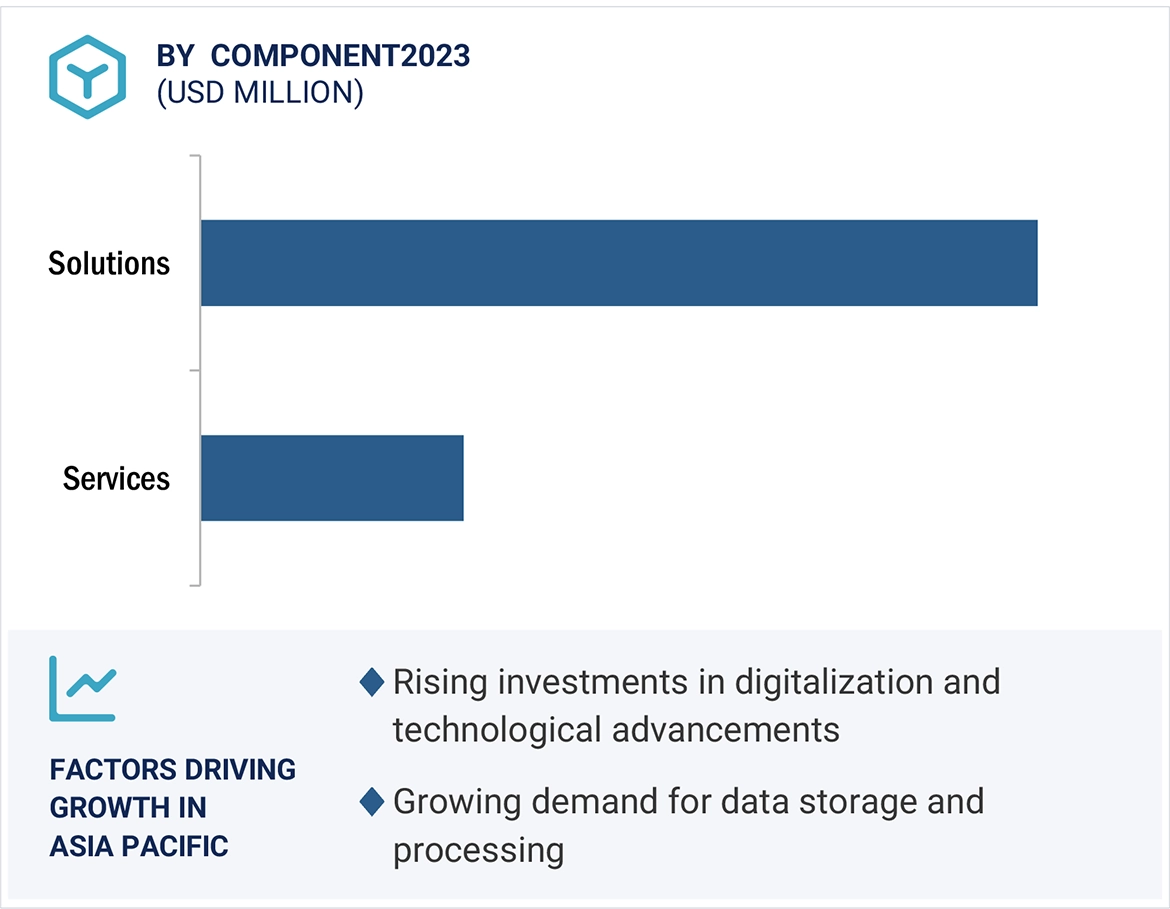
  • To describe and forecast the offsite data center power infrastructure market in terms of value based on components, verticals, and region
  • To provide detailed information about the key factors such as drivers, restraints, opportunities, and challenges influencing the growth of the offsite data center power infrastructure market
  • To strategically analyze the subsegments with respect to individual growth trends, prospects, and contributions of each segment to the overall market size
  • To forecast the market size for five key regions: North America, Europe, Asia Pacific, Middle East & Africa and South America, along with their key countries
  • To strategically analyze micromarkets1 with respect to individual growth trends, prospects, and contributions to the total market
  • To study the complete supply chain and allied industry segments and perform a supply chain analysis of the offsite data center power infrastructure market’ landscape
  • To study market trends, patent analysis, trade analysis, tariff and regulatory landscape, Porter’s five forces analysis, ecosystem mapping, technologies, investment and funding scenario, key stakeholders & buying criteria, case studies pertaining to offsite data center power infrastructure market
  • To analyze the opportunities for various stakeholders by identifying the high-growth segments of the offsite data center power infrastructure market
  • To profile the key players and comprehensively analyze their market positions in terms of ranking and core competencies2, along with detailing the competitive landscape for the market leaders
  • To analyze competitive developments, such as contracts, collaborations, expansions, product launches, investments, and acquisitions, in the offsite data center power infrastructure market

Available Customization

With the given market data, MarketsandMarkets offers customizations based on the company’s specific needs. The following customization options are available for the report:

Product Analysis

  • Product Matrix, which provides a detailed comparison of the product portfolio of each company

Company Information

  • Detailed analyses and profiling of additional market players (up to 5)
Custom Market Research Services

We will customize the research for you, in case the report listed above does not meet with your exact requirements. Our custom research will comprehensively cover the business information you require to help you arrive at strategic and profitable business decisions.

Request Customization
Report Code
EP 9108
Published ON
Aug, 2024
Choose License Type
BUY NOW
  • SHARE
X
Request Customization
Speak to Analyst
Speak to Analyst
OR FACE-TO-FACE MEETING
PERSONALIZE THIS RESEARCH
  • Triangulate with your Own Data
  • Get Data as per your Format and Definition
  • Gain a Deeper Dive on a Specific Application, Geography, Customer or Competitor
  • Any level of Personalization
REQUEST A FREE CUSTOMIZATION
LET US HELP YOU!
  • What are the Known and Unknown Adjacencies Impacting the Offsite Data Center Power Infrastructure Market
  • What will your New Revenue Sources be?
  • Who will be your Top Customer; what will make them switch?
  • Defend your Market Share or Win Competitors
  • Get a Scorecard for Target Partners
CUSTOMIZED WORKSHOP REQUEST
  • Call Us
  • +1-888-600-6441 (Corporate office hours)
  • +1-888-600-6441 (US/Can toll free)
  • +44-800-368-9399 (UK office hours)
CONNECT WITH US
ABOUT TRUST ONLINE
©2024 MarketsandMarkets Research Private Ltd. All rights reserved
DMCA.com Protection Status Website Feedback