Natural Personal Care Ingredients Market by Type (Emollients, Surfactnats, Rheology Modifiers, Preservatives, Active Ingredients), Application (Skin Care, Hair Care, Make-up, Oral Care), and Region - Global Forecast to 2028
Updated on : March 19, 2024
Natural Personal Care Ingredients Market
The global natural personal care ingredients market size was valued at USD 5.3 billion in 2023 and is projected to reach USD 7.9 billion by 2028, growing at 8.3% cagr from 2023 to 2028. One of the major reasons for making a positive outlook for the natural personal care ingredients market is the evolving lifestyle across worldwide, mounting popularity of natural products, and growing online purchase of personal care products. Also, technological advancements in the natural personal care industry are pushing the market. Due to these reasons, the consumption of natural personal care ingredients has grown significantly.
To know about the assumptions considered for the study, Request for Free Sample Report
Natural Personal Care Ingredients Market Dynamics
Driver: Evolving lifestyle across worldwide
The global shift towards more health-conscious and environmentally-friendly lifestyles is serving as a significant driver for the natural personal care ingredients market. As people become increasingly aware of the potential health risks associated with synthetic chemicals in traditional personal care products, there is a growing demand for natural alternatives. Consumers are seeking products that are made from plant-based or organic ingredients, which are perceived as safer and more sustainable. This trend is fueled by a desire for products that align with ethical values, such as cruelty-free manufacturing practices and eco-friendly packaging. As a result, manufacturers are responding to this demand by formulating products with natural ingredients, driving the growth of the natural personal care ingredients market worldwide.
Restraints: Limited shelf life of natural personal care ingredients
The natural personal care ingredients market faces a notable challenge due to the restricted shelf life of its components. Unlike synthetic counterparts, natural ingredients deteriorate more swiftly, impacting not only the formulation process but also the stability and efficacy of the final products. This issue presents manufacturers with hurdles in preserving the freshness and quality of natural ingredients, potentially leading to increased production expenses and shorter product durations. Furthermore, retailers and consumers may exhibit reluctance to stockpile natural personal care items, fearing ingredient degradation and expiration, thereby dampening overall demand. Consequently, the limited shelf life of natural personal care ingredients acts as a deterrent to market expansion, impeding the industry's growth potential.
Opportunities: Mounting demand for male cosmetics
The mounting demand for male cosmetics presents a prime opportunity for the natural personal care ingredients market. As men increasingly prioritize grooming, there's a rising need for products tailored to their needs. Natural ingredients, free from harsh chemicals, align perfectly with this trend, offering effective and sustainable solutions. By catering to the male demographic's preferences for safer products, the natural personal care ingredients market stands to capitalize on this expanding market segment.
Challenges: Lack of consistency of natural personal care ingredients
The lack of consistency in natural personal care ingredients poses a notable challenge for the market. Unlike synthetic counterparts, natural ingredients are subject to fluctuations in quality and composition due to environmental factors and agricultural practices. This variability can complicate efforts to maintain product quality and uniformity, leading to difficulties in formulation and ensuring consumer satisfaction. Manufacturers must implement stringent sourcing and quality control measures to address these challenges and deliver reliable natural personal care products.
Natural Personal Care Ingredients Market Ecosystem
Prominent companies in this market include well-established, financially stable manufacturers of natural personal care ingredients. These companies have been in business for a while and have a broad range of products, cutting-edge technologies, and robust international sales and marketing networks. Prominent companies in this market include BASF SE (Germany), Croda International Plc (UK), Ashland Inc. (US), The Lubrizol Corporation (US), Evonik Industries AG (Germany), Dow Inc. (US), Symrise AG (Germany), and among others.
Based on ingredient type, active ingredients was the largest ingredient type of natural personal care ingredietns market in terms of value, in 2022.
Active ingredients is largest ingredient type of the natural personal care ingredients market, due to their efficacy, active ingextracted primarily from botanical sources. Despite their higher prices compared to other ingredients, their potency in delivering specific benefits like anti-aging or hair strengthening makes them highly sought after by consumers seeking natural alternatives. However, the complex extraction process contributes to their elevated costs. Therefore, active ingredients is the largest ingredient type of natural personal care ingredients market.
Based on application, skin care was the largest segment of natural personal care ingredients market, in terms of value, in 2022.
Skin care stands as the largest application segment within the natural personal care ingredients market, owing to its extensive range of products and the utilization of nearly all types of natural ingredients. From moisturizers to cleansers, serums to masks, skin care encompasses a wide range of products catering to various skin types and concerns. Natural personal care ingredients play a pivotal role across this spectrum, serving as emollients for hydration, surfactants for cleansing, preservatives for product stability, and more. The versatility and efficacy of natural ingredients in addressing diverse skin care needs have propelled their widespread adoption by consumers seeking safer, eco-friendly alternatives. Thus, the skin care is the largest application of natural personal care ingredients market.
Europe accounted for the largest market share for the natural personal care ingredients market, in terms of value, in 2022.
Europe holds the largest share of the natural personal care ingredients market, driven by shifting customer preferences towards eco-friendly and sustainable products. Also,this region boasts the presence of industry giants like BASF SE, Croda International Plc, and Syensqo, renowned for their innovative formulations and commitment to quality. European consumers are increasingly opting for natural ingredients, aligning with the principles of these manufacturers, who prioritize environmentally friendly practices. This convergence of changing consumer demands and the presence of established industry leaders solidifies Europe's dominance in the natural personal care ingredients market.
To know about the assumptions considered for the study, download the pdf brochure
Key Market Players
BASF SE (Germany), Croda International Plc (UK), Syensqo (Belgium), Ashland Inc. (US), Symrise AG (Germany), The Lubrizol Corporation (US), Evonik Industries AG (Germany), Dow Inc. (US), and among others, these are the key manufacturers that secured major market share in the last few years.
Read More: Natural Personal Care Ingredients Companies
Natural Personal Care Ingredients Market Report Scope
Report Metric |
Details |
Market Size Value in 2022 |
USD 5.0 Billion |
Revenue Forecast in 2028 |
USD 7.9 Billion |
CAGR |
8.3% |
Years considered for the study |
2017–2028 |
Base year considered |
2022 |
Forecast period |
2023–2028 |
Units considered |
Volume (Ton) and Value (USD Million) |
Segments Covered |
Ingredient Type, Application, and Region |
Regions covered |
Asia Pacific, North America, Europe, Middle East & Africa, and South America |
Companies profiled |
The key players profiled in the report include BASF SE (Germany), Croda International Plc (UK), Ashland Inc. (US), The Lubrizol Corporation (US), Evonik Industries AG (Germany), Dow Inc. (US), Symrise AG (Germany), and others.
|
This report categorizes the global Natural Personal Care Ingredients Market based on ingredient type, application, and region.
On the basis of ingredient type, the Natural Personal Care Ingredients Market has been segmented as follows:
- Emollients
- Surfactants
- Preservatives
- Sugar Polymers
- Rheology Modifiers
- Active Ingredients
- Others
On the basis of application, the Natural Personal Care Ingredients Market has been segmented as follows:
- Skin Care
- Hair Care
- Make-up
- Oral Care
- Others
On the basis of region, the Natural Personal Care Ingredients Market has been segmented as follows:
- Asia Pacific
- Europe
- North America
- Middle East & Arica
- South America
Recent Developments
- In May 2023, BASF SE partnered with BEAUTYSTREAMS to further expand its D’lite digital service for the personal care industry.
- In July 2023, Croda International Plc has completed the acquisition of Solus Biotech, a global leader in biotechnology-derived active ingredients for beauty care and pharmaceuticals.
- In September 2021, Symrise AG enters a strategic partnership with Kobo Products Inc. to broaden its presence in UV filters and decorative cosmetics.
- In October 2023, Ashland introduces an innovative addition to its repertoire with the launch of Gantrez soja under the new transformed vegetable oils technology platform. This advanced delivery system is specially formulated for toothpaste and mouthwash applications.
- In January 2024, The Syensqo made an investment of USD 2.1 million in Bioeutectics through Syensqo’s venture capital fund. Bioeutectics is founded in 2019, provides natural and high-performance solvents for cosmetics, and other industries.
Frequently Asked Questions (FAQ):
Which are the major players in the natural personal care ingredients market?
The key players profiled in the report include BASF SE (Germany), Croda International Plc (UK), Ashland Inc. (US), The Lubrizol Corporation (US), Evonik Industries AG (Germany), Dow Inc. (US), Symrise AG (Germany), and among others.
What are the drivers and opportunities for the natural personal care ingredients market?
The evolving lifestyle across worldwide is the major driver for this market.
What are the various strategies key players are focusing within natural personal care ingredients market?
New product launches, expansion and partnerships are some of the strategies adopted by key players to expand their global presence.
What is the CAGR of the natural personal care ingredients Market?
The market is projected to grow at a CAGR of 8.3% in terms of value, during the forecast period.
What are the major factors restraining natural personal care ingredients market growth during the forecast period?
Limited shelf life of natural personal care ingredients is expected to restrict the market demand. .
What are the key natural ingredients driving the U.S. personal care market?
Ingredients like aloe vera, shea butter, coconut oil, and plant-based antioxidants are dominating the U.S. natural personal care market. Consumers are increasingly drawn to products with clean-label formulations, free from synthetic additives, and derived from sustainably sourced botanicals. This trend is especially prominent in skincare, haircare, and wellness-focused products.
How is the demand for natural personal care ingredients evolving in the UK?
In the UK, there is growing demand for ethically sourced and cruelty-free natural ingredients like chamomile, rosehip oil, and seaweed extracts. The rise of "green beauty" and a focus on transparency in product labeling are encouraging manufacturers to adopt organic and vegan-certified ingredients. This trend is supported by heightened consumer awareness and regulatory pressure to prioritize sustainability.
What are the key trends driving the natural personal care ingredients market in the U.S.?
In the United States, the natural personal care ingredients market is primarily driven by a growing consumer preference for clean and sustainable products. Consumers are increasingly concerned about the safety and environmental impact of the ingredients used in personal care products, leading to a demand for formulations that are free from synthetic chemicals and harmful additives. Additionally, the rise of social media and influencer marketing has heightened awareness of natural beauty trends, encouraging brands to adopt transparency in their ingredient sourcing and production processes. This shift is further supported by a regulatory environment that increasingly favors natural and organic certifications, prompting manufacturers to innovate and expand their offerings in this segment.
How is consumer awareness influencing the natural personal care ingredients market in the UK?
In the United Kingdom, consumer awareness plays a significant role in shaping the natural personal care ingredients market. There is a notable increase in demand for products that are labeled as organic, cruelty-free, and environmentally friendly. Consumers are actively seeking out brands that prioritize ethical sourcing and sustainable practices, which has led to a surge in the availability of natural personal care products across retail channels. Furthermore, educational campaigns and increased access to information about ingredient safety have empowered consumers to make informed choices, driving brands to reformulate existing products and develop new lines that align with these preferences. This trend is fostering a competitive landscape where transparency and sustainability are key differentiators for success.
To speak to our analyst for a discussion on the above findings, click Speak to Analyst
Exclusive indicates content/data unique to MarketsandMarkets and not available with any competitors.
- 5.1 INTRODUCTION
-
5.2 MARKET DYNAMICSDRIVERS- Growing popularity of organic and clean-label products- Government regulations and incentives- Changing lifestyles worldwide- Rise in online purchases of cosmeticsRESTRAINTS- High cost of natural personal care ingredients- Limited efficacy, shelf life, and stability of natural personal care ingredientsOPPORTUNITIES- Rising demand for male cosmetics- Development of new natural preservatives- Increased demand for customization in cosmetic products- Concerns for safety of chemically derived personal care ingredientsCHALLENGES- Challenges of extracting natural personal care ingredients- Lack of standardization- Increase in counterfeit cosmetic products
-
5.3 PORTER’S FIVE FORCES ANALYSISTHREAT OF NEW ENTRANTSTHREAT OF SUBSTITUTESBARGAINING POWER OF SUPPLIERSBARGAINING POWER OF BUYERSRIVALRY AMONG EXISTING COMPETITORS
-
5.4 MACROECONOMIC INDICATORSGDP TRENDS AND FORECAST FOR MAJOR ECONOMIES
-
6.1 SUPPLY CHAIN ANALYSISRAW MATERIAL SUPPLIERMANUFACTURERDISTRIBUTION NETWORKEND-USE INDUSTRY
-
6.2 TRENDS/DISRUPTIONS IMPACTING CUSTOMERS’ BUSINESSESREVENUE SHIFT & NEW REVENUE POCKETS FOR NATURAL PERSONAL CARE INGREDIENTS MARKET
- 6.3 ECOSYSTEM ANALYSIS/MARKET MAP
-
6.4 TECHNOLOGY ANALYSISKEY TECHNOLOGIES- Supercritical fluid extraction (SFE)- Pigment extraction (Carotenoids from Microbes)- Zeta Fraction technology- Bio-based Vitamin ACOMPLEMENTARY TECHNOLOGIES- Trans-epidermal Formulations- Microencapsulation
-
6.5 CASE STUDYCRODA BRINGING ANTI-AGING BENEFITS TO MAKE-UP
-
6.6 KEY STAKEHOLDERS AND BUYING CRITERIAKEY STAKEHOLDERS IN BUYING PROCESSBUYING CRITERIA
-
6.7 PRICING ANALYSISAVERAGE SELLING PRICE TREND OF KEY PLAYERS, BY APPLICATIONAVERAGE SELLING PRICE TREND, BY REGION
-
6.8 TRADE ANALYSISIMPORT DATAEXPORT DATA
-
6.9 REGULATORY LANDSCAPEREGULATORY BODIES, GOVERNMENT AGENCIES, AND OTHER ORGANIZATIONS
- 6.10 KEY CONFERENCES & EVENTS IN 2024–2025
- 6.11 INVESTMENT AND FUNDING SCENARIO
-
6.12 PATENT ANALYSISAPPROACHPATENT TYPETOP APPLICANTSJURISDICTION ANALYSIS
- 7.1 INTRODUCTION
-
7.2 EMOLLIENTSDEMAND FOR EMOLLIENTS DUE TO GROWING CONSUMPTION OF SKIN CARE PRODUCTS
-
7.3 SURFACTANTSINCREASING SKIN CARE AND HAIR CARE APPLICATIONS TO DRIVE MARKET
-
7.4 PRESERVATIVESINCREASING CONSUMER DEMAND FOR NATURAL AND SUSTAINABLE PRODUCTS TO DRIVE MARKET
-
7.5 SUGAR POLYMERSEXTENSIVE USE IN NATURAL AND ECO-FRIENDLY PERSONAL CARE PRODUCTS DUE TO BIOCOMPATIBILITY AND BIODEGRADABILITY
-
7.6 RHEOLOGY MODIFIERSRHEOLOGY MODIFIERS USED IN PERSONAL CARE PRODUCTS TO INCREASE VISCOSITY OF FORMULATIONS
-
7.7 ACTIVE INGREDIENTSEXTENSIVE USE IN SKIN CARE AND HAIR CARE APPLICATIONS TO DRIVE MARKET
- 7.8 OTHER INGREDIENT TYPES
- 8.1 INTRODUCTION
-
8.2 SKIN CAREGROWING DEMAND FOR SKIN CARE PRODUCTS FOR VARIOUS SKIN-RELATED PROBLEMS TO DRIVE MARKET
-
8.3 HAIR CAREGROWING PROBLEMS RELATED TO HAIR TO DRIVE MARKET
-
8.4 MAKE-UPGROWING DEMAND FOR LIPSTICK, MASCARA, FOUNDATION, AND BLUSHERS TO DRIVE MARKET
-
8.5 ORAL CAREINCREASING AWARENESS OF MAINTENANCE OF ORAL HYGIENE TO DRIVE MARKET
- 8.6 OTHER APPLICATIONS
- 9.1 INTRODUCTION
-
9.2 ASIA PACIFICIMPACT OF RECESSION ON ASIA PACIFICASIA PACIFIC NATURAL PERSONAL CARE INGREDIENTS MARKET, BY APPLICATIONASIA PACIFIC NATURAL PERSONAL CARE INGREDIENTS MARKET, BY COUNTRY- China- India- Japan- South Korea
-
9.3 NORTH AMERICAIMPACT OF RECESSION ON NORTH AMERICANORTH AMERICA NATURAL PERSONAL CARE INGREDIENTS MARKET, BY APPLICATIONNORTH AMERICA NATURAL PERSONAL CARE INGREDIENTS MARKET, BY COUNTRY- US- Canada- Mexico
-
9.4 EUROPEIMPACT OF RECESSION ON EUROPEEUROPE NATURAL PERSONAL CARE INGREDIENTS MARKET, BY APPLICATIONEUROPE NATURAL PERSONAL CARE INGREDIENTS MARKET, BY COUNTRY- Germany- France- Italy- UK
-
9.5 MIDDLE EAST & AFRICAIMPACT OF RECESSION ON MIDDLE EAST & AFRICAMIDDLE EAST & AFRICA NATURAL PERSONAL CARE INGREDIENTS MARKET, BY APPLICATIONMIDDLE EAST & AFRICA NATURAL PERSONAL CARE INGREDIENTS MARKET, BY COUNTRY- GCC- Egypt- South Africa
-
9.6 SOUTH AMERICAIMPACT OF RECESSION ON SOUTH AMERICASOUTH AMERICA NATURAL PERSONAL CARE INGREDIENTS MARKET, BY APPLICATIONSOUTH AMERICA NATURAL PERSONAL CARE INGREDIENTS MARKET, BY COUNTRY- Brazil- Argentina
- 10.1 INTRODUCTION
- 10.2 KEY PLAYERS’ STRATEGIES/RIGHT TO WIN
-
10.3 MARKET SHARE ANALYSISRANKING OF KEY MARKET PLAYERS, 2022
- 10.4 REVENUE ANALYSIS
-
10.5 COMPANY EVALUATION MATRIX: KEY PLAYERS, 2022STARSEMERGING LEADERSPERVASIVE PLAYERSPARTICIPANTSCOMPANY FOOTPRINT, KEY PLAYERS, 2022- Company footprint- Region footprint- Ingredient type footprint- Application footprint
-
10.6 COMPANY EVALUATION MATRIX: START-UPS/SMES, 2022PROGRESSIVE COMPANIESRESPONSIVE COMPANIESDYNAMIC COMPANIESSTARTING BLOCKSCOMPETITIVE BENCHMARKING: STARTUPS/SMES, 2022- Natural personal care ingredients market: detailed list of key start-ups/SMES- Natural personal care ingredients market: competitive benchmarking of key start-ups/SMES
- 10.7 COMPANY EVALUATION AND FINANCIAL METRICS
- 10.8 BRAND/PRODUCT COMPARISON
-
10.9 COMPETITIVE SITUATIONS & TRENDSPRODUCT LAUNCHESDEALSOTHER DEVELOPMENTS
-
11.1 KEY PLAYERSBASF SE- Business overview- Products/Solutions/Services offered- Recent developments- MnM viewCRODA INTERNATIONAL PLC- Business overview- Products/Solutions/Services offered- Recent developments- MnM viewEVONIK INDUSTRIES AG- Business overview- Products/Solutions/Services offered- Recent developments- MnM viewSYMRISE AG- Business overview- Products/Solutions/Services offered- Recent developments- MnM viewTHE LUBRIZOL CORPORATION- Business overview- Products/Solutions/Services offered- MnM viewASHLAND INC.- Business overview- Products/Solutions/Services offered- Recent developmentsCLARIANT AG- Business overview- Products offered/Solutions/Services offered- Recent developmentsSYENSQO- Business overview- Products/Solutions/Services offered- Recent developmentsAGRANA BETEILIGUNGS-AG- Business overview- Products/Solutions/Services offered- MnM viewDOW INC.- Business overview- Products/Solutions/Services offered- Dow Inc.: Recent developments- MnM view
-
11.2 STARTUP/SMESGATTEFOSSE SASNOURYONSOLABIA GROUPROQUETTE FRERESGENOMATICA, INC.COVESTRO AGEFP BIOTEKVIVIMED LABS LTD.CARGILL, INCORPORATEDSILABSEPPICARCHER DANIELS MIDLAND COMPANYVANTAGE SPECIALTY CHEMICALSSTEPAN COMPANYASH INGREDIENTS, INC.
- 12.1 INTRODUCTION
- 12.2 LIMITATION
-
12.3 GREEN PRESERVATIVES MARKETMARKET DEFINITIONMARKET OVERVIEW
-
12.4 GREEN PRESERVATIVES MARKET, BY REGIONNORTH AMERICAASIA PACIFICEUROPEMIDDLE EAST & AFRICASOUTH AMERICA
- 13.1 DISCUSSION GUIDE
- 13.2 KNOWLEDGESTORE: MARKETSANDMARKETS’ SUBSCRIPTION PORTAL
- 13.3 CUSTOMIZATION OPTIONS
- 13.4 RELATED REPORTS
- 13.5 AUTHOR DETAILS
- TABLE 1 NATURAL PERSONAL CARE INGREDIENTS MARKET: RISK ASSESSMENT
- TABLE 2 GROSS ADJUSTED HOUSEHOLD DISPOSABLE PER CAPITA INCOME, 2019 AND 2022 (USD)
- TABLE 3 NATURAL PRESERVATIVES AND THEIR APPLICATIONS
- TABLE 4 NATURAL PERSONAL CARE INGREDIENTS MARKET: PORTER’S FIVE FORCES ANALYSIS
- TABLE 5 GDP TRENDS AND FORECAST OF MAJOR ECONOMIES, 2020–2028 (USD BILLION)
- TABLE 6 NATURAL PERSONAL CARE INGREDIENTS MARKET: ECOSYSTEM
- TABLE 7 INFLUENCE OF STAKEHOLDERS ON BUYING PROCESS FOR TOP THREE APPLICATIONS (%)
- TABLE 8 KEY BUYING CRITERIA FOR TOP THREE APPLICATIONS
- TABLE 9 AVERAGE SELLING PRICE TREND OF KEY PLAYERS FOR TOP THREE APPLICATIONS (USD/KG)
- TABLE 10 AVERAGE SELLING PRICES TREND OF NATURAL PERSONAL CARE INGREDIENTS, BY REGION, 2021–2028 (USD/KG)
- TABLE 11 IMPORTS OF NATURAL PERSONAL CARE INGREDIENTS, BY REGION, 2017–2022 (USD MILLION)
- TABLE 12 EXPORTS OF NATURAL PERSONAL CARE INGREDIENTS, BY REGION, 2017–2022 (USD MILLION)
- TABLE 13 NORTH AMERICA: REGULATIONS FOR NATURAL PERSONAL CARE INGREDIENTS
- TABLE 14 EUROPE: REGULATIONS FOR NATURAL PERSONAL CARE INGREDIENTS
- TABLE 15 ASIA PACIFIC: REGULATIONS FOR NATURAL PERSONAL CARE INGREDIENTS
- TABLE 16 REST OF THE WORLD: REGULATIONS FOR NATURAL PERSONAL CARE INGREDIENTS
- TABLE 17 NATURAL PERSONAL CARE INGREDIENTS MARKET: DETAILED LIST OF CONFERENCES & EVENTS
- TABLE 18 PATENT STATUS: PATENT APPLICATIONS, LIMITED PATENTS, AND GRANTED PATENTS
- TABLE 19 PATENTS BY BASF SE
- TABLE 20 TOP 10 PATENT OWNERS IN US, 2012–2023
- TABLE 21 NATURAL PERSONAL CARE INGREDIENTS MARKET, BY INGREDIENT TYPE, 2017–2021 (USD MILLION)
- TABLE 22 NATURAL PERSONAL CARE INGREDIENTS MARKET, BY INGREDIENT TYPE, 2022–2028 (USD MILLION)
- TABLE 23 NATURAL PERSONAL CARE INGREDIENTS MARKET, BY INGREDIENT TYPE, 2017–2021 (TON)
- TABLE 24 NATURAL PERSONAL CARE INGREDIENTS MARKET, BY INGREDIENT TYPE, 2022–2028 (TON)
- TABLE 25 EMOLLIENTS: NATURAL PERSONAL CARE INGREDIENTS MARKET, BY APPLICATION, 2017–2021 (USD MILLION)
- TABLE 26 EMOLLIENTS: NATURAL PERSONAL CARE INGREDIENTS MARKET, BY APPLICATION, 2022–2028 (USD MILLION)
- TABLE 27 EMOLLIENTS: NATURAL PERSONAL CARE INGREDIENTS MARKET, BY APPLICATION, 2017–2021 (TON)
- TABLE 28 EMOLLIENTS: NATURAL PERSONAL CARE INGREDIENTS MARKET, BY APPLICATION, 2022–2028 (TON)
- TABLE 29 SURFACTANTS: NATURAL PERSONAL CARE INGREDIENTS MARKET, BY APPLICATION, 2017–2021 (USD MILLION)
- TABLE 30 SURFACTANTS: NATURAL PERSONAL CARE INGREDIENTS MARKET, BY APPLICATION, 2022–2028 (USD MILLION)
- TABLE 31 SURFACTANTS: NATURAL PERSONAL CARE INGREDIENTS MARKET, BY APPLICATION, 2017–2021 (TON)
- TABLE 32 SURFACTANTS: NATURAL PERSONAL CARE INGREDIENTS MARKET, BY APPLICATION, 2022–2028 (TON)
- TABLE 33 PRESERVATIVES: NATURAL PERSONAL CARE INGREDIENTS MARKET, BY APPLICATION, 2017–2021 (USD MILLION)
- TABLE 34 PRESERVATIVES: NATURAL PERSONAL CARE INGREDIENTS MARKET, BY APPLICATION, 2022–2028 (USD MILLION)
- TABLE 35 PRESERVATIVES: NATURAL PERSONAL CARE INGREDIENTS MARKET, BY APPLICATION, 2017–2021 (TON)
- TABLE 36 PRESERVATIVES: NATURAL PERSONAL CARE INGREDIENTS MARKET, BY APPLICATION, 2022–2028 (TON)
- TABLE 37 SUGAR POLYMERS: NATURAL PERSONAL CARE INGREDIENTS MARKET, BY APPLICATION, 2017–2021 (USD MILLION)
- TABLE 38 SUGAR POLYMERS: NATURAL PERSONAL CARE INGREDIENTS MARKET, BY APPLICATION, 2022–2028 (USD MILLION)
- TABLE 39 SUGAR POLYMERS: NATURAL PERSONAL CARE INGREDIENTS MARKET, BY APPLICATION, 2017–2021 (TON)
- TABLE 40 SUGAR POLYMERS: NATURAL PERSONAL CARE INGREDIENTS MARKET, BY APPLICATION, 2022–2028 (TON)
- TABLE 41 RHEOLOGY MODIFIERS: NATURAL PERSONAL CARE INGREDIENTS MARKET, BY APPLICATION, 2017–2021 (USD MILLION)
- TABLE 42 RHEOLOGY MODIFIERS: NATURAL PERSONAL CARE INGREDIENTS MARKET, BY APPLICATION, 2022–2028 (USD MILLION)
- TABLE 43 RHEOLOGY MODIFIERS: NATURAL PERSONAL CARE INGREDIENTS MARKET, BY APPLICATION, 2017–2021 (TON)
- TABLE 44 RHEOLOGY MODIFIERS: NATURAL PERSONAL CARE INGREDIENTS MARKET, BY APPLICATION, 2022–2028 (TON)
- TABLE 45 ACTIVE INGREDIENTS: NATURAL PERSONAL CARE INGREDIENTS MARKET, BY APPLICATION, 2017–2021 (USD MILLION)
- TABLE 46 ACTIVE INGREDIENTS: NATURAL PERSONAL CARE INGREDIENTS MARKET, BY APPLICATION, 2022–2028 (USD MILLION)
- TABLE 47 ACTIVE INGREDIENTS: NATURAL PERSONAL CARE INGREDIENTS MARKET, BY APPLICATION, 2017–2021 (TON)
- TABLE 48 ACTIVE INGREDIENTS: NATURAL PERSONAL CARE INGREDIENTS MARKET, BY APPLICATION, 2022–2028 (TON)
- TABLE 49 OTHER INGREDIENT TYPES: PERSONAL CARE INGREDIENTS MARKET, BY APPLICATION, 2017–2021 (USD MILLION)
- TABLE 50 OTHER INGREDIENT TYPES: PERSONAL CARE INGREDIENTS MARKET, BY APPLICATION, 2022–2028 (USD MILLION)
- TABLE 51 OTHER INGREDIENT TYPES: PERSONAL CARE INGREDIENTS MARKET, BY APPLICATION, 2017–2021 (TON)
- TABLE 52 OTHER INGREDIENT TYPES: PERSONAL CARE INGREDIENTS MARKET, BY APPLICATION, 2022–2028 (TON)
- TABLE 53 NATURAL PERSONAL CARE INGREDIENTS MARKET, BY APPLICATION, 2017–2021 (USD MILLION)
- TABLE 54 NATURAL PERSONAL CARE INGREDIENTS MARKET, BY APPLICATION, 2022–2028 (USD MILLION)
- TABLE 55 NATURAL PERSONAL CARE INGREDIENTS MARKET, BY APPLICATION, 2017–2021 (TON)
- TABLE 56 NATURAL PERSONAL CARE INGREDIENTS MARKET, BY APPLICATION, 2022–2028 (TON)
- TABLE 57 SKIN CARE: NATURAL PERSONAL CARE INGREDIENTS MARKET, BY REGION, 2017–2021 (USD MILLION)
- TABLE 58 SKIN CARE: NATURAL PERSONAL CARE INGREDIENTS MARKET, BY REGION, 2022–2028 (USD MILLION)
- TABLE 59 SKIN CARE: NATURAL PERSONAL CARE INGREDIENTS MARKET, BY REGION, 2017–2021 (TON)
- TABLE 60 SKIN CARE: NATURAL PERSONAL CARE INGREDIENTS MARKET, BY REGION, 2022–2028 (TON)
- TABLE 61 SKIN CARE: NATURAL PERSONAL CARE INGREDIENTS MARKET, BY INGREDIENT TYPE, 2017–2021 (USD MILLION)
- TABLE 62 SKIN CARE: NATURAL PERSONAL CARE INGREDIENTS MARKET, BY INGREDIENT TYPE, 2022–2028 (USD MILLION)
- TABLE 63 SKIN CARE: NATURAL PERSONAL CARE INGREDIENTS MARKET, BY INGREDIENT TYPE, 2017–2021 (TON)
- TABLE 64 SKIN CARE: NATURAL PERSONAL CARE INGREDIENTS MARKET, BY INGREDIENT TYPE, 2022–2028 (TON)
- TABLE 65 HAIR CARE: NATURAL PERSONAL CARE INGREDIENTS MARKET, BY REGION, 2017–2021 (USD MILLION)
- TABLE 66 HAIR CARE: NATURAL PERSONAL CARE INGREDIENTS MARKET, BY REGION, 2022–2028 (USD MILLION)
- TABLE 67 HAIR CARE: NATURAL PERSONAL CARE INGREDIENTS MARKET, BY REGION, 2017–2021 (TON)
- TABLE 68 HAIR CARE: NATURAL PERSONAL CARE INGREDIENTS MARKET, BY REGION, 2022–2028 (TON)
- TABLE 69 HAIR CARE: NATURAL PERSONAL CARE INGREDIENTS MARKET, BY INGREDIENT TYPE, 2017–2021 (USD MILLION)
- TABLE 70 HAIR CARE: NATURAL PERSONAL CARE INGREDIENTS MARKET, BY INGREDIENT TYPE, 2022–2028 (USD MILLION)
- TABLE 71 HAIR CARE: NATURAL PERSONAL CARE INGREDIENTS MARKET, BY INGREDIENT TYPE, 2017–2021 (TON)
- TABLE 72 HAIR CARE: NATURAL PERSONAL CARE INGREDIENTS MARKET, BY INGREDIENT TYPE, 2022–2028 (TON)
- TABLE 73 MAKE-UP: NATURAL PERSONAL CARE INGREDIENTS MARKET, BY REGION, 2017–2021 (USD MILLION)
- TABLE 74 MAKE-UP: NATURAL PERSONAL CARE INGREDIENTS MARKET, BY REGION, 2022–2028 (USD MILLION)
- TABLE 75 MAKE-UP: NATURAL PERSONAL CARE INGREDIENTS MARKET, BY REGION, 2017–2021 (TON)
- TABLE 76 MAKE-UP: NATURAL PERSONAL CARE INGREDIENTS MARKET, BY REGION, 2022–2028 (TON)
- TABLE 77 MAKE-UP: NATURAL PERSONAL CARE INGREDIENTS MARKET, BY INGREDIENT TYPE, 2017–2021 (USD MILLION)
- TABLE 78 MAKE-UP: NATURAL PERSONAL CARE INGREDIENTS MARKET, BY INGREDIENT TYPE, 2022–2028 (USD MILLION)
- TABLE 79 MAKE-UP: NATURAL PERSONAL CARE INGREDIENTS MARKET, BY INGREDIENT TYPE, 2017–2021 (TON)
- TABLE 80 MAKE-UP: NATURAL PERSONAL CARE INGREDIENTS MARKET, BY INGREDIENT TYPE, 2022–2028 (TON)
- TABLE 81 ORAL CARE: NATURAL PERSONAL CARE INGREDIENTS MARKET, BY REGION, 2017–2021 (USD MILLION)
- TABLE 82 ORAL CARE: NATURAL PERSONAL CARE INGREDIENTS MARKET, BY REGION, 2022–2028 (USD MILLION)
- TABLE 83 ORAL CARE: NATURAL PERSONAL CARE INGREDIENTS MARKET, BY REGION, 2017–2021 (TON)
- TABLE 84 ORAL CARE: NATURAL PERSONAL CARE INGREDIENTS MARKET, BY REGION, 2022–2028 (TON)
- TABLE 85 ORAL CARE: NATURAL PERSONAL CARE INGREDIENTS MARKET, BY INGREDIENT TYPE, 2017–2021 (USD MILLION)
- TABLE 86 ORAL CARE: NATURAL PERSONAL CARE INGREDIENTS MARKET, BY INGREDIENT TYPE, 2022–2028 (USD MILLION)
- TABLE 87 ORAL CARE: NATURAL PERSONAL CARE INGREDIENTS MARKET, BY INGREDIENT TYPE, 2017–2021 (TON)
- TABLE 88 ORAL CARE: NATURAL PERSONAL CARE INGREDIENTS MARKET, BY INGREDIENT TYPE, 2022–2028 (TON)
- TABLE 89 OTHER APPLICATIONS: NATURAL PERSONAL CARE INGREDIENTS MARKET, BY REGION, 2017–2021 (USD MILLION)
- TABLE 90 OTHER APPLICATIONS: NATURAL PERSONAL CARE INGREDIENTS MARKET, BY REGION, 2022–2028 (USD MILLION)
- TABLE 91 OTHER APPLICATIONS: NATURAL PERSONAL CARE INGREDIENTS MARKET, BY REGION, 2017–2021 (TON)
- TABLE 92 OTHER APPLICATIONS: NATURAL PERSONAL CARE INGREDIENTS MARKET, BY REGION, 2022–2028 (TON)
- TABLE 93 OTHER APPLICATIONS: NATURAL PERSONAL CARE INGREDIENTS MARKET, BY INGREDIENT TYPE, 2017–2021 (USD MILLION)
- TABLE 94 OTHER APPLICATIONS: NATURAL PERSONAL CARE INGREDIENTS MARKET, BY INGREDIENT TYPE, 2022–2028 (USD MILLION)
- TABLE 95 OTHER APPLICATIONS: NATURAL PERSONAL CARE INGREDIENTS MARKET, BY INGREDIENT TYPE, 2017–2021 (TON)
- TABLE 96 OTHER APPLICATIONS: NATURAL PERSONAL CARE INGREDIENTS MARKET, BY INGREDIENT TYPE, 2022–2028 (TON)
- TABLE 97 NATURAL PERSONAL CARE INGREDIENTS MARKET, BY REGION, 2017–2021 (USD MILLION)
- TABLE 98 NATURAL PERSONAL CARE INGREDIENTS MARKET, BY REGION, 2022–2028 (USD MILLION)
- TABLE 99 NATURAL PERSONAL CARE INGREDIENTS MARKET, BY REGION, 2017–2021 (TON)
- TABLE 100 NATURAL PERSONAL CARE INGREDIENTS MARKET, BY REGION, 2022–2028 (TON)
- TABLE 101 ASIA PACIFIC: NATURAL PERSONAL CARE INGREDIENTS MARKET, BY APPLICATION, 2017–2021 (USD MILLION)
- TABLE 102 ASIA PACIFIC: NATURAL PERSONAL CARE INGREDIENTS MARKET, BY APPLICATION, 2022–2028 (USD MILLION)
- TABLE 103 ASIA PACIFIC: NATURAL PERSONAL CARE INGREDIENTS MARKET, BY APPLICATION, 2017–2021 (TON)
- TABLE 104 ASIA PACIFIC: NATURAL PERSONAL CARE INGREDIENTS MARKET, BY APPLICATION, 2022–2028 (TON)
- TABLE 105 ASIA PACIFIC: NATURAL PERSONAL CARE INGREDIENTS MARKET, BY COUNTRY, 2017–2021 (USD MILLION)
- TABLE 106 ASIA PACIFIC: NATURAL PERSONAL CARE INGREDIENTS MARKET, BY COUNTRY, 2022–2028 (USD MILLION)
- TABLE 107 ASIA PACIFIC: NATURAL PERSONAL CARE INGREDIENTS MARKET, BY COUNTRY, 2017–2021 (TON)
- TABLE 108 ASIA PACIFIC: NATURAL PERSONAL CARE INGREDIENTS MARKET, BY COUNTRY, 2022–2028 (TON)
- TABLE 109 CHINA: NATURAL PERSONAL CARE INGREDIENTS MARKET, BY APPLICATION, 2017–2021 (USD MILLION)
- TABLE 110 CHINA: NATURAL PERSONAL CARE INGREDIENTS MARKET, BY APPLICATION, 2022–2028 (USD MILLION)
- TABLE 111 CHINA: NATURAL PERSONAL CARE INGREDIENTS MARKET, BY APPLICATION, 2017–2021 (TON)
- TABLE 112 CHINA: NATURAL PERSONAL CARE INGREDIENTS MARKET, BY APPLICATION, 2022–2028 (TON)
- TABLE 113 INDIA: NATURAL PERSONAL CARE INGREDIENTS MARKET, BY APPLICATION, 2017–2021 (USD MILLION)
- TABLE 114 INDIA: NATURAL PERSONAL CARE INGREDIENTS MARKET, BY APPLICATION, 2022–2028 (USD MILLION)
- TABLE 115 INDIA: NATURAL PERSONAL CARE INGREDIENTS MARKET, BY APPLICATION, 2017–2021 (TON)
- TABLE 116 INDIA: NATURAL PERSONAL CARE INGREDIENTS MARKET, BY APPLICATION, 2022–2028 (TON)
- TABLE 117 JAPAN: NATURAL PERSONAL CARE INGREDIENTS MARKET, BY APPLICATION, 2017–2021 (USD MILLION)
- TABLE 118 JAPAN: NATURAL PERSONAL CARE INGREDIENTS MARKET, BY APPLICATION, 2022–2028 (USD MILLION)
- TABLE 119 JAPAN: NATURAL PERSONAL CARE INGREDIENTS MARKET, BY APPLICATION, 2017–2021 (TON)
- TABLE 120 JAPAN: NATURAL PERSONAL CARE INGREDIENTS MARKET, BY APPLICATION, 2022–2028 (TON)
- TABLE 121 SOUTH KOREA: NATURAL PERSONAL CARE INGREDIENTS MARKET, BY APPLICATION, 2017–2021 (USD MILLION)
- TABLE 122 SOUTH KOREA: NATURAL PERSONAL CARE INGREDIENTS MARKET, BY APPLICATION, 2022–2028 (USD MILLION)
- TABLE 123 SOUTH KOREA: NATURAL PERSONAL CARE INGREDIENTS MARKET, BY APPLICATION, 2017–2021 (TON)
- TABLE 124 SOUTH KOREA: NATURAL PERSONAL CARE INGREDIENTS MARKET, BY APPLICATION, 2022–2028 (TON)
- TABLE 125 NORTH AMERICA: NATURAL PERSONAL CARE INGREDIENTS MARKET, BY APPLICATION, 2017–2021 (USD MILLION)
- TABLE 126 NORTH AMERICA: NATURAL PERSONAL CARE INGREDIENTS MARKET, BY APPLICATION, 2022–2028 (USD MILLION)
- TABLE 127 NORTH AMERICA: NATURAL PERSONAL CARE INGREDIENTS MARKET, BY APPLICATION, 2017–2021 (TON)
- TABLE 128 NORTH AMERICA: NATURAL PERSONAL CARE INGREDIENTS MARKET, BY APPLICATION, 2022–2028 (TON)
- TABLE 129 NORTH AMERICA: NATURAL PERSONAL CARE INGREDIENTS MARKET, BY COUNTRY, 2017–2021 (USD MILLION)
- TABLE 130 NORTH AMERICA: NATURAL PERSONAL CARE INGREDIENTS MARKET, BY COUNTRY, 2022–2028 (USD MILLION)
- TABLE 131 NORTH AMERICA: NATURAL PERSONAL CARE INGREDIENTS MARKET, BY COUNTRY, 2017–2021 (TON)
- TABLE 132 NORTH AMERICA: NATURAL PERSONAL CARE INGREDIENTS MARKET, BY COUNTRY, 2022–2028 (TON)
- TABLE 133 US: NATURAL PERSONAL CARE INGREDIENTS MARKET, BY APPLICATION, 2017–2021 (USD MILLION)
- TABLE 134 US: NATURAL PERSONAL CARE INGREDIENTS MARKET, BY APPLICATION, 2022–2028 (USD MILLION)
- TABLE 135 US: NATURAL PERSONAL CARE INGREDIENTS MARKET, BY APPLICATION, 2017–2021 (TON)
- TABLE 136 US: NATURAL PERSONAL CARE INGREDIENTS MARKET, BY APPLICATION, 2022–2028 (TON)
- TABLE 137 CANADA: NATURAL PERSONAL CARE INGREDIENTS MARKET, BY APPLICATION, 2017–2021 (USD MILLION)
- TABLE 138 CANADA: NATURAL PERSONAL CARE INGREDIENTS MARKET, BY APPLICATION, 2022–2028 (USD MILLION)
- TABLE 139 CANADA: NATURAL PERSONAL CARE INGREDIENTS MARKET, BY APPLICATION, 2017–2021 (TON)
- TABLE 140 CANADA: NATURAL PERSONAL CARE INGREDIENTS MARKET, BY APPLICATION, 2022–2028 (TON)
- TABLE 141 MEXICO: NATURAL PERSONAL CARE INGREDIENTS MARKET, BY APPLICATION, 2017–2021 (USD MILLION)
- TABLE 142 MEXICO: NATURAL PERSONAL CARE INGREDIENTS MARKET, BY APPLICATION, 2022–2028 (USD MILLION)
- TABLE 143 MEXICO: NATURAL PERSONAL CARE INGREDIENTS MARKET, BY APPLICATION, 2017–2021 (TON)
- TABLE 144 MEXICO: NATURAL PERSONAL CARE INGREDIENTS MARKET, BY APPLICATION, 2022–2028 (TON)
- TABLE 145 EUROPE: NATURAL PERSONAL CARE INGREDIENTS MARKET, BY APPLICATION, 2017–2021 (USD MILLION)
- TABLE 146 EUROPE: NATURAL PERSONAL CARE INGREDIENTS MARKET, BY APPLICATION, 2022–2028 (USD MILLION)
- TABLE 147 EUROPE: NATURAL PERSONAL CARE INGREDIENTS MARKET, BY APPLICATION, 2017–2021 (TON)
- TABLE 148 EUROPE: NATURAL PERSONAL CARE INGREDIENTS MARKET, BY APPLICATION, 2022–2028 (TON)
- TABLE 149 EUROPE: NATURAL PERSONAL CARE INGREDIENTS MARKET, BY COUNTRY, 2017–2021 (USD MILLION)
- TABLE 150 EUROPE: NATURAL PERSONAL CARE INGREDIENTS MARKET, BY COUNTRY, 2022–2028 (USD MILLION)
- TABLE 151 EUROPE: NATURAL PERSONAL CARE INGREDIENTS MARKET, BY COUNTRY, 2017–2021 (TON)
- TABLE 152 EUROPE: NATURAL PERSONAL CARE INGREDIENTS MARKET, BY COUNTRY, 2022–2028 (TON)
- TABLE 153 GERMANY: NATURAL PERSONAL CARE INGREDIENTS MARKET, BY APPLICATION, 2017–2021 (USD MILLION)
- TABLE 154 GERMANY: NATURAL PERSONAL CARE INGREDIENTS MARKET, BY APPLICATION, 2022–2028 (USD MILLION)
- TABLE 155 GERMANY: NATURAL PERSONAL CARE INGREDIENTS MARKET, BY APPLICATION, 2017–2021 (TON)
- TABLE 156 GERMANY: NATURAL PERSONAL CARE INGREDIENTS MARKET, BY APPLICATION, 2022–2028 (TON)
- TABLE 157 FRANCE: NATURAL PERSONAL CARE INGREDIENTS MARKET, BY APPLICATION, 2017–2021 (USD MILLION)
- TABLE 158 FRANCE: NATURAL PERSONAL CARE INGREDIENTS MARKET, BY APPLICATION, 2022–2028 (USD MILLION)
- TABLE 159 FRANCE: NATURAL PERSONAL CARE INGREDIENTS MARKET, BY APPLICATION, 2017–2021 (TON)
- TABLE 160 FRANCE: NATURAL PERSONAL CARE INGREDIENTS MARKET, BY APPLICATION, 2022–2028 (TON)
- TABLE 161 ITALY: NATURAL PERSONAL CARE INGREDIENTS MARKET, BY APPLICATION, 2017–2021 (USD MILLION)
- TABLE 162 ITALY: NATURAL PERSONAL CARE INGREDIENTS MARKET, BY APPLICATION, 2022–2028 (USD MILLION)
- TABLE 163 ITALY: NATURAL PERSONAL CARE INGREDIENTS MARKET, BY APPLICATION, 2017–2021 (TON)
- TABLE 164 ITALY: NATURAL PERSONAL CARE INGREDIENTS MARKET, BY APPLICATION, 2022–2028 (TON)
- TABLE 165 UK: NATURAL PERSONAL CARE INGREDIENTS MARKET, BY APPLICATION, 2017–2021 (USD MILLION)
- TABLE 166 UK: NATURAL PERSONAL CARE INGREDIENTS MARKET, BY APPLICATION, 2022–2028 (USD MILLION)
- TABLE 167 UK: NATURAL PERSONAL CARE INGREDIENTS MARKET, BY APPLICATION, 2017–2021 (TON)
- TABLE 168 UK: NATURAL PERSONAL CARE INGREDIENTS MARKET, BY APPLICATION, 2022–2028 (TON)
- TABLE 169 MIDDLE EAST & AFRICA: NATURAL PERSONAL CARE INGREDIENTS MARKET, BY APPLICATION, 2017–2021 (USD MILLION)
- TABLE 170 MIDDLE EAST & AFRICA: NATURAL PERSONAL CARE INGREDIENTS MARKET, BY APPLICATION, 2022–2028 (USD MILLION)
- TABLE 171 MIDDLE EAST & AFRICA: NATURAL PERSONAL CARE INGREDIENTS MARKET, BY APPLICATION, 2017–2021 (TON)
- TABLE 172 MIDDLE EAST & AFRICA: NATURAL PERSONAL CARE INGREDIENTS MARKET, BY APPLICATION, 2022–2028 (TON)
- TABLE 173 MIDDLE EAST & AFRICA: NATURAL PERSONAL CARE INGREDIENTS MARKET, BY COUNTRY, 2017–2021 (USD MILLION)
- TABLE 174 MIDDLE EAST & AFRICA: NATURAL PERSONAL CARE INGREDIENTS MARKET, BY COUNTRY, 2022–2028 (USD MILLION)
- TABLE 175 MIDDLE EAST & AFRICA: NATURAL PERSONAL CARE INGREDIENTS MARKET, BY COUNTRY, 2017–2021 (TON)
- TABLE 176 MIDDLE EAST & AFRICA: NATURAL PERSONAL CARE INGREDIENTS MARKET, BY COUNTRY, 2022–2028 (TON)
- TABLE 177 SAUDI ARABIA: NATURAL PERSONAL CARE INGREDIENTS MARKET, BY APPLICATION, 2017–2021 (USD MILLION)
- TABLE 178 SAUDI ARABIA: NATURAL PERSONAL CARE INGREDIENTS MARKET, BY APPLICATION, 2022–2028 (USD MILLION)
- TABLE 179 SAUDI ARABIA: NATURAL PERSONAL CARE INGREDIENTS MARKET, BY APPLICATION, 2017–2021 (TON)
- TABLE 180 SAUDI ARABIA: NATURAL PERSONAL CARE INGREDIENTS MARKET, BY APPLICATION, 2022–2028 (TON)
- TABLE 181 EGYPT: NATURAL PERSONAL CARE INGREDIENTS MARKET, BY APPLICATION, 2017–2021 (USD MILLION)
- TABLE 182 EGYPT: NATURAL PERSONAL CARE INGREDIENTS MARKET, BY APPLICATION, 2022–2028 (USD MILLION)
- TABLE 183 EGYPT: NATURAL PERSONAL CARE INGREDIENTS MARKET, BY APPLICATION, 2017–2021 (TON)
- TABLE 184 EGYPT: NATURAL PERSONAL CARE INGREDIENTS MARKET, BY APPLICATION, 2022–2028 (TON)
- TABLE 185 SOUTH AFRICA: NATURAL PERSONAL CARE INGREDIENTS MARKET, BY APPLICATION, 2017–2021 (USD MILLION)
- TABLE 186 SOUTH AFRICA: NATURAL PERSONAL CARE INGREDIENTS MARKET, BY APPLICATION, 2022–2028 (USD MILLION)
- TABLE 187 SOUTH AFRICA: NATURAL PERSONAL CARE INGREDIENTS MARKET, BY APPLICATION, 2017–2021 (TON)
- TABLE 188 SOUTH AFRICA: NATURAL PERSONAL CARE INGREDIENTS MARKET, BY APPLICATION, 2022–2028 (TON)
- TABLE 189 SOUTH AMERICA: NATURAL PERSONAL CARE INGREDIENTS MARKET, BY APPLICATION, 2017–2021 (USD MILLION)
- TABLE 190 SOUTH AMERICA: NATURAL PERSONAL CARE INGREDIENTS MARKET, BY APPLICATION, 2022–2028 (USD MILLION)
- TABLE 191 SOUTH AMERICA: NATURAL PERSONAL CARE INGREDIENTS MARKET, BY APPLICATION, 2017–2021 (TON)
- TABLE 192 SOUTH AMERICA: NATURAL PERSONAL CARE INGREDIENTS MARKET, BY APPLICATION, 2022–2028 (TON)
- TABLE 193 SOUTH AMERICA: NATURAL PERSONAL CARE INGREDIENTS MARKET, BY COUNTRY, 2017–2021 (USD MILLION)
- TABLE 194 SOUTH AMERICA: NATURAL PERSONAL CARE INGREDIENTS MARKET, BY COUNTRY, 2022–2028 (USD MILLION)
- TABLE 195 SOUTH AMERICA: NATURAL PERSONAL CARE INGREDIENTS MARKET, BY COUNTRY, 2017–2021 (TON)
- TABLE 196 SOUTH AMERICA: NATURAL PERSONAL CARE INGREDIENTS MARKET, BY COUNTRY, 2022–2028 (TON)
- TABLE 197 BRAZIL: NATURAL PERSONAL CARE INGREDIENTS MARKET, BY APPLICATION, 2017–2021 (USD MILLION)
- TABLE 198 BRAZIL: NATURAL PERSONAL CARE INGREDIENTS MARKET, BY APPLICATION, 2022–2028 (USD MILLION)
- TABLE 199 BRAZIL: NATURAL PERSONAL CARE INGREDIENTS MARKET, BY APPLICATION, 2017–2021 (TON)
- TABLE 200 BRAZIL: NATURAL PERSONAL CARE INGREDIENTS MARKET, BY APPLICATION, 2022–2028 (TON)
- TABLE 201 ARGENTINA: NATURAL PERSONAL CARE INGREDIENTS MARKET, BY APPLICATION, 2017–2021 (USD MILLION)
- TABLE 202 ARGENTINA: NATURAL PERSONAL CARE INGREDIENTS MARKET, BY APPLICATION, 2022–2028 (USD MILLION)
- TABLE 203 ARGENTINA: NATURAL PERSONAL CARE INGREDIENTS MARKET, BY APPLICATION, 2017–2021 (TON)
- TABLE 204 ARGENTINA: NATURAL PERSONAL CARE INGREDIENTS MARKET, BY APPLICATION, 2022–2028 (TON)
- TABLE 205 OVERVIEW OF STRATEGIES ADOPTED BY KEY NATURAL PERSONAL CARE INGREDIENTS MANUFACTURERS
- TABLE 206 NATURAL PERSONAL CARE INGREDIENTS MARKET: DEGREE OF COMPETITION
- TABLE 207 NATURAL PERSONAL CARE INGREDIENTS MARKET: PRODUCT LAUNCHES, OCTOBER 2020–NOVEMBER 2023
- TABLE 208 NATURAL PERSONAL CARE INGREDIENTS MARKET: DEALS, MARCH 2020-JANUARY 2024
- TABLE 209 NATURAL PERSONAL CARE INGREDIENTS MARKET: OTHER DEVELOPMENTS, MARCH 2020-JANUARY 2024
- TABLE 210 BASF SE: COMPANY OVERVIEW
- TABLE 211 BASF SE: PRODUCTS/SOLUTIONS/SERVICES OFFERINGS
- TABLE 212 BASF SE: DEALS
- TABLE 213 CRODA INTERNATIONAL PLC: COMPANY OVERVIEW
- TABLE 214 CRODA INTERNATIONAL PLC: PRODUCTS/SOLUTIONS/SERVICES OFFERINGS
- TABLE 215 CRODA INTERNATIONAL PLC: DEALS
- TABLE 216 CRODA INTERNATIONAL PLC: EXPANSIONS
- TABLE 217 EVONIK INDUSTRIES AG: COMPANY OVERVIEW
- TABLE 218 EVONIK INDUSTRIES AG: PRODUCTS/SOLUTIONS/SERVICES OFFERINGS
- TABLE 219 EVONIK INDUSTRIES AG: PRODUCT LAUNCHES
- TABLE 220 EVONIK INDUSTRIES AG: DEALS
- TABLE 221 EVONIK INDUSTRIES AG: EXPANSIONS
- TABLE 222 SYMRISE AG: COMPANY OVERVIEW
- TABLE 223 SYMRISE AG: PRODUCTS/SOLUTIONS/SERVICES OFFERINGS
- TABLE 224 SYMRISE AG: DEALS
- TABLE 225 THE LUBRIZOL CORPORATION: COMPANY OVERVIEW
- TABLE 226 THE LUBRIZOL CORPORATION: PRODUCTS/SOLUTIONS/SERVICES OFFERINGS
- TABLE 227 ASHLAND INC.: COMPANY OVERVIEW
- TABLE 228 ASHLAND INC.: PRODUCTS/SOLUTIONS/SERVICES OFFERINGS
- TABLE 229 ASHLAND INC.: PRODUCT LAUNCHES
- TABLE 230 ASHLAND INC.: DEALS
- TABLE 231 CLARIANT AG: COMPANY OVERVIEW
- TABLE 232 CLARIANT AG: PRODUCTS/SOLUTIONS/ SERVICES OFFERINGS
- TABLE 233 CLARIANT AG: PRODUCT LAUNCHES
- TABLE 234 CLARIANT AG: DEALS
- TABLE 235 SYENSQO: COMPANY OVERVIEW
- TABLE 236 SYENSQO: PRODUCTS/SOLUTIONS/ SERVICES OFFERINGS
- TABLE 237 SYENSQO: DEALS
- TABLE 238 SYENSQO: OTHER DEVELOPMENTS
- TABLE 239 AGRANA BETEILIGUNGS-AG: COMPANY OVERVIEW
- TABLE 240 AGRANA BETEILIGUNGS-AG: PRODUCTS/SOLUTIONS/SERVICES OFFERINGS
- TABLE 241 DOW INC.: COMPANY OVERVIEW
- TABLE 242 DOW INC.: PRODUCTS/SOLUTIONS/SERVICES OFFERINGS
- TABLE 243 DOW INC.: PRODUCT LAUNCHES
- TABLE 244 DOW INC.: DEALS
- TABLE 245 GATTEFOSSE SAS: COMPANY OVERVIEW
- TABLE 246 NOURYON: COMPANY OVERVIEW
- TABLE 247 SOLABIA GROUP: COMPANY OVERVIEW
- TABLE 248 ROQUETTE FRERES: COMPANY OVERVIEW
- TABLE 249 GENOMATICA, INC.: COMPANY OVERVIEW
- TABLE 250 COVESTRO: COMPANY OVERVIEW
- TABLE 251 EFP BIOTEK: COMPANY OVERVIEW
- TABLE 252 VIVIMED LABS LTD.: COMPANY OVERVIEW
- TABLE 253 CARGILL, INCORPORATED: COMPANY OVERVIEW
- TABLE 254 SILAB: COMPANY OVERVIEW
- TABLE 255 SEPPIC: COMPANY OVERVIEW
- TABLE 256 ARCHER DANIELS MIDLAND COMPANY: COMPANY OVERVIEW
- TABLE 257 VANTAGE SPECIALTY CHEMICALS: COMPANY OVERVIEW
- TABLE 258 STEPAN COMPANY: COMPANY OVERVIEW
- TABLE 259 ASH INGREDIENTS, INC.: COMPANY OVERVIEW
- TABLE 260 GREEN PRESERVATIVES MARKET, BY REGION, 2017–2021 (KILOTON)
- TABLE 261 GREEN PRESERVATIVES MARKET, BY REGION, 2022–2028 (KILOTON)
- TABLE 262 GREEN PRESERVATIVES MARKET, BY REGION, 2017–2021 (USD MILLION)
- TABLE 263 GREEN PRESERVATIVES MARKET, BY REGION, 2022–2028 (USD MILLION)
- TABLE 264 NORTH AMERICA: GREEN PRESERVATIVES MARKET, BY COUNTRY, 2017–2021 (KILOTON)
- TABLE 265 NORTH AMERICA: GREEN PRESERVATIVES MARKET, BY COUNTRY, 2022–2028 (KILOTON)
- TABLE 266 NORTH AMERICA: GREEN PRESERVATIVES MARKET, BY COUNTRY, 2017–2021 (USD MILLION)
- TABLE 267 NORTH AMERICA: GREEN PRESERVATIVES MARKET, BY COUNTRY, 2022–2028 (USD MILLION)
- TABLE 268 ASIA PACIFIC: GREEN PRESERVATIVES MARKET, BY COUNTRY, 2017–2021 (KILOTON)
- TABLE 269 ASIA PACIFIC: GREEN PRESERVATIVES MARKET, BY COUNTRY, 2022–2028 (KILOTON)
- TABLE 270 ASIA PACIFIC: GREEN PRESERVATIVES MARKET, BY COUNTRY, 2017–2021 (USD MILLION)
- TABLE 271 ASIA PACIFIC: GREEN PRESERVATIVES MARKET, BY COUNTRY, 2022–2028 (USD MILLION)
- TABLE 272 EUROPE: GREEN PRESERVATIVES MARKET, BY COUNTRY, 2017–2021 (KILOTON)
- TABLE 273 EUROPE: GREEN PRESERVATIVES MARKET, BY COUNTRY, 2022–2028 (KILOTON)
- TABLE 274 EUROPE: GREEN PRESERVATIVES MARKET, BY COUNTRY, 2017–2021 (USD MILLION)
- TABLE 275 EUROPE: GREEN PRESERVATIVES MARKET, BY COUNTRY, 2022–2028 (USD MILLION)
- TABLE 276 MIDDLE EAST & AFRICA: GREEN PRESERVATIVES MARKET, BY COUNTRY, 2017–2021 (KILOTON)
- TABLE 277 MIDDLE EAST & AFRICA: GREEN PRESERVATIVES MARKET, BY COUNTRY, 2022–2028 (KILOTON)
- TABLE 278 MIDDLE EAST & AFRICA: GREEN PRESERVATIVES MARKET, BY COUNTRY, 2017–2021 (USD MILLION)
- TABLE 279 MIDDLE EAST & AFRICA: GREEN PRESERVATIVES MARKET, BY COUNTRY, 2022–2028 (USD MILLION)
- TABLE 280 SOUTH AMERICA: GREEN PRESERVATIVES MARKET, BY COUNTRY, 2017–2021 (KILOTON)
- TABLE 281 SOUTH AMERICA: GREEN PRESERVATIVES MARKET, BY COUNTRY, 2022–2028 (KILOTON)
- TABLE 282 SOUTH AMERICA: GREEN PRESERVATIVES MARKET, BY COUNTRY, 2017–2021 (USD MILLION)
- TABLE 283 SOUTH AMERICA: GREEN PRESERVATIVES MARKET, BY COUNTRY, 2022–2028 (USD MILLION)
- FIGURE 1 NATURAL PERSONAL CARE INGREDIENTS MARKET: RESEARCH DESIGN
- FIGURE 2 MARKET SIZE ESTIMATION METHODOLOGY: APPROACH 1 (SUPPLY SIDE): COLLECTIVE SHARE OF COMPANIES
- FIGURE 3 MARKET SIZE ESTIMATION METHODOLOGY: APPROACH 1 BOTTOM-UP (SUPPLY SIDE): COLLECTIVE REVENUE OF ALL PRODUCTS
- FIGURE 4 MARKET SIZE ESTIMATION METHODOLOGY: APPROACH 2 –BOTTOM-UP (DEMAND SIDE): INGREDIENT TYPE
- FIGURE 5 MARKET SIZE ESTIMATION METHODOLOGY: APPROACH 3 –TOP-DOWN
- FIGURE 6 NATURAL PERSONAL CARE INGREDIENTS MARKET: DATA TRIANGULATION
- FIGURE 7 MARKET CAGR PROJECTIONS FROM SUPPLY SIDE
- FIGURE 8 MARKET GROWTH PROJECTIONS FROM DEMAND-SIDE DRIVERS AND OPPORTUNITIES
- FIGURE 9 ACTIVE INGREDIENTS WERE LARGEST INGREDIENT TYPE FOR NATURAL PERSONAL CARE INGREDIENTS MARKET IN 2022
- FIGURE 10 SKIN CARE TO BE LARGEST APPLICATION OF NATURAL PERSONAL CARE INGREDIENTS DURING FORECAST PERIOD
- FIGURE 11 NORTH AMERICA TO REGISTER HIGHEST CAGR DURING FORECAST PERIOD
- FIGURE 12 EUROPE TO LEAD NATURAL PERSONAL CARE INGREDIENTS MARKET DURING FORECAST PERIOD
- FIGURE 13 EUROPE TO LEAD MARKET DURING FORECAST PERIOD
- FIGURE 14 GERMANY ACCOUNTED FOR LARGEST MARKET SHARE IN 2022
- FIGURE 15 SKIN CARE LED NATURAL PERSONAL CARE INGREDIENTS MARKET
- FIGURE 16 GERMANY TO BE FASTEST-GROWING MARKET DURING FORECAST PERIOD
- FIGURE 17 DRIVERS, RESTRAINTS, OPPORTUNITIES, AND CHALLENGES IN NATURAL PERSONAL CARE INGREDIENTS MARKET
- FIGURE 18 ESSENTIAL OIL PRODUCTION IN TOP 10 COUNTRIES
- FIGURE 19 PORTER’S FIVE FORCES ANALYSIS OF NATURAL PERSONAL CARE INGREDIENTS MARKET
- FIGURE 20 NATURAL PERSONAL CARE INGREDIENTS MARKET: SUPPLY CHAIN
- FIGURE 21 NATURAL PERSONAL CARE INGREDIENTS MARKET: FUTURE REVENUE MIX
- FIGURE 22 INFLUENCE OF STAKEHOLDERS ON BUYING PROCESS FOR TOP THREE APPLICATIONS
- FIGURE 23 KEY BUYING CRITERIA FOR TOP THREE APPLICATIONS
- FIGURE 24 AVERAGE SELLING PRICE TREND OF KEY PLAYERS FOR TOP THREE APPLICATIONS
- FIGURE 25 AVERAGE SELLING PRICE TREND OF NATURAL PERSONAL CARE INGREDIENTS, BY REGION, 2021–2028
- FIGURE 26 NATURAL PERSONAL CARE INGREDIENTS IMPORT, BY KEY COUNTRY
- FIGURE 27 NATURAL PERSONAL CARE INGREDIENTS EXPORT, BY KEY COUNTRY
- FIGURE 28 PATENTS REGISTERED IN NATURAL PERSONAL CARE INGREDIENTS, 2012–2023
- FIGURE 29 LIST OF MAJOR PATENTS FOR NATURAL PERSONAL CARE INGREDIENTS
- FIGURE 30 LEGAL STATUS OF PATENTS FILED IN NATURAL PERSONAL CARE INGREDIENTS MARKET
- FIGURE 31 MAXIMUM PATENTS FILED IN JURISDICTION OF US
- FIGURE 32 ACTIVE INGREDIENTS TO LEAD NATURAL PERSONAL CARE INGREDIENTS MARKET DURING FORECAST PERIOD
- FIGURE 33 SKIN CARE APPLICATION TO DOMINATE NATURAL PERSONAL CARE INGREDIENTS MARKET DURING FORECAST PERIOD
- FIGURE 34 NORTH AMERICA TO BE FASTEST-GROWING NATURAL PERSONAL CARE INGREDIENTS MARKET
- FIGURE 35 ASIA PACIFIC: NATURAL PERSONAL CARE INGREDIENTS MARKET SNAPSHOT
- FIGURE 36 NORTH AMERICA: NATURAL PERSONAL CARE INGREDIENTS MARKET SNAPSHOT
- FIGURE 37 EUROPE: NATURAL PERSONAL CARE INGREDIENTS MARKET SNAPSHOT
- FIGURE 38 BASF SE LED NATURAL PERSONAL CARE INGREDIENTS MARKET IN 2022
- FIGURE 39 RANKING OF MAJOR PLAYERS IN NATURAL PERSONAL CARE INGREDIENTS MARKET, 2022
- FIGURE 40 REVENUE ANALYSIS OF KEY COMPANIES IN LAST 5 YEARS
- FIGURE 41 COMPANY EVALUATION MATRIX: KEY PLAYERS, 2022
- FIGURE 42 COMPANY EVALUATION MATRIX: START-UPS/SMES, 2022
- FIGURE 43 COMPANY VALUATION AND FINANCIAL METRICS OF KEY PLAYERS
- FIGURE 44 EV/EBITDA OF KEY PLAYERS
- FIGURE 45 BASF SE: COMPANY SNAPSHOT
- FIGURE 46 CRODA INTERNATIONAL PLC: COMPANY SNAPSHOT
- FIGURE 47 EVONIK INDUSTRIES AG: COMPANY SNAPSHOT
- FIGURE 48 SYMRISE AG: COMPANY SNAPSHOT
- FIGURE 49 ASHLAND INC.: COMPANY SNAPSHOT
- FIGURE 50 CLARIANT AG: COMPANY SNAPSHOT
- FIGURE 51 AGRANA BETEILIGUNGS-AG: COMPANY SNAPSHOT
- FIGURE 52 DOW INC.: COMPANY SNAPSHOT
The study involved four major activities in estimating the market size for natural personal care ingredients market. Exhaustive secondary research was done to collect information on the market, the peer market, and the parent market. The next step was to validate these findings, assumptions, and sizing with industry experts across the value chain through primary research. Both top-down and bottom-up approaches were employed to estimate the complete market size. After that, the market breakdown and data triangulation procedures were used to estimate the market size of the segments and subsegments.
Secondary Research
Secondary sources used in this study included annual reports, press releases, and investor presentations of companies; white papers; certified publications; articles from recognized authors; and gold standard & silver standard websites such as Factiva, ICIS, Bloomberg, and others. The findings of this study were verified through primary research by conducting extensive interviews with key officials such as CEOs, VPs, directors, and other executives. The breakdown of profiles of the primary interviewees is illustrated in the figure below:
Primary Research
The natural personal care ingredients market comprises several stakeholders, such as raw material suppliers, end-product manufacturers, and regulatory organizations in the supply chain. The demand side of this market is characterized by emollients, preservatives, active ingredients, surfactants, rheology modifiers, sugar polymers, and others. The supply side is characterized by advancements in technology and diverse application industries. Various primary sources from both the supply and demand sides of the market were interviewed to obtain qualitative and quantitative information.
Breakdown of Primary Participants
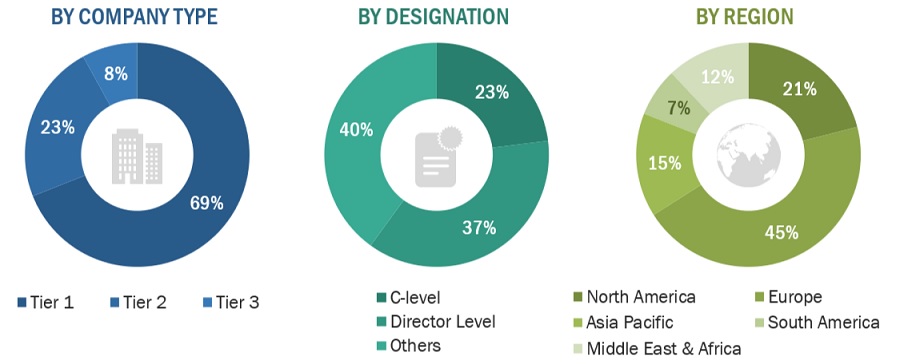
Note: Tier 1, Tier 2, and Tier 3 companies are classified based on their market revenue in 2022, available in the public domain, product portfolios, and geographical presence.
Other designations include consultants and sales, marketing, and procurement managers.
To know about the assumptions considered for the study, download the pdf brochure
COMPANY NAME |
DESIGNATION |
BASF SE |
Senior Manager |
Symrise AG |
Innovation Manager |
Vantage Specialty Chemicals |
Vice-President |
Croda International Plc |
Production Supervisor |
Ashland Inc. |
Sales Manager |
Market Size Estimation
Both top-down and bottom-up approaches were used to estimate and validate the total size of the natural personal care ingredients market. These methods were also used extensively to estimate the size of various subsegments in the market. The research methodology used to estimate the market size includes the following:
- The key players in the industry have been identified through extensive secondary research.
- The supply chain of the industry has been determined through primary and secondary research.
- All percentage shares, splits, and breakdowns have been determined using secondary sources and verified through primary sources.
- All possible parameters that affect the markets covered in this research study have been accounted for, viewed in extensive detail, verified through primary research, and analyzed to obtain the final quantitative and qualitative data.
Natural Personal Care Ingredients Market: Bottom-Up Approach
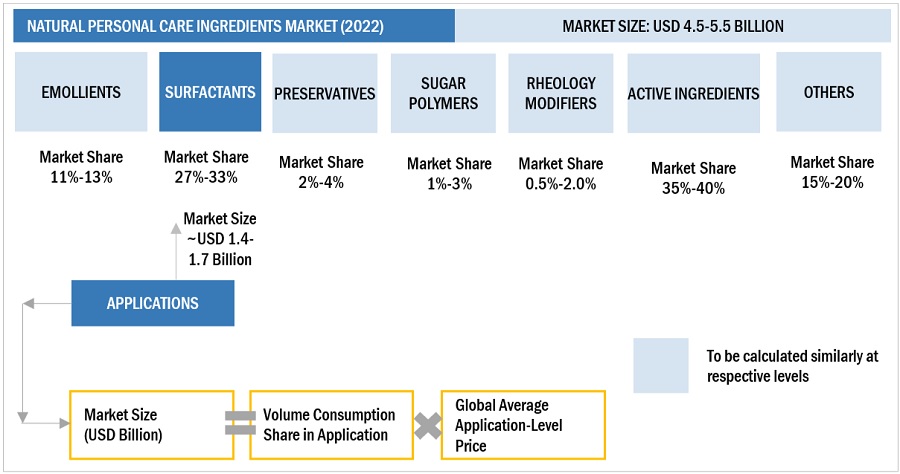
To know about the assumptions considered for the study, Request for Free Sample Report
Natural Personal Care Ingredients Market : Top-Down Approach
Data Triangulation
After arriving at the overall market size—using the market size estimation processes as explained above—the market was split into several segments and subsegments. To complete the overall market engineering process and arrive at the exact statistics of each market segment and subsegment, data triangulation, and market breakdown procedures were employed, wherever applicable. The data was triangulated by studying various factors and trends from both the demand and supply sides in the natural personal care ingredients industry.
Market Definition
natural personal care ingredients as substances sourced from natural origins, such as plants, minerals, or animal-derived materials, that are used in the formulation of personal care products. They are chosen for their perceived benefits, which may include nourishing, hydrating, soothing, or cleansing properties, while aligning with consumer preferences for safer, more environmentally friendly alternatives . Different types of natural ingredients are classified based on their primary function, such as emollients, active ingredients, surfactants, preservatives, and more.
Key Stakeholders
- Natural Personal Care Ingredients manufacturers
- Natural Personal Care Ingredients suppliers
- Raw material suppliers
- Service providers
- Application sector companies
- Government bodies
Report Objectives
- To define, describe, and forecast the Natural Personal Care Ingredients market in terms of value and volume
- To provide detailed information regarding the drivers, opportunities, restraints, and challenges influencing market growth
- To estimate and forecast the market size by type, application, and region
- To forecast the size of the market for five main regions: Asia Pacific, Europe, North America, South America, and the Middle East & Africa, along with their key countries
- To strategically analyze micromarkets1 with respect to their growth trends, prospects, and contribution to the overall market
- To analyze opportunities in the market for stakeholders and provide a competitive landscape for market leaders
- To analyze competitive developments, such as deals and expansions, in the market
- To analyze the impact of the recession on the market
- To analyze the impact of COVID-19 on the market and end-use industries
- To strategically profile key players and comprehensively analyze their growth strategies
Available Customizations
Along with the given market data, MarketsandMarkets offers customizations according to the company’s specific needs. The following customization options are available for the report:
Regional Analysis
- Further breakdown of a region with respect to a particular country or additional application type
Company Information
- Detailed analysis and profiles of additional market players (up to five)
Growth opportunities and latent adjacency in Natural Personal Care Ingredients Market