Microplastic Fillers Market

Microplastic Fillers Market by Type (Polyurethane, Polyethylene), Function (Rheology Modification, Fillers), Form (Powder, Fiber) End-Use Industry (Packaging, Cosmetics & Personal Care, Construction Materials), Region - Global Forecast to 2029

Report Code: CH 9114 Aug, 2024, by marketsandmarkets.com

Microplastic Fillers Market

The global Microplastic Fillers market is valued at USD 3.2 billion in 2024 and is projected to reach USD 3.7 billion by 2029, growing at 3.4% cagr from 2024 to 2029. Microplastic fillers are used in a various industry because they improve product qualities such as durability and flexibility while using a low-cost and lightweight material. Another opportunity in the market is bio-based and biodegradable fillers, driven by the need for sustainability and low carbon footprint. This speciality is expanding as corporations seek eco-friendly alternatives, aided by government requirements and consumer preferences for greener products. Functional fillers, which improve mechanical qualities and increase processing efficiency, have progressively entered the market while lowering costs. Another reason that has lately helped to the expansion of the polypropylene composite market is the progressive increase in the use of microplastics, which improve material qualities in a variety of applications.

Attractive Opportunities in the Microplastic Fillers Market

Microplastic Fillers Market

To know about the assumptions considered for the study, Request for Free Sample Report

Microplastic Fillers Market

Microplastic fillers Market Dynamics

Driver: Driving innovation and differentiation through customizable properties in competitive market.

In a highly competitive market, there is an increasing demand for new and differentiated microplastic fillers. To that purpose, companies are attempting to differentiate and improve their products by utilizing the exceptional capabilities of microplastic fillers. In most situations, these microplastic fillers provide a unique combination of lightness, durability, and flexibility—properties that may be fine-tuned to suit a specific application. This is particularly true for lightweight microplastic fillers used in the automotive and aerospace industries. This means that a large quantity of fuel can be saved because the weights of the parts are significantly reduced, fuel economy is improved, and performance is boosted. Strength and durability of construction materials utilised in the building industries will be improved, giving some competitive advantages in terms of quality and durability. Furthermore, as industries search for eco-friendly and bio-based solutions, microplastic fillers have played an increasingly important part in the drive for sustainability.

Restraint: Growing demand for bio-based fillers

Growing demand for eco-friendly, bio-based fillers is likely to hinder critically the growth of the microplastic fillers market. This has been driven by growing concerns for the environment and requirements for sustainable materials. For example, seed-based fillers are biodegradable and can be produced from industrial waste, like that they offer a feasible, long-term alternative to conventional composites. These materials lower the impact on the environment and become popular in many industries. Moreover, it involves the creation of biological fillers with vinyl acetate copolymer and polyurethane particles that enhances hydrophilicity and durability of composites, hence fast-tracking demands for this green alternative. Natural fillers within rubber-based composites, such as cellulose, chitin, and lignin, offer better material properties and contribute to a circular economy; hence, this aspect remains interesting to industrial players who are concerned about sustainability.

Opportunities: Incorporating recycled microplastic fillers into manufacturing process to promote circular economy

Recycled microplastic fillers provides an important opportunity for the implementation of a circular economy in industrial operations. The most efficient approach to lessen environmental damage is to use plastic wastes as fillers to cut down on the production of virgin plastic. Utilising recycled microplastic fillers will reduce waste and preserve natural resources, fulfilling customer expectations for "green" products and the sustainability agenda. This could further lower material costs and improve the product's marketability by proving that it understands about the environment. Using recycled microplastic fillers allows an organization to meet the demand from society and regulations for greener alternatives while also conducting sustainable manufacturing and leading the way in product development and design innovation. This creates new market opportunities.

Challenges: Proper disposal and recycling of products containing microplastics

Disposal and recycling of products containing microplastic fillers are the major challenges in the microplastic fillers market. Microplastics are tiny plastic particles used as fillers, which are highly difficult to deal with due to their small size and persistence in the environment. Plastic product recycling processes, especially for those products containing microplastic fillers, may inadvertently release microplastics into the environment. It has been reported, for example, that microplastics can be released during the recycling process of PET bottles into both wastewater and sludge, offering a potential environmental risk. Besides, the presence of mixed materials and, accordingly, the difficulty of separation of various components also complicate the recycling of polymer composites.

Microplastic Fillers Market: Ecosystem

Prominent companies in this market include well-established, financially stable manufacturers of microplastic fillers market. These companies have been operating in the market for several years and possess a diversified product portfolio and strong global sales and marketing networks. Prominent companies in this market include BASF SE (Germany), Clariant (Switzerland), Thermo Fisher Scientific Inc. (Waltham), POLYFILL (Vietnam), Composition Materials Co. (Connecticut), Honeywell International Inc. (US), Schilling Ltd. (Spain), Kaimaoxing Cellulose (Shandong) Co., Ltd (China), Precision Drawell Pvt Ltd. (India), and Goonvean Fibres (England).

Microplastic Fillers Market Ecosystem

Based on type, Polypropylene is projected to account for the second largest share of the Microplastic fillers market.

The second largest share of the microplastic fillers market is held by polypropylene, owing to its versatile properties and wide application across various industries. Being a kind of thermoplastic polymer, polypropylene offers an excellent combination of durability and light weight with chemical resistance, which makes it an excellent filler material. Due to its ability to enhance the mechanical properties of the products tensile strength, impact resistance it finds broad uses in industries related to automotive, construction, and consumer goods. Another major reason for prominence in the market is the cost-effectiveness of polypropylene. Compared with other polymer materials, polypropylene produces at a relatively low cost and offers a cheap option to the manufacturer in an attempt to cut down on his production costs while maintaining quality. This economic benefit quite becomes huge when considering large volumes of materials, as witnessed in packaging and automotive industries.

Based on end-use industry, Cosmetics & Personal care is projected to account for the second largest share of the Microplastic fillers market.

Cosmetics and personal care is the second-largest segment in the microplastic fillers market, owing to these materials being highly used to enhance the performance and aesthetics of the product. Most formulae, including creams, lotions, exfoliants, and makeup products, contain microplastic fillers, which help improve the texture and give smooth application to products and enhance their stability, besides acting as exfoliants. What makes them so desirable is that they can provide smoothness, opacity, a silky feel, and especially in foundation products, eyeshadows, and skincare creams. The reason why microplastic fillers dominate this category in these products is because of their versatility during formulation. They can also be designed for definite properties, such as controlled particle size and shape, that are very important to achieve the right consistency and appearance of cosmetic products. This sort of customization enables manufacturers to develop textures varying from matte finishes through luminous glows in order to realize a diversity of consumer needs.

Based on function, Rheology Modification are projected to account for the second largest share of the Microplastic fillers market.

Rheology modification is the second largest segment in the microplastic fillers market, owing to the very essential role it plays in controlling the flow properties of different products. Modifiers of rheology change the thickness and flow characteristics of liquids, gels, and semi-solids. Therefore, they are rather indispensable in paint and coating, cosmetic, pharmaceutical, and food processing industries. These modifiers enhance the performance of the product, resulting in improved texture, stability, and spread ability all issues of consumer and functionality concern. For example, in the paint and coatings industry, rheology modifiers are crucial in achieving and maintaining the desired consistency to ensure products spread uniformly, adhere properly, and assure uniform coverage. This is of particular importance to specialty coatings, where the viscosity has to be controlled very accurately to avoid selected operational difficulties that arise due to possible sagging or running of the applied coating. In this regard, rheology modifiers are applied in the cosmetic industry in the creation of desirable textures for creams, lotions, and gels by improving the sensory experience and making the product feel nice and easy to apply and be absorbed by the skin.

Asia pacific is expected to be the fastest growing region during the forecast period.

Asia pacific has the second-largest market share in the microplastic fillers industry, owing to its emphasis on environmental sustainability, excellent technological capabilities, and supportive legislative frameworks. Rapid industrialization coupled with an increase in plastic consumption and a significant role in global plastic production. It accounts for over 51% of the worldwide capacity of plastics production, mainly fed by competitive labor and production costs. This was the reason for the large diffusion of plastics within many sectors, from packaging to healthcare and consumer goods. This increased use of plastics has increased microplastics, which are small plastic particles resulting from the degradation of larger plastic items or manufactured intentionally for many uses.

Microplastic Fillers Market by Region

To know about the assumptions considered for the study, download the pdf brochure

Microplastic Fillers Market Players

The Microplastic fillers market is dominated by a few major players that have a wide regional presence. The key players in the Microplastic fillers market BASF SE (Germany), Clariant (Switzerland), Thermo Fisher Scientific Inc. (Waltham), POLYFILL (Vietnam), Composition Materials Co. (Connecticut), Honeywell International Inc. (US), Schilling Ltd. (Spain), Kaimaoxing Cellulose (Shandong) Co., Ltd (China), Precision Drawell Pvt Ltd. (India), and Goonvean Fibres (England). In the last few years, the companies have adopted growth strategies such as expansions to capture a larger share of the Microplastic fillers market.

Microplastic Fillers Market Scope

Report Metric

Details

Years considered for the study

2020-2029

Base Year

2023

Forecast period

2024–2029

Units considered

Value (USD Million/Billion)

Segments

 Type, Form, Function, End-Use, and Region

Regions

Asia Pacific, North America, Europe, Middle East & Africa, and South America

Companies

BASF SE (Germany), Clariant (Switzerland), Thermo Fisher Scientific Inc. (Waltham), POLYFILL (Vietnam), Composition Materials Co. (Connecticut), Honeywell International Inc. (US), Schilling Ltd. (Spain), Kaimaoxing Cellulose (Shandong) Co., Ltd (China), Precision Drawell Pvt Ltd. (India), and Goonvean Fibres (England)

This report categorizes the global Microplastic Fillers market based on type, feedstock, application, capacity, and region.

On the basis of Type, the Microplastic Fillers market has been segmented as follows:
  • Polyethylene (PE)
  • Polypropylene (PP)
  • Polyurethane (PU)
  • Others

On the basis of Form, the Microplastic Fillers market has been segmented as follows:

  • Microbeads
  • Powder
  • Fibres
  • Others
On the basis of Function, the Microplastic Fillers market has been segmented as follows:
  • Exfoliation
  • Fillers
  • Rheology Modification
  • Others
On the basis of End-Use, the Microplastic Fillers market has been segmented as follows:
  • Cosmetics & Personal Care
  • Paints & Coatings
  • Industrial Manufacturing
  • Packaging
  • Construction Materials
  • Others
On the basis of region, the Microplastic Fillers market has been segmented as follows:
  • Asia Pacific
  • Europe
  • North America
  • Middle East & Africa
  • South America

Recent Developments

In April 2024,BASF announced its participation in UTECH 2024, where it showcased a range of new, sustainable material developments and recycling solutions. Among the highlights was the introduction of a new mechanically recyclable PU flexible foam designed to support the circular economy.

Frequently Asked Questions (FAQ):

To speak to our analyst for a discussion on the above findings, click Speak to Analyst

TABLE OF CONTENTS
 
1 INTRODUCTION (Page No. - 25)
    1.1 STUDY OBJECTIVES 
    1.2 MARKET DEFINITION 
    1.3 STUDY SCOPE 
           1.3.1 INCLUSIONS & EXCLUSIONS
           1.3.2 YEARS CONSIDERED
           1.3.3 CURRENCY CONSIDERED
           1.3.4 UNITS CONSIDERED
    1.4 LIMITATIONS 
    1.5 STAKEHOLDERS 
 
2 RESEARCH METHODOLOGY (Page No. - 29)
    2.1 RESEARCH DATA 
           2.1.1 SECONDARY DATA
                    2.1.1.1 Key data from secondary sources
           2.1.2 PRIMARY DATA
                    2.1.2.1 Key data from primary sources
                    2.1.2.2 Primary data sources
                    2.1.2.3 Key primary participants
                    2.1.2.4 Breakdown of primary interviews
                    2.1.2.5 Key industry insights
    2.2 BASE NUMBER CALCULATION 
           2.2.1 SUPPLY-SIDE APPROACH
           2.2.2 DEMAND-SIDE APPROACH
    2.3 FORECAST NUMBER CALCULATION 
           2.3.1 SUPPLY SIDE
           2.3.2 DEMAND SIDE
    2.4 MARKET SIZE ESTIMATION 
           2.4.1 BOTTOM-UP APPROACH
           2.4.2 TOP-DOWN APPROACH
    2.5 DATA TRIANGULATION 
    2.6 RESEARCH ASSUMPTIONS 
    2.7 IMPACT OF RECESSION 
    2.8 GROWTH FORECAST 
    2.9 RISK ASSESSMENT 
    2.10 FACTOR ANALYSIS 
 
3 EXECUTIVE SUMMARY (Page No. - 40)
 
4 PREMIUM INSIGHTS (Page No. - 44)
    4.1 ATTRACTIVE OPPORTUNITIES FOR PLAYERS IN MICROPLASTIC FILLERS MARKET 
    4.2 MICROPLASTIC FILLERS MARKET, BY TYPE 
    4.3 MICROPLASTIC FILLERS MARKET, END-USE INDUSTRIES 
    4.4 MICROPLASTIC FILLERS MARKET, BY COUNTRY 
 
5 MARKET OVERVIEW (Page No. - 46)
    5.1 INTRODUCTION 
    5.2 MARKET DYNAMICS 
           5.2.1 DRIVERS
                    5.2.1.1 Growing demand in automotive, packaging, construction, and electronics industries due to their versatility and performance
                    5.2.1.2 Cost-effective solution compared to natural alternatives
                    5.2.1.3 Driving innovation and differentiation through customizable properties in competitive market
           5.2.2 RESTRAINTS
                    5.2.2.1 Growing demand for eco-friendly/bio-based fillers
           5.2.3 OPPORTUNITIES
                    5.2.3.1 Incorporating recycled microplastic fillers into manufacturing process to promote circular economy
           5.2.4 CHALLENGES
                    5.2.4.1 Proper disposal and recycling of products containing microplastics
    5.3 IMPACT OF GENERATIVE AI 
           5.3.1 INTRODUCTION
    5.4 IMPACT OF GENERATIVE AI ON MICROPLASTIC FILLERS MARKET 
 
6 INDUSTRY TRENDS (Page No. - 51)
    6.1 INTRODUCTION 
    6.2 TRENDS/DISRUPTIONS IMPACTING CUSTOMER BUSINESS 
           6.2.1 REVENUE SHIFTS AND NEW REVENUE POCKETS FOR MICROPLASTIC FILLER MANUFACTURER
    6.3 SUPPLY CHAIN ANALYSIS 
           6.3.1 RAW MATERIAL SUPPLIERS
           6.3.2 MANUFACTURERS
           6.3.3 DISTRIBUTION
           6.3.4 END USERS/CONSUMERS
    6.4 INVESTMENT AND FUNDING SCENARIO 
    6.5 PRICING ANALYSIS 
           6.5.1 AVERAGE SELLING PRICE TREND, BY REGION
           6.5.2 AVERAGE SELLING PRICE TREND, BY TYPE
           6.5.3 AVERAGE SELLING PRICE TREND OF KEY PLAYERS, BY TYPE
    6.6 ECOSYSTEM ANALYSIS 
    6.7 TECHNOLOGY ANALYSIS 
           6.7.1 KEY TECHNOLOGIES
           6.7.2 COMPLEMENTARY TECHNOLOGIES
           6.7.3 ADJACENT TECHNOLOGIES
    6.8 PATENT ANALYSIS 
           6.8.1 METHODOLOGY
           6.8.2 GRANTED PATENTS, 2013–2023
                    6.8.2.1 Patent publication trends, 2013–2023
           6.8.3 INSIGHTS
           6.8.4 LEGAL STATUS
           6.8.5 JURISDICTION ANALYSIS
           6.8.6 TOP APPLICANTS
           6.8.7 KEY PATENTS RELATED TO MICROPLASTIC FILLERS TECHNOLOGY
    6.9 TRADE ANALYSIS 
           6.9.1 IMPORT SCENARIO (HS CODE 39019090)
           6.9.2 EXPORT SCENARIO (HS CODE 39019090)
    6.10 KEY CONFERENCES AND EVENTS, 2024–2025 
    6.11 TARIFF AND REGULATORY LANDSCAPE 
           6.11.1 TARIFF ANALYSIS
           6.11.2 REGULATORY BODIES, GOVERNMENT AGENCIES, AND OTHER ORGANIZATIONS
           6.11.3 REGULATIONS AND STANDARDS
    6.12 PORTER’S FIVE FORCES ANALYSIS 
           6.12.1 THREAT OF NEW ENTRANTS
           6.12.2 THREAT OF SUBSTITUTES
           6.12.3 BARGAINING POWER OF SUPPLIERS
           6.12.4 BARGAINING POWER OF BUYERS
           6.12.5 INTENSITY OF COMPETITIVE RIVALRY
    6.13 KEY STAKEHOLDERS AND BUYING CRITERIA 
           6.13.1 KEY STAKEHOLDERS IN BUYING PROCESS
           6.13.2 BUYING CRITERIA
    6.14 MACROECONOMIC INDICATORS 
           6.14.1 GDP TRENDS AND FORECASTS, BY COUNTRY
    6.15 CASE STUDY ANALYSIS 
           6.15.1 EFFECT OF MINERAL FILLERS ON MECHANICAL PROPERTIES OF COMMERCIALLY AVAILABLE BIODEGRADABLE POLYMERS
           6.15.2 EFFECT OF SINGLE-MINERAL FILLER AND HYBRID-MINERAL FILLER ADDITIVES ON THE PROPERTIES OF POLYPROPYLENE COMPOSITES
 
7 MICROPLASTIC FILLERS MARKET, BY TYPE (Page No. - 76)
    7.1 INTRODUCTION 
    7.2 POLYETHYLENE (PE) 
           7.2.1 ELEVATING PACKAGING AND INFRASTRUCTURE DURABILITY
    7.3 POLYPROPYLENE (PP) 
           7.3.1 ENHANCING DURABILITY AND EFFICIENCY ACROSS DIVERSE PRODUCT CATEGORIES
    7.4 POLYURETHANE (PU) 
           7.4.1 VERSATILE ADDITIVES FORTIFYING CONSTRUCTION, COATINGS, AND INDUSTRIAL APPLICATIONS
    7.5 OTHERS 
           7.5.1 POLYSTYRENE
           7.5.2 POLYCARBONATE
 
8 MICROPLASTIC FILLERS MARKET, BY FORM (Page No. - 81)
    8.1 INTRODUCTION 
    8.2 MICROBEADS 
           8.2.1 VERSATILE ADDITIVES ENHANCING INDUSTRIAL PRODUCTS AND COSMETICS
    8.3 POWDER 
           8.3.1 MULTIFUNCTIONAL FILLERS IMPROVING MATERIAL PROPERTIES ACROSS INDUSTRIES
    8.4 FIBERS 
           8.4.1 ADAPTABLE REINFORCEMENTS ENHANCING TEXTILES, CONSTRUCTION, AND INDUSTRIAL APPLICATIONS
    8.5 OTHER FORMS 
           8.5.1 PARTICLES
           8.5.2 SPHERES
           8.5.3 FRAGMENTS
 
9 MICROPLASTIC FILLERS MARKET, BY FUNCTION (Page No. - 86)
    9.1 INTRODUCTION 
    9.2 EXFOLIATION 
           9.2.1 ENHANCING SURFACE AREA AND DISPERSION
    9.3 FILLERS 
           9.3.1 REINFORCE MECHANICAL PROPERTIES OF COMPOSITE MATERIALS
    9.4 RHEOLOGY MODIFICATION 
           9.4.1 ENHANCING FUNCTIONAL PERFORMANCE IN MICROPLASTIC FILLERS
    9.5 BULKING 
           9.5.1 ENHANCED THERMAL INSULATION AND IMPACT RESISTANCE
    9.6 OTHER FUNCTIONS 
           9.6.1 FLAME RETARDANCY
           9.6.2 BIODEGRADABILITY ENHANCEMENT
 
10 MICROPLASTIC FILLERS MARKET, END-USE INDUSTRIES (Page No. - 91)
     10.1 INTRODUCTION 
     10.2 COSMETICS & PERSONAL CARE 
             10.2.1 IMPROVE TEXTURE, STABILITY, AND ESTHETIC QUALITY OF PRODUCTS
     10.3 CONSTRUCTION MATERIALS 
             10.3.1 CONSTRUCTION MATERIALS REINFORCING STRUCTURAL INTEGRITY
     10.4 PAINTS & COATINGS 
             10.4.1 ENHANCE HARDNESS AND ABRASION RESISTANCE OF PAINT
     10.5 PACKAGING 
             10.5.1 IMPROVE MATERIAL EFFICIENCY
     10.6 INDUSTRIAL MANUFACTURING 
             10.6.1 ENHANCE COMPONENT DURABILITY AND PRECISION IN INDUSTRIAL MANUFACTURING SECTOR
     10.7 OTHER END-USE INDUSTRIES 
             10.7.1 AUTOMOTIVE
             10.7.2 TEXTILE
 
11 MICROPLASTIC FILLERS MARKET, BY REGION (Page No. - 97)
     11.1 INTRODUCTION 
     11.2 ASIA PACIFIC 
             11.2.1 CHINA
                        11.2.1.1 Rapid urbanization and construction boom
             11.2.2 JAPAN
                        11.2.2.1 Strong automotive sector and high-quality plastic components
             11.2.3 INDIA
                        11.2.3.1 Large-scale infrastructure projects driving demand for durable and lightweight construction materials
             11.2.4 SOUTH KOREA
                        11.2.4.1 Significant investment in R&D for advanced materials
             11.2.5 REST OF ASIA PACIFIC
     11.3 NORTH AMERICA 
             11.3.1 US
                        11.3.1.1 Strong emphasis on advanced manufacturing techniques and material science
             11.3.2 CANADA
                        11.3.2.1 Enhanced material compatibility with microplastic fillers
             11.3.3 MEXICO
                        11.3.3.1 Emergence as manufacturing hub
     11.4 EUROPE 
             11.4.1 GERMANY
                        11.4.1.1 Growing use in automotive sector for strong, lightweight materials
             11.4.2 ITALY
                        11.4.2.1 Growing demand for durable and innovative materials in furniture design
             11.4.3 FRANCE
                        11.4.3.1 Demand for high-quality, durable materials in luxury products
             11.4.4 UK
                        11.4.4.1 Demand for advanced packaging solutions
             11.4.5 SPAIN
                        11.4.5.1 Increased demand for durable and weather-resistant architectural paints
             11.4.6 RUSSIA
                        11.4.6.1 Growing application of microplastic fillers in industrial and heavy-duty textiles
             11.4.7 REST OF EUROPE
     11.5 MIDDLE EAST & AFRICA 
             11.5.1 GCC COUNTRIES
                        11.5.1.1 Saudi Arabia
                                     11.5.1.1.1 Massive construction boom and industrial growth
                        11.5.1.2 UAE
                                     11.5.1.2.1 Strategic location and economic diversification
                        11.5.1.3 Rest of GCC countries
             11.5.2 SOUTH AFRICA
                        11.5.2.1 Investment in infrastructure development
             11.5.3 REST OF MIDDLE EAST & AFRICA
     11.6 SOUTH AMERICA 
             11.6.1 ARGENTINA
                        11.6.1.1 Innovation in paints and coatings industry
             11.6.2 BRAZIL
                        11.6.2.1 Availability of raw material and strong supply chain
             11.6.3 REST OF SOUTH AMERICA
 
12 COMPETITIVE LANDSCAPE (Page No. - 174)
     12.1 INTRODUCTION 
     12.2 KEY PLAYER STRATEGIES/RIGHT TO WIN 
     12.3 MARKET SHARE ANALYSIS 
             12.3.1 MARKET SHARE OF KEY PLAYERS
     12.4 REVENUE ANALYSIS 
     12.5 BRAND/PRODUCT COMPARATIVE ANALYSIS 
     12.6 COMPANY EVALUATION MATRIX, KEY PLAYERS, 2023 
             12.6.1 STARS
             12.6.2 EMERGING LEADERS
             12.6.3 PERVASIVE PLAYERS
             12.6.4 PARTICIPANTS
             12.6.5 COMPANY FOOTPRINT
     12.7 COMPANY EVALUATION MATRIX, STARTUP/SMES, 2023 
             12.7.1 PROGRESSIVE COMPANIES
             12.7.2 RESPONSIVE COMPANIES
             12.7.3 DYNAMIC COMPANIES
             12.7.4 STARTING BLOCKS
             12.7.5 COMPETITIVE BENCHMARKING
                        12.7.5.1 Detailed list of key startups/SMEs
                        12.7.5.2 Competitive benchmarking of key start-ups/SMEs
             12.7.6 VALUATION AND FINANCIAL METRICS OF KEY MICROPLASTIC FILLERS VENDORS
     12.8 COMPETITIVE SCENARIO AND TRENDS 
             12.8.1 OTHERS
 
13 COMPANY PROFILES (Page No. - 189)
     13.1 KEY PLAYERS 
             13.1.1 BASF SE
                        13.1.1.1 Business overview
                        13.1.1.2 Products/Solutions/Services offered
                        13.1.1.3 Recent developments
                                     13.1.1.3.1 Others
                        13.1.1.4 MnM view
                                     13.1.1.4.1 Key strengths
                                     13.1.1.4.2 Strategic choices
                                     13.1.1.4.3 Weaknesses and competitive threats
             13.1.2 CLARIANT
                        13.1.2.1 Business overview
                        13.1.2.2 Products/Solutions/Services offered
                        13.1.2.3 MnM view
                                     13.1.2.3.1 Key strengths
                                     13.1.2.3.2 Strategic choices
                                     13.1.2.3.3 Weaknesses and competitive threats
             13.1.3 THERMO FISHER SCIENTIFIC INC.
                        13.1.3.1 Business overview
                        13.1.3.2 Products/Solutions/Services offered
                        13.1.3.3 MnM view
                                     13.1.3.3.1 Key strengths
                                     13.1.3.3.2 Strategic choices
                                     13.1.3.3.3 Weaknesses and competitive threats
             13.1.4 POLYFILL
                        13.1.4.1 Business overview
                        13.1.4.2 Products/Solutions/Services offered
                        13.1.4.3 MnM view
                                     13.1.4.3.1 Key strengths
                                     13.1.4.3.2 Strategic choices
                                     13.1.4.3.3 Weaknesses and competitive threats
             13.1.5 COMPOSITION MATERIALS CO.
                        13.1.5.1 Business overview
                        13.1.5.2 Products/Solutions/Services offered
                        13.1.5.3 MnM view
                                     13.1.5.3.1 Key strengths
                                     13.1.5.3.2 Strategic choices
                                     13.1.5.3.3 Weaknesses and competitive threats
             13.1.6 HONEYWELL INTERNATIONAL INC.
                        13.1.6.1 Business overview
                        13.1.6.2 Products/Solutions/Services offered
                        13.1.6.3 MnM view
                                     13.1.6.3.1 Key strengths
                                     13.1.6.3.2 Strategic choices
                                     13.1.6.3.3 Weaknesses and competitive threats
             13.1.7 SCHILLING LTD.
                        13.1.7.1 Business overview
                        13.1.7.2 Products/Solutions/Services offered
                        13.1.7.3 MnM view
                                     13.1.7.3.1 Key strengths
                                     13.1.7.3.2 Strategic choices
                                     13.1.7.3.3 Weaknesses and competitive threats
             13.1.8 KAIMAOXING CELLULOSE (SHANDONG) CO., LTD
                        13.1.8.1 Business overview
                        13.1.8.2 Products/Services/Solutions offered
                        13.1.8.3 MnM view
                                     13.1.8.3.1 Key strengths
                                     13.1.8.3.2 Strategic choices
                                     13.1.8.3.3 Weaknesses and competitive threats
             13.1.9 PRECISION DRAWELL PVT LTD.
                        13.1.9.1 Business overview
                        13.1.9.2 Products/Services/Solutions offered
                        13.1.9.3 MnM view
                                     13.1.9.3.1 Key strengths
                                     13.1.9.3.2 Strategic choices
                                     13.1.9.3.3 Weaknesses and competitive threats
             13.1.10 GOONVEAN FIBRES LTD
                        13.1.10.1 Business overview
                        13.1.10.2 Products/Services/Solutions offered
                        13.1.10.3 MnM view
                                     13.1.10.3.1 Key strengths
                                     13.1.10.3.2 Strategic choices
                                     13.1.10.3.3 Weaknesses and competitive threats
     13.2 OTHER PLAYERS 
             13.2.1 SIBELCO
             13.2.2 SH MINERALS GMBH
             13.2.3 CLADES COMPOSITES
             13.2.4 IMERYS
             13.2.5 LKAB MINERALS
             13.2.6 OMYA INTERNATIONAL AG
             13.2.7 COVIA HOLDINGS LLC
             13.2.8 STOCKMEIER GROUP
             13.2.9 QUARZWERKE GMBH
             13.2.10 20 MICRONS
 
14 APPENDIX (Page No. - 221)
     14.1 DISCUSSION GUIDE 
     14.2 KNOWLEDGESTORE: MARKETSANDMARKETS’ SUBSCRIPTION PORTAL 
     14.3 CUSTOMIZATION OPTIONS 
     14.4 RELATED REPORTS 
     14.5 AUTHOR DETAILS 
 
 
LIST OF TABLES (262 TABLES)
 
TABLE 1 AVERAGE SELLING PRICE OF MICROPLASTIC FILLERS, BY REGION, 2020–2023 (USD/TON)
TABLE 2 AVERAGE SELLING PRICE TREND OF MICROPLASTIC FILLERS, BY TYPE, 2020–2023 (USD/TON)
TABLE 3 AVERAGE SELLING PRICE TREND OF MICROPLASTIC FILLERS OFFERED BY KEY PLAYERS, BY TYPE (USD/TON)
TABLE 4 ROLE OF COMPANIES IN ECOSYSTEM
TABLE 5 KEY TECHNOLOGIES
TABLE 6 COMPLEMENTARY TECHNOLOGIES
TABLE 7 ADJACENT TECHNOLOGIES
TABLE 8 TOTAL NUMBER OF PATENTS, 2013–2023
TABLE 9 TOP OWNERS OF PATENTS RELATED TO MICROPLASTIC FILLER TECHNOLOGY
TABLE 10 MICROPLASTIC FILLERS TECHNOLOGY-RELATED KEY PATENTS
TABLE 11 MICROPLASTIC FILLERS MARKET: KEY CONFERENCES AND EVENTS, 2024–2025
TABLE 12 TARIFF FOR HS CODE 39019090 - COMPLIANT PRODUCTS, BY COUNTRY (2023)
TABLE 13 NORTH AMERICA: REGULATORY BODIES, GOVERNMENT AGENCIES, AND OTHER ORGANIZATIONS
TABLE 14 EUROPE: REGULATORY BODIES, GOVERNMENT AGENCIES, AND OTHER ORGANIZATIONS
TABLE 15 ASIA PACIFIC: REGULATORY BODIES, GOVERNMENT AGENCIES, AND OTHER ORGANIZATIONS
TABLE 16 MIDDLE EAST & AFRICA: REGULATORY BODIES, GOVERNMENT AGENCIES, AND OTHER ORGANIZATIONS
TABLE 17 SOUTH AMERICA: REGULATORY BODIES, GOVERNMENT AGENCIES, AND OTHER ORGANIZATIONS
TABLE 18 REGULATIONS AND STANDARDS FOR PLAYERS IN MICROPLASTIC FILLERS MARKET
TABLE 19 IMPACT OF PORTER’S FIVE FORCES ON MICROPLASTIC FILLERS MARKET
TABLE 20 INFLUENCE OF STAKEHOLDERS ON BUYING PROCESS FOR APPLICATIONS
TABLE 21 KEY BUYING CRITERIA FOR APPLICATIONS
TABLE 22 GDP TRENDS AND FORECASTS, BY COUNTRY, 2020–2029 (USD MILLION)
TABLE 23 MICROPLASTIC FILLERS MARKET, BY TYPE, 2020–2023 (USD MILLION)
TABLE 24 MICROPLASTIC FILLERS MARKET, BY TYPE, 2024–2029 (USD MILLION)
TABLE 25 MICROPLASTIC FILLERS MARKET, BY TYPE, 2020–2023 (TONS)
TABLE 26 MICROPLASTIC FILLERS MARKET, BY TYPE, 2024–2029 (TONS)
TABLE 27 MICROPLASTIC FILLERS MARKET, BY FORM, 2020–2023 (USD MILLION)
TABLE 28 MICROPLASTIC FILLERS MARKET, BY FORM, 2024–2029 (USD MILLION)
TABLE 29 MICROPLASTIC FILLERS MARKET, BY FUNCTION, 2020–2023 (USD MILLION)
TABLE 30 MICROPLASTIC FILLERS MARKET, BY FUNCTION, 2024–2029 (USD MILLION)
TABLE 31 MICROPLASTIC FILLERS MARKET, END-USE INDUSTRIES, 2020–2023 (USD MILLION)
TABLE 32 MICROPLASTIC FILLERS MARKET, END-USE INDUSTRIES, 2024–2029 (USD MILLION)
TABLE 33 MICROPLASTIC FILLERS MARKET, END-USE INDUSTRIES, 2020–2023 (TONS)
TABLE 34 MICROPLASTIC FILLERS MARKET, END-USE INDUSTRIES, 2024–2029 (TONS)
TABLE 35 MICROPLASTIC FILLERS MARKET, BY REGION, 2020–2023 (USD MILLION)
TABLE 36 MICROPLASTIC FILLERS MARKET, BY REGION, 2024–2029 (USD MILLION)
TABLE 37 MICROPLASTIC FILLERS MARKET, BY REGION, 2020–2023 (TONS)
TABLE 38 MICROPLASTIC FILLERS MARKET, BY REGION, 2024–2029 (TONS)
TABLE 39 MICROPLASTIC FILLERS MARKET, BY TYPE, 2020–2023 (USD MILLION)
TABLE 40 MICROPLASTIC FILLERS MARKET, BY TYPE, 2024–2029 (USD MILLION)
TABLE 41 MICROPLASTIC FILLERS MARKET, BY TYPE, 2020–2023 (TONS)
TABLE 42 MICROPLASTIC FILLERS MARKET, BY TYPE, 2024–2029 (TONS)
TABLE 43 MICROPLASTIC FILLERS MARKET, BY FORM, 2020–2023 (USD MILLION)
TABLE 44 MICROPLASTIC FILLERS MARKET, BY FORM, 2024–2029 (USD MILLION)
TABLE 45 MICROPLASTIC FILLERS MARKET, BY FUNCTION, 2020–2023 (USD MILLION)
TABLE 46 MICROPLASTIC FILLERS MARKET, BY FUNCTION, 2024–2029 (USD MILLION)
TABLE 47 MICROPLASTIC FILLERS MARKET, BY END-USE INDUSTRIES, 2020–2023 (USD MILLION)
TABLE 48 MICROPLASTIC FILLERS MARKET, BY END-USE INDUSTRIES, 2024–2029 (USD MILLION)
TABLE 49 MICROPLASTIC FILLERS MARKET, BY END-USE INDUSTRIES, 2020–2023 (TONS)
TABLE 50 MICROPLASTIC FILLERS MARKET, BY END-USE INDUSTRIES, 2024–2029 (TONS)
TABLE 51 ASIA PACIFIC: MICROPLASTIC FILLERS MARKET, BY COUNTRY, 2020–2023 (USD MILLION)
TABLE 52 ASIA PACIFIC: MICROPLASTIC FILLERS MARKET, BY COUNTRY, 2024–2029 (USD MILLION)
TABLE 53 ASIA PACIFIC: MICROPLASTIC FILLERS MARKET, BY COUNTRY, 2020–2023 (TONS)
TABLE 54 ASIA PACIFIC: MICROPLASTIC FILLERS MARKET, BY COUNTRY, 2024–2029 (TONS)
TABLE 55 ASIA PACIFIC: MICROPLASTIC FILLERS MARKET, BY TYPE, 2020–2023 (USD MILLION)
TABLE 56 ASIA PACIFIC: MICROPLASTIC FILLERS MARKET, BY TYPE, 2024–2029 (USD MILLION)
TABLE 57 ASIA PACIFIC: MICROPLASTIC FILLERS MARKET, BY TYPE, 2020–2023 (TONS)
TABLE 58 ASIA PACIFIC: MICROPLASTIC FILLERS MARKET, BY TYPE, 2024–2029 (TONS)
TABLE 59 ASIA PACIFIC: MICROPLASTIC FILLERS MARKET, FORM, 2020–2023 (USD MILLION)
TABLE 60 ASIA PACIFIC: MICROPLASTIC FILLERS MARKET, BY FORM, 2024–2029 (USD MILLION)
TABLE 61 ASIA PACIFIC: MICROPLASTIC FILLERS MARKET, BY FUNCTION, 2020–2023 (USD MILLION)
TABLE 62 ASIA PACIFIC: MICROPLASTIC FILLERS MARKET, BY FUNCTION, 2024–2029 (USD MILLION)
TABLE 63 ASIA PACIFIC: MICROPLASTIC FILLERS MARKET, BY END-USE INDUSTRIES, 2020–2023 (USD MILLION)
TABLE 64 ASIA PACIFIC: MICROPLASTIC FILLERS MARKET, BY END-USE INDUSTRIES, 2024–2029 (USD MILLION)
TABLE 65 ASIA PACIFIC: MICROPLASTIC FILLERS MARKET, BY END-USE INDUSTRIES, 2020–2023 (TONS)
TABLE 66 ASIA PACIFIC: MICROPLASTIC FILLERS MARKET, BY END-USE INDUSTRIES, 2024–2029 (TONS)
TABLE 67 CHINA: MICROPLASTIC FILLERS MARKET, BY END-USE INDUSTRIES, 2020–2023 (USD MILLION)
TABLE 68 CHINA: MICROPLASTIC FILLERS MARKET, BY END-USE INDUSTRIES, 2024–2029 (USD MILLION)
TABLE 69 CHINA: MICROPLASTIC FILLERS MARKET, BY END-USE INDUSTRIES, 2020–2023 (TONS)
TABLE 70 CHINA: MICROPLASTIC FILLERS MARKET, BY END-USE INDUSTRIES, 2024–2029 (TONS)
TABLE 71 JAPAN: MICROPLASTIC FILLERS MARKET, BY END-USE INDUSTRIES, 2020–2023 (USD MILLION)
TABLE 72 JAPAN: MICROPLASTIC FILLERS MARKET, BY END-USE INDUSTRIES, 2024–2029 (USD MILLION)
TABLE 73 JAPAN: MICROPLASTIC FILLERS MARKET, BY END-USE INDUSTRIES, 2020–2023 (TONS)
TABLE 74 JAPAN: MICROPLASTIC FILLERS MARKET, BY END-USE INDUSTRIES, 2024–2029 (TONS)
TABLE 75 INDIA: MICROPLASTIC FILLERS MARKET, BY END-USE INDUSTRIES, 2020–2023 (USD MILLION)
TABLE 76 INDIA: MICROPLASTIC FILLERS MARKET, BY END-USE INDUSTRIES, 2024–2029 (USD MILLION)
TABLE 77 INDIA: MICROPLASTIC FILLERS MARKET, BY END-USE INDUSTRIES, 2020–2023 (TONS)
TABLE 78 INDIA: MICROPLASTIC FILLERS MARKET, BY END-USE INDUSTRIES, 2024–2029 (TONS)
TABLE 79 SOUTH KOREA: MICROPLASTIC FILLERS MARKET, BY END-USE INDUSTRIES, 2020–2023 (USD MILLION)
TABLE 80 SOUTH KOREA: MICROPLASTIC FILLERS MARKET, BY END-USE INDUSTRIES, 2024–2029 (USD MILLION)
TABLE 81 SOUTH KOREA: MICROPLASTIC FILLERS MARKET, BY END-USE INDUSTRIES, 2020–2023 (TONS)
TABLE 82 SOUTH KOREA: MICROPLASTIC FILLERS MARKET, BY END-USE INDUSTRIES, 2024–2029 (TONS)
TABLE 83 REST OF ASIA PACIFIC: MICROPLASTIC FILLERS MARKET, BY END-USE INDUSTRIES, 2020–2023 (USD MILLION)
TABLE 84 REST OF ASIA PACIFIC: MICROPLASTIC FILLERS MARKET, BY END-USE INDUSTRIES, 2024–2029 (USD MILLION)
TABLE 85 REST OF ASIA PACIFIC: MICROPLASTIC FILLERS MARKET, BY END-USE INDUSTRIES, 2020–2023 (TONS)
TABLE 86 REST OF ASIA PACIFIC: MICROPLASTIC FILLERS MARKET, BY END-USE INDUSTRIES, 2024–2029 (TONS)
TABLE 87 NORTH AMERICA: MICROPLASTIC FILLERS MARKET, BY COUNTRY, 2020–2023 (USD MILLION)
TABLE 88 NORTH AMERICA: MICROPLASTIC FILLERS MARKET, BY COUNTRY, 2024–2029 (USD MILLION)
TABLE 89 NORTH AMERICA: MICROPLASTIC FILLERS MARKET, BY COUNTRY, 2020–2023 (TONS)
TABLE 90 NORTH AMERICA: MICROPLASTIC FILLERS MARKET, BY COUNTRY, 2024–2029 (TONS)
TABLE 91 NORTH AMERICA: MICROPLASTIC FILLERS MARKET, BY TYPE, 2020–2023 (USD MILLION)
TABLE 92 NORTH AMERICA: MICROPLASTIC FILLERS MARKET, BY TYPE, 2024–2029 (USD MILLION)
TABLE 93 NORTH AMERICA: MICROPLASTIC FILLERS MARKET, BY TYPE, 2020–2023 (TONS)
TABLE 94 NORTH AMERICA: MICROPLASTIC FILLERS MARKET, BY TYPE, 2024–2029 (TONS)
TABLE 95 NORTH AMERICA: MICROPLASTIC FILLERS MARKET, BY FORM, 2020–2023 (USD MILLION)
TABLE 96 NORTH AMERICA: MICROPLASTIC FILLERS MARKET, BY FORM, 2024–2029 (USD MILLION)
TABLE 97 NORTH AMERICA: MICROPLASTIC FILLERS MARKET, BY FUNCTION, 2020–2023 (USD MILLION)
TABLE 98 NORTH AMERICA: MICROPLASTIC FILLERS MARKET, BY FUNCTION, 2024–2029 (USD MILLION)
TABLE 99 NORTH AMERICA: MICROPLASTIC FILLERS MARKET, BY END-USE INDUSTRIES, 2020–2023 (USD MILLION)
TABLE 100 NORTH AMERICA: MICROPLASTIC FILLERS MARKET, BY END-USE INDUSTRIES, 2024–2029 (USD MILLION)
TABLE 101 NORTH AMERICA: MICROPLASTIC FILLERS MARKET, BY END-USE INDUSTRIES, 2020–2023 (TONS)
TABLE 102 NORTH AMERICA: MICROPLASTIC FILLERS MARKET, BY END-USE INDUSTRIES, 2024–2029 (TONS)
TABLE 103 US: MICROPLASTIC FILLERS MARKET, BY END-USE INDUSTRIES, 2020–2023 (USD MILLION)
TABLE 104 US: MICROPLASTIC FILLERS MARKET, BY END-USE INDUSTRIES, 2024–2029 (USD MILLION)
TABLE 105 US: MICROPLASTIC FILLERS MARKET, BY END-USE INDUSTRIES, 2020–2023 (TONS)
TABLE 106 US: MICROPLASTIC FILLERS MARKET, BY END-USE INDUSTRIES, 2024–2029 (TONS)
TABLE 107 CANADA: MICROPLASTIC FILLERS MARKET, BY END-USE INDUSTRIES, 2020–2023 (USD MILLION)
TABLE 108 CANADA: MICROPLASTIC FILLERS MARKET, BY END-USE INDUSTRIES, 2024–2029 (USD MILLION)
TABLE 109 CANADA: MICROPLASTIC FILLERS MARKET, BY END-USE INDUSTRIES, 2020–2023 (TONS)
TABLE 110 CANADA: MICROPLASTIC FILLERS MARKET, BY END-USE INDUSTRIES, 2024–2029 (TONS)
TABLE 111 MEXICO: MICROPLASTIC FILLERS MARKET, BY END-USE INDUSTRIES, 2020–2023 (USD MILLION)
TABLE 112 MEXICO: MICROPLASTIC FILLERS MARKET, BY END-USE INDUSTRIES, 2024–2029 (USD MILLION)
TABLE 113 MEXICO: MICROPLASTIC FILLERS MARKET, BY END-USE INDUSTRIES, 2020–2023 (TONS)
TABLE 114 MEXICO: MICROPLASTIC FILLERS MARKET, BY END-USE INDUSTRIES, 2024–2029 (TONS)
TABLE 115 EUROPE: MICROPLASTIC FILLERS MARKET, BY COUNTRY, 2020–2023 (USD MILLION)
TABLE 116 EUROPE: MICROPLASTIC FILLERS MARKET, BY COUNTRY, 2024–2029 (USD MILLION)
TABLE 117 EUROPE: MICROPLASTIC FILLERS MARKET, BY COUNTRY, 2020–2023 (TONS)
TABLE 118 EUROPE: MICROPLASTIC FILLERS MARKET, BY COUNTRY, 2024–2029 (TONS)
TABLE 119 EUROPE: MICROPLASTIC FILLERS MARKET, BY TYPE, 2020–2023 (USD MILLION)
TABLE 120 EUROPE: MICROPLASTIC FILLERS MARKET, BY TYPE, 2024–2029 (USD MILLION)
TABLE 121 EUROPE: MICROPLASTIC FILLERS MARKET, BY TYPE, 2020–2023 (TONS)
TABLE 122 EUROPE: MICROPLASTIC FILLERS MARKET, BY TYPE, 2024–2029 (TONS)
TABLE 123 EUROPE: MICROPLASTIC FILLERS MARKET, BY FORM, 2020–2023 (USD MILLION)
TABLE 124 EUROPE: MICROPLASTIC FILLERS MARKET, BY FORM, 2024–2029 (USD MILLION)
TABLE 125 EUROPE: MICROPLASTIC FILLERS MARKET, BY FUNCTION, 2020–2023 (USD MILLION)
TABLE 126 EUROPE: MICROPLASTIC FILLERS MARKET, BY FUNCTION, 2024–2029 (USD MILLION)
TABLE 127 EUROPE: MICROPLASTIC FILLERS MARKET, BY END-USE INDUSTRIES, 2020–2023 (USD MILLION)
TABLE 128 EUROPE: MICROPLASTIC FILLERS MARKET, BY END-USE INDUSTRIES, 2024–2029 (USD MILLION)
TABLE 129 EUROPE: MICROPLASTIC FILLERS MARKET, BY END-USE INDUSTRIES, 2020–2023 (TONS)
TABLE 130 EUROPE: MICROPLASTIC FILLERS MARKET, BY END-USE INDUSTRIES, 2024–2029 (TONS)
TABLE 131 GERMANY: MICROPLASTIC FILLERS MARKET, BY END-USE INDUSTRIES, 2020–2023 (USD MILLION)
TABLE 132 GERMANY: MICROPLASTIC FILLERS MARKET, BY END-USE INDUSTRIES, 2024–2029 (USD MILLION)
TABLE 133 GERMANY: MICROPLASTIC FILLERS MARKET, BY END-USE INDUSTRIES, 2020–2023 (TONS)
TABLE 134 GERMANY: MICROPLASTIC FILLERS MARKET, BY END-USE INDUSTRIES, 2024–2029 (TONS)
TABLE 135 ITALY: MICROPLASTIC FILLERS MARKET, BY END-USE INDUSTRIES, 2020–2023 (USD MILLION)
TABLE 136 ITALY: MICROPLASTIC FILLERS MARKET, BY END-USE INDUSTRIES, 2024–2029 (USD MILLION)
TABLE 137 ITALY: MICROPLASTIC FILLERS MARKET, BY END-USE INDUSTRIES, 2020–2023 (TONS)
TABLE 138 ITALY: MICROPLASTIC FILLERS MARKET, BY END-USE INDUSTRIES, 2024–2029 (TONS)
TABLE 139 FRANCE: MICROPLASTIC FILLERS MARKET, BY END-USE INDUSTRIES, 2020–2023 (USD MILLION)
TABLE 140 FRANCE: MICROPLASTIC FILLERS MARKET, BY END-USE INDUSTRIES, 2024–2029 (USD MILLION)
TABLE 141 FRANCE: MICROPLASTIC FILLERS MARKET, BY END-USE INDUSTRIES, 2020–2023 (TONS)
TABLE 142 FRANCE: MICROPLASTIC FILLERS MARKET, BY END-USE INDUSTRIES, 2024–2029 (TONS)
TABLE 143 UK: MICROPLASTIC FILLERS MARKET, BY END-USE INDUSTRIES, 2020–2023 (USD MILLION)
TABLE 144 UK: MICROPLASTIC FILLERS MARKET, BY END-USE INDUSTRIES, 2024–2029 (USD MILLION)
TABLE 145 UK: MICROPLASTIC FILLERS MARKET, BY END-USE INDUSTRIES, 2020–2023 (TONS)
TABLE 146 UK: MICROPLASTIC FILLERS MARKET, BY END-USE INDUSTRIES, 2024–2029 (TONS)
TABLE 147 SPAIN: MICROPLASTIC FILLERS MARKET, BY END-USE INDUSTRIES, 2020–2023 (USD MILLION)
TABLE 148 SPAIN: MICROPLASTIC FILLERS MARKET, BY END-USE INDUSTRIES, 2024–2029 (USD MILLION)
TABLE 149 SPAIN: MICROPLASTIC FILLERS MARKET, BY END-USE INDUSTRIES, 2020–2023 (TONS)
TABLE 150 SPAIN: MICROPLASTIC FILLERS MARKET, BY END-USE INDUSTRIES, 2024–2029 (TONS)
TABLE 151 RUSSIA: MICROPLASTIC FILLERS MARKET, BY END-USE INDUSTRIES, 2020–2023 (USD MILLION)
TABLE 152 RUSSIA: MICROPLASTIC FILLERS MARKET, BY END-USE INDUSTRIES, 2024–2029 (USD MILLION)
TABLE 153 RUSSIA: MICROPLASTIC FILLERS MARKET, BY END-USE INDUSTRIES, 2020–2023 (TONS)
TABLE 154 RUSSIA: MICROPLASTIC FILLERS MARKET, BY END-USE INDUSTRIES, 2024–2029 (TONS)
TABLE 155 REST OF EUROPE: MICROPLASTIC FILLERS MARKET, BY END-USE INDUSTRIES, 2020–2023 (USD MILLION)
TABLE 156 REST OF EUROPE: MICROPLASTIC FILLERS MARKET, BY END-USE INDUSTRIES, 2024–2029 (USD MILLION)
TABLE 157 REST OF EUROPE: MICROPLASTIC FILLERS MARKET, BY END-USE INDUSTRIES, 2020–2023 (TONS)
TABLE 158 REST OF EUROPE: MICROPLASTIC FILLERS MARKET, BY END-USE INDUSTRIES, 2024–2029 (TONS)
TABLE 159 MIDDLE EAST & AFRICA: MICROPLASTIC FILLERS MARKET, BY COUNTRY, 2020–2023 (USD MILLION)
TABLE 160 MIDDLE EAST & AFRICA: MICROPLASTIC FILLERS MARKET, BY COUNTRY, 2024–2029 (USD MILLION)
TABLE 161 MIDDLE EAST & AFRICA: MICROPLASTIC FILLERS MARKET, BY COUNTRY, 2020–2023 (TONS)
TABLE 162 MIDDLE EAST & AFRICA: MICROPLASTIC FILLERS MARKET, BY COUNTRY, 2024–2029 (TONS)
TABLE 163 MIDDLE EAST & AFRICA: MICROPLASTIC FILLERS MARKET, BY TYPE, 2020–2023 (USD MILLION)
TABLE 164 MIDDLE EAST & AFRICA: MICROPLASTIC FILLERS MARKET, BY TYPE, 2024–2029 (USD MILLION)
TABLE 165 MIDDLE EAST & AFRICA: MICROPLASTIC FILLERS MARKET, BY TYPE, 2020–2023 (TONS)
TABLE 166 MIDDLE EAST & AFRICA: MICROPLASTIC FILLERS MARKET, BY TYPE, 2024–2029 (TONS)
TABLE 167 MIDDLE EAST & AFRICA: MICROPLASTIC FILLERS MARKET, BY FORM, 2020–2023 (USD MILLION)
TABLE 168 MIDDLE EAST & AFRICA: MICROPLASTIC FILLERS MARKET, BY FORM, 2024–2029 (USD MILLION)
TABLE 169 MIDDLE EAST & AFRICA: MICROPLASTIC FILLERS MARKET, BY FUNCTION, 2020–2023 (USD MILLION)
TABLE 170 MIDDLE EAST & AFRICA: MICROPLASTIC FILLERS MARKET, BY FUNCTION, 2024–2029 (USD MILLION)
TABLE 171 MIDDLE EAST & AFRICA: MICROPLASTIC FILLERS MARKET, BY END-USE INDUSTRIES, 2020–2023 (USD MILLION)
TABLE 172 MIDDLE EAST & AFRICA: MICROPLASTIC FILLERS MARKET, BY END-USE INDUSTRIES, 2024–2029 (USD MILLION)
TABLE 173 MIDDLE EAST & AFRICA: MICROPLASTIC FILLERS MARKET, BY END-USE INDUSTRIES, 2020–2023 (TONS)
TABLE 174 MIDDLE EAST & AFRICA: MICROPLASTIC FILLERS MARKET, BY END-USE INDUSTRIES, 2024–2029 (TONS)
TABLE 175 SAUDI ARABIA: MICROPLASTIC FILLERS MARKET, BY END-USE INDUSTRIES, 2020–2023 (USD MILLION)
TABLE 176 SAUDI ARABIA: MICROPLASTIC FILLERS MARKET, BY END-USE INDUSTRIES, 2024–2029 (USD MILLION)
TABLE 177 SAUDI ARABIA: MICROPLASTIC FILLERS MARKET, BY END-USE INDUSTRIES, 2020–2023 (TONS)
TABLE 178 SAUDI ARABIA: MICROPLASTIC FILLERS MARKET, BY END-USE INDUSTRIES, 2024–2029 (TONS)
TABLE 179 UAE: MICROPLASTIC FILLERS MARKET, BY END-USE INDUSTRIES, 2020–2023 (USD MILLION)
TABLE 180 UAE: MICROPLASTIC FILLERS MARKET, BY END-USE INDUSTRIES, 2024–2029 (USD MILLION)
TABLE 181 UAE: MICROPLASTIC FILLERS MARKET, BY END-USE INDUSTRIES, 2020–2023 (TONS)
TABLE 182 UAE: MICROPLASTIC FILLERS MARKET, BY END-USE INDUSTRIES, 2024–2029 (TONS)
TABLE 183 REST OF GCC COUNTRIES: MICROPLASTIC FILLERS MARKET, BY END-USE INDUSTRIES, 2020–2023 (USD MILLION)
TABLE 184 REST OF GCC COUNTRIES: MICROPLASTIC FILLERS MARKET, BY END-USE INDUSTRIES, 2024–2029 (USD MILLION)
TABLE 185 REST OF GCC COUNTRIES: MICROPLASTIC FILLERS MARKET, BY END-USE INDUSTRIES, 2020–2023 (TONS)
TABLE 186 REST OF GCC COUNTRIES: MICROPLASTIC FILLERS MARKET, BY END-USE INDUSTRIES, 2024–2029 (TONS)
TABLE 187 SOUTH AFRICA: MICROPLASTIC FILLERS MARKET, BY END-USE INDUSTRIES, 2020–2023 (USD MILLION)
TABLE 188 SOUTH AFRICA: MICROPLASTIC FILLERS MARKET, BY END-USE INDUSTRIES, 2024–2029 (USD MILLION)
TABLE 189 SOUTH AFRICA: MICROPLASTIC FILLERS MARKET, BY END-USE INDUSTRIES, 2020–2023 (TONS)
TABLE 190 SOUTH AFRICA: MICROPLASTIC FILLERS MARKET, BY END-USE INDUSTRIES, 2024–2029 (TONS)
TABLE 191 REST OF MIDDLE EAST & AFRICA: MICROPLASTIC FILLERS MARKET, BY END-USE INDUSTRIES, 2020–2023 (USD MILLION)
TABLE 192 REST OF MIDDLE EAST & AFRICA: MICROPLASTIC FILLERS MARKET, BY END-USE INDUSTRIES, 2024–2029 (USD MILLION)
TABLE 193 REST OF MIDDLE EAST & AFRICA: MICROPLASTIC FILLERS MARKET, BY END-USE INDUSTRIES, 2020–2023 (TONS)
TABLE 194 REST OF MIDDLE EAST & AFRICA: MICROPLASTIC FILLERS MARKET, BY END-USE INDUSTRIES, 2024–2029 (TONS)
TABLE 195 SOUTH AMERICA: MICROPLASTIC FILLERS MARKET, BY COUNTRY, 2020–2023 (USD MILLION)
TABLE 196 SOUTH AMERICA: MICROPLASTIC FILLERS MARKET, BY COUNTRY, 2024–2029(USD MILLION)
TABLE 197 SOUTH AMERICA: MICROPLASTIC FILLERS MARKET, BY COUNTRY, 2020–2023 (TONS)
TABLE 198 SOUTH AMERICA: MICROPLASTIC FILLERS MARKET, BY COUNTRY, 2024–2029 (TONS)
TABLE 199 SOUTH AMERICA: MICROPLASTIC FILLERS MARKET, BY TYPE, 2020–2023 (USD MILLION)
TABLE 200 SOUTH AMERICA: MICROPLASTIC FILLERS MARKET, BY TYPE, 2024–2029 (USD MILLION)
TABLE 201 SOUTH AMERICA: MICROPLASTIC FILLERS MARKET, BY TYPE, 2020–2023 (TONS)
TABLE 202 SOUTH AMERICA: MICROPLASTIC FILLERS MARKET, BY TYPE, 2024–2029 (TONS)
TABLE 203 SOUTH AMERICA: MICROPLASTIC FILLERS MARKET, BY FORM, 2020–2023 (USD MILLION)
TABLE 204 SOUTH AMERICA: MICROPLASTIC FILLERS MARKET, BY FORM, 2024–2029(USD MILLION)
TABLE 205 SOUTH AMERICA: MICROPLASTIC FILLERS MARKET, BY FUNCTION, 2020–2023 (USD MILLION)
TABLE 206 SOUTH AMERICA: MICROPLASTIC FILLERS MARKET, BY FUNCTION, 2024–2029 (USD MILLION)
TABLE 207 SOUTH AMERICA: MICROPLASTIC FILLERS MARKET, BY END-USE INDUSTRIES, 2020–2023 (USD MILLION)
TABLE 208 SOUTH AMERICA: MICROPLASTIC FILLERS MARKET, BY END-USE INDUSTRIES, 2024–2029 (USD MILLION)
TABLE 209 SOUTH AMERICA: MICROPLASTIC FILLERS MARKET, BY END-USE INDUSTRIES, 2020–2023 (TONS)
TABLE 210 SOUTH AMERICA: MICROPLASTIC FILLERS MARKET, BY END-USE INDUSTRIES, 2024–2029 (TONS)
TABLE 211 ARGENTINA: MICROPLASTIC FILLERS MARKET, BY END-USE INDUSTRIES, 2020–2023 (USD MILLION)
TABLE 212 ARGENTINA: MICROPLASTIC FILLERS MARKET, BY END-USE INDUSTRIES, 2024–2029 (USD MILLION)
TABLE 213 ARGENTINA: MICROPLASTIC FILLERS MARKET, BY END-USE INDUSTRIES, 2020–2023 (TONS)
TABLE 214 ARGENTINA: MICROPLASTIC FILLERS MARKET, BY END-USE INDUSTRIES, 2024–2029 (TONS)
TABLE 215 BRAZIL: MICROPLASTIC FILLERS MARKET, BY END-USE INDUSTRIES, 2020–2023 (USD MILLION)
TABLE 216 BRAZIL: MICROPLASTIC FILLERS MARKET, BY END-USE INDUSTRIES, 2024–2029 (USD MILLION)
TABLE 217 BRAZIL: MICROPLASTIC FILLERS MARKET, BY END-USE INDUSTRIES, 2020–2023 (TONS)
TABLE 218 BRAZIL: MICROPLASTIC FILLERS MARKET, BY END-USE INDUSTRIES, 2024–2029 (TONS)
TABLE 219 REST OF SOUTH AMERICA: MICROPLASTIC FILLERS MARKET, BY END-USE INDUSTRIES, 2020–2023 (USD MILLION)
TABLE 220 REST OF SOUTH AMERICA: MICROPLASTIC FILLERS MARKET, BY END-USE INDUSTRIES, 2024–2029 (USD MILLION)
TABLE 221 REST OF SOUTH AMERICA: MICROPLASTIC FILLERS MARKET, BY END-USE INDUSTRIES, 2020–2023 (TONS)
TABLE 222 REST OF SOUTH AMERICA: MICROPLASTIC FILLERS MARKET, BY END-USE INDUSTRIES, 2024–2029 (TONS)
TABLE 223 OVERVIEW OF STRATEGIES ADOPTED BY KEY MICROPLASTIC FILLER MANUFACTURERS
TABLE 224 MICROPLASTIC FILLERS MARKET: DEGREE OF COMPETITION
TABLE 225 COMPANY TYPE FOOTPRINT
TABLE 226 COMPANY END-USE INDUSTRY FOOTPRINT
TABLE 227 COMPANY FUNCTION FOOTPRINT
TABLE 228 COMPANY REGION FOOTPRINT
TABLE 229 MICROPLASTIC FILLERS MARKET: DETAILED LIST OF KEY STARTUPS/SMES
TABLE 230 MICROPLASTIC FILLERS MARKET: COMPETITIVE BENCHMARKING OF KEY STARTUPS/SMES
TABLE 231 MICROPLASTIC FILLERS MARKET: OTHERS, JANUARY 2020– APRIL 2024
TABLE 232 BASF SE: COMPANY OVERVIEW
TABLE 233 BASF SE: PRODUCT OFFERINGS
TABLE 234 BASF SE: OTHERS, JANUARY 2021–MAY 2024
TABLE 235 CLARIANT: COMPANY OVERVIEW
TABLE 236 CLARIANT: PRODUCT OFFERINGS
TABLE 237 THERMO FISHER SCIENTIFIC INC.: COMPANY OVERVIEW
TABLE 238 THERMO FISHER SCIENTIFIC INC.: PRODUCT OFFERINGS
TABLE 239 POLYFILL: COMPANY OVERVIEW
TABLE 240 POLYFILL: PRODUCT OFFERINGS
TABLE 241 COMPOSITION MATERIALS CO.: COMPANY OVERVIEW
TABLE 242 COMPOSITION MATERIALS CO.: PRODUCT OFFERINGS
TABLE 243 HONEYWELL INTERNATIONAL INC.: COMPANY OVERVIEW
TABLE 244 HONEYWELL INTERNATIONAL INC.: PRODUCT OFFERINGS
TABLE 245 SCHILLING LTD.: COMPANY OVERVIEW
TABLE 246 SCHILLING LTD: PRODUCT OFFERINGS
TABLE 247 KAIMAOXING CELLULOSE (SHANDONG) CO., LTD: COMPANY OVERVIEW
TABLE 248 KAIMAOXING CELLULOSE (SHANDONG) CO., LTD: PRODUCT OFFERINGS
TABLE 249 PRECISION DRAWELL PVT LTD.: COMPANY OVERVIEW
TABLE 250 PRECISION DRAWELL PVT LTD.: PRODUCT OFFERINGS
TABLE 251 GOONVEAN FIBRES LTD: COMPANY OVERVIEW
TABLE 252 GOONVEAN FIBRES LTD: PRODUCT OFFERINGS
TABLE 253 SIBELCO: COMPANY OVERVIEW
TABLE 254 SH MINERALS GMBH: COMPANY OVERVIEW
TABLE 255 CLADES COMPOSITES: COMPANY OVERVIEW
TABLE 256 IMERYS: COMPANY OVERVIEW
TABLE 257 LKAB MINERALS: COMPANY OVERVIEW
TABLE 258 OMYA INTERNATIONAL AG: COMPANY OVERVIEW
TABLE 259 COVIA HOLDINGS LLC: COMPANY OVERVIEW
TABLE 260 STOCKMEIER GROUP: COMPANY OVERVIEW
TABLE 261 QUARZWERKE GMBH: COMPANY OVERVIEW
TABLE 262 20 MICRONS: COMPANY OVERVIEW
 
 
LIST OF FIGURES (54 FIGURES)
 
FIGURE 1 MICROPLASTIC FILLERS MARKET SEGMENTATION & REGIONS COVERED
FIGURE 2 MICROPLASTIC FILLERS MARKET: RESEARCH DESIGN
FIGURE 3 MARKET SIZE ESTIMATION METHODOLOGY: SUPPLY-SIDE APPROACH
FIGURE 4 MARKET SIZE ESTIMATION METHODOLOGY: DEMAND-SIDE APPROACH
FIGURE 5 MARKET SIZE ESTIMATION METHODOLOGY: REVENUE OF MARKET PLAYERS
FIGURE 6 MARKET SIZE ESTIMATION METHODOLOGY: BOTTOM-UP APPROACH
FIGURE 7 MARKET SIZE ESTIMATION METHODOLOGY: TOP-DOWN APPROACH
FIGURE 8 MICROPLASTIC FILLERS MARKET: DATA TRIANGULATION
FIGURE 9 POLYURETHANE TO LEAD MARKET DURING FORECAST PERIOD
FIGURE 10 POWDER SEGMENT TO LEAD MARKET DURING FORECAST PERIOD
FIGURE 11 FILLERS SEGMENT TO LEAD MARKET DURING FORECAST PERIOD
FIGURE 12 PACKAGING END-USE INDUSTRIES TO LEAD MARKET DURING FORECAST PERIOD
FIGURE 13 ASIA PACIFIC TO LEAD MARKET DURING FORECAST PERIOD
FIGURE 14 GROWING USES IN PACKAGING AND COSMETICS & PERSONAL CARE INDUSTRIES TO DRIVE MARKET
FIGURE 15 POLYETHYLENE TO BE FASTEST-GROWING SEGMENT DURING FORECAST PERIOD
FIGURE 16 PACKAGING TO BE FASTEST-GROWING SEGMENT DURING FORECAST PERIOD
FIGURE 17 CHINA TO BE FASTEST-GROWING MARKET DURING FORECAST PERIOD
FIGURE 18 DRIVERS, RESTRAINTS, OPPORTUNITIES, AND CHALLENGES IN MICROPLASTIC FILLERS MARKET
FIGURE 19 USE OF GENERATIVE AI IN MICROPLASTIC FILLERS MARKET
FIGURE 20 TRENDS INFLUENCING CUSTOMER BUSINESS
FIGURE 21 MICROPLASTIC FILLERS MARKET: SUPPLY CHAIN ANALYSIS
FIGURE 22 MICROPLASTIC FILLERS MARKET: INVESTMENT AND FUNDING SCENARIO
FIGURE 23 MICROPLASTIC FILLERS MARKET: AVERAGE SELLING PRICE TREND, BY REGION, 2020–2023 (USD/TON)
FIGURE 24 AVERAGE SELLING PRICE TREND OF MICROPLASTIC FILLER TYPES PROVIDED BY KEY PLAYERS
FIGURE 25 MICROPLASTIC FILLERS MARKET: ECOSYSTEM ANALYSIS
FIGURE 26 PATENTS GRANTED OVER LAST 10 YEARS
FIGURE 27 PATENT ANALYSIS, BY LEGAL STATUS
FIGURE 28 REGIONAL ANALYSIS OF PATENTS GRANTED FOR MICROPLASTIC FILLERS TECHNOLOGY, 2023
FIGURE 29 TOP 10 COMPANIES WITH SUBSTANTIAL NUMBER OF PATENTS, 2013–2023
FIGURE 30 IMPORT DATA FOR HS CODE 32064990-COMPLIANT PRODUCTS, BY COUNTRY, 2020–2023 (USD THOUSAND)
FIGURE 31 EXPORT DATA FOR HS CODE 39019090 -COMPLIANT PRODUCTS, BY COUNTRY, 2020–2023 (USD THOUSAND)
FIGURE 32 PORTER’S FIVE FORCES ANALYSIS: MICROPLASTIC FILLERS MARKET
FIGURE 33 INFLUENCE OF STAKEHOLDERS ON BUYING PROCESS FOR APPLICATIONS
FIGURE 34 KEY BUYING CRITERIA FOR APPLICATIONS
FIGURE 35 POLYURETHANE TO BE LARGEST SEGMENT OF MICROPLASTIC FILLERS MARKET IN 2023
FIGURE 36 CHEMICAL INTERMEDIATES TO LEAD MICROPLASTIC FILLERS MARKET DURING FORECAST PERIOD
FIGURE 37 FILLERS TO LEAD MICROPLASTIC FILLERS MARKET DURING FORECAST PERIOD
FIGURE 38 PACKAGING TO BE LARGEST SEGMENT OF MICROPLASTIC FILLERS MARKET IN 2023
FIGURE 39 ASIA PACIFIC TO BE FASTEST-GROWING MARKET DURING FORECAST PERIOD
FIGURE 40 ASIA PACIFIC: MICROPLASTIC FILLERS MARKET SNAPSHOT
FIGURE 41 NORTH AMERICA: MICROPLASTIC FILLERS MARKET SNAPSHOT
FIGURE 42 EUROPE: MICROPLASTIC FILLERS MARKET SNAPSHOT
FIGURE 43 MICROPLASTIC FILLERS MARKET: SHARE OF KEY PLAYERS
FIGURE 44 REVENUE ANALYSIS OF KEY PLAYERS, 2020–2024
FIGURE 45 BRAND/PRODUCT COMPARATIVE ANALYSIS, BY SEGMENT
FIGURE 46 MICROPLASTIC FILLERS MARKET: COMPANY EVALUATION MATRIX, KEY PLAYERS, 2023
FIGURE 47 MICROPLASTIC FILLERS MARKET: COMPANY OVERALL FOOTPRINT
FIGURE 48 MICROPLASTIC FILLERS MARKET: COMPANY EVALUATION MATRIX, START-UPS/SMES, 2023
FIGURE 49 EV/EBITDA OF KEY VENDORS
FIGURE 50 YEAR-TO-DATE (YTD) PRICE TOTAL RETURN
FIGURE 51 BASF SE: COMPANY SNAPSHOT
FIGURE 52 CLARIANT: COMPANY SNAPSHOT
FIGURE 53 THERMO FISHER SCIENTIFIC INC.: COMPANY SNAPSHOT
FIGURE 54 HONEYWELL INTERNATIONAL INC.: COMPANY SNAPSHOT

The study involved four major activities in estimating the market size of the Microplastic Fillers market. Exhaustive secondary research was done to collect information on the market, the peer market, and the parent market. The next step was to validate these findings, assumptions, and sizing with industry experts across the value chain through primary research. Both top-down and bottom-up approaches were employed to estimate the complete market size. Thereafter, the market breakdown and data triangulation procedures were used to estimate the market size of the segments and subsegments.

Secondary Research

In the secondary research process, various secondary sources have been referred to for identifying and collecting information for this study. These secondary sources include annual reports, press releases, investor presentations of companies, white papers, certified publications, trade directories, certified publications, articles from recognized authors, gold standard and silver standard websites, and databases.

Secondary research has been used to obtain key information about the value chain of the industry, monetary chain of the market, the total pool of key Microplastic Fillers, market classification and segmentation according to industry trends to the bottom-most level, and regional markets. It was also used to obtain information about the key developments from a market-oriented perspective.

Primary Research

The Microplastic Fillers market comprises several stakeholders in the value chain, which include raw material suppliers, manufacturers, and end users. Various primary sources from the supply and demand sides of the Microplastic Fillers market have been interviewed to obtain qualitative and quantitative information. The primary interviewees from the demand side include key opinion leaders in end-use sectors. The primary sources from the supply side include manufacturers, associations, and institutions involved in the Microplastic Fillers industry.

Primary interviews were conducted to gather insights such as market statistics, data of revenue collected from the products and services, market breakdowns, market size estimations, market forecasting, and data triangulation. Primary research also helped in understanding the various trends related to chemistry, application, and region. Stakeholders from the demand side, such as CIOs, CTOs, and CSOs were interviewed to understand the buyer’s perspective on the suppliers, products, component providers, and their current usage of Microplastic Fillers and future outlook of their business which will affect the overall market.

The breakdown of profiles of the primary interviewees is illustrated in the figure below:
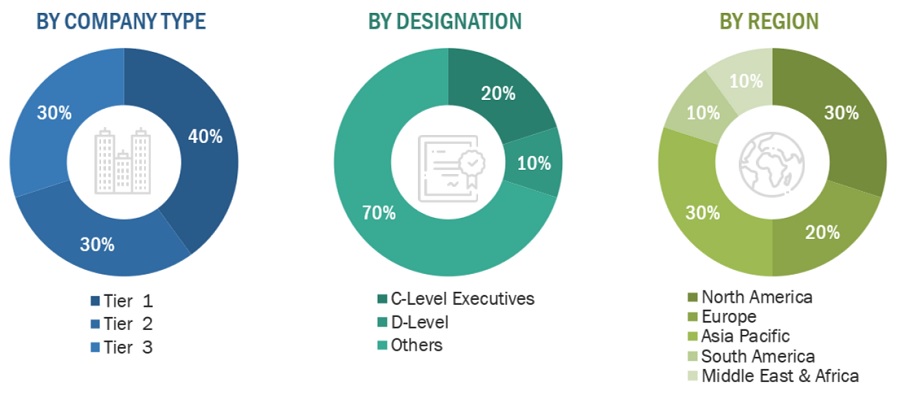
Microplastic Fillers Market Size, and Share

Note: Tier 1, Tier 2, and Tier 3 companies are classified based on their market revenue in 2023 available in the public domain, product portfolios, and geographical presence.

Other designations include sales representatives, production heads, and technicians.

To know about the assumptions considered for the study, download the pdf brochure

Market Size Estimation

The top-down approach was used to estimate and validate the size of various submarkets for Microplastic Fillers for each region. The research methodology used to estimate the market size included the following steps:

  • The key players in the industry have been identified through extensive secondary research.
  • The supply chain of the industry has been determined through primary and secondary research.
  • The global market was then segmented into five major regions and validated by industry experts.
  • All percentage shares, splits, and breakdowns based on type, form, function, end-use, and regions were determined using secondary sources and verified through primary sources.
  • All possible parameters that affect the markets covered in this research study were accounted for, viewed in extensive detail, verified through primary research, and analyzed to get the final quantitative and qualitative data. This data was consolidated and added with detailed inputs and analysis and presented in this report.

Microplastic Fillers Market: Bottum-Up Approach
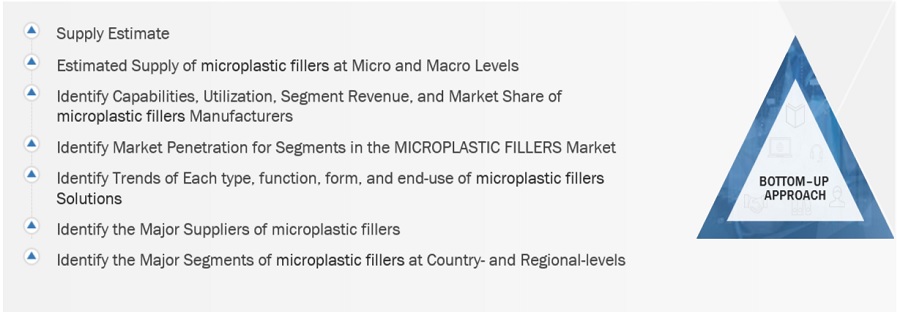
Microplastic Fillers Market Size, and Share

To know about the assumptions considered for the study, Request for Free Sample Report

Source: Secondary Research, Interviews with Experts, and MarketsandMarkets Analysis

Microplastic Fillers Market: Top-Down Approach

Microplastic Fillers Market Size, and Share

Source: Secondary Research, Interviews with Experts, and MarketsandMarkets Analysis

Data Triangulation

After arriving at the total market size from the estimation process Microplastic Fillers above, the overall market has been split into several segments and sub-segments. To complete the overall market engineering process and arrive at the exact statistics for all the segments and sub-segments, the data triangulation and market breakdown procedures have been employed, wherever applicable. The data has been triangulated by studying various factors and trends from both the demand and supply sides. Along with this, the market size has been validated by using both the top-down and bottom-up approaches and primary interviews. Hence, for every data segment, there have been three sources—top-down approach, bottom-up approach, and expert interviews. The data was assumed correct when the values arrived from the three sources matched.

Market Definition

The microplastic fillers market corresponds to the segment of the global materials industry associated with the manufacture and utilization of small plastic particles, normally less than 5 millimeters in size, intended to enhance the general properties and performance of a wide range of products for various industries such as packaging, automotive, and construction . These fillers are used in a variety of materials to increase mechanical, thermal, and aesthetic properties. Additionally, microplastic fillers are used in a various forms such as powder, and fibers , each with unique benefits customized to specific applications. Furthermore, advances in polymer technology and rising demand for high-performance materials help to drive market growth.

Key Stakeholders

  • Microplastic Fillers Manufacturers
  • Microplastic Fillers Traders, Distributors, and Suppliers
  • Raw Type Suppliers
  • Government and Private Research Organizations
  • Associations and Industrial Bodies
  • R&D Institutions
  • Environmental Support Agencies

Report Objectives

  • To define, describe, and forecast the size of the Microplastic Fillers market, in terms of value and volume.
  • To provide detailed information regarding the major factors (drivers, opportunities, restraints, and challenges) influencing the growth of the market.
  • To estimate and forecast the market size based on  type, form, function, end-use, and region.
  • To forecast the size of the market with respect to major regions, namely, Europe, North America, Asia Pacific, Middle East & Africa, and South America, along with their key countries.
  • To strategically analyze micromarkets1 with respect to individual growth trends, prospects, and their contribution to the overall market.
  • To analyze opportunities in the market for stakeholders and provide a competitive landscape of market leaders.
  • To track and analyze recent development such as announcement in the market.
  • To strategically profile key market players and comprehensively analyze their core competencies.

Available Customizations

Along with the given market data, MarketsandMarkets offers customizations according to the company’s specific needs. The following customization options are available for the report:

Regional Analysis

  • Further breakdown of a region with respect to a particular country or additional application

Company Information

  • Detailed analysis and profiles of additional market players

Tariff & Regulations

  • Regulations and impact on Microplastic Fillers market

By Form Analysis

  • Market size for Microplastic Fillers in terms of value and volume
Custom Market Research Services

We will customize the research for you, in case the report listed above does not meet with your exact requirements. Our custom research will comprehensively cover the business information you require to help you arrive at strategic and profitable business decisions.

Request Customization
Report Code
CH 9114
Published ON
Aug, 2024
Choose License Type
BUY NOW
  • SHARE
X
Request Customization
Speak to Analyst
Speak to Analyst
OR FACE-TO-FACE MEETING
PERSONALIZE THIS RESEARCH
  • Triangulate with your Own Data
  • Get Data as per your Format and Definition
  • Gain a Deeper Dive on a Specific Application, Geography, Customer or Competitor
  • Any level of Personalization
REQUEST A FREE CUSTOMIZATION
LET US HELP YOU!
  • What are the Known and Unknown Adjacencies Impacting the Microplastic Fillers Market
  • What will your New Revenue Sources be?
  • Who will be your Top Customer; what will make them switch?
  • Defend your Market Share or Win Competitors
  • Get a Scorecard for Target Partners
CUSTOMIZED WORKSHOP REQUEST
  • Call Us
  • +1-888-600-6441 (Corporate office hours)
  • +1-888-600-6441 (US/Can toll free)
  • +44-800-368-9399 (UK office hours)
CONNECT WITH US
ABOUT TRUST ONLINE
©2024 MarketsandMarkets Research Private Ltd. All rights reserved
DMCA.com Protection Status Website Feedback