Metal Organic Frameworks Market

Report Code MM 9150
Published On Oct, 2024, By MarketsandMarkets™
Download PDF

Choose License Type

Buy Report Now Inquire Before Buying

Metal Organic Frameworks Market by Type (Zinc-based, Copper-based, Iron-based, Aluminium-based, Chromium-based), Synthesis Method (Solvothermal/Hydrothermal, Microwave-assisted, Mechanochemical), and Region - Global forecast to 2030

Overview

The metal organic frameworks market is estimated at USD 0.51 billion in 2024 and is projected to reach USD 1.70 billion by 2030, at a CAGR of 22.1% from 2024 to 2030. The global metal organic frameworks market is driven by its unique properties, structural diversity, versatility, and functional applications. Growing environmental concerns for reducing carbon emissions and achieving clean energy solutions propel demand across industries. These factors collectively contribute to the robust growth of the metal organic frameworks market.

Attractive Opportunities in the Metal Organic Frameworks Market

EUROPE

The Europe metal organic frameworks market is experiencing rapid growth, driven by significant government investments and funding programs, technological advancements, rapid industrialization and urbanization.

Governments are significantly investing in funding programs for the adoption of metal organic frameworks for clean energy solutions. This are key factors driving the market growth.

Increasing focus on reducing carbon emissions is driving the demand for metal organic frameworks in numerous industries including pharmaceutical, chemical, and oil & gas sector.

The Europe metal organic frameworks market is expected to be worth USD 0.76 billion by 2030, growing at CAGR of 22.8% during the forecast period.

The high cost of metal organic frameworks can make it difficult for several industries to adopt metal organic frameworks for carbon capture.

Global Metal Organic Frameworks Market Dynamics

Driver: Growing demand for metal organic frameworks to curb down carbon emissions

The growing popularity of metal organic frameworks, to reduce greenhouse gas emissions and transitioning towards sustainable solutions is driving the demand for efficient carbon capture technologies. Rising carbon emissions will have adverse effects on the environment such as global warming, climate change, ozone layer depletion, and melting glaciers. So, to tackle these environmental issues the International Energy Agency (IEA) has launched various projects to attain an annual CO2 emission cap of fourteen gigatons to limit the augmentation of global temperature to 2 °C.

Restraint: High cost of metal organic frameworks

The cost of metal organic frameworks is a restraining factor that limits the adoption of metal organic frameworks. The metal organic frameworks market is capital intensive. High cost of raw material and synthesis technique adopted for the preparation of metal organic frameworks significantly increases the overall cost of production. Apart from the raw material prices, the cost of manufacturing metal organic frameworks largely depends on the complexity and scalability.


Opportunity: Growing investments in green hydrogen projects to boost the market

Emerging markets, particularly in North America, are experiencing rapid industrialization and urbanization, which is fueling the demand for highly porous metal organic frameworks across various industries. Rising demand for sustainable and efficient hydrogen storage solutions, is significantly driving the growth of metal organic frameworks market. Increasing investments from government for developing green hydrogen plants for reducing carbon emissions and achieving sustainability is driving the demand for metal organic frameworks market.

Challenge: Toxicity concerns in metal organic frameworks

The metal organic frameworks market faces significant challenges due to toxicity concerns. The toxicity of metal organic frameworks is usually associated with the toxic heavy metal centre. Metals like aluminum, cobalt, chromium, and iron has lower toxicity levels, whereas copper and manganese exhibit higher toxicity. Higher release of metallic ions leads to higher toxicity. MOF-74, a magnesium-based metal organic frameworks was found more toxic when compared to other metal organic frameworks including ZIF-6.

Global Metal Organic Frameworks Market Ecosystem Analysis

Metal organic frameworks are the advanced porous materials composed of metal ions or clusters coordinated to organic linkers to form highly porous structure. Metal organic frameworks market ecosystem comprises of raw material manufacturers, particularly, metal precursors. These raw materials are procured by metal organic frameworks manufacturers like novoMOF, Framergy, Inc., Nuada, and Promethean Particles Ltd. that uses these raw materials to produce metal organic frameworks through different synthesis methods such as solvothermal/hydrothermal, mechanochemical, microwave- assisted, and other methods. Further, metal organic frameworks are used in wide range of applications by various end use industries.


Copper-based metal organic frameworks accounted for the largest market share, both in terms of value and volume.

Based on type, the metal organic frameworks market has been classified into zinc-based, copper-based, iron-based, aluminium-based, chromium-based and others. The copper-based segment of the metal organic frameworks market had the largest market share in 2023, in terms of value and volume. The growth of zinc-based metal organic frameworks in metal organic frameworks market is driven by several factors, including increasing demand for biomedical applications for cancer treatment, bacterial inhibition, biosensing, biocatalysis, and wound healing, growing demand of metal organic frameworks for electrochemical reduction of carbon dioxide. These factors are expected to continue driving the market growth in the future, as copper-based metal organic frameworks exhibits larger specific surface areas, high porosity, adjustable structures, simple preparation methods and lower cost, enabling the production of metal organic frameworks for wide range of applications.

Mechanochemical synthesis method accounted for the second largest market share, both in terms of value and volume

Based on synthesis method, the metal organic frameworks market has been classified into solvothermal/hydrothermal, sonochemical, microwave-assisted, mechanochemical, electrochemical and others. The mechanochemical synthesis method of the metal organic frameworks market had the second largest market share in 2023, in terms of value and volume. Mechanochemical synthesis method is a widely used synthesis technique for the preparation of metal organic frameworks, due to its higher surface area, real time monitoring, affordability, and environment friendliness. In mechanochemical synthesis method, reactions are carried out by grinding or milling with little or no solvent being used. This process is versatile and is gaining traction as a scalable green alternative to other synthesis methods. ZIFs, MOF-5, MIL-100, MOF-74, HKUST-1, and UiO-66 are some of the metal organic frameworks prepared by mechanosynthesis method.

Gas storage application segment is estimated to account for the highest market share in 2023, in metal organic frameworks market.

Based on application, the metal organic frameworks market has been segmented into gas and liquid adsorption, water harvesting, gas storage, sensing & detection, catalysis, and others. Metal organic frameworks are widely used in gas storage application due to its ultrahigh porosity, larger surface area, tunable pore size, high thermal and chemical stability. The highly porous structure of metal organic frameworks makes it easy to store large amount of gases including hydrogen, and methane for widespread use of clean energy.

Europe to hold the largest market share during the forecast period.

The metal organic frameworks market in Europe is experiencing significant growth, driven by advancement in technologies, increasing research & development activities, growing investments for funding programs, increasing government initiatives to adopt metal organic frameworks to tackle environmental challenges and achieve clean energy solutions. UK is the home to metal organic frameworks market due to presence of large number of well-established metal organic frameworks manufacturers. In 2023, the European Union has launched the COST Action (EUMOFs) to improve the reactivity, selectivity, efficiency of metal organic frameworks for potential applications including cancer treatment, wastewater treatment and energy storage.

HIGHEST CAGR MARKET IN 2023
GERMANY FASTEST-GROWING MARKET IN THE REGION

Recent Developments of Metal Organic Frameworks Market

  • In July 2024, Nuada has expanded its manufacturing facility by establishing its new state-of-the-art facilities in Newtownabbey, Northern Ireland, for upscaling its advanced carbon capture technology.
  • In February 2024, Numat Technologies Inc. has expanded its manufacturing facility in Wisconsin, US to produce high volume metal organic frameworks and meet customer demand for extreme environments and energy markets.
  • In December 2023, Nuada, a UK based carbon capture technology company has entered a partnership with four cement companies named Holcim, SCG, Cementos Argos, Cementos Molins to deliver low-carbon cement through its next generation carbon capture technology.
  • In October 2023, BASF SE entered into an agreement with carbon capture and removal solutions provider Svante Technologies Inc. to scale up the production of metal organic frameworks for carbon capture projects. This will help reduce carbon emissions in various industrial sectors.

Key Market Players

KEY PLAYERS IN THE METAL ORGANIC FRAMEWORKS MARKET INCLUDE

Get online access to the report on the World's First Market Intelligence Cloud

  • Easy to Download Historical Data & Forecast Numbers
  • Company Analysis Dashboard for high growth potential opportunities
  • Research Analyst Access for customization & queries
  • Competitor Analysis with Interactive dashboard
  • Latest News, Updates & Trend analysis
Request Sample

Scope of the Report

Report Metric Details
Market size for years 2022-2030
Base Year Considered 2023
Forecast period 2024-2030
Forecast units Value (USD Million/Billion), Volume (Kilogram)
Segments covered By Type, Synthesis method, Application, and Region
Geographies covered Europe, North America, Asia Pacific, Latin America, Middle East, and Africa


Key Questions Addressed by the Report

Which are the major companies in the metal organic frameworks market? What are their major strategies to strengthen their market presence?
Some of the key players in the metal organic frameworks market are Nanorh (US), Framergy, Inc. (US), novoMOF (Switzerland), BASF SE (Germany), Numat Technologies, Inc. (US), MOFapps (Norway), Nuada (UK), ProfMOF (Norway), ACSYNAM (Canada), and Promethean Particles Ltd. (UK), ACMOFS (China), GS Alliance Co., Ltd. (Japan), Physical Sciences Inc. (US), Majd Onsor Fartak (Iran), SyncMOF Inc. (Japan), Immaterial Ltd. (UK), Atomis Inc. (Japan), CD Bioparticles (US), Nanowiz Tech (India), Kerone Engineering Solutions Ltd. (India), Nanoshel LLC (US), Jiangsu Xianfeng Nanomaterial Technology Co., Ltd. (China), Decarbontek, Inc. (US), Svante Technologies Inc. (Canada), Nanochemazone (India), this are the key manufacturers that secured partnerships, acquisitions, contracts, deals in the last few years. Partnerships and deals were the key strategies adopted by these companies to strengthen their position in the metal organic frameworks market.
What are the drivers and opportunities for the metal organic frameworks market?
The growth of metal organic frameworks is driven by its unique properties, including larger specific surface area, tunable pore size, high porosity, high density, structural diversity, stability, and ability to be functionalized is increasing the demand for metal organic frameworks in wide range of applications including carbon capture and efficient gas storage solutions.
Which region is expected to hold the highest market share?
In terms of volume Asia Pacific’s metal organic frameworks market has been experiencing growth and significant industry demand. Easy availability of raw materials, investment in research and development, cheap labour, government policies, advancement in technologies is contributing to the increasing demand of metal organic frameworks in this region.
What is the total CAGR expected to be recorded for the metal organic frameworks market during 2024-2030?
The CAGR is expected to record a CAGR of 22.1% in terms of value, from 2024-2030.
How is the metal organic frameworks market aligned?
The market is growing at a significant pace. The market is a potential market, and many manufacturers are planning business strategies to expand their existing production capacities of metal organic frameworks.


Personalize This Research

  • Triangulate with your Own Data
  • Get Data as per your Format and Definition
  • Gain a Deeper Dive on a Specific Application, Geography, Customer or Competitor
  • Any level of Personalization
Request A Free Customisation

Let Us Help You

  • What are the Known and Unknown Adjacencies Impacting the Metal Organic Frameworks Market
  • What will your New Revenue Sources be?
  • Who will be your Top Customer; what will make them switch?
  • Defend your Market Share or Win Competitors
  • Get a Scorecard for Target Partners
Request A Free Customisation

Table Of Content

Exclusive indicates content/data unique to MarketsandMarkets and not available with any competitors.

TITLE
PAGE NO
INTRODUCTION
22
RESEARCH METHODOLOGY
26
EXECUTIVE SUMMARY
36
PREMIUM INSIGHTS
40
MARKET OVERVIEW
43
  • 5.1 INTRODUCTION
  • 5.2 MARKET DYNAMICS
    DRIVERS
    - Higher operational yield of metal organic frameworks for efficient gas storage
    - Growing demand for metal organic frameworks to curb carbon emissions
    - Increasing government initiatives and funding for R&D
    RESTRAINTS
    - Stability issues of metal organic frameworks
    - High cost of metal organic frameworks
    OPPORTUNITIES
    - Growing investments in green hydrogen projects
    - Innovative water harvesting technologies
    CHALLENGES
    - Scalability issues in metal organic framework production
    - Toxicity concerns in metal organic frameworks
  • 5.3 PORTER’S FIVE FORCES ANALYSIS
    THREAT OF NEW ENTRANTS
    THREAT OF SUBSTITUTES
    BARGAINING POWER OF SUPPLIERS
    BARGAINING POWER OF BUYERS
    INTENSITY OF COMPETITIVE RIVALRY
  • 5.4 SUPPLY CHAIN ANALYSIS
    RAW MATERIAL
    MANUFACTURING PROCESS
    FINAL PRODUCT
  • 5.5 ECOSYSTEM
  • 5.6 PRICING ANALYSIS
    AVERAGE SELLING PRICE TREND OF KEY PLAYERS, BY TYPE
    AVERAGE SELLING PRICE TREND, BY TYPE
    AVERAGE SELLING PRICE TREND, BY SYNTHESIS METHOD
    AVERAGE SELLING PRICE TREND, BY APPLICATION
    AVERAGE SELLING PRICE TREND, BY REGION
  • 5.7 VALUE CHAIN ANALYSIS
  • 5.8 TECHNOLOGY ANALYSIS
    TECHNOLOGY ANALYSIS FOR SOLVOTHERMAL/HYDROTHERMAL METAL ORGANIC FRAMEWORKS
    TECHNOLOGY ANALYSIS FOR MECHANOCHEMICAL METAL ORGANIC FRAMEWORKS
    COMPLEMENTARY TECHNOLOGIES FOR LATEST MANUFACTURING PROCESS OF METAL ORGANIC FRAMEWORKS
  • 5.9 IMPACT OF AI/GEN AI ON METAL ORGANIC FRAMEWORKS MARKET
    TOP USE CASES AND MARKET POTENTIAL
    BEST PRACTICES IN METAL ORGANIC FRAMEWORKS MARKET
    CASE STUDIES OF AI IMPLEMENTATION IN METAL ORGANIC FRAMEWORKS MARKET
    CLIENTS' READINESS TO ADOPT GENERATIVE AI IN METAL ORGANIC FRAMEWORKS MARKET
  • 5.10 KEY STAKEHOLDERS AND BUYING CRITERIA
    KEY STAKEHOLDERS IN BUYING PROCESS
    BUYING CRITERIA
  • 5.11 PATENT ANALYSIS
    INTRODUCTION
    METHODOLOGY
    DOCUMENT TYPES
    INSIGHTS
    LEGAL STATUS
    JURISDICTION ANALYSIS
    TOP APPLICANTS
    TOP 10 PATENT OWNERS (US) IN LAST 10 YEARS
  • 5.12 REGULATORY LANDSCAPE
    REGULATORY BODIES, GOVERNMENT AGENCIES, AND OTHER ORGANIZATIONS
  • 5.13 KEY CONFERENCES AND EVENTS IN 2024–2025
  • 5.14 CASE STUDY ANALYSIS
    CALF-20: GAME-CHANGING METAL ORGANIC FRAMEWORK FOR CARBON CAPTURE
    FRAMERGY, INC. COLLABORATED WITH ALICAT SCIENTIFIC, INC. FOR NATURAL GAS PURIFICATION
  • 5.15 TRENDS/DISRUPTIONS IMPACTING CUSTOMER BUSINESS
  • 5.16 INVESTMENT AND FUNDING SCENARIO
METAL ORGANIC FRAMEWORKS MARKET, BY TYPE
72
  • 6.1 INTRODUCTION
  • 6.2 ZINC-BASED
    RISING DEMAND IN GAS STORAGE AND DRUG DELIVERY
  • 6.3 COPPER-BASED
    SURGE IN DEMAND IN CATALYTIC APPLICATIONS AND CO2 REDUCTION EFFORTS
  • 6.4 IRON-BASED
    INCREASING DEMAND IN CATALYTIC ACTIVITIES TO FUEL DEMAND
  • 6.5 ALUMINUM-BASED
    GROWING APPLICATION IN SUSTAINABLE GAS STORAGE AND CATALYSIS
  • 6.6 CHROMIUM-BASED
    HIGH USAGE IN CATALYTIC PERFORMANCE AND ADVANCED ELECTRONIC APPLICATIONS
  • 6.7 OTHER TYPES
METAL ORGANIC FRAMEWORKS MARKET, BY SYNTHESIS METHOD
83
  • 7.1 INTRODUCTION
  • 7.2 SOLVOTHERMAL/HYDROTHERMAL
    OFFERS CRYSTAL SYNTHESIS AT HIGH TEMPERATURES AND PRESSURES
  • 7.3 SONOCHEMICAL
    ENVIRONMENT-FRIENDLY METHOD IDEAL FOR NANOSIZED METAL ORGANIC FRAMEWORKS
  • 7.4 MICROWAVE-ASSISTED
    ENABLES RAPID SYNTHESIS OF METAL ORGANIC FRAMEWORKS
  • 7.5 MECHANOCHEMICAL
    AFFORDABLE AND SOLVENT-FREE ALTERNATIVE FOR SYNTHESIS
  • 7.6 ELECTROCHEMICAL
    HIGH YIELD AND LOW ENERGY CONSUMPTION
  • 7.7 OTHER SYNTHESIS METHODS
METAL ORGANIC FRAMEWORKS MARKET, BY APPLICATION
92
  • 8.1 INTRODUCTION
  • 8.2 GAS & LIQUID ABSORPTION/SEPARATION
    HIGH DEMAND DUE TO CARBON DIOXIDE CAPTURE AND GAS SEPARATION
  • 8.3 WATER HARVESTING
    SOLUTION FOR WATER SCARCITY AMID RISING FRESHWATER DEMAND
  • 8.4 GAS STORAGE
    EFFICIENT GAS STORAGE FOR CLEAN ENERGY TRANSITION
  • 8.5 SENSING & DETECTION
    ENHANCED SENSING AND DETECTION WITH ADVANCED SENSITIVITY AND SELECTIVITY
  • 8.6 CATALYSIS
    SUSTAINABLE CATALYSIS WITH HIGH EFFICIENCY AND CUSTOMIZABLE PROPERTIES
  • 8.7 OTHER APPLICATIONS
METAL ORGANIC FRAMEWORKS MARKET, BY REGION
103
  • 9.1 INTRODUCTION
  • 9.2 NORTH AMERICA
    US
    - Advancements in synthesis technology
    CANADA
    - Advancements in clean energy solutions
  • 9.3 EUROPE
    GERMANY
    - Target of net greenhouse gas neutrality by 2045
    FRANCE
    - Increasing focus on R&D
    UK
    - Government initiatives and funding programs
    ITALY
    - Demand for clean energy solutions and R&D activities
    SPAIN
    - Growing R&D activities related to metal organic frameworks
    REST OF EUROPE
  • 9.4 ASIA PACIFIC
    CHINA
    - Rising R&D activities
    INDIA
    - Demand for clean energy and environmental sustainability
    JAPAN
    - Environmental regulations and technological advancements
    SOUTH KOREA
    - Rising demand in catalytic applications and advancements in synthesis methods
    REST OF ASIA PACIFIC
  • 9.5 LATIN AMERICA
    MEXICO
    - Expanding metal organic frameworks application to drive market
    BRAZIL
    - Carbon capture and gas storage to drive market
    REST OF LATIN AMERICA
  • 9.6 MIDDLE EAST & AFRICA
    GCC COUNTRIES
    - UAE
    - Saudi Arabia
    - Rest of GCC countries
    SOUTH AFRICA
    - Increasing demand for clean energy solutions and environmental sustainability initiatives
    REST OF MIDDLE EAST & AFRICA
COMPETITIVE LANDSCAPE
153
  • 10.1 OVERVIEW
  • 10.2 KEY PLAYER STRATEGIES/RIGHT TO WIN
  • 10.3 MARKET SHARE ANALYSIS
    RANKING ANALYSIS
  • 10.4 BRAND/PRODUCT COMPARATIVE ANALYSIS
    METAL ORGANIC FRAMEWORKS MARKET: BRAND/PRODUCT COMPARATIVE ANALYSIS
  • 10.5 COMPANY EVALUATION MATRIX: KEY PLAYERS, 2023
    STARS
    EMERGING LEADERS
    PERVASIVE PLAYERS
    PARTICIPANTS
    COMPANY FOOTPRINT: KEY PLAYERS, 2023
    - Company footprint
    - Type footprint
    - Synthesis method footprint
    - Application footprint
    - Region footprint
  • 10.6 COMPANY EVALUATION MATRIX: STARTUPS/SMES, 2023
    PROGRESSIVE COMPANIES
    RESPONSIVE COMPANIES
    DYNAMIC COMPANIES
    STARTING BLOCKS
    COMPETITIVE BENCHMARKING: STARTUPS/SMES, 2023
    - Detailed list of key startups/SMEs
    - Competitive benchmarking of key startups/SMEs
  • 10.7 COMPANY VALUATION AND FINANCIAL METRICS
  • 10.8 COMPETITIVE SCENARIOS
    PRODUCT LAUNCHES
    DEALS
    EXPANSIONS
COMPANY PROFILES
171
  • 11.1 KEY COMPANIES
    NANORH
    - Business overview
    - Products/Solutions/Services offered
    - MnM view
    FRAMERGY, INC.
    - Business overview
    - Products/Solutions/Services offered
    - MnM view
    NOVOMOF
    - Business overview
    - Products/Solutions/Services offered
    - MnM view
    BASF SE
    - Business overview
    - Products/Solutions/Services offered
    - Recent developments
    - MnM view
    NUMAT TECHNOLOGIES, INC.
    - Business overview
    - Products/Solutions/Services offered
    - Recent developments
    - MnM view
    MOFAPPS
    - Business overview
    - Products/Solutions/Services offered
    - MnM view
    NUADA
    - Business overview
    - Products/Solutions/Services offered
    - Recent developments
    - MnM view
    PROFMOF
    - Business overview
    - Products/Solutions/Services offered
    - Recent developments
    - MnM view
    ACSYNAM
    - Business overview
    - Products/Solutions/Services offered
    - Recent developments
    - MnM view
    PROMETHEAN PARTICLES LTD.
    - Business overview
    - Products/Solutions/Services offered
    - Recent developments
    - MnM view
  • 11.2 OTHER PLAYERS
    ACMOFS
    GS ALLIANCE CO., LTD.
    PHYSICAL SCIENCES INC.
    MAJD ONSOR FARTAK
    SYNCMOF INC.
    IMMATERIAL LTD.
    ATOMIS INC.
    CD BIOPARTICLES
    NANOWIZ TECH
    KERONE ENGINEERING SOLUTIONS LTD.
    NANOSHEL LLC
    JIANGSU XIANFENG NANOMATERIAL TECHNOLOGY CO., LTD.
    DECARBONTEK, INC.
    SVANTE TECHNOLOGIES INC.
    NANOCHEMAZONE
APPENDIX
209
  • 12.1 DISCUSSION GUIDE
  • 12.2 KNOWLEDGESTORE: MARKETSANDMARKETS’ SUBSCRIPTION PORTAL
  • 12.3 CUSTOMIZATION OPTIONS
  • 12.4 RELATED REPORTS
  • 12.5 AUTHOR DETAILS
LIST OF TABLES
 
  • TABLE 1 METAL ORGANIC FRAMEWORKS MARKET: PORTER’S FIVE FORCES ANALYSIS
  • TABLE 2 METAL ORGANIC FRAMEWORKS MARKET: ROLE OF COMPANIES IN ECOSYSTEM
  • TABLE 3 AVERAGE SELLING PRICE TREND, BY REGION
  • TABLE 4 COMPARATIVE STUDY OF METAL ORGANIC FRAMEWORK MANUFACTURING PROCESSES
  • TABLE 5 TOP USE CASES AND MARKET POTENTIAL
  • TABLE 6 BEST PRACTICES: COMPANIES IMPLEMENTING USE CASES
  • TABLE 7 CASE STUDIES OF GEN AI IMPLEMENTATION IN METAL ORGANIC FRAMEWORKS MARKET
  • TABLE 8 INFLUENCE OF STAKEHOLDERS ON BUYING PROCESS FOR TOP THREE APPLICATIONS IN METAL ORGANIC FRAMEWORKS MARKET
  • TABLE 9 KEY BUYING CRITERIA FOR TOP THREE APPLICATIONS IN METAL ORGANIC FRAMEWORKS MARKET
  • TABLE 10 METAL ORGANIC FRAMEWORKS MARKET: TOTAL NUMBER OF PATENTS
  • TABLE 11 LIST OF PATENTS BY ZHEJIANG UNIVERSITY
  • TABLE 12 LIST OF PATENTS BY KING ABDULLAH UNIVERSITY OF SCIENCE & TECHNOLOGY
  • TABLE 13 NORTH AMERICA: REGULATORY BODIES, GOVERNMENT AGENCIES, AND OTHER ORGANIZATIONS
  • TABLE 14 EUROPE: REGULATORY BODIES, GOVERNMENT AGENCIES, AND OTHER ORGANIZATIONS
  • TABLE 15 ASIA PACIFIC: REGULATORY BODIES, GOVERNMENT AGENCIES, AND OTHER ORGANIZATIONS
  • TABLE 16 METAL ORGANIC FRAMEWORKS MARKET: KEY CONFERENCES AND EVENTS, 2024–2025
  • TABLE 17 METAL ORGANIC FRAMEWORKS MARKET, BY TYPE, 2022–2030 (USD MILLION)
  • TABLE 18 METAL ORGANIC FRAMEWORKS MARKET, BY TYPE, 2022–2030 (KILOGRAM)
  • TABLE 19 ZINC-BASED METAL ORGANIC FRAMEWORKS MARKET, BY REGION, 2022–2030 (USD MILLION)
  • TABLE 20 ZINC-BASED METAL ORGANIC FRAMEWORKS MARKET, BY REGION, 2022–2030 (KILOGRAM)
  • TABLE 21 COPPER-BASED METAL ORGANIC FRAMEWORKS MARKET, BY REGION, 2022–2030 (USD MILLION)
  • TABLE 22 COPPER-BASED METAL ORGANIC FRAMEWORKS MARKET, BY REGION, 2022–2030 (KILOGRAM)
  • TABLE 23 IRON-BASED METAL ORGANIC FRAMEWORKS MARKET, BY REGION, 2022–2030 (USD MILLION)
  • TABLE 24 IRON-BASED METAL ORGANIC FRAMEWORKS MARKET, BY REGION, 2022–2030 (KILOGRAM)
  • TABLE 25 ALUMINUM-BASED METAL ORGANIC FRAMEWORKS MARKET, BY REGION, 2022–2030 (USD MILLION)
  • TABLE 26 ALUMINUM-BASED METAL ORGANIC FRAMEWORKS MARKET, BY REGION, 2022–2030 (KILOGRAM)
  • TABLE 27 CHROMIUM-BASED METAL ORGANIC FRAMEWORKS MARKET, BY REGION, 2022–2030 (USD MILLION)
  • TABLE 28 CHROMIUM-BASED METAL ORGANIC FRAMEWORKS MARKET, BY REGION, 2022–2030 (KILOGRAM)
  • TABLE 29 OTHER TYPES: METAL ORGANIC FRAMEWORKS MARKET, BY REGION, 2022–2030 (USD MILLION)
  • TABLE 30 OTHER TYPES: METAL ORGANIC FRAMEWORKS MARKET, BY REGION, 2022–2030 (KILOGRAM)
  • TABLE 31 METAL ORGANIC FRAMEWORKS MARKET, BY SYNTHESIS METHOD, 2022–2030 (USD MILLION)
  • TABLE 32 METAL ORGANIC FRAMEWORKS MARKET, BY SYNTHESIS METHOD, 2022–2030 (KILOGRAM)
  • TABLE 33 SOLVOTHERMAL/HYDROTHERMAL: METAL ORGANIC FRAMEWORKS MARKET, BY REGION, 2022–2030 (USD MILLION)
  • TABLE 34 SOLVOTHERMAL/HYDROTHERMAL: METAL ORGANIC FRAMEWORKS MARKET, BY REGION, 2022–2030 (KILOGRAM)
  • TABLE 35 SONOCHEMICAL: METAL ORGANIC FRAMEWORKS MARKET, BY REGION, 2022–2030 (USD MILLION)
  • TABLE 36 SONOCHEMICAL: METAL ORGANIC FRAMEWORKS MARKET, BY REGION, 2022–2030 (KILOGRAM)
  • TABLE 37 MICROWAVE-ASSISTED: METAL ORGANIC FRAMEWORKS MARKET, BY REGION, 2022–2030 (USD MILLION)
  • TABLE 38 MICROWAVE-ASSISTED: METAL ORGANIC FRAMEWORKS MARKET, BY REGION, 2022–2030 (KILOGRAM)
  • TABLE 39 MECHANOCHEMICAL: METAL ORGANIC FRAMEWORKS MARKET, BY REGION, 2022–2030 (USD MILLION)
  • TABLE 40 MECHANOCHEMICAL: METAL ORGANIC FRAMEWORKS MARKET, BY REGION, 2022–2030 (KILOGRAM)
  • TABLE 41 ELECTROCHEMICAL: METAL ORGANIC FRAMEWORKS MARKET, BY REGION, 2022–2030 (USD MILLION)
  • TABLE 42 ELECTROCHEMICAL: METAL ORGANIC FRAMEWORKS MARKET, BY REGION, 2022–2030 (KILOGRAM)
  • TABLE 43 OTHER SYNTHESIS METHODS: METAL ORGANIC FRAMEWORKS MARKET, BY REGION, 2022–2030 (USD MILLION)
  • TABLE 44 OTHER SYNTHESIS METHODS: METAL ORGANIC FRAMEWORKS MARKET, BY REGION, 2022–2030 (KILOGRAM)
  • TABLE 45 METAL ORGANIC FRAMEWORKS MARKET, BY APPLICATION, 2022–2030 (USD MILLION)
  • TABLE 46 METAL ORGANIC FRAMEWORKS MARKET, BY APPLICATION, 2022–2030 (KILOGRAM)
  • TABLE 47 GAS & LIQUID ABSORPTION/SEPARATION: METAL ORGANIC FRAMEWORKS MARKET, BY REGION, 2022–2030 (USD MILLION)
  • TABLE 48 GAS & LIQUID ABSORPTION/SEPARATION: METAL ORGANIC FRAMEWORKS MARKET, BY REGION, 2022–2030 (KILOGRAM)
  • TABLE 49 WATER HARVESTING: METAL ORGANIC FRAMEWORKS MARKET, BY REGION, 2022–2030 (USD MILLION)
  • TABLE 50 WATER HARVESTING: METAL ORGANIC FRAMEWORKS MARKET, BY REGION, 2022–2030 (KILOGRAM)
  • TABLE 51 GAS STORAGE: METAL ORGANIC FRAMEWORKS MARKET, BY REGION, 2022–2030 (USD MILLION)
  • TABLE 52 GAS STORAGE: METAL ORGANIC FRAMEWORKS MARKET, BY REGION, 2022–2030 (KILOGRAM)
  • TABLE 53 SENSING & DETECTING: METAL ORGANIC FRAMEWORKS MARKET, BY REGION, 2022–2030 (USD MILLION)
  • TABLE 54 SENSING & DETECTING: METAL ORGANIC FRAMEWORKS MARKET, BY REGION, 2022–2030 (KILOGRAM)
  • TABLE 55 CATALYSIS: METAL ORGANIC FRAMEWORKS MARKET, BY REGION, 2022–2030 (USD MILLION)
  • TABLE 56 CATALYSIS: METAL ORGANIC FRAMEWORKS MARKET, BY REGION, 2022–2030 (KILOGRAM)
  • TABLE 57 OTHER APPLICATIONS: METAL ORGANIC FRAMEWORKS MARKET, BY REGION, 2022–2030 (USD MILLION)
  • TABLE 58 OTHER APPLICATIONS: METAL ORGANIC FRAMEWORKS MARKET, BY REGION, 2022–2030 (KILOGRAM)
  • TABLE 59 METAL ORGANIC FRAMEWORKS, BY REGION, 2022–2030 (USD MILLION)
  • TABLE 60 METAL ORGANIC FRAMEWORKS, BY REGION, 2022–2030 (KILOGRAM)
  • TABLE 61 NORTH AMERICA: METAL ORGANIC FRAMEWORKS, BY COUNTRY, 2022–2030 (USD MILLION)
  • TABLE 62 NORTH AMERICA: METAL ORGANIC FRAMEWORKS, BY COUNTRY, 2022–2030 (KILOGRAM)
  • TABLE 63 NORTH AMERICA: METAL ORGANIC FRAMEWORKS, BY TYPE, 2022–2030 (USD MILLION)
  • TABLE 64 NORTH AMERICA: METAL ORGANIC FRAMEWORKS, BY TYPE, 2022–2030 (KILOGRAM)
  • TABLE 65 NORTH AMERICA: METAL ORGANIC FRAMEWORKS, BY SYNTHESIS METHOD, 2022–2030 (USD MILLION)
  • TABLE 66 NORTH AMERICA: METAL ORGANIC FRAMEWORKS, BY SYNTHESIS METHOD, 2022–2030 (KILOGRAM)
  • TABLE 67 NORTH AMERICA: METAL ORGANIC FRAMEWORKS, BY APPLICATION, 2022–2030 (USD MILLION)
  • TABLE 68 NORTH AMERICA: METAL ORGANIC FRAMEWORKS, BY APPLICATION, 2022–2030 (KILOGRAM)
  • TABLE 69 US: METAL ORGANIC FRAMEWORKS, BY APPLICATION, 2022–2030 (USD MILLION)
  • TABLE 70 US: METAL ORGANIC FRAMEWORKS, BY APPLICATION, 2022–2030 (KILOGRAM)
  • TABLE 71 CANADA: METAL ORGANIC FRAMEWORKS, BY END-USE INDUSTRY, 2022–2030 (USD MILLION)
  • TABLE 72 CANADA: METAL ORGANIC FRAMEWORKS, BY END-USE INDUSTRY, 2022–2030 (KILOGRAM)
  • TABLE 73 EUROPE: METAL ORGANIC FRAMEWORKS MARKET, BY TYPE, 2022–2030 (USD MILLION)
  • TABLE 74 EUROPE: METAL ORGANIC FRAMEWORKS MARKET, BY TYPE, 2022–2030 (KILOGRAM)
  • TABLE 75 EUROPE: METAL ORGANIC FRAMEWORKS MARKET, BY SYNTHESIS METHOD, 2022–2030 (USD MILLION)
  • TABLE 76 EUROPE: METAL ORGANIC FRAMEWORKS MARKET, BY SYNTHESIS METHOD, 2022–2030 (KILOGRAM)
  • TABLE 77 EUROPE: METAL ORGANIC FRAMEWORKS MARKET, BY APPLICATION, 2022–2030 (USD MILLION)
  • TABLE 78 EUROPE: METAL ORGANIC FRAMEWORKS MARKET, BY APPLICATION, 2022–2030 (KILOGRAM)
  • TABLE 79 EUROPE: METAL ORGANIC FRAMEWORKS MARKET, BY COUNTRY, 2022–2030 (USD MILLION)
  • TABLE 80 EUROPE: METAL ORGANIC FRAMEWORKS MARKET, BY COUNTRY, 2022–2030 (KILOGRAM)
  • TABLE 81 GERMANY: METAL ORGANIC FRAMEWORKS MARKET, BY APPLICATION, 2022–2030 (USD MILLION)
  • TABLE 82 GERMANY: METAL ORGANIC FRAMEWORKS MARKET, BY APPLICATION, 2022–2030 (KILOGRAM)
  • TABLE 83 FRANCE: METAL ORGANIC FRAMEWORKS MARKET, BY APPLICATION, 2022–2030 (USD MILLION)
  • TABLE 84 FRANCE: METAL ORGANIC FRAMEWORKS MARKET, BY APPLICATION, 2022–2030 (KILOGRAM)
  • TABLE 85 UK: METAL ORGANIC FRAMEWORKS MARKET, BY APPLICATION, 2022–2030 (USD MILLION)
  • TABLE 86 UK: METAL ORGANIC FRAMEWORKS MARKET, BY APPLICATION, 2022–2030 (KILOGRAM)
  • TABLE 87 ITALY: METAL ORGANIC FRAMEWORKS MARKET, BY APPLICATION, 2022–2030 (USD MILLION)
  • TABLE 88 ITALY: METAL ORGANIC FRAMEWORKS MARKET, BY APPLICATION, 2022–2030 (KILOGRAM)
  • TABLE 89 SPAIN: METAL ORGANIC FRAMEWORKS MARKET, BY APPLICATION, 2022–2030 (USD MILLION)
  • TABLE 90 SPAIN: METAL ORGANIC FRAMEWORKS MARKET, BY APPLICATION, 2022–2030 (KILOGRAM)
  • TABLE 91 REST OF EUROPE: METAL ORGANIC FRAMEWORKS MARKET, BY APPLICATION, 2022–2030 (USD MILLION)
  • TABLE 92 REST OF EUROPE: METAL ORGANIC FRAMEWORKS MARKET, BY APPLICATION, 2022–2030 (KILOGRAM)
  • TABLE 93 ASIA PACIFIC: METAL ORGANIC FRAMEWORKS, BY COUNTRY, 2022–2030 (USD MILLION)
  • TABLE 94 ASIA PACIFIC: METAL ORGANIC FRAMEWORKS, BY COUNTRY, 2022–2030 (KILOGRAM)
  • TABLE 95 ASIA PACIFIC: METAL ORGANIC FRAMEWORKS, BY SYNTHESIS METHOD, 2022–2030 (USD MILLION)
  • TABLE 96 ASIA PACIFIC: METAL ORGANIC FRAMEWORKS, BY SYNTHESIS METHOD, 2022–2030 (KILOGRAM)
  • TABLE 97 ASIA PACIFIC: METAL ORGANIC FRAMEWORKS, BY APPLICATION, 2022–2030 (USD MILLION)
  • TABLE 98 ASIA PACIFIC: METAL ORGANIC FRAMEWORKS, BY APPLICATION, 2022–2030 (KILOGRAM)
  • TABLE 99 ASIA PACIFIC: METAL ORGANIC FRAMEWORKS, BY TYPE, 2022–2030 (USD MILLION)
  • TABLE 100 ASIA PACIFIC: METAL ORGANIC FRAMEWORKS, BY TYPE, 2022–2030 (KILOGRAM)
  • TABLE 101 CHINA: METAL ORGANIC FRAMEWORKS, BY APPLICATION, 2022–2030 (USD MILLION)
  • TABLE 102 CHINA: METAL ORGANIC FRAMEWORKS, BY APPLICATION, 2022–2030 (KILOGRAM)
  • TABLE 103 INDIA: METAL ORGANIC FRAMEWORKS, BY APPLICATION, 2022–2030 (USD MILLION)
  • TABLE 104 INDIA: METAL ORGANIC FRAMEWORKS, BY APPLICATION, 2022–2030 (KILOGRAM)
  • TABLE 105 JAPAN: METAL ORGANIC FRAMEWORKS, BY APPLICATION, 2022–2030 (USD MILLION)
  • TABLE 106 JAPAN: METAL ORGANIC FRAMEWORKS, BY APPLICATION, 2022–2030 (KILOGRAM)
  • TABLE 107 SOUTH KOREA: METAL ORGANIC FRAMEWORKS, BY APPLICATION, 2022–2030 (USD MILLION)
  • TABLE 108 SOUTH KOREA: METAL ORGANIC FRAMEWORKS, BY APPLICATION, 2022–2030 (KILOGRAM)
  • TABLE 109 REST OF ASIA PACIFIC: METAL ORGANIC FRAMEWORKS, BY APPLICATION, 2022–2030 (USD MILLION)
  • TABLE 110 REST OF ASIA PACIFIC: METAL ORGANIC FRAMEWORKS, BY APPLICATION, 2022–2030 (KILOGRAM)
  • TABLE 111 LATIN AMERICA: METAL ORGANIC FRAMEWORKS, BY COUNTRY, 2022–2030 (USD MILLION)
  • TABLE 112 LATIN AMERICA: METAL ORGANIC FRAMEWORKS, BY COUNTRY, 2022–2030 (KILOGRAM)
  • TABLE 113 LATIN AMERICA: METAL ORGANIC FRAMEWORKS, BY TYPE, 2022–2030 (USD MILLION)
  • TABLE 114 LATIN AMERICA: METAL ORGANIC FRAMEWORKS, BY TYPE, 2022–2030 (KILOGRAM)
  • TABLE 115 LATIN AMERICA: METAL ORGANIC FRAMEWORKS, BY SYNTHESIS METHOD, 2022–2030 (USD MILLION)
  • TABLE 116 LATIN AMERICA: METAL ORGANIC FRAMEWORKS, BY SYNTHESIS METHOD, 2022–2030 (KILOGRAM)
  • TABLE 117 LATIN AMERICA: METAL ORGANIC FRAMEWORKS, BY APPLICATION, 2022–2030 (USD MILLION)
  • TABLE 118 LATIN AMERICA: METAL ORGANIC FRAMEWORKS, BY APPLICATION, 2022–2030 (KILOGRAM)
  • TABLE 119 MEXICO: METAL ORGANIC FRAMEWORKS, BY APPLICATION, 2022–2030 (USD MILLION)
  • TABLE 120 MEXICO: METAL ORGANIC FRAMEWORKS, BY APPLICATION, 2022–2030 (KILOGRAM)
  • TABLE 121 BRAZIL: METAL ORGANIC FRAMEWORKS, BY APPLICATION, 2022–2030 (USD MILLION)
  • TABLE 122 BRAZIL: METAL ORGANIC FRAMEWORKS, BY APPLICATION, 2022–2030 (KILOGRAM)
  • TABLE 123 REST OF LATIN AMERICA: METAL ORGANIC FRAMEWORKS, BY APPLICATION, 2022–2030 (USD MILLION)
  • TABLE 124 REST OF LATIN AMERICA: METAL ORGANIC FRAMEWORKS, BY APPLICATION, 2022–2030 (KILOGRAM)
  • TABLE 125 MIDDLE EAST & AFRICA: METAL ORGANIC FRAMEWORKS, BY TYPE, 2022–2030 (USD MILLION)
  • TABLE 126 MIDDLE EAST & AFRICA: METAL ORGANIC FRAMEWORKS, BY TYPE, 2022–2030 (KILOGRAM)
  • TABLE 127 MIDDLE EAST & AFRICA: METAL ORGANIC FRAMEWORKS, BY SYNTHESIS METHOD, 2022–2030 (USD MILLION)
  • TABLE 128 MIDDLE EAST & AFRICA: METAL ORGANIC FRAMEWORKS, BY SYNTHESIS METHOD, 2022–2030 (KILOGRAM)
  • TABLE 129 MIDDLE EAST & AFRICA: METAL ORGANIC FRAMEWORKS, BY APPLICATION, 2022–2030 (USD MILLION)
  • TABLE 130 MIDDLE EAST & AFRICA: METAL ORGANIC FRAMEWORKS, BY APPLICATION, 2022–2030 (KILOGRAM)
  • TABLE 131 MIDDLE EAST & AFRICA: METAL ORGANIC FRAMEWORKS, BY COUNTRY, 2022–2030 (USD MILLION)
  • TABLE 132 MIDDLE EAST & AFRICA: METAL ORGANIC FRAMEWORKS, BY COUNTRY, 2022–2030 (KILOGRAM)
  • TABLE 133 UAE: METAL ORGANIC FRAMEWORKS, BY APPLICATION, 2022–2030 (USD MILLION)
  • TABLE 134 UAE: METAL ORGANIC FRAMEWORKS, BY APPLICATION, 2022–2030 (KILOGRAM)
  • TABLE 135 SAUDI ARABIA: METAL ORGANIC FRAMEWORKS, BY APPLICATION, 2022–2030 (USD MILLION)
  • TABLE 136 SAUDI ARABIA: METAL ORGANIC FRAMEWORKS, BY APPLICATION, 2022–2030 (KILOGRAM)
  • TABLE 137 REST OF GCC COUNTRIES: METAL ORGANIC FRAMEWORKS, BY APPLICATION, 2022–2030 (USD MILLION)
  • TABLE 138 REST OF GCC COUNTRIES: METAL ORGANIC FRAMEWORKS, BY END-USE INDUSTRY, 2022–2030 (KILOGRAM)
  • TABLE 139 SOUTH AFRICA: METAL ORGANIC FRAMEWORKS, BY APPLICATION, 2022–2030 (USD MILLION)
  • TABLE 140 SOUTH AFRICA: METAL ORGANIC FRAMEWORKS, BY APPLICATION, 2022–2030 (KILOGRAM)
  • TABLE 141 REST OF MIDDLE EAST AND AFRICA: METAL ORGANIC FRAMEWORKS, BY APPLICATION, 2022–2030 (USD MILLION)
  • TABLE 142 REST OF MIDDLE EAST AND AFRICA: METAL ORGANIC FRAMEWORKS, BY APPLICATION, 2022–2030 (KILOGRAM)
  • TABLE 143 METAL ORGANIC FRAMEWORKS MARKET: KEY STRATEGIES ADOPTED BY MAJOR METAL ORGANIC FRAMEWORKS MANUFACTURERS
  • TABLE 144 METAL ORGANIC FRAMEWORKS MARKET: DEGREE OF COMPETITION, 2023
  • TABLE 145 METAL ORGANIC FRAMEWORKS MARKET: TYPE FOOTPRINT
  • TABLE 146 METAL ORGANIC FRAMEWORKS MARKET: SYNTHESIS METHOD FOOTPRINT
  • TABLE 147 METAL ORGANIC FRAMEWORKS MARKET: APPLICATION FOOTPRINT
  • TABLE 148 METAL ORGANIC FRAMEWORKS MARKET: REGION FOOTPRINT
  • TABLE 149 METAL ORGANIC FRAMEWORKS MARKET: DETAILED LIST OF KEY STARTUPS/SMES
  • TABLE 150 METAL ORGANIC FRAMEWORKS MARKET: COMPETITIVE BENCHMARKING OF KEY STARTUPS/SMES
  • TABLE 151 METAL ORGANIC FRAMEWORKS MARKET: PRODUCT LAUNCHES, JANUARY 2018–AUGUST 2024
  • TABLE 152 METAL ORGANIC FRAMEWORKS MARKET: DEALS, JANUARY 2018–JANUARY 2024
  • TABLE 153 METAL ORGANIC FRAMEWORKS MARKET: EXPANSIONS, JANUARY 2018–AUGUST 2024
  • TABLE 154 NANORH: COMPANY OVERVIEW
  • TABLE 155 NANORH: PRODUCTS/SOLUTIONS/SERVICES OFFERED
  • TABLE 156 FRAMERGY, INC.: COMPANY OVERVIEW
  • TABLE 157 FRAMERGY, INC.: PRODUCTS/SOLUTIONS/SERVICES OFFERED
  • TABLE 158 NOVOMOF: COMPANY OVERVIEW
  • TABLE 159 NOVOMOF: PRODUCTS/SOLUTIONS/SERVICES OFFERED
  • TABLE 160 BASF SE: COMPANY OVERVIEW
  • TABLE 161 BASF SE: PRODUCTS/SOLUTIONS/SERVICES OFFERED
  • TABLE 162 BASF SE: DEALS, JANUARY 2018–AUGUST 2024
  • TABLE 163 NUMAT TECHNOLOGIES, INC.: COMPANY OVERVIEW
  • TABLE 164 NUMAT TECHNOLOGIES, INC.: PRODUCTS/SOLUTIONS/SERVICES OFFERED
  • TABLE 165 NUMAT TECHNOLOGIES, INC.: PRODUCT LAUNCHES, JANUARY 2018–AUGUST 2024
  • TABLE 166 NUMAT TECHNOLOGIES, INC.: EXPANSIONS, JANUARY 2018–AUGUST 2024
  • TABLE 167 MOFAPPS: COMPANY OVERVIEW
  • TABLE 168 MOFAPPS: PRODUCTS/SOLUTIONS/SERVICES OFFERED
  • TABLE 169 NUADA: COMPANY OVERVIEW
  • TABLE 170 NUADA: PRODUCTS/SOLUTIONS/SERVICES OFFERED
  • TABLE 171 NUADA: DEALS, JANUARY 2018–AUGUST 2024
  • TABLE 172 NUADA: EXPANSIONS, JANUARY 2018–AUGUST 2024
  • TABLE 173 PROFMOF: COMPANY OVERVIEW
  • TABLE 174 PROFMOF: PRODUCTS/SOLUTIONS/SERVICES OFFERED
  • TABLE 175 PROFMOF: DEALS, JANUARY 2018–AUGUST 2024
  • TABLE 176 ACSYNAM: COMPANY OVERVIEW
  • TABLE 177 ACSYNAM: PRODUCTS/SOLUTIONS/SERVICES OFFERED
  • TABLE 178 ACSYNAM: DEALS, JANUARY 2018–AUGUST 2024
  • TABLE 179 PROMETHEAN PARTICLES LTD.: COMPANY OVERVIEW
  • TABLE 180 PROMETHEAN PARTICLES LTD.: PRODUCTS/SOLUTIONS/SERVICES OFFERED
  • TABLE 181 PROMETHEAN PARTICLES LTD.: DEALS, JANUARY 2018–AUGUST 2024
  • TABLE 182 ACMOFS: COMPANY OVERVIEW
  • TABLE 183 GS ALLIANCE CO., LTD.: COMPANY OVERVIEW
  • TABLE 184 PHYSICAL SCIENCES INC.: COMPANY OVERVIEW
  • TABLE 185 MAJD ONSOR FARTAK: COMPANY OVERVIEW
  • TABLE 186 SYNCMOF INC.: COMPANY OVERVIEW
  • TABLE 187 IMMATERIAL LTD.: COMPANY OVERVIEW
  • TABLE 188 ATOMIS INC.: COMPANY OVERVIEW
  • TABLE 189 CD BIOPARTICLES: COMPANY OVERVIEW
  • TABLE 190 NANOWIZ TECH: COMPANY OVERVIEW
  • TABLE 191 KERONE ENGINEERING SOLUTIONS LTD.: COMPANY OVERVIEW
  • TABLE 192 NANOSHEL LLC: COMPANY OVERVIEW
  • TABLE 193 JIANGSU XIANFENG NANOMATERIAL TECHNOLOGY CO., LTD.: COMPANY OVERVIEW
  • TABLE 194 DECARBONTEK, INC.: COMPANY OVERVIEW
  • TABLE 195 SVANTE TECHNOLOGIES INC.: COMPANY OVERVIEW
  • TABLE 196 NANOCHEMAZONE: COMPANY OVERVIEW
LIST OF FIGURES
 
  • FIGURE 1 METAL ORGANIC FRAMEWORKS MARKET SEGMENTATION
  • FIGURE 2 METAL ORGANIC FRAMEWORKS MARKET: RESEARCH DESIGN
  • FIGURE 3 METAL ORGANIC FRAMEWORKS MARKET: BOTTOM-UP APPROACH
  • FIGURE 4 METAL ORGANIC FRAMEWORKS MARKET: TOP-DOWN APPROACH
  • FIGURE 5 DATA TRIANGULATION
  • FIGURE 6 COPPER-BASED METAL ORGANIC FRAMEWORKS ACCOUNTED FOR LARGEST MARKET SHARE IN 2023
  • FIGURE 7 SOLVOTHERMAL/HYDROTHERMAL SYNTHESIS METHOD TO REGISTER HIGHEST CAGR DURING FORECAST PERIOD
  • FIGURE 8 GAS STORAGE APPLICATION SEGMENT ACCOUNTED FOR LARGEST MARKET SHARE IN 2023
  • FIGURE 9 NORTH AMERICA TO REGISTER HIGHEST GROWTH DURING FORECAST PERIOD
  • FIGURE 10 EMERGING APPLICATIONS FOR METAL ORGANIC FRAMEWORKS TO DRIVE MARKET
  • FIGURE 11 COPPER-BASED SEGMENT ACCOUNTED FOR LARGEST MARKET SHARE IN 2023
  • FIGURE 12 SOLVOTHERMAL/HYDROTHERMAL SYNTHESIS METHOD ACCOUNTED FOR LARGEST MARKET SHARE IN 2023
  • FIGURE 13 ASIA PACIFIC ACCOUNTED FOR LARGEST SHARE IN 2023
  • FIGURE 14 US TO REGISTER HIGHEST GROWTH DURING FORECAST PERIOD
  • FIGURE 15 DRIVERS, RESTRAINTS, OPPORTUNITIES, AND CHALLENGES IN METAL ORGANIC FRAMEWORKS MARKET
  • FIGURE 16 METAL ORGANIC FRAMEWORKS MARKET: PORTER’S FIVE FORCES ANALYSIS
  • FIGURE 17 METAL ORGANIC FRAMEWORKS MARKET: SUPPLY CHAIN ANALYSIS
  • FIGURE 18 METAL ORGANIC FRAMEWORKS MARKET: KEY STAKEHOLDERS IN ECOSYSTEM
  • FIGURE 19 METAL ORGANIC FRAMEWORKS MARKET: ECOSYSTEM
  • FIGURE 20 AVERAGE SELLING PRICE TREND OF KEY PLAYERS, BY TYPE, 2023
  • FIGURE 21 AVERAGE SELLING PRICE OF METAL ORGANIC FRAMEWORKS, BY TYPE (USD/KG), 2023
  • FIGURE 22 AVERAGE SELLING PRICE OF METAL ORGANIC FRAMEWORKS, BY SYNTHESIS METHOD (USD/KG), 2023
  • FIGURE 23 AVERAGE SELLING PRICE OF METAL ORGANIC FRAMEWORKS, BY APPLICATION (USD/KG), 2023
  • FIGURE 24 METAL ORGANIC FRAMEWORKS MARKET: VALUE CHAIN ANALYSIS
  • FIGURE 25 INFLUENCE OF STAKEHOLDERS ON BUYING PROCESS FOR TOP THREE APPLICATIONS
  • FIGURE 26 KEY BUYING CRITERIA FOR TOP THREE APPLICATIONS
  • FIGURE 27 PATENT ANALYSIS, BY DOCUMENT TYPE
  • FIGURE 28 PATENT PUBLICATION TREND, 2014−2024
  • FIGURE 29 METAL ORGANIC FRAMEWORKS MARKET: LEGAL STATUS OF PATENTS
  • FIGURE 30 CHINESE JURISDICTION REGISTERED HIGHEST NUMBER OF PATENTS
  • FIGURE 31 UNIVERSITY OF CALIFORNIA REGISTERED HIGHEST NUMBER OF PATENTS
  • FIGURE 32 TRENDS/DISRUPTIONS IMPACTING CUSTOMER BUSINESS IN METAL ORGANIC FRAMEWORKS MARKET
  • FIGURE 33 DEALS AND FUNDING IN METAL ORGANIC FRAMEWORKS MARKET SOARED IN 2022
  • FIGURE 34 PROMINENT METAL ORGANIC FRAMEWORKS MANUFACTURING FIRMS IN 2024 (USD BILLION)
  • FIGURE 35 COPPER-BASED SEGMENT TO HOLD LARGEST SHARE OF METAL ORGANIC FRAMEWORKS MARKET
  • FIGURE 36 SOLVOTHERMAL/HYDROTHERMAL SEGMENT TO DOMINATE METAL ORGANIC FRAMEWORKS MARKET DURING FORECAST PERIOD
  • FIGURE 37 GAS & LIQUID ABSORPTION/SEPARATION SEGMENT TO DOMINATE METAL ORGANIC FRAMEWORKS MARKET DURING FORECAST PERIOD
  • FIGURE 38 US TO REGISTER HIGHEST GROWTH DURING FORECAST PERIOD
  • FIGURE 39 NORTH AMERICA: METAL ORGANIC FRAMEWORKS MARKET SNAPSHOT
  • FIGURE 40 EUROPE: METAL ORGANIC FRAMEWORKS MARKET SNAPSHOT
  • FIGURE 41 ASIA PACIFIC: METAL ORGANIC FRAMEWORKS MARKET SNAPSHOT
  • FIGURE 42 METAL ORGANIC FRAMEWORKS MARKET SHARE ANALYSIS, 2023
  • FIGURE 43 METAL ORGANIC FRAMEWORKS MARKET: RANKING OF TOP FIVE PLAYERS
  • FIGURE 44 METAL ORGANIC FRAMEWORKS MARKET: TOP TRENDING BRAND/PRODUCTS
  • FIGURE 45 METAL ORGANIC FRAMEWORKS MARKET: BRAND/PRODUCT COMPARATIVE ANALYSIS
  • FIGURE 46 METAL ORGANIC FRAMEWORKS MARKET: COMPANY EVALUATION MATRIX (KEY PLAYERS), 2023
  • FIGURE 47 METAL ORGANIC FRAMEWORKS MARKET: COMPANY FOOTPRINT (10 COMPANIES)
  • FIGURE 48 METAL ORGANIC FRAMEWORKS MARKET: COMPANY EVALUATION MATRIX (STARTUPS/SMES), 2023
  • FIGURE 49 METAL ORGANIC FRAMEWORKS MARKET: EV/EBITDA OF KEY MANUFACTURERS
  • FIGURE 50 METAL ORGANIC FRAMEWORKS MARKET: YEAR-TO-DATE (YTD) PRICE TOTAL RETURN AND 5-YEAR STOCK BETA OF KEY MARKET PLAYERS
  • FIGURE 51 BASF SE: COMPANY SNAPSHOT

The study involves two major activities in estimating the current market size for metal organic frameworks market. Exhaustive secondary research was done to collect information on the market, peer market, and parent market. The next step was to validate these findings, assumptions, and sizing with industry experts across the value chain through primary research. Both top-down and bottom-up approaches were employed to estimate the complete market size. After that, market breakdown and data triangulation were used to estimate the market size of segments and subsegments.

Secondary Research

Secondary sources referred to for this research study include financial statements of companies offering metal organic frameworks and information from various trade, business, and professional associations. Secondary research has been used to obtain critical information about the industry’s value chain, the total pool of key players, market classification, and segmentation according to industry trends to the bottom-most level and regional markets. The secondary data was collected and analyzed to arrive at the overall size of the metal organic frameworks market, which was validated by primary respondents.

Primary Research

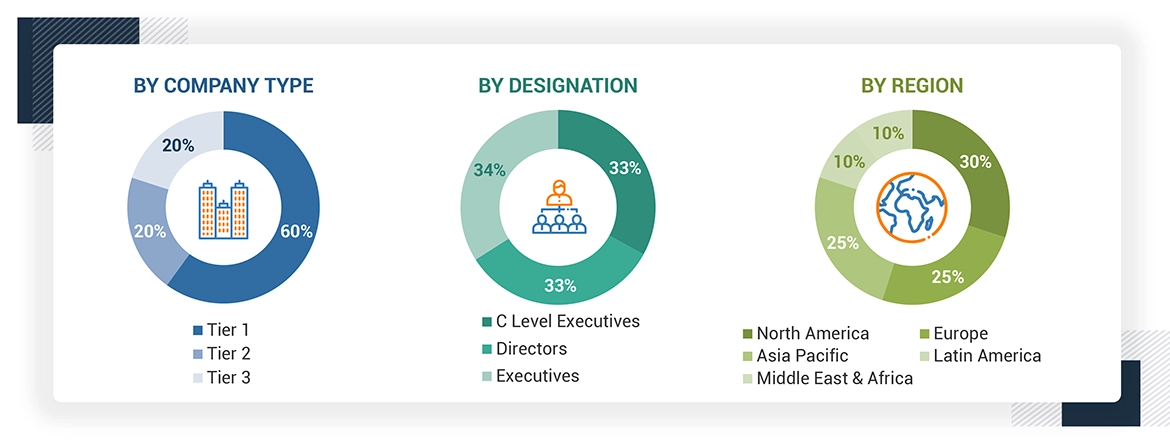
Extensive primary research was conducted after obtaining information regarding the metal organic frameworks market scenario through secondary research. Several primary interviews were conducted with market experts from both the demand and supply sides across major countries of North America, Europe, Asia Pacific, the Middle East & Africa, and Latin America. Primary data was collected through questionnaires, emails, and telephonic interviews. The primary sources from the supply side included various industry experts, such as Chief X Officers (CXOs), Vice Presidents (VPs), Directors from business development, marketing, product development/innovation teams, and related key executives from metal organic frameworks vendors; system integrators; component providers; distributors; and key opinion leaders. Primary interviews were conducted to gather insights such as market statistics, data on revenue collected from the products and services, market breakdowns, market size estimations, market forecasting, and data triangulation. Primary research also helped in understanding the various trends related to type, synthesis method, application, and region. Stakeholders from the demand side, such as CIOs, CTOs, CSOs, and installation teams of the customer/end users who are using metal organic frameworks, were interviewed to understand the buyer’s perspective on the suppliers, products, component providers, and their current usage of metal organic frameworks and future outlook of their business which will affect the overall market.

The Breakup of Primary Research:
To know about the assumptions considered for the study, download the pdf brochure

Market Size Estimation

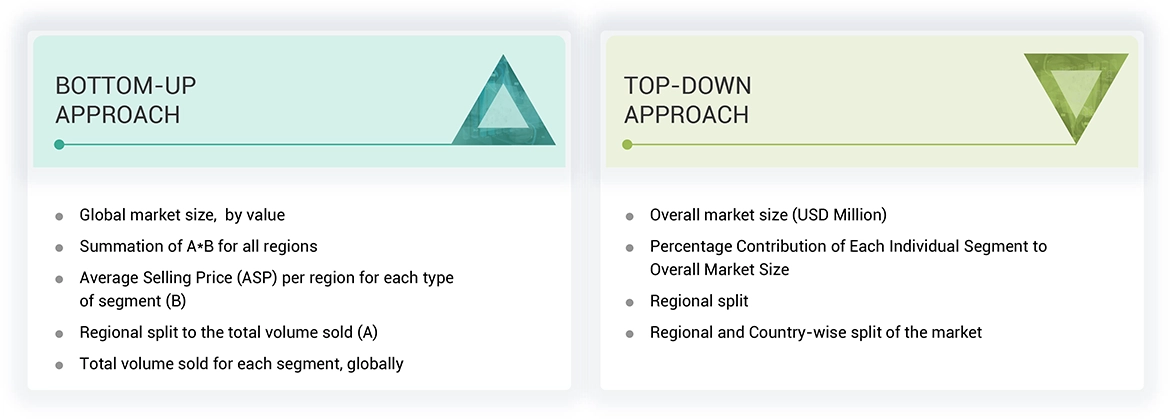
The research methodology used to estimate the size of the metal organic frameworks market includes the following details. The market sizing of the market was undertaken from the demand side. The market was upsized based on procurements and modernizations in metal organic frameworks in different applications at a regional level. Such procurements provide information on the demand aspects of the metal organic frameworks industry for each application. For each application, all possible segments of the metal organic frameworks market were integrated and mapped.
Data Triangulation

After arriving at the overall size from the market size estimation process explained above, the total market was split into several segments and subsegments. The data triangulation and market breakdown procedures explained below were implemented, wherever applicable, to complete the overall market engineering process and arrive at the exact statistics for various market segments and subsegments. The data was triangulated by studying various factors and trends from the demand and supply sides. Along with this, the market size was validated using both the top-down and bottom-up approaches.

Market Definition

Metal organic frameworks are a class of porous, crystalline materials composed of metal ions or clusters coordinated to organic ligands to form one-, two-, or three-dimensional structures. High porosity, ultrahigh surface areas, structural diversity and tunable porosity and functionality through variation of metal and linker make metal organic frameworks attractive for applications in gas and liquid adsorption/separation, gas storage, catalysis, sensing & detection, and more.

Stakeholders

  • Metal organic frameworks manufacturers
  • Raw material suppliers
  • Researchers and scientists
  • Industry associations
  • End-use industries such as energy, pharmaceutical, chemical, and industrial
  • Regional manufacturers’ associations and general metal organic frameworks associations
  • Government and regional agencies and research organizations

Report Objectives

  • To define, describe, and forecast the metal organic frameworks market size in terms of volume and value.
  • To provide detailed information regarding the key factors, such as drivers, restraints, opportunities, and challenges influencing market growth
  • To analyze and project the global metal organic frameworks market by type, synthesis method, application, and region.
  • To forecast the market size concerning five main regions (along with country-level data), namely, North America, Europe, Asia Pacific, Latin America, and the Middle East & Africa, and analyze the significant region-specific trends.
  • To strategically analyze micromarkets with respect to individual growth trends, prospects, and contributions of the submarkets to the overall market
  • To analyze the market opportunities and the competitive landscape for stakeholders and market leaders
  • To assess recent market developments and competitive strategies, such as agreements, contracts, acquisitions, and new product developments/new product launches, to draw the competitive landscape.
  • To strategically profile the key market players and comprehensively analyze their core competencies.

Previous Versions of this Report

Custom Market Research Services

We Will Customise The Research For You, In Case The Report Listed Above Does Not Meet With Your Requirements

Get 10% Free Customisation

Growth opportunities and latent adjacency in Metal Organic Frameworks Market

DMCA.com Protection Status