Mesh Gateway Market Size, Share, Industry and Trends

Mesh Gateway Market by Offering, Location Type (Indoor, Outdoor), Application, End User Industry (Manufacturing, Energy & Utilities, Agriculture, Retail & Logistics, Transportation, Metal & Mining) and Region - Global Forecast to 2029

Report Code: SE 9074 Jul, 2024, by marketsandmarkets.com

[189 Pages Report] The mesh gateway market size is expected to be USD 1.3 billion in 2024 It is anticipated to be USD 2.2 billion by 2029, growing at a CAGR of 11.5% during the forecast period. Factors such as the increasing adoption of mesh gateways in industrial automation to improve efficiency, productivity, and the safety of day-to-day operations drive the market for mesh gateways during the forecast period.

Mesh Gateway Market

Mesh Gateway Market

Mesh Gateway Market Forecast to 2029

To know about the assumptions considered for the study, Request for Free Sample Report

Mesh Gateway Market Dynamics

Driver: Rise in industrial automation

The advancement in industrial automation is driving the Demand for mesh gateways. Mesh gateways in an industrial automation setup help with reliable and efficient communications. Industries are trying to automate their activities without human intervention to make the process smooth and safe. With the help of mesh gateways, industries can get benefits like remote monitoring, real-time access to data, and predictive maintenance. This helps the organization secure and maintain machines' long life and improve performance using real-time data. As innovative industry initiatives around the globe are increasing, Demand for mesh gays in industrial automation setups is also expected to grow during the forecast period.

Restraint: Higher initial cost and complex setup

Mesh networking system deployment's initial cost is expensive compared to any traditional wireless networking system. The individual mesh nodes are still affordable, but a system needs multiple nodes to ensure a proper wireless network throughout the premises where it is installed. Companies with budget constraints might hesitate to make investments, which act as a restraint for the market. While many systems are designed to be user-friendly, some users might need help with configuring multiple devices and creating a mesh network. This can discourage some potential customers from considering mesh gateways.

Opportunity: Increasing adoption of mesh gateways in SMEs

Mesh gateways have considerable opportunities for small and medium-sized enterprises. As traditional wireless networking systems have shortcomings with consistent networks and coverage of large areas, mesh gateways can help with the problems. As mesh networking has multiple interconnected nodes, a consistent and reliable network is established, which is very useful in large premises and hazardous environments for continuous monitoring and assessments. Mesh gateways are very user friendly with simple installation processes and easy management through apps or web interfaces, reducing the need for specialized technical knowledge, making it ideal for SMEs.

Challenge: Data Security and privacy concerns

Data security and privacy concerns are significant challenges in the mesh gateway market. Mesh gateways are prone to cyber attacks like hacking and malware. In mesh gateways, any node can act as an energy point, giving attackers significant opportunities to control the systems. If any node is compromised, hackers can control the entire system. Security across multiple nodes is complex and requires surveillance to ensure firmware updates, consistent security settings, and encryption. Compliance and data privacy regulations such GDPR, CCPA, or HIPAA also complicate matters for security measures to protect personal data and meet legal requirements. Addressing the problems mentioned above can act as a challenge for the mesh gateway market.

Mesh Gateway Market Map:

Mesh Gateway Market by Map

Predictive maintenance is expected to have the highest market growth during the forecast period.

Predictive maintenance is expected to have the highest CAGR growth during the forecast period. Predictive maintenance helps industries access the system's condition with real-time monitoring and data. It helps companies make changes and adjustments before the failure of the machine. This approach helps companies reduce maintenance costs, increase machines' lives, and improve the overall management of operations. With the rise in IoT technologies and Industry 4.0, the market for predictive maintenance in the mesh gateway market is expected to grow during the forecast period.

Retail & logistics application is expected to have significant market share during the forecast period.

The retail & logistics industry is involved in selling goods to consumers. Multiple steps are involved while selling goods to the consumers. Constant monitoring, asset management, and predictive maintenance are involved in the whole process. By having mesh gateways in the organization, retail & logistic companies can have reliable connectivity in massive warehouses and company spaces, among others. The company can remotely monitor the products, efficiently manage assets, and perform predictive maintenance for future product requirements. By using mesh gateways, the company improves efficiency, has better data collection, and improves future management of products, and hence, the market for mesh gateways is growing in the mesh retail & logistics industry.

Services to have is expected to have highest CAGR during the forecast period.

Services include professional services, i.e., the deployment of mesh gateways, and integration, and management services, including support and maintenance. The deployment of mesh gateways requires a lot of specifics like the purpose of the network, size of the area for networking, and operation frequency, among others. Professional services, hence, play a very important role in the installation of the mesh gateway network in any premises. After the installation of the networking, managed services play an important role as constant checkups of the network are required for its efficiency. Management services consist of monitoring the position of the network, troubleshooting the errors, and helping with regular updates. These services collectively played very important roles in the mesh gateway market.

Asia Pacific will grow with the highest CAGR during the forecast period.

The growth of the mesh gateway market in the Asia Pacific can be attributed to the rise in manufacturing and government initiatives in the region. Countries like China, South Korea, and India will play a significant role in this growth. For instance, Government initiatives like Wi-Fi Access Interface (WANI) by the Indian government launched in December 2020 to develop a wireless network across public locations nationwide. It will help build a wireless network communication infrastructure in the country. The government initiatives like these are improving wireless networking in the public and industrial sectors, which will boost the mesh gateway market during the forecast period.

Mesh Gateway Market by Region

Mesh Gateway Market by Region

To know about the assumptions considered for the study, download the pdf brochure

Key Market Players

The mesh gateway companies is dominated by a few globally established players such Eaton (Ireland), Honeywell International, Inc. (US), Siemens (Germany), Emerson Electric Co. (US), Schneider Electric SE (France), Advantech Co., Ltd. (Taiwan), HDL Automation (China), RSAE Labs Inc. (US), Wirepas Ltd (Finland), Dryad Networks GmbH (Germany) and AsiaRF Co., Ltd (Taiwan), Phoenix Contact (Germany), Westermo (Sweden), Tuya Inc. (China), Ackcio (Singapore), DusunIoT (China), Rajant Corporation (US), Quectel (China), NEXCOM International Co., Ltd. (Taiwan), Weidmüller Group (Germany), Digi International, Inc. (US), Kerlink (France), Milesight (US), Shanghai MXCHIP Information Technology Co., Ltd.(China), Actility (France).

Get online access to the report on the World's First Market Intelligence Cloud

  • Easy to Download Historical Data & Forecast Numbers
  • Company Analysis Dashboard for high growth potential opportunities
  • Research Analyst Access for customization & queries
  • Competitor Analysis with Interactive dashboard
  • Latest News, Updates & Trend analysis
Request Sample

Scope of the Report

Report Metric

Details

Market size available for years

2020-2029

Base year considered

2023

Forecast period

2024–2029

Forecast units

Value (USD Million/Billion)

Segments Covered

By Offering, By Application, By Location Type, By End User Industry, By Region

Region covered

North America, Europe, Asia Pacific, and RoW

Companies covered

The major players include Eaton (Ireland), Honeywell International, Inc. (US), Siemens (Germany), Emerson Electric Co. (US), Schneider Electric SE (France), Advantech Co., Ltd. (Taiwan), HDL Automation (China), RSAE Labs Inc. (US), Wirepas Ltd (Finland), Dryad Networks GmbH (Germany) and AsiaRF Co., Ltd (Taiwan), Phoenix Contact (Germany), Westermo (Sweden), Tuya Inc. (China), Ackcio (Singapore), DusunIoT (China), Senet (US), Rajant Corporation (US), Quectel (China), NEXCOM International Co., Ltd. (Taiwan), Weidmüller Group (Germany), Digi International, Inc. (US), Kerlink (France), Milesight (US), Shanghai MXCHIP Information Technology Co., Ltd.(China), Actility (France).

Mesh Gateway Market Highlights

This research report categorizes the overall mesh gateway market on the basis of offering, location type, application type, End User Industries, and geography.

Segment

Subsegment

By Offering

  • Hardware
  • Services

By Location Type

  • Indoor
  • Outdoor

By Application Type

  • Remote Monitoring
  • Asset Management & Tracking
  • Predictive Maintenance
  • Smart Grid Management
  • Supply Chain Management
  • Traffic Management
  • Others

By End-User Industry

  • Energy & Utilities
  • Agriculture
  • Manufacturing
  • Retail & Logistics
  • Transportation
  • Metals & Mining
  • Others

By Geography

  • North America
  • Europe
  • Asia Pacific
  • RoW

Recent Developments

  • In March 2024, Emerson Electric Co. (US) revealed its new PACSystems IPC 2010 Compact Industrial PC (IPC), which is designed to be a rugged industrial computer suited to machine and discrete part manufacturing automation applications. The new solution is designed to serve manufacturing sites and OEM machine builders who need a ruggedized, compact, durable IPC to cost-effectively support the Industrial Internet of Things (IIoT) and other digital transformation initiatives.
  • In July 2023, Honeywell International Inc. (US) announced the acquisition of SCADAfence (Israel), one of the leading providers of operational technology (OT) and Internet of Things (IoT) cybersecurity solutions for monitoring large-scale networks. SCADAfence brings proven capabilities in asset discovery, threat detection, and security governance, which are vital to industrial and building management cybersecurity programs.
  • In August 2022, Siemens (Germany) has recently disclosed their plan to establish a new factory in the US, costing USD 150 million dollars. The factory will produce electrical equipment to be supplied to US data centers and critical infrastructure. The establishment will incorporate various IoT and AI software tools, primarily to facilitate digital twin and factory automation technology.

Frequently Asked Questions (FAQs):

To speak to our analyst for a discussion on the above findings, click Speak to Analyst

TABLE OF CONTENTS
 
1 INTRODUCTION (Page No. - 19)
    1.1 STUDY OBJECTIVES 
    1.2 MARKET DEFINITION 
           1.2.1 MARKETS COVERED
    1.3 REGIONAL SCOPE 
           1.3.1 YEARS CONSIDERED
           1.3.2 INCLUSIONS AND EXCLUSIONS
    1.4 CURRENCY 
    1.5 STAKEHOLDERS 
    1.6 LIMITATIONS 
    1.7 RECESSION IMPACT 
 
2 RESEARCH METHODOLOGY (Page No. - 23)
    2.1 RESEARCH DATA 
           2.1.1 SECONDARY AND PRIMARY RESEARCH
                    2.1.1.1 Key industry insights
           2.1.2 SECONDARY DATA
                    2.1.2.1 List of key secondary sources
                    2.1.2.2 Key data from secondary sources
           2.1.3 PRIMARY DATA
                    2.1.3.1 Breakdown of primaries
                    2.1.3.2 Key data from primary sources
    2.2 MARKET SIZE ESTIMATION 
           2.2.1 BOTTOM-UP APPROACH
                    2.2.1.1 Approach to obtain market size using bottom-up analysis (demand side)
           2.2.2 TOP-DOWN APPROACH
                    2.2.2.1 Approach to obtain market size using top-down approach
    2.3 DATA TRIANGULATION 
    2.4 RESEARCH ASSUMPTIONS 
    2.5 LIMITATIONS 
    2.6 RISK ASSESSMENT 
    2.7 APPROACH TO ANALYZE IMPACT OF RECESSION ON MESH GATEWAY MARKET 
 
3 EXECUTIVE SUMMARY (Page No. - 33)
 
4 PREMIUM INSIGHTS (Page No. - 37)
    4.1 ATTRACTIVE OPPORTUNITIES FOR PLAYERS IN MESH GATEWAY MARKET 
    4.2 MARKET, BY OFFERING 
    4.3 ASIA PACIFIC MARKET, BY APPLICATION & COUNTRY 
    4.4 MARKET BY END-USE INDUSTRY 
    4.5 MARKET, BY LOCATION TYPE 
    4.6 MESH GATEWAY MARKET, BY COUNTRY 
 
5 MARKET OVERVIEW (Page No. - 40)
    5.1 INTRODUCTION 
    5.2 MARKET DYNAMICS 
           5.2.1 DRIVERS
                    5.2.1.1 Rise in number of internet users
                    5.2.1.2 Increasing demand for fast and secure networks
                    5.2.1.3 Rise in industrial automation
           5.2.2 RESTRAINTS
                    5.2.2.1 Higher initial cost and complex setup
           5.2.3 OPPORTUNITIES
                    5.2.3.1 Increasing adoption by SMEs
           5.2.4 CHALLENGES
                    5.2.4.1 Data security and privacy concerns
    5.3 TRENDS/DISRUPTIONS IMPACTING CUSTOMERS 
    5.4 PRICING ANALYSIS 
           5.4.1 AVERAGE SELLING PRICE OF MESH GATEWAY HARDWARE
    5.5 VALUE CHAIN ANALYSIS 
           5.5.1 RESEARCH, DESIGN, AND DEVELOPMENT
           5.5.2 COMPONENT MANUFACTURING
           5.5.3 MESH GATEWAY ASSEMBLY
           5.5.4 DISTRIBUTION AND SALES
           5.5.5 CUSTOMER SUPPORT
    5.6 ECOSYSTEM ANALYSIS 
    5.7 INVESTMENT AND FUNDING SCENARIO 
    5.8 TECHNOLOGY ANALYSIS 
           5.8.1 KEY TECHNOLOGY
                    5.8.1.1 Mesh networking protocol
           5.8.2 COMPLEMENTARY TECHNOLOGY
                    5.8.2.1 Edge computing
           5.8.3 ADJACENT TECHNOLOGY
                    5.8.3.1 WiFi
    5.9 PATENT ANALYSIS 
    5.10 TRADE ANALYSIS 
           5.10.1 IMPORT SCENARIO
           5.10.2 EXPORT SCENARIO
    5.11 TARIFF AND REGULATORY LANDSCAPE 
           5.11.1 TARIFF DATA
    5.12 REGULATORY LANDSCAPE 
           5.12.1 REGULATORY BODIES, GOVERNMENT AGENCIES, AND OTHER ORGANIZATIONS
    5.13 KEY CONFERENCES AND EVENTS, 2024–2025 
    5.14 CASE STUDY ANALYSIS 
    5.15 PORTER'S FIVE FORCES ANALYSIS 
           5.15.1 INTENSITY OF COMPETITIVE RIVALRY
           5.15.2 BARGAINING POWER OF SUPPLIERS
           5.15.3 BARGAINING POWER OF BUYERS
           5.15.4 THREAT OF SUBSTITUTES
           5.15.5 THREAT OF NEW ENTRANTS
    5.16 KEY STAKEHOLDERS & BUYING CRITERIA 
           5.16.1 KEY STAKEHOLDERS IN BUYING PROCESS
           5.16.2 BUYING CRITERIA
 
6 CONNECTIVITY PROTOCOLS IN MESH GATEWAY (Page No. - 66)
    6.1 INTRODUCTION 
    6.2 ZIGBEE 
    6.3 THREAD 
    6.4 WI-FI 
    6.5 OTHERS 
 
7 MESH GATEWAY MARKET, BY OFFERING (Page No. - 68)
    7.1 INTRODUCTION 
    7.2 HARDWARE 
           7.2.1 RELIABLE DATA FLOW DUE TO INTERCONNECTED NODES – KEY DRIVER
    7.3 SERVICES 
           7.3.1 CONTINUOUS MONITORING AND UPDATES – KEY DRIVERS
 
8 MESH GATEWAY MARKET, BY LOCATION TYPE (Page No. - 74)
    8.1 INTRODUCTION 
    8.2 INDOOR 
           8.2.1 FOCUS ON SAFETY AND EFFICIENCY IN INDOOR INDUSTRIAL OPERATIONS TO PROPEL MARKET
    8.3 OUTDOOR 
           8.3.1 END-TO-END CONNECTIVITY BENEFITS TO BOOST SEGMENT
 
9 MESH GATEWAY MARKET, BY APPLICATION (Page No. - 78)
    9.1 INTRODUCTION 
    9.2 REMOTE MONITORING 
           9.2.1 INCREASING NEED FOR MONITORING AND REPORTING ACROSS VERTICALS TO DRIVE MARKET
    9.3 ASSET TRACKING & MANAGEMENT 
           9.3.1 NEED FOR ENHANCED SECURITY AND LOSS PREVENTION – KEY SEGMENT DRIVERS
    9.4 PREDICTIVE MAINTENANCE 
           9.4.1 INCREASING APPLICATION IN INDUSTRIAL VERTICAL TO DRIVE MARKET
    9.5 SMART GRID MANAGEMENT 
           9.5.1 INCREASING APPLICATION OF FAULT DETECTION AND MANAGEMENT TO DRIVE MARKET
    9.6 SUPPLY CHAIN MANAGEMENT 
           9.6.1 INCREASING NEED TO ACHIEVE SUSTAINABILITY TO DRIVE MARKET
    9.7 TRAFFIC MANAGEMENT 
           9.7.1 NEED FOR REAL-TIME DATA EXCHANGE BETWEEN TRAFFIC CONTROL DEVICES TO DRIVE MARKET
    9.8 OTHER APPLICATIONS 
 
10 MESH GATEWAY MARKET, BY END-USE INDUSTRY (Page No. - 88)
     10.1 INTRODUCTION 
     10.2 ENERGY & UTILITIES 
             10.2.1 IMPROVED OPERATIONAL EFFICIENCY TO DRIVE SEGMENT
     10.3 MANUFACTURING 
             10.3.1 INCREASING NEED FOR REAL-TIME MONITORING AND CONTROL TO DRIVE SEGMENT
     10.4 RETAIL & LOGISTICS 
             10.4.1 WIDE-SCALE APPLICATION IN INVENTORY MANAGEMENT TO BOOST GROWTH
     10.5 TRANSPORTATION 
             10.5.1 INCREASING NEED FOR EFFICIENCY, SAFETY, AND SERVICE QUALITY TO DRIVE MARKET
     10.6 AGRICULTURE 
             10.6.1 DEMAND FOR CONNECTIVITY ACROSS REMOTE AGRICULTURAL FIELDS TO FUEL MARKET
     10.7 METALS & MINING 
             10.7.1 IMPROVED SAFETY, EFFICIENCY, AND PRODUCTIVITY TO DRIVE MARKET
     10.8 OTHER END-USE INDUSTRIES 
 
11 MESH GATEWAY MARKET, BY REGION (Page No. - 98)
     11.1 INTRODUCTION 
     11.2 NORTH AMERICA 
             11.2.1 US
                        11.2.1.1 Market driven by increasing use of innovative solutions and presence of mesh gateway providers
             11.2.2 CANADA
                        11.2.2.1 Strict government regulations and continuous technological development to drive market
             11.2.3 MEXICO
                        11.2.3.1 Wide adoption in industrial applications – key growth driver
             11.2.4 RECESSION IMPACT ON MARKET IN NORTH AMERICA
     11.3 EUROPE 
             11.3.1 UK
                        11.3.1.1 Increasing investment in digital technology and automation in country to boost market
             11.3.2 GERMANY
                        11.3.2.1 Market growth result of surge in deployment of mesh gateway in Industrie 4.0
             11.3.3 SPAIN
                        11.3.3.1 High demand for home automation and government initiatives to grow awareness about mesh gateway
             11.3.4 FRANCE
                        11.3.4.1 Increased industrial spending to boost mesh gateway demand
             11.3.5 REST OF EUROPE
             11.3.6 RECESSION IMPACT ON MARKET IN EUROPE
     11.4 ASIA PACIFIC 
             11.4.1 CHINA
                        11.4.1.1 Booming wireless network industry to propel market
             11.4.2 JAPAN
                        11.4.2.1 Rising adoption of industrial solutions for improved productivity and process optimization to boost market
             11.4.3 INDIA
                        11.4.3.1 Consistent development of frameworks for mesh gateway applications to drive market
             11.4.4 SOUTH KOREA
                        11.4.4.1 Funding for research & development and mesh gateway infrastructure to fuel growth
             11.4.5 AUSTRALIA
                        11.4.5.1 Increase in home automation applications of mesh gateway to drive market
             11.4.6 REST OF ASIA PACIFIC
             11.4.7 RECESSION IMPACT ON MARKET IN ASIA PACIFIC
     11.5 REST OF THE WORLD 
             11.5.1 SOUTH AMERICA
                        11.5.1.1 Increased focus on connectivity and networking technologies to fuel market growth
             11.5.2 GCC
                        11.5.2.1 Government funding for research & development to boost market
             11.5.3 REST OF MIDDLE EAST & AFRICA
             11.5.4 RECESSION IMPACT ON ROW
 
12 COMPETITIVE LANDSCAPE (Page No. - 124)
     12.1 OVERVIEW 
     12.2 KEY STRENGTHS/RIGHT TO WIN, 2020–2023 
     12.3 REVENUE ANALYSIS, 2023 
     12.4 MARKET SHARE ANALYSIS, 2023 
     12.5 COMPANY VALUATION AND FINANCIAL METRICS 
     12.6 BRAND/PRODUCT COMPARATIVE ANALYSIS 
     12.7 COMPANY EVALUATION MATRIX: KEY PLAYERS, 2023 
             12.7.1 STARS
             12.7.2 EMERGING LEADERS
             12.7.3 PERVASIVE PLAYERS
             12.7.4 PARTICIPANTS
     12.8 COMPANY FOOTPRINT: KEY PLAYERS, 2023 
             12.8.1 COMPANY FOOTPRINT
             12.8.2 OFFERING FOOTPRINT
             12.8.3 APPLICATION FOOTPRINT
             12.8.4 END-USE INDUSTRY FOOTPRINT
             12.8.5 REGION FOOTPRINT
     12.9 COMPANY EVALUATION MATRIX: KEY STARTUPS/SMES, 2023 
             12.9.1 PROGRESSIVE COMPANIES
             12.9.2 RESPONSIVE COMPANIES
             12.9.3 DYNAMIC COMPANIES
             12.9.4 STARTING BLOCKS
             12.9.5 COMPETITIVE BENCHMARKING: KEY STARTUPS/SMES, 2023
                        12.9.5.1 Key startups/SMEs
                        12.9.5.2 Competitive benchmarking of key startups/SMEs
     12.1 COMPETITIVE SCENARIOS AND TRENDS 
             12.10.1 PRODUCT LAUNCHES
             12.10.2 DEALS
             12.10.3 OTHERS
 
13 COMPANY PROFILES (Page No. - 146)
     13.1 KEY PLAYERS 
             13.1.1 EATON
                        13.1.1.1 Business overview
                        13.1.1.2 Products/Solutions/Services offered
                        13.1.1.3 MnM view
                                     13.1.1.3.1 Right to win
                                     13.1.1.3.2 Strategic choices
                                     13.1.1.3.3 Weaknesses and competitive threats
             13.1.2 HONEYWELL INTERNATIONAL, INC.
                        13.1.2.1 Business overview
                        13.1.2.2 Products/Solutions/Services offered
                        13.1.2.3 Recent developments
                                     13.1.2.3.1 Deals
                        13.1.2.4 MnM view
                                     13.1.2.4.1 Right to win
                                     13.1.2.4.2 Strategic choices
                                     13.1.2.4.3 Weaknesses and competitive threats
             13.1.3 SIEMENS
                        13.1.3.1 Business overview
                        13.1.3.2 Products/Solutions/Services offered
                        13.1.3.3 Recent developments
                                     13.1.3.3.1 Others
                        13.1.3.4 MnM view
                                     13.1.3.4.1 Right to win
                                     13.1.3.4.2 Strategic choices
                                     13.1.3.4.3 Weaknesses and competitive threats
             13.1.4 EMERSON ELECTRIC CO.
                        13.1.4.1 Business overview
                        13.1.4.2 Products/Solutions/Services Offered
                        13.1.4.3 Recent developments
                                     13.1.4.3.1 Others
                        13.1.4.4 MnM view
                                     13.1.4.4.1 Right to win
                                     13.1.4.4.2 Strategic choices
                                     13.1.4.4.3 Weaknesses and competitive threats
             13.1.5 SCHNEIDER ELECTRIC SE
                        13.1.5.1 Business overview
                        13.1.5.2 Products/Solutions/Services offered
                        13.1.5.3 MnM view
                                     13.1.5.3.1 Right to win
                                     13.1.5.3.2 Strategic choices
                                     13.1.5.3.3 Weaknesses and competitive threats
             13.1.6 ADVANTECH CO., LTD.
                        13.1.6.1 Business overview
                        13.1.6.2 Products/Solutions/Services offered
             13.1.7 HDL AUTOMATION
                        13.1.7.1 Business overview
                        13.1.7.2 Products/Solutions/Services offered
             13.1.8 RSAE LABS INC.
                        13.1.8.1 Business overview
                        13.1.8.2 Products/Solutions/Services offered
             13.1.9 WIREPAS LTD
                        13.1.9.1 Business overview
                        13.1.9.2 Products/Solutions/Services Offered
             13.1.10 DRYAD NETWORKS GMBH
                        13.1.10.1 Business overview
                        13.1.10.2 Products/Solutions/Services offered
                        13.1.10.3 Recent developments
                                     13.1.10.3.1 Deals
             13.1.11 ASIARF CO., LTD.
                        13.1.11.1 Business overview
                        13.1.11.2 Products/Solutions/Services offered
                        13.1.11.3 Recent developments
                                     13.1.11.3.1 Product launches
                                     13.1.11.3.2 Others
     13.2 OTHER PLAYERS 
             13.2.1 PHOENIX CONTACT
             13.2.2 WESTERMO
             13.2.3 TUYA INC.
             13.2.4 ACKCIO
             13.2.5 DUSUNIOT
             13.2.6 SENET
             13.2.7 RAJANT CORPORATION
             13.2.8 QUECTEL
             13.2.9 NEXCOM INTERNATIONAL CO., LTD
             13.2.10 WEIDMUELLER GROUP
             13.2.11 DIGI INTERNATIONAL, INC.
             13.2.12 KERLINK SA
             13.2.13 MILESIGHT
             13.2.14 SHANGHAI MXCHIP INFORMATION TECHNOLOGY CO., LTD.
             13.2.15 ACTILITY
 
14 APPENDIX (Page No. - 183)
     14.1 DISCUSSION GUIDE 
     14.2 KNOWLEDGESTORE: MARKETSANDMARKETS’ SUBSCRIPTION PORTAL 
     14.3 CUSTOMIZATION OPTIONS 
     14.4 RELATED REPORTS 
     14.5 AUTHOR DETAILS 
 
LIST OF TABLES (159 TABLES)
 
TABLE 1 MESH GATEWAY MARKET: ECOSYSTEM ANALYSIS
TABLE 2 MARKET: KEY PATENTS, 2020–2024
TABLE 3 MFN TARIFFS FOR HS CODE 851762. - MACHINE FOR THE RECEPTION, CONVERSION, TRANSMISSION, OR REGENERATION OF VOICE, IMAGE, OR OTHER DATA, INCLUDING SWITCHING AND ROUTING APPARATUS EXPORTED BY US
TABLE 4 MFN TARIFFS FOR HS CODE 851762. - MACHINE FOR THE RECEPTION, CONVERSION, TRANSMISSION, OR REGENERATION OF VOICE, IMAGE, OR OTHER DATA, INCLUDING SWITCHING AND ROUTING APPARATUS EXPORTED BY CHINA
TABLE 5 MFN TARIFFS FOR HS CODE 851762. - MACHINE FOR THE RECEPTION, CONVERSION, TRANSMISSION, OR REGENERATION OF VOICE, IMAGE, OR OTHER DATA, INCLUDING SWITCHING AND ROUTING APPARATUS EXPORTED BY GERMANY
TABLE 6 MFN TARIFFS FOR HS CODE 851762. - MACHINE FOR THE RECEPTION, CONVERSION, TRANSMISSION, OR REGENERATION OF VOICE, IMAGE, OR OTHER DATA, INCLUDING SWITCHING AND ROUTING APPARATUS EXPORTED BY UK
TABLE 7 NORTH AMERICA: REGULATORY BODIES, GOVERNMENT AGENCIES, AND OTHER ORGANIZATIONS
TABLE 8 EUROPE: REGULATORY BODIES, GOVERNMENT AGENCIES, AND OTHER ORGANIZATIONS
TABLE 9 ASIA PACIFIC: REGULATORY BODIES, GOVERNMENT AGENCIES, AND OTHER ORGANIZATIONS
TABLE 10 ROW: REGULATORY BODIES, GOVERNMENT AGENCIES, AND OTHER ORGANIZATIONS
TABLE 11 MARKET: KEY CONFERENCES AND EVENTS, 2024–2025
TABLE 12 EATON ENHANCES MINING OPERATIONS WITH MESH GATEWAY DEPLOYMENT
TABLE 13 MARKET: PORTER'S FIVE FORCES ANALYSIS
TABLE 14 INFLUENCE OF STAKEHOLDERS ON BUYING PROCESS FOR TOP THREE END-USE INDUSTRIES (%)
TABLE 15 KEY BUYING CRITERIA FOR TOP THREE END-USE INDUSTRIES
TABLE 16 MARKET, BY OFFERING, 2020–2023 (USD MILLION)
TABLE 17 MARKET, BY OFFERING, 2024–2029 (USD MILLION)
TABLE 18 MESH GATEWAY HARDWARE MARKET, 2020–2023 (MILLION UNITS)
TABLE 19 MESH GATEWAY HARDWARE MARKET, 2024–2029 (MILLION UNITS)
TABLE 20 INDOOR MESH GATEWAY MARKET, BY OFFERING, 2020–2023 (USD MILLION)
TABLE 21 INDOOR MARKET, BY OFFERING, 2024–2029 (USD MILLION)
TABLE 22 OUTDOOR MESH GATEWAY MARKET, BY OFFERING, 2020–2023 (USD MILLION)
TABLE 23 OUTDOOR MARKET, BY OFFERING, 2024–2029 (USD MILLION)
TABLE 24 HARDWARE: MARKET, BY REGION, 2020–2023 (USD MILLION)
TABLE 25 HARDWARE: MARKET, BY REGION, 2024–2029 (USD MILLION)
TABLE 26 SERVICES: MESH GATEWAY MARKET, BY REGION, 2020–2023 (USD MILLION)
TABLE 27 SERVICES: MARKET, BY REGION, 2024–2029 (USD MILLION)
TABLE 28 MESH GATEWAY MARKET, BY LOCATION TYPE, 2020–2023 (USD MILLION)
TABLE 29 MARKET, BY LOCATION TYPE, 2024–2029 (USD MILLION)
TABLE 30 INDOOR: MARKET, BY REGION, 2020–2023 (USD MILLION)
TABLE 31 INDOOR: MARKET, BY REGION, 2024–2029 (USD MILLION)
TABLE 32 OUTDOOR: MARKET, BY REGION, 2020–2023 (USD MILLION)
TABLE 33 OUTDOOR: MARKET, BY REGION, 2024–2029 (USD MILLION)
TABLE 34 MESH GATEWAY MARKET, BY APPLICATION, 2020–2023 (USD MILLION)
TABLE 35 MARKET, BY APPLICATION, 2024–2029 (USD MILLION)
TABLE 36 REMOTE MONITORING: MARKET, BY REGION, 2020–2023 (USD MILLION)
TABLE 37 REMOTE MONITORING: MARKET, BY REGION, 2024–2029 (USD MILLION)
TABLE 38 ASSET TRACKING & MANAGEMENT: MESH GATEWAY, BY REGION, 2020–2023 (USD MILLION)
TABLE 39 ASSET TRACKING & MANAGEMENT: MESH GATEWAY, BY REGION, 2024–2029 (USD MILLION)
TABLE 40 PREDICTIVE MAINTENANCE: MESH GATEWAY MARKET, BY REGION, 2020–2023 (USD MILLION)
TABLE 41 PREDICTIVE MAINTENANCE: MARKET, BY REGION, 2024–2029 (USD MILLION)
TABLE 42 SMART GRID MANAGEMENT: MARKET, BY REGION, 2020–2023 (USD MILLION)
TABLE 43 SMART GRID MANAGEMENT: MARKET, BY REGION, 2024–2029 (USD MILLION)
TABLE 44 SUPPLY CHAIN MANAGEMENT: MARKET, BY REGION, 2020–2023 (USD MILLION)
TABLE 45 SUPPLY CHAIN MANAGEMENT: MARKET, BY REGION, 2024–2029 (USD MILLION)
TABLE 46 TRAFFIC MANAGEMENT: MESH GATEWAY MARKET, BY REGION, 2020–2023 (USD MILLION)
TABLE 47 TRAFFIC MANAGEMENT: MARKET, BY REGION, 2024–2029 (USD MILLION)
TABLE 48 OTHER APPLICATIONS: MARKET, BY REGION, 2020–2023 (USD MILLION)
TABLE 49 OTHER APPLICATIONS: MARKET, BY REGION, 2024–2029 (USD MILLION)
TABLE 50 MARKET, BY END-USE INDUSTRY, 2020–2023 (USD MILLION)
TABLE 51 MARKET, BY END-USE INDUSTRY, 2024–2029 (USD MILLION)
TABLE 52 ENERGY & UTILITIES: MARKET, BY REGION, 2020–2023 (USD MILLION)
TABLE 53 ENERGY & UTILITIES: MARKET, BY REGION, 2024–2029 (USD MILLION)
TABLE 54 MANUFACTURING: MARKET, BY REGION, 2020–2023 (USD MILLION)
TABLE 55 MANUFACTURING: MARKET, BY REGION, 2024–2029 (USD MILLION)
TABLE 56 RETAIL & LOGISTICS: MARKET, BY REGION, 2020–2023 (USD MILLION)
TABLE 57 RETAIL & LOGISTICS: MARKET, BY REGION, 2024–2029 (USD MILLION)
TABLE 58 TRANSPORTATION: MARKET, BY REGION, 2020–2023 (USD MILLION)
TABLE 59 TRANSPORTATION: MARKET, BY REGION, 2024–2029 (USD MILLION)
TABLE 60 AGRICULTURE: MESH GATEWAY MARKET, BY REGION, 2020–2023 (USD MILLION)
TABLE 61 AGRICULTURE: MARKET, BY REGION, 2024–2029 (USD MILLION)
TABLE 62 METALS & MINING: MARKET, BY REGION, 2020–2023 (USD MILLION)
TABLE 63 METALS & MINING: MARKET, BY REGION, 2024–2029 (USD MILLION)
TABLE 64 OTHER END-USE INDUSTRIES: MARKET, BY REGION, 2020–2023 (USD MILLION)
TABLE 65 OTHER END-USE INDUSTRIES: MARKET, BY REGION, 2024–2029 (USD MILLION)
TABLE 66 MESH GATEWAY MARKET, BY REGION, 2020–2023 (USD MILLION)
TABLE 67 MARKET, BY REGION, 2024–2029 (USD MILLION)
TABLE 68 NORTH AMERICA: MARKET, BY END-USE INDUSTRY, 2020–2023 (USD MILLION)
TABLE 69 NORTH AMERICA: MARKET, BY END-USE INDUSTRY, 2024–2029 (USD MILLION)
TABLE 70 NORTH AMERICA: MARKET, BY OFFERING, 2020–2023 (USD MILLION)
TABLE 71 NORTH AMERICA: MARKET, BY OFFERING, 2024–2029 (USD MILLION)
TABLE 72 NORTH AMERICA: MARKET, BY SERVICE, 2020–2023 (USD MILLION)
TABLE 73 NORTH AMERICA: MARKET, BY SERVICE, 2024–2029 (USD MILLION)
TABLE 74 NORTH AMERICA: MARKET, BY LOCATION TYPE, 2020–2023 (USD MILLION)
TABLE 75 NORTH AMERICA: MARKET, BY LOCATION TYPE, 2024–2029 (USD MILLION)
TABLE 76 NORTH AMERICA: MARKET, BY APPLICATION, 2020–2023 (USD MILLION)
TABLE 77 NORTH AMERICA: MARKET, BY APPLICATION, 2024–2029 (USD MILLION)
TABLE 78 NORTH AMERICA: MARKET, BY COUNTRY, 2020–2023 (USD MILLION)
TABLE 79 NORTH AMERICA: MARKET, BY COUNTRY, 2024–2029 (USD MILLION)
TABLE 80 EUROPE: MESH GATEWAY MARKET, BY END-USE INDUSTRY, 2020–2023 (USD MILLION)
TABLE 81 EUROPE: MARKET, BY END-USE INDUSTRY, 2024–2029 (USD MILLION)
TABLE 82 EUROPE: MARKET, BY OFFERING, 2020–2023 (USD MILLION)
TABLE 83 EUROPE: MARKET, BY OFFERING, 2024–2029 (USD MILLION)
TABLE 84 EUROPE: MARKET, BY SERVICE, 2020–2023 (USD MILLION)
TABLE 85 EUROPE: MARKET, BY SERVICE, 2024–2029 (USD MILLION)
TABLE 86 EUROPE: MARKET, BY LOCATION TYPE, 2020–2023 (USD MILLION)
TABLE 87 EUROPE: MARKET, BY LOCATION TYPE, 2024–2029 (USD MILLION)
TABLE 88 EUROPE: MARKET, BY APPLICATION, 2020–2023 (USD MILLION)
TABLE 89 EUROPE: MARKET, BY APPLICATION, 2024–2029 (USD MILLION)
TABLE 90 EUROPE: MARKET, BY COUNTRY, 2020–2023 (USD MILLION)
TABLE 91 EUROPE: MARKET, BY COUNTRY, 2024–2029 (USD MILLION)
TABLE 92 ASIA PACIFIC: MESH GATEWAY MARKET, BY END-USE INDUSTRY, 2020–2023 (USD MILLION)
TABLE 93 ASIA PACIFIC: MARKET, BY END-USE INDUSTRY, 2024–2029 (USD MILLION)
TABLE 94 ASIA PACIFIC: MARKET, BY OFFERING, 2020–2023 (USD MILLION)
TABLE 95 ASIA PACIFIC: MARKET, BY OFFERING, 2024–2029 (USD MILLION)
TABLE 96 ASIA PACIFIC: MARKET, BY SERVICE, 2020–2023 (USD MILLION)
TABLE 97 ASIA PACIFIC: MARKET, BY SERVICE, 2024–2029 (USD MILLION)
TABLE 98 ASIA PACIFIC: MARKET, BY LOCATION TYPE, 2020–2023 (USD MILLION)
TABLE 99 ASIA PACIFIC: MARKET, BY LOCATION TYPE, 2024–2029 (USD MILLION)
TABLE 100 ASIA PACIFIC: MESH GATEWAY MARKET, BY APPLICATION, 2020–2023 (USD MILLION)
TABLE 101 ASIA PACIFIC: MARKET, BY APPLICATION, 2024–2029 (USD MILLION)
TABLE 102 ASIA PACIFIC: MARKET, BY COUNTRY, 2020–2023 (USD MILLION)
TABLE 103 ASIA PACIFIC: MARKET, BY COUNTRY, 2024–2029 (USD MILLION)
TABLE 104 ROW: MARKET, BY END-USE INDUSTRY, 2020–2023 (USD MILLION)
TABLE 105 ROW: MARKET, BY END-USE INDUSTRY, 2024–2029 (USD MILLION)
TABLE 106 ROW: MARKET, BY OFFERING, 2020–2023 (USD MILLION)
TABLE 107 ROW: MARKET, BY OFFERING, 2024–2029 (USD MILLION)
TABLE 108 ROW: MARKET, BY SERVICE, 2020–2023 (USD MILLION)
TABLE 109 ROW: MARKET, BY SERVICE, 2024–2029 (USD MILLION)
TABLE 110 ROW: MARKET, BY LOCATION TYPE, 2020–2023 (USD MILLION)
TABLE 111 ROW: MARKET, BY LOCATION TYPE, 2024–2029 (USD MILLION)
TABLE 112 ROW: MARKET, BY APPLICATION, 2020–2023 (USD MILLION)
TABLE 113 ROW: MARKET, BY APPLICATION, 2024–2029 (USD MILLION)
TABLE 114 ROW: MARKET, BY REGION, 2020–2023 (USD MILLION)
TABLE 115 ROW: MARKET, BY REGION, 2024–2029 (USD MILLION)
TABLE 116 MESH GATEWAY MARKET: OVERVIEW OF STRATEGIES ADOPTED BY KEY PLAYERS, 2020–2023
TABLE 117 MARKET: DEGREE OF COMPETITION, 2023
TABLE 118 MARKET: RANKING ANALYSIS, 2023
TABLE 119 MARKET: OFFERING FOOTPRINT
TABLE 120 MARKET: APPLICATION FOOTPRINT
TABLE 121 MARKET: END-USE INDUSTRY FOOTPRINT
TABLE 122 MARKET: REGION FOOTPRINT
TABLE 123 MARKET: KEY STARTUPS/SMES
TABLE 124 MARKET: COMPETITIVE BENCHMARKING OF KEY STARTUPS/SMES
TABLE 125 MARKET: PRODUCT LAUNCHES, JANUARY 2020–APRIL 2024
TABLE 126 MARKET: DEALS, JANUARY 2020–APRIL 2024
TABLE 127 MESH GATEWAY MARKET: OTHERS, JANUARY 2020–APRIL 2024
TABLE 128 EATON: COMPANY OVERVIEW
TABLE 129 EATON: PRODUCTS/SOLUTIONS/SERVICES OFFERED
TABLE 130 HONEYWELL INTERNATIONAL, INC.: COMPANY OVERVIEW
TABLE 131 HONEYWELL INTERNATIONAL, INC.: PRODUCTS/SOLUTIONS/SERVICES OFFERED
TABLE 132 HONEYWELL INTERNATIONAL, INC.: DEALS
TABLE 133 SIEMENS: COMPANY OVERVIEW
TABLE 134 SIEMENS: PRODUCTS/SOLUTIONS/SERVICES OFFERED
TABLE 135 SIEMENS: PRODUCT LAUNCHES
TABLE 136 SIEMENS: DEALS
TABLE 137 SIEMENS: OTHERS
TABLE 138 EMERSON ELECTRIC CO.: COMPANY OVERVIEW
TABLE 139 EMERSON ELECTRIC CO.: PRODUCTS/SOLUTIONS/SERVICES OFFERED
TABLE 140 EMERSON ELECTRIC CO.: PRODUCT LAUNCHES
TABLE 141 EMERSON ELECTRIC CO.: DEALS
TABLE 142 EMERSON ELECTRIC CO.: OTHERS
TABLE 143 SCHNEIDER ELECTRIC SE.: COMPANY OVERVIEW
TABLE 144 SCHNEIDER ELECTRIC SE: PRODUCTS/SOLUTIONS/SERVICES OFFERED
TABLE 145 ADVANTECH CO., LTD.: COMPANY OVERVIEW
TABLE 146 ADVANTECH CO., LTD.: PRODUCTS/SOLUTIONS/SERVICES OFFERED
TABLE 147 HDL AUTOMATION: COMPANY OVERVIEW
TABLE 148 HDL AUTOMATION: PRODUCTS/SOLUTIONS/SERVICES OFFERED
TABLE 149 RSAE LABS INC.: COMPANY OVERVIEW
TABLE 150 RSAE LABS INC.: PRODUCTS/SOLUTIONS/SERVICES OFFERED
TABLE 151 WIREPAS LTD: COMPANY OVERVIEW
TABLE 152 WIREPAS LTD: PRODUCTS/SOLUTIONS/SERVICES OFFERED
TABLE 153 DRYAD NETWORKS GMBH: COMPANY OVERVIEW
TABLE 154 DRYAD NETWORKS GMBH: PRODUCTS/SOLUTIONS/SERVICES OFFERED
TABLE 155 DRYAD NETWORKS GMBH: OTHERS
TABLE 156 ASIARF CO., LTD: COMPANY OVERVIEW
TABLE 157 ASIARF CO., LTD: PRODUCTS/SOLUTIONS/SERVICES OFFERED
TABLE 158 ASIARF CO., LTD: PRODUCT LAUNCHES
TABLE 159 ASIARF CO., LTD: OTHERS
 
 
LIST OF FIGURES (58 FIGURES)
 
FIGURE 1 MARKET SEGMENTATION
FIGURE 2 PROCESS FLOW: MESH GATEWAY MARKET ESTIMATION
FIGURE 3 RESEARCH DESIGN
FIGURE 4 MARKET SIZE ESTIMATION METHODOLOGY: BOTTOM-UP APPROACH
FIGURE 5 MARKET SIZE ESTIMATION METHODOLOGY: TOP-DOWN APPROACH
FIGURE 6 DATA TRIANGULATION
FIGURE 7 HARDWARE TO ACCOUNT FOR LARGER SHARE OF MARKET DURING FORECAST PERIOD
FIGURE 8 INDOOR LOCATION TO DOMINATE MARKET DURING FORECAST PERIOD
FIGURE 9 PREDICTIVE MAINTENANCE SEGMENT TO HAVE HIGHEST CAGR DURING FORECAST PERIOD
FIGURE 10 MANUFACTURING SEGMENT TO GROW FASTEST DURING FORECAST PERIOD
FIGURE 11 ASIA PACIFIC MARKET TO REGISTER HIGHEST CAGR DURING FORECAST PERIOD
FIGURE 12 INCREASING INVESTMENTS IN MANUFACTURING TO DRIVE GROWTH OF MARKET
FIGURE 13 HARDWARE TO COMMAND LARGEST MARKET DURING FORECAST PERIOD
FIGURE 14 PREDICTIVE MAINTENANCE AND CHINA HELD LARGEST SHARE OF ASIA PACIFIC MARKET IN 2023
FIGURE 15 MANUFACTURING SEGMENT TO HOLD DOMINANT SHARE DURING FORECAST PERIOD
FIGURE 16 INDOOR SEGMENT TO HOLD MAJOR MARKET SHARE DURING FORECAST PERIOD
FIGURE 17 SOUTH KOREA TO REGISTER HIGHEST CAGR DURING FORECAST PERIOD
FIGURE 18 MARKET: DRIVERS, RESTRAINTS, OPPORTUNITIES, AND CHALLENGES
FIGURE 19 MARKET: DRIVERS AND THEIR IMPACT
FIGURE 20 GLOBAL INTERNET PENETRATION RATE, BY REGION
FIGURE 21 MESH GATEWAY MARKET: RESTRAINTS AND THEIR IMPACT
FIGURE 22 MARKET: OPPORTUNITIES AND THEIR IMPACT
FIGURE 23 MARKET: CHALLENGES AND THEIR IMPACT
FIGURE 24 REVENUE SHIFT IN MESH GATEWAY MARKET
FIGURE 25 AVERAGE INDICATIVE SELLING PRICE ANALYSIS, 2020–2029 (USD)
FIGURE 26 AVERAGE SELLING PRICE OF MESH GATEWAY BY KEY PLAYERS
FIGURE 27 MARKET: VALUE CHAIN ANALYSIS
FIGURE 28 MARKET: STAKEHOLDERS IN ECOSYSTEM
FIGURE 29 INDUSTRIAL WIRELESS NETWORKING FUNDING FROM 2020 TO 2023
FIGURE 30 PATENTS APPLIED AND GRANTED: MESH GATEWAY MARKET, 2014–2024
FIGURE 31 IMPORTS, BY KEY COUNTRY, 2019–2022 (USD THOUSAND)
FIGURE 32 EXPORTS, BY KEY COUNTRY, 2019–2022 (USD THOUSAND)
FIGURE 33 MARKET: PORTER'S FIVE FORCES ANALYSIS
FIGURE 34 INFLUENCE OF STAKEHOLDERS ON BUYING PROCESS FOR TOP THREE END-USE INDUSTRIES
FIGURE 35 KEY BUYING CRITERIA FOR THE TOP THREE END-USE INDUSTRIES
FIGURE 36 MESH GATEWAY MARKET FOR SERVICES TO GROW AT HIGHER CAGR DURING FORECAST PERIOD
FIGURE 37 INDOOR MESH GATEWAY MARKET TO HAVE HIGHEST CAGR DURING FORECAST PERIOD
FIGURE 38 PREDICTIVE MAINTENANCE SEGMENT TO GROW FASTEST DURING FORECAST PERIOD
FIGURE 39 MARKET FOR MANUFACTURING TO GROW AT HIGHEST CAGR DURING FORECAST PERIOD
FIGURE 40 MARKET IN SOUTH KOREA TO GROW AT HIGHEST CAGR DURING FORECAST PERIOD
FIGURE 41 ASIA PACIFIC TO DOMINATE MESH GATEWAY MARKET BY 2029
FIGURE 42 NORTH AMERICA: MESH GATEWAY MARKET SNAPSHOT
FIGURE 43 MESH GATEWAY MARKET: EUROPE SNAPSHOT
FIGURE 44 MARKET: ASIA PACIFIC SNAPSHOT
FIGURE 45 MARKET: REVENUE ANALYSIS OF TOP FIVE PLAYERS, 2019–2023 (USD MILLION)
FIGURE 46 MARKET SHARE ANALYSIS, 2023
FIGURE 47 COMPANY VALUATION AND FINANCIAL METRICS, 2024
FIGURE 48 EV/EBITDA OF KEY VENDORS, 2024
FIGURE 49 TOP TRENDING BRANDS/PRODUCTS
FIGURE 50 MARKET: COMPANY EVALUATION MATRIX (KEY PLAYERS), 2023
FIGURE 51 MARKET: COMPANY FOOTPRINT
FIGURE 52 MESH GATEWAY MARKET: COMPANY EVALUATION MATRIX (STARTUPS/SMES), 2023
FIGURE 53 EATON: COMPANY SNAPSHOT
FIGURE 54 HONEYWELL INTERNATIONAL, INC.: COMPANY SNAPSHOT
FIGURE 55 SIEMENS: COMPANY SNAPSHOT
FIGURE 56 EMERSON ELECTRIC CO.: COMPANY SNAPSHOT
FIGURE 57 SCHNEIDER ELECTRIC SE: COMPANY SNAPSHOT
FIGURE 58 ADVANTECH CO., LTD.: COMPANY SNAPSHOT


Four main activities were undertaken to determine the size of the mesh gateway market. Initial extensive secondary research gathered data on the market, peer market, and parent market. Following this, validation of these findings, assumptions, and sizing occurred through primary research involving industry experts across the value chain. Utilizing both top-down and bottom-up approaches, the global market size was estimated. Subsequently, market breakdown and data triangulation were employed to determine the sizes of segments and subsegments within the market.

Secondary Research

Secondary sources for this research study encompass corporate filings (including annual reports, investor presentations, and financial statements), trade publications, professional associations, white papers, accredited publications, articles authored by reputable sources, directories, and databases. Secondary data was gathered and analyzed to ascertain the overall market size, subsequently corroborated through primary research.

Primary Research

Following a comprehensive secondary research phase to comprehend and analyze the mesh gateway market landscape, extensive primary research was conducted. This involved numerous interviews with key opinion leaders representing both demand- and supply-side vendors across four primary regions: North America, Asia Pacific, Europe, and RoW (comprising the GCC, Rest of Middle East & Africa, and South America). Subsequent to engaging with industry experts, concise sessions were held with seasoned independent consultants to validate the primary findings. These efforts, combined with insights from in-house subject matter experts, culminated in the findings detailed in the remainder of this report.

Mesh Gateway Market
 Size, and Share

To know about the assumptions considered for the study, download the pdf brochure

Market Size Estimation

Both top-down and bottom-up methodologies have been employed to estimate and validate the overall size of the mesh gateway market. These approaches were also extensively utilized to determine the sizes of various market subsegments. The research methodology utilized to estimate the market sizes encompasses the following:

Market Size Estimation Methodology-Top-Down Approach

Mesh Gateway Market
 Size, and Top-Down Approach

Market Size Estimation Methodology-Bottom-Up Approach

Mesh Gateway Market
 Size, and Bottom-Up Approach

Data Triangulation

After determining the overall market size through the previously outlined market size estimation processes, the market has been subdivided into multiple segments and subsegments. Data triangulation and market breakdown procedures were used to finalize the overall market engineering process and ascertain precise statistics for each market segment and subsegment. This triangulation involved examining various factors and trends from both the demand and supply perspectives.

The market has been divided into multiple segments and subsegments following the determination of the overall market size, utilizing the market size estimation methodologies outlined previously. Data triangulation and market breakdown techniques were used to finalize the overall market engineering process and attain precise statistics for each market segment and subsegment. Triangulation of data has been achieved through an examination of diverse factors and trends from both demand and supply perspectives.  

Market Definition

A mesh gateway is a networking device that is a bridge between different network segments or protocols within a mesh network. In mesh networks, which are decentralized and self-healing, each node can communicate with others directly or indirectly, creating a resilient topology. Mesh gateways enable communication between the mesh network and external networks, such as the Internet or other non-mesh infrastructures. They often handle tasks such as routing data between mesh nodes, managing network traffic, and providing connectivity to devices outside the mesh network.

Key Stakeholders

  • Mesh gateway manufacturers 
  • Mesh gateway component providers 
  • Technology investors 
  • Governments and financial institutions 
  • Analysts and strategic business planners 
  • Existing end users and prospective ones  
  • Mesh gateway-related associations, organizations, forums, and alliances 
  • Venture capitalists, private equity firms, and start-up companies 
  • Distributors and traders 
  • Research institute and organization

Report Objectives

  • To define, describe, and forecast the overall mesh gateway market based on offering, location type, application, and end-use industry in terms of value and volume
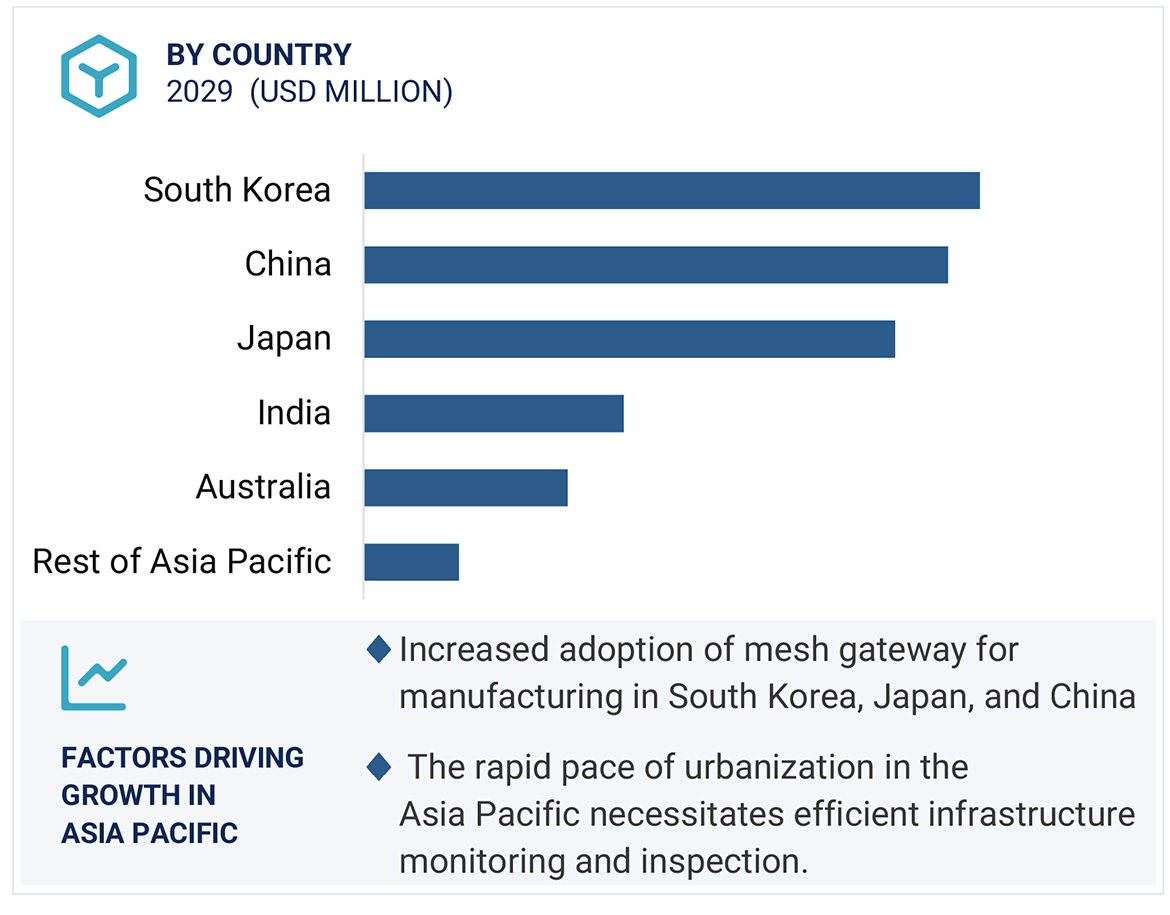
  • To forecast the size of the market for North America, Europe, Asia Pacific, and the Rest of the World (RoW) in terms of value
  • To provide detailed information regarding drivers, restraints, opportunities, and challenges influencing the growth of the mesh gateway market
  • To strategically analyze micromarkets1 with respect to individual growth trends, prospects, and contributions to the overall market
  • To describe the mesh gateway value chain
  • To analyze opportunities in the market for the stakeholders and provide a detailed competitive landscape of the market
  • To strategically profile key players and comprehensively analyze their market rankings and core competencies2
  • To analyze competitive developments such as product launches, partnerships, and collaborations in the market

Available Customizations:

With the given market data, MarketsandMarkets offers customizations according to the specific requirements of companies. The following customization options are available for the report:

Company Information

  • Detailed analysis and profiling of 25 market players
Custom Market Research Services

We will customize the research for you, in case the report listed above does not meet with your exact requirements. Our custom research will comprehensively cover the business information you require to help you arrive at strategic and profitable business decisions.

Request Customization
Report Code
SE 9074
Published ON
Jul, 2024
Choose License Type
BUY NOW
  • SHARE
X
Request Customization
Speak to Analyst
Speak to Analyst
OR FACE-TO-FACE MEETING
PERSONALIZE THIS RESEARCH
  • Triangulate with your Own Data
  • Get Data as per your Format and Definition
  • Gain a Deeper Dive on a Specific Application, Geography, Customer or Competitor
  • Any level of Personalization
REQUEST A FREE CUSTOMIZATION
LET US HELP YOU!
  • What are the Known and Unknown Adjacencies Impacting the Mesh Gateway Market
  • What will your New Revenue Sources be?
  • Who will be your Top Customer; what will make them switch?
  • Defend your Market Share or Win Competitors
  • Get a Scorecard for Target Partners
CUSTOMIZED WORKSHOP REQUEST
  • Call Us
  • +1-888-600-6441 (Corporate office hours)
  • +1-888-600-6441 (US/Can toll free)
  • +44-800-368-9399 (UK office hours)
CONNECT WITH US
ABOUT TRUST ONLINE
©2024 MarketsandMarkets Research Private Ltd. All rights reserved
DMCA.com Protection Status Website Feedback