IT Service Management (ITSM) Market by Offering (Solutions (Change & Configuration Management, Operations & Performance Management) and Services), Deployment Model, Organization Size, Vertical and Region - Global Forecast to 2028
The global IT Service Management (ITSM) Market size was USD 10.5 billion in 2023 and is projected to grow to USD 22.1 billion by 2028, with a CAGR of 15.9% during the forecast period. The impact of the recession (before, during, and after the recession) on the market is covered throughout the report. Cloud solutions' quick and easy deployment drives the demand for cloud ITSM solutions. Since all the necessary IT components run on the cloud service provider's site, end users have direct access to the software over the web anytime, anywhere. Cloud ITSM works on the OPEX (operational expenditure) model, which reduces the total cost of ownership, making it affordable for players of all sizes.
To know about the assumptions considered for the study, Request for Free Sample Report
To know about the assumptions considered for the study, download the pdf brochure
Recession Impact on the Global IT Service Management Market
During the recession, the IT Service Management (ITSM) market underwent notable transformations driven by shifts in organizational priorities and constrained budgets. One significant impact is the increased scrutiny of costs, prompting organizations to prioritize ITSM solutions that offer efficiency improvements, cost optimization, and streamlined operations. The market is witnessing a surge in demand for ITSM tools emphasizing automation, enabling organizations to do more with fewer resources. Additionally, there is likely to be a heightened focus on essential IT functions, with a preference for solutions that support critical services and contribute to overall operational resilience. Cloud-based ITSM solutions experience increased adoption as organizations seek the flexibility and scalability of cloud platforms while minimizing upfront infrastructure costs. The recession also prompted a reevaluation of procurement strategies, with organizations favoring shorter-term commitments and adaptable licensing models. Vendors offering innovative solutions aligned with these recession-driven priorities are poised to stand out in the evolving ITSM market landscape.
ITSM Market Dynamics
Drivers: Automated management of IT processes and policies
Due to globalization, increased competition, and the demand for customized products, allocating resources to core business functions has become critical for any organization. Any disruption in the normal functioning of an IT department can cause ripples throughout the business, and organizations are left with no choice but to expend their resources to correct the malfunctioning aspect of the infrastructure.
Service management can help to automate processes such as system restoration and network fault management, thereby reducing the overheads of system administrators and correcting issues in real-time. Although an initial human intervention is required to establish the necessary guidelines and policies, the automation of such processes can streamline operations and minimize disruptions.
Restraints:Lack of technical knowledge and expertise
When it comes to utilizing cloud computing platforms, organizations must have a team of experts and staff with the technical skills and knowledge to implement, process, analyze, and secure cloud solutions. However, the lack of technical expertise in this area is a significant hurdle for many organizations, causing them to miss out on the benefits of cloud computing. This shortage of skilled workers is particularly prevalent in cloud computing, and it can result in lost market share and revenue. Companies face several challenges when hiring talented cloud workers, including high wages and difficulty finding candidates that align with their organizational culture. Without sufficient skilled workers, an organization's growth can be hampered. Nevertheless, despite these challenges, many IT leaders are determined to expand their use of modern software engineering and cloud environments, with over 90% planning to achieve this objective.
Opportunities: Increasing government initiatives for necessary technology usage
In today's digital age, organizations are increasingly turning to cloud computing to store their data, as it provides a flexible and affordable solution that can be accessed on demand. As a result, governments are also investing in cloud-based delivery models to improve their efficiency and streamline their technology operations, particularly concerning citizen-facing transactions. By leveraging cloud technology, governments can reduce the cost of acquiring, setting up, operating, and maintaining technical services. They can also quickly adapt to changing user needs and expand public services. For example, during peak demand periods, such as the deadline for filing online tax returns, cloud computing can handle spikes in demand without service interruptions. According to the Government Technology Industry Navigator, funding opportunities for cloud computing services accounted for approximately 18.5% of all government tech funding opportunities. By adopting cloud computing, government technology professionals can stay up to date with the latest hardware and software rather than focusing on maintaining outdated technology platforms. This, in turn, facilitates human resource development pathways in the public sector and future-proofs government infrastructure.
Challenges: Cybersecurity concerns arising out of breaches
The increasing frequency of high-profile security breaches has made corporations more obsessed with data protection than ever. According to a survey conducted by INAP in 2019, cybersecurity is a priority for over 36% of companies. In over 52% of cases, development teams work on so many critical patches and updates that it consumes too much time. The complex dependencies and integrations can also create weak spots in the interface operating in these temperature ranges. These complications in managing the heat levels inside ITSMs may hinder the growth of the global IT service management market.
ITSM Market Ecosystem
Based on solutions, Operations & Performance Management will hold the largest market share in the ITSM market during the forecast period.
The IT Operations Management (ITOM) solution covers a broad category of solutions, such as data center management, application management, network performance management, and application performance management. The Operations & Performance management solution caters to day-to-day maintenance and management of organizational IT infrastructures and services. These solutions assist end users to improve performance and gain a holistic view of their IT environment and business services. This solution ensures the smooth delivery of IT services and compliance with the predefined parameters. The benefits of insights into the value that each business function delivers and accessible communications with customers and other stakeholders drive the demand for Operations and performance management. Organizations across verticals use these ITSM solutions to enhance visibility, prevent service outages, and achieve maximized operational agility.
Based on Services, managed services hold a higher CAGR in the IT service management market during the forecast period.
Managed services are considered vital as they are directly related to customer experience. No company can afford to compromise the customer experience if they wish to remain at the forefront of the competitive arena. It is now more challenging for businesses to support numerous other functions while emphasizing essential business processes. As a result, managed services have seen rapid expansion in the market. These services provide the technical know-how needed to update and maintain every piece of software in the ITSM ecosystem. Managed services handle all customer inquiries and demands before and after deployment. Managed services offer end customers software tailored to meet their needs, including support throughout the entire software usage process.
North America holds the largest market share in the ITSM market during the forecast period.
Given that businesses are increasingly adopting digital business strategies and moving toward cloud-based solutions and services, North America is predicted to have the most significant market size among all regions in the ITSM industry. It is anticipated that this tendency will hold throughout the projection period. Because there are so many companies in North America that provide ITSM solutions, the industry is developed. Businesses are allocating more significant funds to support ITSM solutions, which is assisting in expanding the ITSM industry in North America. That contributes to the ITSM market. As a major economy, the US' significant market share is due to the country's technological advancements, the inclination toward innovation, and the adoption of new technologies. Organizations have invested substantially in advanced technologies to gain a competitive advantage and increase business productivity. The ITSM market is expected to grow steadily as enterprises adopt cloud-based solutions and services at various levels to sustain themselves and achieve improved business functioning. Some of the top vendors present in the market are ServiceNow, BMC Software, and Ivanti, among others.
Key market players
The ITSM market is dominated both by established companies as well as startups such as ServiceNow (US), BMC Software (US), Broadcom (US), Ivanti (US), ManageEngine (India), SolarWinds (US), GoTo (US), Atlassian (Australia), OpenText (Canada), and Zendesk (US). These vendors have a large customer base, a strong geographic footprint, and organized distribution channels. They incorporate organic and inorganic growth strategies, including product launches, deals, and business expansions, boosting revenue generation.
The study includes an in-depth competitive analysis of these key players in the IT service management market with their company profiles, recent developments, and key market strategies.
Want to explore hidden markets that can drive new revenue in IT Service Management (ITSM) Market?
Scope of the Report
Want to explore hidden markets that can drive new revenue in IT Service Management (ITSM) Market?
Report Metrics |
Details |
Market size available for years |
2018-2028 |
Base year considered |
2023 |
Forecast period |
2023–2028 |
Forecast units |
Value (USD Million) |
Segments Covered |
Offering, Solutions, Services, Organization Size, and Vertical |
Regions covered |
North America, Europe, Asia Pacific, Middle East & Africa, and Latin America |
Companies covered |
ServiceNow (US), BMC Software (US), Broadcom (US), Ivanti (US), Efecte (Finland), SymphonyAI Summit (US), ManageEngine (India), SolarWinds (US), GoTo (US), Atlassian (Australia), OpenText (Canada), Zendesk (US), Microsoft (US), IBM (US), Freshworks (US), EasyVista (US), IFS (Sweden), ITarain (US), SysAid (Israel), InvGate (US), Alemba (UK), Hornbill (UK), NinjaOne (US), HaloITSM (US), Aisera (US), 4me (US), TOPdesk (Netherlands), TeamDynamix (US) |
This research report categorizes the ITSM market to forecast revenue and analyze trends in each of the following submarkets:
Based on Offering:
-
Solutions
- Service portfolio management
- Configuration and change management
- Service Desk Software
- Operations and performance management
- Dashboard, reporting, and analytics
-
Services
- Professional services
- Managed services
Based on Deployment model:
- Cloud
- On-premises
Based on Organization Size:
- SMEs
- Large Enterprises
Based on Vertical:
- BFSI
- Telecommunications
- IT & ITeS
- Government & Public sector
- Energy & Utilities
- Manufacturing
- Retail & Consumer goods
- Media & Entertainment
- Healthcare
- Education
- Other Verticals
Based on Region:
-
North America
- US
- Canada
-
Europe
- UK
- Germany
- France
- Netherlands
- Italy
- Rest of Europe
-
Asia Pacific
- China
- Japan
- Australia
- Singapore
- Rest of Asia Pacific
-
Middle East & Africa
-
GCC Countries
- Saudi Arabia
- UAE
- Rest of GCC Countries
- South Africa
- Rest of the Middle East & Africa
-
GCC Countries
-
Latin America
- Brazil
- Mexico
- Rest of Latin America
Recent Developments
- In November 2023, Broadcom acquired VMware. With this milestone acquisition in a deal size of USD 61 billion, VMware joins Broadcom's engineering-first, innovation-centric team, which is another crucial step forward in building one of the world's leading infrastructure technology companies. Broadcom's focus moving forward is to enable enterprise customers to create and modernize their private and hybrid cloud environments. Fundamentally, Broadcom will invest in VMware Cloud Foundation, the software stack that serves as the foundation of private and hybrid clouds. VMware Cloud Foundation fits Broadcom's vision of helping customers convert the typically heterogeneous enterprise IT infrastructure into a virtualized and containerized environment, enabling private and hybrid clouds.
- In October 2023, ServiceNow partnered with ANSR. With this deal, ANSR will establish ServiceNow Centers of Excellence in more than 60 Global Capability Centers (GCCs) to train 3,500 people across India on the ServiceNow platform. ANSR aims to power its internal GCC service delivery on ServiceNow, including Now Assist generative AI (GenAI) capabilities.
- In November 2022, BMC Software acquired Remedy. Combining Remedy's industry-leading service management and problem resolution capabilities with BMC Software's performance and availability management solutions will provide customers with robust, integrated service management solutions as the business(es) deliver outcomes.
- In March 2021, Ivanti acquired Cherwell. The deal will leverage the Ivanti Neurons hyper-automation platform to provide end-to-end service from IT across business lines and from every endpoint to the IoT edge, resulting in personalized, contextual employee experiences and outcomes.
Frequently Asked Questions (FAQ):
What is the projected market value of the ITSM market?
The global ITSM market is expected to grow from USD 10.5 billion in 2023 to USD 22.1 billion by 2028 at a Compound Annual Growth Rate (CAGR) of 15.9% during the forecast period.
Which region has the highest CAGR in the IT service management market?
The Asia Pacific region has the highest CAGR in the IT service management market.
What is the size of the ITSM Market in Latin America?
The Latin American ITSM market is segmented into countries that collectively contribute 75% to the regional market size based on geographic analysis.
Which are the major vendors in the ITSM market?
ServiceNow, BMC Software, Broadcom, Ivanti, and ManageEngine are significant vendors in the ITSM market.
What are some of the drivers in the IT service management market?
Increasing shift to cloud-based technologies, simplification and synchronization of IT resources, and automated management of IT resources. .
To speak to our analyst for a discussion on the above findings, click Speak to Analyst
Exclusive indicates content/data unique to MarketsandMarkets and not available with any competitors.
- 5.1 INTRODUCTION
-
5.2 MARKET DYNAMICSDRIVERS- Increasing shift to cloud-based technologies- Simplification and synchronization of IT resources- Automated management of IT processes and policies- Benefits of agile implementation, easy deployment, and OPEX modelRESTRAINTS- Lack of technical knowledge and expertise- Security and privacy concerns for confidential data and business processesOPPORTUNITIES- Widespread adoption of BYOD trend and increasing mobile workforce- Increasing government initiatives for necessary technology usage- Continuous developments in 5G technology- Emergence of AI to automate processesCHALLENGES- Effective workforce management- Cybersecurity concerns arising out of breaches
-
5.3 CASE STUDY ANALYSISCASE STUDY 1: TECNOLÓGICO DE MONTERREY DEPLOYED ITSM SOLUTIONS TO REVOLUTIONIZE USER EXPERIENCECASE STUDY 2: NEXTIVA DEPLOYED ATLASSIAN’S JIRA SERVICE MANAGEMENT TO ACHIEVE EFFECTIVE SERVICE PROVISIONCASE STUDY 3: WILDBERRIES ADOPTED AXIOS ASSIST TO ENHANCE AND OPTIMIZE BUSINESS SUPPORT PROCESS(ES) TO INCREASE REVENUECASE STUDY 4: TELEFÓNICA DEPLOYED BMC SOFTWARE’S SOLUTIONS TO ACHIEVE IMPROVED SOFTWARE ASSET MANAGEMENTCASE STUDY 5: ALGAR TECH IMPLEMENTED BROADCOM’S SOLUTIONS TO LEVERAGE ITSM SERVICE PROVISION FOR OPTIMAL PRODUCTION AND BUSINESS GROWTH
- 5.4 ECOSYSTEM ANALYSIS
- 5.5 VALUE CHAIN ANALYSIS
-
5.6 TECHNOLOGY ANALYSISKEY TECHNOLOGIES- Chatops- Self-service portals- Artificial intelligence- Machine learningCOMPLEMENTARY TECHNOLOGIES- Microservices- API integrationsADJACENT TECHNOLOGIES- Augmented reality (AR) & virtual reality (VR)- 5G
-
5.7 PRICING ANALYSISINDICATIVE PRICING ANALYSIS OF ITSM SOLUTIONS
- 5.8 BUSINESS MODEL ANALYSIS
- 5.9 PATENT ANALYSIS
-
5.10 PORTER’S FIVE FORCES ANALYSISTHREAT OF NEW ENTRANTSTHREAT OF SUBSTITUTESBARGAINING POWER OF SUPPLIERSBARGAINING POWER OF BUYERSINTENSITY OF COMPETITION RIVALRY
-
5.11 REGULATORY LANDSCAPEREGULATIONS, BY REGION- North America- Europe- Asia Pacific- Rest of the World
- 5.12 KEY CONFERENCES & EVENTS
- 5.13 EMERGING TRENDS IN ITSM MARKET
-
5.14 KEY STAKEHOLDERS AND BUYING CRITERIAKEY STAKEHOLDERS IN BUYING PROCESSBUYING CRITERIA
-
6.1 INTRODUCTIONOFFERINGS: ITSM MARKET DRIVERS
-
6.2 SOLUTIONSITSM SOLUTIONS AID IN COST REDUCTION, TIME SAVING, AND PROCESS AGILITYSERVICE PORTFOLIO MANAGEMENT- Service catalog management- Service pipeline management- Demand management- OthersCONFIGURATION & CHANGE MANAGEMENT- Configuration management database- Change control- Version control- OthersSERVICE DESK SOFTWARE- Incident management- Problem management- Service request management- Knowledge base- OthersOPERATIONS & PERFORMANCE MANAGEMENT- Performance monitoring- Capacity management- Event management- OthersDASHBOARD, REPORTING, AND ANALYTICS
-
6.3 SERVICESMANAGED AND PROFESSIONAL SERVICES HELP LEVERAGE ITSM ADOPTION AMONG ENTERPRISESMANAGED SERVICESPROFESSIONAL SERVICES- Consulting- Integration & implementation- Training, support, and maintenance
-
7.1 INTRODUCTIONORGANIZATION SIZE: ITSM MARKET DRIVERS
-
7.2 LARGE ENTERPRISESNEED FOR MANAGEMENT AND OPERATIONAL IMPROVEMENT TO LEAD TO LARGE-SCALE ADOPTION OF ITSM SERVICES
-
7.3 SMESSMES GAIN COMPETITIVE ADVANTAGE WITH ITSM ADOPTION, PRACTICE, AND IMPLEMENTATION
-
8.1 INTRODUCTIONDEPLOYMENT MODELS: ITSM MARKET DRIVERS
-
8.2 ON-PREMISESON-PREMISES CUSTOMIZATION OF ITSM SOLUTIONS TO ACHIEVE PRODUCTION EXCELLENCY AND ENSURE DATA SOVEREIGNTY
-
8.3 CLOUDGROWING NEED FOR CLOUD DEPLOYMENT OF ITSM SOLUTIONS FOR RAPID DEVELOPMENT AND SEAMLESS SERVICE PROVISION TO BOOST MARKET
-
9.1 INTRODUCTIONVERTICALS: ITSM MARKET DRIVERS
-
9.2 BANKING, FINANCIAL SERVICES, AND INSURANCE (BFSI)BFSI: APPLICATION AREAS- Transaction processing- Security management- Compliance management- Other BFSI applications
-
9.3 TELECOMMUNICATIONSTELECOMMUNICATIONS: APPLICATION AREAS- Network management- Service provisioning- Incident management- Other telecommunication applications
-
9.4 IT & ITESIT & ITES: APPLICATION AREAS- Service desk support- Change management- Application development & maintenance- Other IT & ITeS applications
-
9.5 GOVERNMENT & PUBLIC SECTORGOVERNMENT & PUBLIC SECTOR: APPLICATION AREAS- eGovernment services- IT infrastructure management- Security & compliance- Other government & public sector applications
-
9.6 RETAIL & CONSUMER GOODSRETAIL & CONSUMER GOODS: APPLICATION AREAS- eCommerce platform management- Inventory management systems- Customer support- Other retail & consumer goods applications
-
9.7 MANUFACTURINGMANUFACTURING: APPLICATION AREAS- Manufacturing Execution Systems (MESs)- Supply chain management- Quality control systems- Other manufacturing applications
-
9.8 ENERGY & UTILITIESENERGY & UTILITIES: APPLICATION AREAS- Smart grid management- SCADA systems- Asset management- Other energy & utility applications
-
9.9 MEDIA & ENTERTAINMENTMEDIA & ENTERTAINMENT: APPLICATION AREAS- Content Management Systems (CMSs)- Digital Rights Management (DRM)- Broadcasting systems- Other BFSI applications
-
9.10 HEALTHCAREHEALTHCARE: APPLICATION AREAS- Electronic Health Records (EHRs)- Healthcare IT systems management- Patient care applications- Other healthcare applications
-
9.11 EDUCATIONEDUCATION: APPLICATION AREAS- Learning Management Systems (LMSs)- Student Information Systems (SISs)- Campus IT infrastructure- Other education applications
- 9.12 OTHER VERTICALS
- 10.1 INTRODUCTION
-
10.2 NORTH AMERICANORTH AMERICA: ITSM MARKET DRIVERSNORTH AMERICA: RECESSION IMPACTUS- US government initiatives toward regulating cloud services such as FedRAMPCANADA- High adoption of big data and government digital services offered in Canada
-
10.3 EUROPEEUROPE: ITSM MARKET DRIVERSEUROPE: RECESSION IMPACTUK- Extensive initiatives by UK government and European Parliament for servers and data storage productsGERMANY- Industry 4.0, increased digital economy initiatives, high industrial tech spending, and growth in smart cities in GermanyFRANCE- National investment program to support Digital France Plan for 2025 to encourage companies to expand in countryNETHERLANDS- Digital transformation with hybrid workspaces to drive need for ITSM foundation in NetherlandsITALY- Smart city initiatives and 5G deployment for edge computing solutions in Italy to drive growthREST OF EUROPE
-
10.4 ASIA PACIFICASIA PACIFIC: ITSM MARKET DRIVERSASIA PACIFIC: RECESSION IMPACTCHINA- Free trade ecosystem and Belt and Road initiatives to increase need for ITSM infrastructure supporting high-density facilitiesJAPAN- Japan’s headway into automation, mainly in automotive and industrial robotics, to warrant low latency platformsAUSTRALIA- Demand for data processing and information interaction with high internet usageSINGAPORE- Large-scale implementation of best practice frameworks such as ITILREST OF ASIA PACIFIC
-
10.5 MIDDLE EAST & AFRICAMIDDLE EAST & AFRICA: ITSM MARKET DRIVERSMIDDLE EAST & AFRICA: RECESSION IMPACTGCC COUNTRIES (GULF COOPERATION COUNCIL)- Saudi Arabia- UAE- Rest of GCC CountriesSOUTH AFRICA- High usage of mobile technologies and colocation facilities in South AfricaREST OF THE MIDDLE EAST & AFRICA
-
10.6 LATIN AMERICALATIN AMERICA: ITSM MARKET DRIVERSLATIN AMERICA: RECESSION IMPACTBRAZIL- Latency issues and interest in 5G deployment to attract more cloud players to BrazilMEXICO- Increased opportunities for content delivery providers and significant investments from global giantsREST OF LATIN AMERICA
- 11.1 OVERVIEW
- 11.2 STRATEGIES ADOPTED BY KEY PLAYERS/RIGHT TO WIN
- 11.3 REVENUE ANALYSIS
- 11.4 COMPANY FINANCIAL METRICS
- 11.5 MARKET SHARE ANALYSIS
- 11.6 ITSM MARKET: VENDOR PRODUCTS/COMPARISON OF BRANDS
-
11.7 COMPANY EVALUATION MATRIXSTARSEMERGING LEADERSPERVASIVE PLAYERSPARTICIPANTSCOMPANY FOOTPRINT
-
11.8 START-UP/SME EVALUATION MATRIXPROGRESSIVE COMPANIESRESPONSIVE COMPANIESDYNAMIC COMPANIESSTARTING BLOCKSCOMPETITIVE BENCHMARKING
-
11.9 COMPETITIVE SCENARIO AND TRENDSPRODUCT LAUNCHES AND ENHANCEMENTSDEALS
- 12.1 INTRODUCTION
-
12.2 KEY PLAYERSSERVICENOW- Business overview- Products/Solutions/Services offered- Recent developments- MnM viewBMC SOFTWARE- Business overview- Products/Solutions/Services offered- Recent developments- MnM viewBROADCOM- Business overview- Products/Solutions/Services offered- Recent developments- MnM viewMANAGEENGINE- Business overview- Products/Solutions/Services offered- Recent developments- MnM viewIVANTI- Business overview- Products/Solutions/Services offered- Recent developments- MnM viewZENDESK- Business overview- Products/Solutions/Services offered- Recent developmentsGOTO- Business overview- Products/Solutions/Services offered- Recent developmentsSOLARWINDS- Business overview- Products/Solutions/Services offered- Recent developmentsATLASSIAN- Business overview- Products/Solutions/Services offered- Recent developmentsOPENTEXT- Business overview- Products/Solutions/Services offeredSYMPHONYAI SUMMIT- Business overview- Products/Solutions/Services offered- Recent developmentsEFECTE- Business overview- Products/Solutions/Services offered- Recent developments
-
12.3 OTHER PLAYERSMICROSOFTIBMIFSFRESHWORKSEASYVISTAITARIANSYSAID TECHNOLOGIESINVGATEALEMBAHORNBILLNINJAONEHALOITSMAISERA4METOPDESKTEAMDYNAMIX
-
13.1 INTRODUCTIONRELATED MARKETS
- 13.2 CLOUD ITSM MARKET
- 13.3 CONFIGURATION MANAGEMENT MARKET
- 14.1 DISCUSSION GUIDE
- 14.2 KNOWLEDGESTORE: MARKETSANDMARKETS’ SUBSCRIPTION PORTAL
- 14.3 CUSTOMIZATION OPTIONS
- 14.4 RELATED REPORTS
- 14.5 AUTHOR DETAILS
- TABLE 1 USD EXCHANGE RATES, 2018–2022
- TABLE 2 FACTOR ANALYSIS
- TABLE 3 RECESSION IMPACT
- TABLE 4 INDICATIVE PRICING ANALYSIS OF ITSM SOLUTIONS OFFERED BY KEY PLAYERS
- TABLE 5 TOP TEN PATENT OWNERS
- TABLE 6 PATENTS GRANTED TO VENDORS IN ITSM MARKET
- TABLE 7 IMPACT OF PORTER’S FIVE FORCES ON ITSM MARKET
- TABLE 8 NORTH AMERICA: LIST OF REGULATORY BODIES, GOVERNMENT AGENCIES, AND OTHER ORGANIZATIONS
- TABLE 9 EUROPE: LIST OF REGULATORY BODIES, GOVERNMENT AGENCIES, AND OTHER ORGANIZATIONS
- TABLE 10 ASIA PACIFIC: LIST OF REGULATORY BODIES, GOVERNMENT AGENCIES, AND OTHER ORGANIZATIONS
- TABLE 11 REST OF THE WORLD: LIST OF REGULATORY BODIES, GOVERNMENT AGENCIES, AND OTHER ORGANIZATIONS
- TABLE 12 ITSM MARKET: DETAILED LIST OF CONFERENCES & EVENTS, 2023–2024
- TABLE 13 INFLUENCE OF STAKEHOLDERS ON BUYING PROCESS FOR TOP VERTICALS
- TABLE 14 KEY BUYING CRITERIA FOR TOP VERTICALS
- TABLE 15 ITSM MARKET, BY OFFERING, 2018–2022 (USD MILLION)
- TABLE 16 ITSM MARKET, BY OFFERING, 2023–2028 (USD MILLION)
- TABLE 17 ITSM MARKET, BY SOLUTION, 2018–2022 (USD MILLION)
- TABLE 18 ITSM MARKET, BY SOLUTION, 2023–2028 (USD MILLION)
- TABLE 19 SOLUTIONS: ITSM MARKET, BY REGION, 2018–2022 (USD MILLION)
- TABLE 20 SOLUTIONS: ITSM MARKET, BY REGION, 2023–2028 (USD MILLION)
- TABLE 21 SERVICE PORTFOLIO MANAGEMENT: ITSM MARKET, BY REGION, 2018–2022 (USD MILLION)
- TABLE 22 SERVICE PORTFOLIO MANAGEMENT: ITSM MARKET, BY REGION, 2023–2028 (USD MILLION)
- TABLE 23 CONFIGURATION & CHANGE MANAGEMENT: ITSM MARKET, BY REGION, 2018–2022 (USD MILLION)
- TABLE 24 CONFIGURATION & CHANGE MANAGEMENT: ITSM MARKET, BY REGION, 2023–2028 (USD MILLION)
- TABLE 25 SERVICE DESK SOFTWARE: ITSM MARKET, BY REGION, 2018–2022 (USD MILLION)
- TABLE 26 SERVICE DESK SOFTWARE: ITSM MARKET, BY REGION, 2023–2028 (USD MILLION)
- TABLE 27 OPERATIONS & PERFORMANCE MANAGEMENT: ITSM MARKET, BY REGION, 2018–2022 (USD MILLION)
- TABLE 28 OPERATIONS & PERFORMANCE MANAGEMENT: ITSM MARKET, BY REGION, 2023–2028 (USD MILLION)
- TABLE 29 DASHBOARD, REPORTING, AND ANALYTICS: ITSM MARKET, BY REGION, 2018–2022 (USD MILLION)
- TABLE 30 DASHBOARD, REPORTING, AND ANALYTICS: ITSM MARKET, BY REGION, 2023–2028 (USD MILLION)
- TABLE 31 ITSM MARKET, BY SERVICE, 2018–2022 (USD MILLION)
- TABLE 32 ITSM MARKET, BY SERVICE, 2023–2028 (USD MILLION)
- TABLE 33 SERVICES: ITSM MARKET, BY REGION, 2018–2022 (USD MILLION)
- TABLE 34 SERVICES: ITSM MARKET, BY REGION, 2023–2028 (USD MILLION)
- TABLE 35 MANAGED SERVICES: ITSM MARKET, BY REGION, 2018–2022 (USD MILLION)
- TABLE 36 MANAGED SERVICES: ITSM MARKET, BY REGION, 2023–2028 (USD MILLION)
- TABLE 37 PROFESSIONAL SERVICES: ITSM MARKET, BY REGION, 2018–2022 (USD MILLION)
- TABLE 38 PROFESSIONAL SERVICES: ITSM MARKET, BY REGION, 2023–2028 (USD MILLION)
- TABLE 39 ITSM MARKET, BY ORGANIZATION SIZE, 2018–2022 (USD MILLION)
- TABLE 40 ITSM MARKET, BY ORGANIZATION SIZE, 2023–2028 (USD MILLION)
- TABLE 41 LARGE ENTERPRISES: ITSM MARKET, BY REGION, 2018–2022 (USD MILLION)
- TABLE 42 LARGE ENTERPRISES: ITSM MARKET, BY REGION, 2023–2028 (USD MILLION)
- TABLE 43 SMES: ITSM MARKET, BY REGION, 2018–2022 (USD MILLION)
- TABLE 44 SMES: ITSM MARKET, BY REGION, 2023–2028 (USD MILLION)
- TABLE 45 ITSM MARKET, BY DEPLOYMENT MODEL, 2018–2022 (USD MILLION)
- TABLE 46 ITSM MARKET, BY DEPLOYMENT MODEL, 2023–2028 (USD MILLION)
- TABLE 47 ON-PREMISES: ITSM MARKET, BY REGION, 2018–2022 (USD MILLION)
- TABLE 48 ON-PREMISES: ITSM MARKET, BY REGION, 2023–2028 (USD MILLION)
- TABLE 49 CLOUD: ITSM MARKET, BY REGION, 2018–2022 (USD MILLION)
- TABLE 50 CLOUD: ITSM MARKET, BY REGION, 2023–2028 (USD MILLION)
- TABLE 51 ITSM MARKET, BY VERTICAL, 2018–2022 (USD MILLION)
- TABLE 52 ITSM MARKET, BY VERTICAL, 2023–2028 (USD MILLION)
- TABLE 53 BFSI: ITSM MARKET, BY REGION, 2018–2022 (USD MILLION)
- TABLE 54 BFSI: ITSM MARKET, BY REGION, 2023–2028 (USD MILLION)
- TABLE 55 TELECOMMUNICATIONS: ITSM MARKET, BY REGION, 2018–2022 (USD MILLION)
- TABLE 56 TELECOMMUNICATIONS: ITSM MARKET, BY REGION, 2023–2028 (USD MILLION)
- TABLE 57 IT & ITES: ITSM MARKET, BY REGION, 2018–2022 (USD MILLION)
- TABLE 58 IT & ITES: ITSM MARKET, BY REGION, 2023–2028 (USD MILLION)
- TABLE 59 GOVERNMENT & PUBLIC SECTOR: ITSM MARKET, BY REGION, 2018–2022 (USD MILLION)
- TABLE 60 GOVERNMENT & PUBLIC SECTOR: ITSM MARKET, BY REGION, 2023–2028 (USD MILLION)
- TABLE 61 RETAIL & CONSUMER GOODS: ITSM MARKET, BY REGION, 2018–2022 (USD MILLION)
- TABLE 62 RETAIL & CONSUMER GOODS: ITSM MARKET, BY REGION, 2023–2028 (USD MILLION)
- TABLE 63 MANUFACTURING: ITSM MARKET, BY REGION, 2018–2022 (USD MILLION)
- TABLE 64 MANUFACTURING: ITSM MARKET, BY REGION, 2023–2028 (USD MILLION)
- TABLE 65 ENERGY & UTILITIES: ITSM MARKET, BY REGION, 2018–2022 (USD MILLION)
- TABLE 66 ENERGY & UTILITIES: ITSM MARKET, BY REGION, 2023–2028 (USD MILLION)
- TABLE 67 MEDIA & ENTERTAINMENT: ITSM MARKET, BY REGION, 2018–2022 (USD MILLION)
- TABLE 68 MEDIA & ENTERTAINMENT: ITSM MARKET, BY REGION, 2023–2028 (USD MILLION)
- TABLE 69 HEALTHCARE: ITSM MARKET, BY REGION, 2018–2022 (USD MILLION)
- TABLE 70 HEALTHCARE: ITSM MARKET, BY REGION, 2023–2028 (USD MILLION)
- TABLE 71 EDUCATION: ITSM MARKET, BY REGION, 2018–2022 (USD MILLION)
- TABLE 72 EDUCATION: ITSM MARKET, BY REGION, 2023–2028 (USD MILLION)
- TABLE 73 OTHER VERTICALS: ITSM MARKET, BY REGION, 2018–2022 (USD MILLION)
- TABLE 74 OTHER VERTICALS: ITSM MARKET, BY REGION, 2023–2028 (USD MILLION)
- TABLE 75 ITSM MARKET, BY REGION, 2018–2022 (USD MILLION)
- TABLE 76 ITSM MARKET, BY REGION, 2023–2028 (USD MILLION)
- TABLE 77 NORTH AMERICA: ITSM MARKET, BY OFFERING, 2018–2022 (USD MILLION)
- TABLE 78 NORTH AMERICA: ITSM MARKET, BY OFFERING, 2023–2028 (USD MILLION)
- TABLE 79 NORTH AMERICA: ITSM MARKET, BY SOLUTION, 2018–2022 (USD MILLION)
- TABLE 80 NORTH AMERICA: ITSM MARKET, BY SOLUTION, 2023–2028 (USD MILLION)
- TABLE 81 NORTH AMERICA: ITSM MARKET, BY SERVICE, 2018–2022 (USD MILLION)
- TABLE 82 NORTH AMERICA: ITSM MARKET, BY SERVICE, 2023–2028 (USD MILLION)
- TABLE 83 NORTH AMERICA: ITSM MARKET, BY DEPLOYMENT MODEL, 2018–2022 (USD MILLION)
- TABLE 84 NORTH AMERICA: ITSM MARKET, BY DEPLOYMENT MODEL, 2023–2028 (USD MILLION)
- TABLE 85 NORTH AMERICA: ITSM MARKET, BY ORGANIZATION SIZE, 2018–2022 (USD MILLION)
- TABLE 86 NORTH AMERICA: ITSM MARKET, BY ORGANIZATION SIZE, 2023–2028 (USD MILLION)
- TABLE 87 NORTH AMERICA: ITSM MARKET, BY VERTICAL, 2018–2022 (USD MILLION)
- TABLE 88 NORTH AMERICA: ITSM MARKET, BY VERTICAL, 2023–2028 (USD MILLION)
- TABLE 89 NORTH AMERICA: ITSM MARKET, BY COUNTRY, 2018–2022 (USD MILLION)
- TABLE 90 NORTH AMERICA: ITSM MARKET, BY COUNTRY, 2023–2028 (USD MILLION)
- TABLE 91 US: ITSM MARKET, BY OFFERING, 2018–2022 (USD MILLION)
- TABLE 92 US: ITSM MARKET, BY OFFERING, 2023–2028 (USD MILLION)
- TABLE 93 US: ITSM MARKET, BY ORGANIZATION SIZE, 2018–2022 (USD MILLION)
- TABLE 94 US: ITSM MARKET, BY ORGANIZATION SIZE, 2023–2028 (USD MILLION)
- TABLE 95 CANADA: ITSM MARKET, BY OFFERING, 2018–2022 (USD MILLION)
- TABLE 96 CANADA: ITSM MARKET, BY OFFERING, 2023–2028 (USD MILLION)
- TABLE 97 CANADA: ITSM MARKET, BY ORGANIZATION SIZE, 2018–2022 (USD MILLION)
- TABLE 98 CANADA: ITSM MARKET, BY ORGANIZATION SIZE, 2023–2028 (USD MILLION)
- TABLE 99 EUROPE: ITSM MARKET, BY OFFERING, 2018–2022 (USD MILLION)
- TABLE 100 EUROPE: ITSM MARKET, BY OFFERING, 2023–2028 (USD MILLION)
- TABLE 101 EUROPE: ITSM MARKET, BY SOLUTION, 2018–2022 (USD MILLION)
- TABLE 102 EUROPE: ITSM MARKET, BY SOLUTION, 2023–2028 (USD MILLION)
- TABLE 103 EUROPE: ITSM MARKET, BY SERVICE, 2018–2022 (USD MILLION)
- TABLE 104 EUROPE: ITSM MARKET, BY SERVICE, 2023–2028 (USD MILLION)
- TABLE 105 EUROPE: ITSM MARKET, BY DEPLOYMENT MODEL, 2018–2022 (USD MILLION)
- TABLE 106 EUROPE: ITSM MARKET, BY DEPLOYMENT MODEL, 2023–2028 (USD MILLION)
- TABLE 107 EUROPE: ITSM MARKET, BY ORGANIZATION SIZE, 2018–2022 (USD MILLION)
- TABLE 108 EUROPE: ITSM MARKET, BY ORGANIZATION SIZE, 2023–2028 (USD MILLION)
- TABLE 109 EUROPE: ITSM MARKET, BY VERTICAL, 2018–2022 (USD MILLION)
- TABLE 110 EUROPE: ITSM MARKET, BY VERTICAL, 2023–2028 (USD MILLION)
- TABLE 111 EUROPE: ITSM MARKET, BY COUNTRY, 2018–2022 (USD MILLION)
- TABLE 112 EUROPE: ITSM MARKET, BY COUNTRY, 2023–2028 (USD MILLION)
- TABLE 113 UK: ITSM MARKET, BY OFFERING, 2018–2022 (USD MILLION)
- TABLE 114 UK: ITSM MARKET, BY OFFERING, 2023–2028 (USD MILLION)
- TABLE 115 UK: ITSM MARKET, BY ORGANIZATION SIZE, 2018–2022 (USD MILLION)
- TABLE 116 UK: ITSM MARKET, BY ORGANIZATION SIZE, 2023–2028 (USD MILLION)
- TABLE 117 GERMANY: ITSM MARKET, BY OFFERING, 2018–2022 (USD MILLION)
- TABLE 118 GERMANY: ITSM MARKET, BY OFFERING, 2023–2028 (USD MILLION)
- TABLE 119 GERMANY: ITSM MARKET, BY ORGANIZATION SIZE, 2018–2022 (USD MILLION)
- TABLE 120 GERMANY: ITSM MARKET, BY ORGANIZATION SIZE, 2023–2028 (USD MILLION)
- TABLE 121 FRANCE: ITSM MARKET, BY OFFERING, 2018–2022 (USD MILLION)
- TABLE 122 FRANCE: ITSM MARKET, BY OFFERING, 2023–2028 (USD MILLION)
- TABLE 123 FRANCE: ITSM MARKET, BY ORGANIZATION SIZE, 2018–2022 (USD MILLION)
- TABLE 124 FRANCE: ITSM MARKET, BY ORGANIZATION SIZE, 2023–2028 (USD MILLION)
- TABLE 125 NETHERLANDS: ITSM MARKET, BY OFFERING, 2018–2022 (USD MILLION)
- TABLE 126 NETHERLANDS: ITSM MARKET, BY OFFERING, 2023–2028 (USD MILLION)
- TABLE 127 NETHERLANDS: ITSM MARKET, BY ORGANIZATION SIZE, 2018–2022 (USD MILLION)
- TABLE 128 NETHERLANDS: ITSM MARKET, BY ORGANIZATION SIZE, 2023–2028 (USD MILLION)
- TABLE 129 ITALY: ITSM MARKET, BY OFFERING, 2018–2022 (USD MILLION)
- TABLE 130 ITALY: ITSM MARKET, BY OFFERING, 2023–2028 (USD MILLION)
- TABLE 131 ITALY: ITSM MARKET, BY ORGANIZATION SIZE, 2018–2022 (USD MILLION)
- TABLE 132 ITALY: ITSM MARKET, BY ORGANIZATION SIZE, 2023–2028 (USD MILLION)
- TABLE 133 REST OF EUROPE: ITSM MARKET, BY OFFERING, 2018–2022 (USD MILLION)
- TABLE 134 REST OF EUROPE: ITSM MARKET, BY OFFERING, 2023–2028 (USD MILLION)
- TABLE 135 REST OF EUROPE: ITSM MARKET, BY ORGANIZATION SIZE, 2018–2022 (USD MILLION)
- TABLE 136 REST OF EUROPE: ITSM MARKET, BY ORGANIZATION SIZE, 2023–2028 (USD MILLION)
- TABLE 137 ASIA PACIFIC: ITSM MARKET, BY OFFERING, 2018–2022 (USD MILLION)
- TABLE 138 ASIA PACIFIC: ITSM MARKET, BY OFFERING, 2023–2028 (USD MILLION)
- TABLE 139 ASIA PACIFIC: ITSM MARKET, BY SOLUTION, 2018–2022 (USD MILLION)
- TABLE 140 ASIA PACIFIC: ITSM MARKET, BY SOLUTION, 2023–2028 (USD MILLION)
- TABLE 141 ASIA PACIFIC: ITSM MARKET, BY SERVICE, 2018–2022 (USD MILLION)
- TABLE 142 ASIA PACIFIC: ITSM MARKET, BY SERVICE, 2023–2028 (USD MILLION)
- TABLE 143 ASIA PACIFIC: ITSM MARKET, BY DEPLOYMENT MODEL, 2018–2022 (USD MILLION)
- TABLE 144 ASIA PACIFIC: ITSM MARKET, BY DEPLOYMENT MODEL, 2023–2028 (USD MILLION)
- TABLE 145 ASIA PACIFIC: ITSM MARKET, BY ORGANIZATION SIZE, 2018–2022 (USD MILLION)
- TABLE 146 ASIA PACIFIC: ITSM MARKET, BY ORGANIZATION SIZE, 2023–2028 (USD MILLION)
- TABLE 147 ASIA PACIFIC: ITSM MARKET, BY VERTICAL, 2018–2022 (USD MILLION)
- TABLE 148 ASIA PACIFIC: ITSM MARKET, BY VERTICAL, 2023–2028 (USD MILLION)
- TABLE 149 ASIA PACIFIC: ITSM MARKET, BY COUNTRY, 2018–2022 (USD MILLION)
- TABLE 150 ASIA PACIFIC: ITSM MARKET, BY COUNTRY, 2023–2028 (USD MILLION)
- TABLE 151 CHINA: ITSM MARKET, BY OFFERING, 2018–2022 (USD MILLION)
- TABLE 152 CHINA: ITSM MARKET, BY OFFERING, 2023–2028 (USD MILLION)
- TABLE 153 CHINA: ITSM MARKET, BY ORGANIZATION SIZE, 2018–2022 (USD MILLION)
- TABLE 154 CHINA: ITSM MARKET, BY ORGANIZATION SIZE, 2023–2028 (USD MILLION)
- TABLE 155 JAPAN: ITSM MARKET, BY OFFERING, 2018–2022 (USD MILLION)
- TABLE 156 JAPAN: ITSM MARKET, BY OFFERING, 2023–2028 (USD MILLION)
- TABLE 157 JAPAN: ITSM MARKET, BY ORGANIZATION SIZE, 2018–2022 (USD MILLION)
- TABLE 158 JAPAN: ITSM MARKET, BY ORGANIZATION SIZE, 2023–2028 (USD MILLION)
- TABLE 159 AUSTRALIA: ITSM MARKET, BY OFFERING, 2018–2022 (USD MILLION)
- TABLE 160 AUSTRALIA: ITSM MARKET, BY OFFERING, 2023–2028 (USD MILLION)
- TABLE 161 AUSTRALIA: ITSM MARKET, BY ORGANIZATION SIZE, 2018–2022 (USD MILLION)
- TABLE 162 AUSTRALIA: ITSM MARKET, BY ORGANIZATION SIZE, 2023–2028 (USD MILLION)
- TABLE 163 SINGAPORE: ITSM MARKET, BY OFFERING, 2018–2022 (USD MILLION)
- TABLE 164 SINGAPORE: ITSM MARKET, BY OFFERING, 2023–2028 (USD MILLION)
- TABLE 165 SINGAPORE: ITSM MARKET, BY ORGANIZATION SIZE, 2018–2022 (USD MILLION)
- TABLE 166 SINGAPORE: ITSM MARKET, BY ORGANIZATION SIZE, 2023–2028 (USD MILLION)
- TABLE 167 REST OF ASIA PACIFIC: ITSM MARKET, BY OFFERING, 2018–2022 (USD MILLION)
- TABLE 168 REST OF ASIA PACIFIC: ITSM MARKET, BY OFFERING, 2023–2028 (USD MILLION)
- TABLE 169 REST OF ASIA PACIFIC: ITSM MARKET, BY ORGANIZATION SIZE, 2018–2022 (USD MILLION)
- TABLE 170 REST OF ASIA PACIFIC: ITSM MARKET, BY ORGANIZATION SIZE, 2023–2028 (USD MILLION)
- TABLE 171 MIDDLE EAST & AFRICA: ITSM MARKET, BY OFFERING, 2018–2022 (USD MILLION)
- TABLE 172 MIDDLE EAST & AFRICA: ITSM MARKET, BY OFFERING, 2023–2028 (USD MILLION)
- TABLE 173 MIDDLE EAST & AFRICA: ITSM MARKET, BY SOLUTION, 2018–2022 (USD MILLION)
- TABLE 174 MIDDLE EAST & AFRICA: ITSM MARKET, BY SOLUTION, 2023–2028 (USD MILLION)
- TABLE 175 MIDDLE EAST & AFRICA: ITSM MARKET, BY SERVICE, 2018–2022 (USD MILLION)
- TABLE 176 MIDDLE EAST & AFRICA: ITSM MARKET, BY SERVICE, 2023–2028 (USD MILLION)
- TABLE 177 MIDDLE EAST & AFRICA: ITSM MARKET, BY DEPLOYMENT MODEL, 2018–2022 (USD MILLION)
- TABLE 178 MIDDLE EAST & AFRICA: ITSM MARKET, BY DEPLOYMENT MODEL, 2023–2028 (USD MILLION)
- TABLE 179 MIDDLE EAST & AFRICA: ITSM MARKET, BY ORGANIZATION SIZE, 2018–2022 (USD MILLION)
- TABLE 180 MIDDLE EAST & AFRICA: ITSM MARKET, BY ORGANIZATION SIZE, 2023–2028 (USD MILLION)
- TABLE 181 MIDDLE EAST & AFRICA: ITSM MARKET, BY VERTICAL, 2018–2022 (USD MILLION)
- TABLE 182 MIDDLE EAST & AFRICA: ITSM MARKET, BY VERTICAL, 2023–2028 (USD MILLION)
- TABLE 183 MIDDLE EAST & AFRICA: ITSM MARKET, BY COUNTRY/REGION, 2018–2022 (USD MILLION)
- TABLE 184 MIDDLE EAST & AFRICA: ITSM MARKET, BY COUNTRY/REGION, 2023–2028 (USD MILLION)
- TABLE 185 SAUDI ARABIA: ITSM MARKET, BY OFFERING, 2018–2022 (USD MILLION)
- TABLE 186 SAUDI ARABIA: ITSM MARKET, BY OFFERING, 2023–2028 (USD MILLION)
- TABLE 187 SAUDI ARABIA: ITSM MARKET, BY ORGANIZATION SIZE, 2018–2022 (USD MILLION)
- TABLE 188 SAUDI ARABIA: ITSM MARKET, BY ORGANIZATION SIZE, 2023–2028 (USD MILLION)
- TABLE 189 UAE: ITSM MARKET, BY OFFERING, 2018–2022 (USD MILLION)
- TABLE 190 UAE: ITSM MARKET, BY OFFERING, 2023–2028 (USD MILLION)
- TABLE 191 UAE: ITSM MARKET, BY ORGANIZATION SIZE, 2018–2022 (USD MILLION)
- TABLE 192 UAE: ITSM MARKET, BY ORGANIZATION SIZE, 2023–2028 (USD MILLION)
- TABLE 193 REST OF GCC COUNTRIES: ITSM MARKET, BY OFFERING, 2018–2022 (USD MILLION)
- TABLE 194 REST OF GCC COUNTRIES: ITSM MARKET, BY OFFERING, 2023–2028 (USD MILLION)
- TABLE 195 REST OF GCC COUNTRIES: ITSM MARKET, BY ORGANIZATION SIZE, 2018–2022 (USD MILLION)
- TABLE 196 REST OF GCC COUNTRIES: ITSM MARKET, BY ORGANIZATION SIZE, 2023–2028 (USD MILLION)
- TABLE 197 SOUTH AFRICA: ITSM MARKET, BY OFFERING, 2018–2022 (USD MILLION)
- TABLE 198 SOUTH AFRICA: ITSM MARKET, BY OFFERING, 2023–2028 (USD MILLION)
- TABLE 199 SOUTH AFRICA: ITSM MARKET, BY ORGANIZATION SIZE, 2018–2022 (USD MILLION)
- TABLE 200 SOUTH AFRICA: ITSM MARKET, BY ORGANIZATION SIZE, 2023–2028 (USD MILLION)
- TABLE 201 REST OF MIDDLE EAST & AFRICA: ITSM MARKET, BY OFFERING, 2018–2022 (USD MILLION)
- TABLE 202 REST OF MIDDLE EAST & AFRICA: ITSM MARKET, BY OFFERING, 2023–2028 (USD MILLION)
- TABLE 203 REST OF MIDDLE EAST & AFRICA: ITSM MARKET, BY ORGANIZATION SIZE, 2018–2022 (USD MILLION)
- TABLE 204 REST OF MIDDLE EAST & AFRICA: ITSM MARKET, BY ORGANIZATION SIZE, 2023–2028 (USD MILLION)
- TABLE 205 LATIN AMERICA: ITSM MARKET, BY OFFERING, 2018–2022 (USD MILLION)
- TABLE 206 LATIN AMERICA: ITSM MARKET, BY OFFERING, 2023–2028 (USD MILLION)
- TABLE 207 LATIN AMERICA: ITSM MARKET, BY SOLUTION, 2018–2022 (USD MILLION)
- TABLE 208 LATIN AMERICA: ITSM MARKET, BY SOLUTION, 2023–2028 (USD MILLION)
- TABLE 209 LATIN AMERICA: ITSM MARKET, BY SERVICE, 2018–2022 (USD MILLION)
- TABLE 210 LATIN AMERICA: ITSM MARKET, BY SERVICE, 2023–2028 (USD MILLION)
- TABLE 211 LATIN AMERICA: ITSM MARKET, BY DEPLOYMENT MODEL, 2018–2022 (USD MILLION)
- TABLE 212 LATIN AMERICA: ITSM MARKET, BY DEPLOYMENT MODEL, 2023–2028 (USD MILLION)
- TABLE 213 LATIN AMERICA: ITSM MARKET, BY ORGANIZATION SIZE, 2018–2022 (USD MILLION)
- TABLE 214 LATIN AMERICA: ITSM MARKET, BY ORGANIZATION SIZE, 2023–2028 (USD MILLION)
- TABLE 215 LATIN AMERICA: ITSM MARKET, BY VERTICAL, 2018–2022 (USD MILLION)
- TABLE 216 LATIN AMERICA: ITSM MARKET, BY VERTICAL, 2023–2028 (USD MILLION)
- TABLE 217 LATIN AMERICA: ITSM MARKET, BY COUNTRY, 2018–2022 (USD MILLION)
- TABLE 218 LATIN AMERICA: ITSM MARKET, BY COUNTRY, 2023–2028 (USD MILLION)
- TABLE 219 BRAZIL: ITSM MARKET, BY OFFERING, 2018–2022 (USD MILLION)
- TABLE 220 BRAZIL: ITSM MARKET, BY OFFERING, 2023–2028 (USD MILLION)
- TABLE 221 BRAZIL: ITSM MARKET, BY ORGANIZATION SIZE, 2018–2022 (USD MILLION)
- TABLE 222 BRAZIL: ITSM MARKET, BY ORGANIZATION SIZE, 2023–2028 (USD MILLION)
- TABLE 223 MEXICO: ITSM MARKET, BY OFFERING, 2018–2022 (USD MILLION)
- TABLE 224 MEXICO: ITSM MARKET, BY OFFERING, 2023–2028 (USD MILLION)
- TABLE 225 MEXICO: ITSM MARKET, BY ORGANIZATION SIZE, 2018–2022 (USD MILLION)
- TABLE 226 MEXICO: ITSM MARKET, BY ORGANIZATION SIZE, 2023–2028 (USD MILLION)
- TABLE 227 REST OF LATIN AMERICA: ITSM MARKET, BY OFFERING, 2018–2022 (USD MILLION)
- TABLE 228 REST OF LATIN AMERICA: ITSM MARKET, BY OFFERING, 2023–2028 (USD MILLION)
- TABLE 229 REST OF LATIN AMERICA: ITSM MARKET, BY ORGANIZATION SIZE, 2018–2022 (USD MILLION)
- TABLE 230 REST OF LATIN AMERICA: ITSM MARKET, BY ORGANIZATION SIZE, 2023–2028 (USD MILLION)
- TABLE 231 OVERVIEW OF STRATEGIES ADOPTED BY KEY ITSM VENDORS
- TABLE 232 ITSM MARKET: INTENSITY OF COMPETITION RIVARY
- TABLE 233 VENDOR PRODUCTS/COMPARISON OF BRANDS
- TABLE 234 OVERALL GLOBAL COMPANY FOOTPRINT
- TABLE 235 COMPANY OFFERING FOOTPRINT
- TABLE 236 COMPANY VERTICAL FOOTPRINT
- TABLE 237 COMPANY REGION FOOTPRINT
- TABLE 238 ITSM MARKET: DETAILED LIST OF KEY START-UPS/SMES
- TABLE 239 ITSM MARKET: COMPETITIVE BENCHMARKING OF START-UPS/SMES
- TABLE 240 PRODUCT LAUNCHES AND ENHANCEMENTS, 2021–2023
- TABLE 241 DEALS, 2021–2023
- TABLE 242 SERVICENOW: COMPANY OVERVIEW
- TABLE 243 SERVICENOW: PRODUCTS/SOLUTIONS/SERVICES OFFERED
- TABLE 244 SERVICENOW: PRODUCT LAUNCHES
- TABLE 245 SERVICENOW: DEALS
- TABLE 246 BMC SOFTWARE: COMPANY OVERVIEW
- TABLE 247 BMC SOFTWARE: PRODUCTS/SOLUTIONS/SERVICES OFFERED
- TABLE 248 BMC SOFTWARE: PRODUCT LAUNCHES
- TABLE 249 BMC SOFTWARE: DEALS
- TABLE 250 BROADCOM: COMPANY OVERVIEW
- TABLE 251 BROADCOM: PRODUCTS/SOLUTIONS/SERVICES OFFERED
- TABLE 252 BROADCOM: PRODUCT LAUNCHES
- TABLE 253 BROADCOM: DEALS
- TABLE 254 MANAGEENGINE: COMPANY OVERVIEW
- TABLE 255 MANAGEENGINE: PRODUCTS/SOLUTIONS/SERVICES OFFERED
- TABLE 256 MANAGEENGINE: PRODUCT LAUNCHES
- TABLE 257 MANAGEENGINE: DEALS
- TABLE 258 IVANTI: COMPANY OVERVIEW
- TABLE 259 IVANTI: PRODUCTS/SOLUTIONS/SERVICES OFFERED
- TABLE 260 IVANTI: PRODUCT LAUNCHES
- TABLE 261 IVANTI: DEALS
- TABLE 262 ZENDESK: COMPANY OVERVIEW
- TABLE 263 ZENDESK: PRODUCTS/SOLUTIONS/SERVICES OFFERED
- TABLE 264 ZENDESK: DEALS
- TABLE 265 GOTO: COMPANY OVERVIEW
- TABLE 266 GOTO: PRODUCTS/SOLUTIONS/SERVICES OFFERED
- TABLE 267 GOTO: PRODUCT LAUNCHES
- TABLE 268 GOTO: DEALS
- TABLE 269 SOLARWINDS: COMPANY OVERVIEW
- TABLE 270 SOLARWINDS: PRODUCTS/SOLUTIONS/SERVICES OFFERED
- TABLE 271 SOLARWINDS: PRODUCT LAUNCHES
- TABLE 272 SOLARWINDS: DEALS
- TABLE 273 ATLASSIAN: COMPANY OVERVIEW
- TABLE 274 ATLASSIAN: PRODUCTS/SOLUTIONS/SERVICES OFFERED
- TABLE 275 ATLASSIAN: PRODUCT LAUNCHES
- TABLE 276 ATLASSIAN: DEALS
- TABLE 277 OPENTEXT: COMPANY OVERVIEW
- TABLE 278 OPENTEXT: PRODUCTS/SOLUTIONS/SERVICES OFFERED
- TABLE 279 SYMPHONYAI SUMMIT: COMPANY OVERVIEW
- TABLE 280 SYMPHONYAI SUMMIT: PRODUCTS/SOLUTIONS/SERVICES OFFERED
- TABLE 281 SYMPHONYAI SUMMIT: PRODUCT LAUNCHES
- TABLE 282 SYMPHONYAI SUMMIT: DEALS
- TABLE 283 EFECTE: COMPANY OVERVIEW
- TABLE 284 EFECTE: PRODUCTS/SOLUTIONS/SERVICES OFFERED
- TABLE 285 EFECTE: PRODUCT LAUNCHES
- TABLE 286 EFECTE: DEALS
- TABLE 287 CLOUD ITSM MARKET, BY COMPONENT, 2016–2019 (USD MILLION)
- TABLE 288 CLOUD ITSM MARKET, BY COMPONENT, 2020–2025 (USD MILLION)
- TABLE 289 CLOUD ITSM MARKET, BY ORGANIZATION SIZE, 2016–2019 (USD MILLION)
- TABLE 290 CLOUD ITSM MARKET, BY ORGANIZATION SIZE, 2020–2025 (USD MILLION)
- TABLE 291 CLOUD ITSM MARKET, BY VERTICAL, 2016–2019 (USD MILLION)
- TABLE 292 CLOUD ITSM MARKET, BY VERTICAL, 2020–2025 (USD MILLION)
- TABLE 293 CLOUD ITSM MARKET, BY REGION, 2016–2019 (USD MILLION)
- TABLE 294 CLOUD ITSM MARKET, BY REGION, 2020–2025 (USD MILLION)
- TABLE 295 CONFIGURATION MANAGEMENT MARKET, BY MODULE, 2017–2024 (USD MILLION)
- TABLE 296 CONFIGURATION MANAGEMENT MARKET, BY SYSTEM, 2017–2024 (USD MILLION)
- TABLE 297 CONFIGURATION MANAGEMENT MARKET, BY COMPONENT, 2017–2024 (USD MILLION)
- TABLE 298 CONFIGURATION MANAGEMENT MARKET, BY ENTERPRISE SIZE, 2017–2024 (USD MILLION)
- TABLE 299 CONFIGURATION MANAGEMENT MARKET, BY END-USE VERTICAL, 2017–2024 (USD MILLION)
- TABLE 300 CONFIGURATION MANAGEMENT MARKET, BY REGION, 2017–2024 (USD MILLION)
- FIGURE 1 ITSM MARKET: RESEARCH DESIGN
- FIGURE 2 BREAKUP OF PRIMARY INTERVIEWS: BY COMPANY TYPE, DESIGNATION, AND REGION
- FIGURE 3 ITSM MARKET: TOP-DOWN AND BOTTOM-UP APPROACHES
- FIGURE 4 MARKET SIZE ESTIMATION METHODOLOGY: SUPPLY-SIDE ANALYSIS
- FIGURE 5 MARKET SIZE ESTIMATION METHODOLOGY – BOTTOM-UP APPROACH (SUPPLY SIDE): COLLECTIVE REVENUE OF ITSM VENDORS
- FIGURE 6 MARKET SIZE ESTIMATION METHODOLOGY – (SUPPLY SIDE): ILLUSTRATION OF VENDOR REVENUE ESTIMATION
- FIGURE 7 MARKET SIZE ESTIMATION METHODOLOGY – APPROACH 2 (DEMAND SIDE): REVENUE GENERATED FROM VERTICALS
- FIGURE 8 MARKET SIZE ESTIMATION METHODOLOGY: APPROACH 2 (DEMAND SIDE)
- FIGURE 9 MAJOR SEGMENTS IN ITSM MARKET
- FIGURE 10 ITSM MARKET: REGIONAL SNAPSHOT
- FIGURE 11 FOCUS ON IMPROVING CUSTOMER EXPERIENCE AND SIMPLIFYING IT OPERATIONS WORKFLOW TO DRIVE MARKET
- FIGURE 12 SOLUTIONS SEGMENT TO ACCOUNT FOR LARGER MARKET SHARE BY 2028
- FIGURE 13 OPERATIONS & PERFORMANCE MANAGEMENT SEGMENT TO LEAD MARKET DURING FORECAST PERIOD
- FIGURE 14 CLOUD SEGMENT TO LEAD MARKET DURING FORECAST PERIOD
- FIGURE 15 LARGE ENTERPRISES SEGMENT TO ACCOUNT FOR LARGER MARKET SHARE DURING FORECAST PERIOD
- FIGURE 16 BFSI SEGMENT TO ACCOUNT FOR LARGEST MARKET SHARE BY 2028
- FIGURE 17 ASIA PACIFIC TO EMERGE AS LUCRATIVE MARKET FOR INVESTMENTS IN NEXT FIVE YEARS
- FIGURE 18 ITSM MARKET: DRIVERS, RESTRAINTS, OPPORTUNITIES, AND CHALLENGES
- FIGURE 19 ECOSYSTEM MAP
- FIGURE 20 VALUE CHAIN ANALYSIS
- FIGURE 21 NUMBER OF PATENTS PUBLISHED, 2012–2023
- FIGURE 22 TOP FIVE PATENT OWNERS (GLOBAL)
- FIGURE 23 ITSM MARKET: PORTER’S FIVE FORCES ANALYSIS
- FIGURE 24 MAJOR YCC TRENDS TO DRIVE FUTURE REVENUE PROSPECTS IN ITSM MARKET
- FIGURE 25 INFLUENCE OF STAKEHOLDERS ON BUYING PROCESS FOR TOP VERTICALS
- FIGURE 26 KEY BUYING CRITERIA FOR TOP VERTICALS
- FIGURE 27 SOLUTIONS SEGMENT TO ACCOUNT FOR LARGER MARKET IN 2023
- FIGURE 28 OPERATIONS & PERFORMANCE MANAGEMENT SEGMENT TO ACCOUNT FOR LARGEST MARKET IN 2023
- FIGURE 29 PROFESSIONAL SERVICES SEGMENT TO LEAD MARKET IN 2023
- FIGURE 30 LARGE ENTERPRISES SEGMENT TO ACCOUNT FOR LARGER MARKET IN 2023
- FIGURE 31 CLOUD SEGMENT TO ACCOUNT FOR LARGER MARKET IN 2023
- FIGURE 32 IT & ITES VERTICAL TO GROW AT HIGHEST CAGR DURING FORECAST PERIOD
- FIGURE 33 ASIA PACIFIC TO GROW AT HIGHEST CAGR DURING FORECAST PERIOD
- FIGURE 34 NORTH AMERICA: MARKET SNAPSHOT
- FIGURE 35 ASIA PACIFIC: MARKET SNAPSHOT
- FIGURE 36 HISTORICAL FIVE-YEAR REVENUE ANALYSIS OF LEADING PLAYERS, 2018–2022 (USD MILLION)
- FIGURE 37 TRADING COMPARABLES, 2023 (EV/EBITDA)
- FIGURE 38 SHARE OF LEADING COMPANIES IN ITSM MARKET, 2022
- FIGURE 39 COMPANY EVALUATION MATRIX FOR KEY PLAYERS: CRITERIA WEIGHTAGE
- FIGURE 40 ITSM MARKET: COMPANY EVALUATION MATRIX, 2022
- FIGURE 41 START-UP/SME EVALUATION MATRIX: CRITERIA WEIGHTAGE
- FIGURE 42 ITSM MARKET: START-UP/SME EVALUATION MATRIX, 2022
- FIGURE 43 SERVICENOW: COMPANY SNAPSHOT
- FIGURE 44 BROADCOM: COMPANY SNAPSHOT
- FIGURE 45 SOLARWINDS: COMPANY SNAPSHOT
- FIGURE 46 ATLASSIAN: COMPANY SNAPSHOT
- FIGURE 47 OPENTEXT: COMPANY SNAPSHOT
The study involved four major activities in estimating the current market size of the ITSM market. We performed extensive secondary research to collect information on the market, the competitive market, and the parent market. The next step was to validate these findings, assumptions, and sizing with industry experts across the value chain through primary research. Both top-down and bottom-up approaches were employed to estimate the complete market size. After that, we used the market breakup and data triangulation procedures to estimate the market size of the various segments in the ITSM market.
Secondary Research
This research study used extensive secondary sources, directories, and databases, such as D&B Hoovers, DiscoverOrg, Factiva, vendor data sheets, product demos, Cloud Computing Association (CCA), Vendor Surveys, Asia Cloud Computing Association, and The Software Alliance. We referred to sources for identifying and collecting valuable information for this technical, market-oriented, and commercial study of the IT service management market.
Primary Research
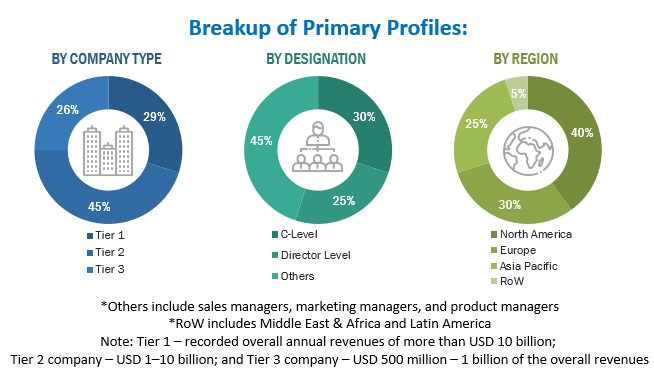
Primary sources were several industry experts from the core and related industries, preferred software providers, hardware manufacturers, distributors, service providers, technology developers, alliances, and organizations related to all segments of the industry's value chain. In-depth interviews were conducted with primary respondents, including key industry participants, subject-matter experts, C-level executives of key market players, and industry consultants, to obtain and verify critical qualitative and quantitative information and assess the market's prospects.
We conducted primary interviews to gather insights, such as market statistics, the latest trends disrupting the market, new use cases implemented, data on revenue collected from products and services, market breakups, market size estimations, market forecasts, and data triangulation. Primary research also helped understand various technology trends, segmentation types, industry trends, and regions. Demand-side stakeholders, such as Chief Executive Officers (CEOs), Chief Information Officers (CIOs), Chief Technology Officers (CTOs), Vice Presidents (VPs), and Chief Security Officers (CSOs); the installation teams of governments/end users using asset performance management; and digital initiatives project teams, were interviewed to understand the buyer's perspective on suppliers, products, service providers, and their current use of services, which would affect the overall ITSM market.
To know about the assumptions considered for the study, download the pdf brochure
IT Service Management (ITSM) Market Size Estimation
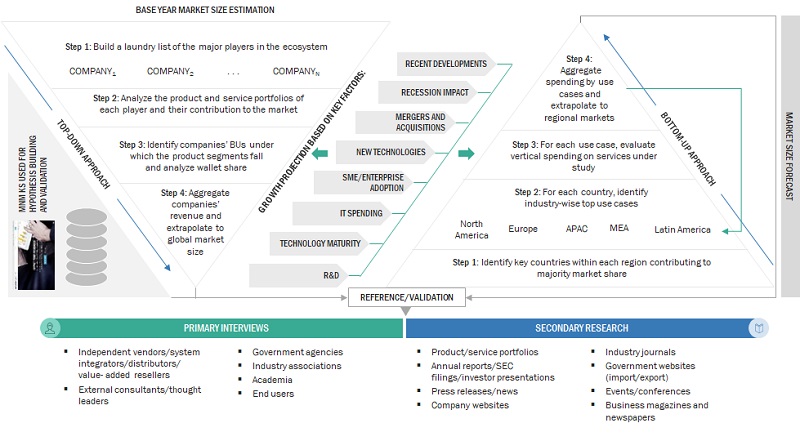
We used top-down and bottom-up approaches to estimate and forecast the ITSM market and other dependent submarkets. The bottom-up procedure helped arrive at the overall market size using the revenues and offerings of key companies in the market. With data triangulation methods and validation through primary interviews, this study determined and confirmed the exact value of the overall parent market size. We used the overall market size in the top-down procedure to estimate the size of other individual markets via percentage splits of the market segments.
The bottom-up approach identified the trend of ITSM adoption among industry verticals in critical countries that contribute the most to the market. The adoption trend of asset performance management and varying cases of use concerning their business segments were identified and extrapolated for cross-validation. We gave weightage to the use cases identified in different solution areas for the calculation. We prepared an exhaustive list of all vendors offering ITSM in the market. We estimated the revenue contribution of all vendors in the market through annual reports, press releases, funding, investor presentations, paid databases, and primary interviews. We evaluated each vendor based on its service offerings across verticals. We extrapolated the aggregate of all companies' revenue to reach the overall market size. Each subsegment was studied and analyzed for its market size and regional penetration. We determined the region split through primary and secondary sources based on these numbers.
The top-down approach prepared an exhaustive list of all vendors in the IT service management market. We estimated the revenue contribution of all vendors in the market through their annual reports, press releases, funding, investor presentations, paid databases, and primary interviews. We estimated the market size from revenues generated by vendors from different ITSM offerings. We identified other vendors and revenue generated from each service type with the help of secondary and primary sources and combined them to determine the market size. Further, the procedure included an analysis of the ITSM market's regional penetration. With the data triangulation procedure and data validation through primaries, the exact values of the overall ITSM market size and its segments' market size were determined and confirmed using the study. The primary procedure included extensive interviews for key insights from industry leaders, such as CEOs, CTOs, CIOs, VPs, directors, and marketing executives. We further triangulated market numbers with the existing MarketsandMarkets repository for validation.
ITSM Market: Top-Down and Bottom-Up approaches
To know about the assumptions considered for the study, Request for Free Sample Report
Data Triangulation
After arriving at the overall market size, the market was split into several segments and subsegments—using the market size estimation processes as explained above. Where applicable, data triangulation and market breakup procedures were employed to complete the overall market engineering process and determine each market segment's and subsegment's exact statistics. The data was triangulated by studying several factors and trends from the ITSM market's demand and supply sides.
IT Service Management (ITSM) Market Definition
Considering the views of various sources and associations on ITSM, MarketsandMarkets defines ITSM as "a comprehensive approach and set of practices designed to plan, design, deliver, operate efficiently, and control information technology services within an organization. ITSM focuses on aligning IT services with the needs of the business, emphasizing the delivery of value to customers and end-users. It involves implementing processes, workflows, and best practices to manage the entire service lifecycle, from service strategy and design to transition, operation, and continual improvement. ITSM frameworks, such as ITIL (Information Technology Infrastructure Library), guide organizations in establishing standardized and effective practices for service delivery, incident management, problem resolution, change management, and other critical aspects of IT operations. ITSM aims to ensure that IT services meet business objectives, deliver a positive user experience, and adapt to evolving technological and organizational requirements".
Key Stakeholders
- Cloud Service Providers (CSPs)
- ITSM vendors
- IT operations management vendors
- Technology service providers
- Networking companies
- Consultants/consultancies/advisory firms
- Support and maintenance service providers
- Telecom service providers
- Information Technology (IT) infrastructure providers
- System Integrators (SIs)
- Regional associations
- Independent software vendors
- Value-added resellers and distributors
Report Objectives
- To define, describe, and forecast the global ITSM market based on offering, deployment model, organization size, vertical, and region.
- To forecast the market size of the five major regional segments: North America, Europe, Asia Pacific, Middle East & Africa, and Latin America
- To strategically analyze the market subsegments for individual growth trends, prospects, and contributions to the total market
- To provide detailed information related to the major factors influencing the growth of the market (drivers, restraints, opportunities, and challenges)
- To strategically analyze macro and micro-markets for growth trends, prospects, and their contributions to the overall market
- To analyze industry trends, patents and innovations, and pricing data related to the ITSM market.
- To analyze the opportunities in the market for stakeholders and provide details of the competitive landscape for major players.
- To profile key players in the market and comprehensively analyze their market share/ranking and core competencies
- To track and analyze competitive developments, such as mergers & acquisitions, product developments, and partnerships & collaborations in the market.
Note 1. Micromarkets are defined as the further segments and subsegments of the market included in the report.
Note 2. The companies' Core competencies are captured in terms of their key developments and essential strategies to sustain their position in the market.
Available Customizations
With the given market data, MarketsandMarkets offers customizations per the company's specific needs. The following customization options are available for the report:
Product Analysis
- The product matrix provides a detailed comparison of the product portfolio of each company.
Geographic Analysis
- Further breakup of the Asia Pacific market into countries contributing 75% to the regional market size
- Further breakup of the North American market into countries contributing 75% to the regional market size
- Further breakup of the Latin American market into countries contributing 75% to the regional market size
- Further breakup of the Middle Eastern & African market into countries contributing 75% to the regional market size
- Further breakup of the European market into countries contributing 75% to the regional market size
Company Information
- Detailed analysis and profiling of additional market players (up to 5)
Growth opportunities and latent adjacency in IT Service Management (ITSM) Market