Instrument Transformers Market

Report Code EP 5867
Published in Feb, 2024, By MarketsandMarkets™
Download PDF

Choose License Type

Buy Report Now Inquire Before Buying

Instrument Transformers Market by Type (Current, Potential, Combined), Installation (Liquid, SF6 Gas, Solid), Enclosure (Indoor, Outdoor), Voltage, Application, End-User, & Region (North America, Europe, APAC, Latin America, MEA) - Global Forecast to 2030

Overview

The market for instrument transformers is anticipated to witness substantial growth, projected to increase from an estimated USD 7.1 billion in 2023 to reach USD 10.6 billion by 2030. The growing demand for precise electrical measurements is a major driving force behind the global expansion of instrument transformers. These transformers are critical for accurately measuring and monitoring electrical properties in power systems. The instrument transformers market is expanding rapidly due to rising customer demand. This expansion is driven by the need for dependable and efficient transformers in a variety of applications. Another key reason driving the instrument transformers market ahead is an increase in peak end-user energy consumption. Meeting the rising power demand requires the deployment of dependable and efficient transformers. The market for instrument transformers is estimated at USD 7.1 billion in 2023, with a projected growth to USD 10.6 billion by 2030, exhibiting a Compound Annual Growth Rate (CAGR) of 5.8%. The rise of companies in the region adds to an increase in energy consumption, necessitating the use of modern instrument transformers for efficient power usage. Rapid urbanization and infrastructure developments increase energy demand, boosting the need for instrument transformers in the Asia Pacific market. Government measures to update power networks in the Asia Pacific area are driving demand for instrument transformers, which ensure efficient and dependable energy distribution.

Attractive Opportunities in the Instrument Transformers Market

ASIA PACIFIC

Market growth in the APAC can be attributed to it’s emphasizes upgrading its aging instrument transformers, modernizing their aging power infrastructure to improve efficiency and reliability

The rising demand in electricity and grid modernization are the prime factors driving the market growth.

The strategy of contracts & agreements offers lucrative opportunities for market players in the next 5 years.

APAC is the largest market for instrument transformers due to the growing focus on energy efficiency & and the replacement of aging infrastructure in the region.

Environmental concerns and Rapid economic development and population growth are expected to pose a challenge to the growth of this market.

Global Instrument Transformers Market Dynamics

DRIVER: Modernization of power distribution infrastructure

Global power consumption is expected to rise dramatically by 2030, with an increase of 5,900 terawatt-hours (TWh) in the Stated Policies Scenario (STEPS) and more than 7,000 TWh in the Announced Pledges Scenario (APS). This spike is similar to combining the current demand levels of the United States with the European Union. In developed nations, the rising popularity of electric vehicles is the key source of increased energy consumption, contributing to a significant increase from around 8% market share in 2021 to 32% in the STEPS and over 50% in the APS by 2030.

RESTRAINTS: High Initial Costs of Instrument Transformers

The "High Initial Costs" feature of the instrument transformers market refers to the significant upfront expenditure necessary for the acquisition and installation of instrument transformers. Advanced technologies, such as digital instrument transformers and those with smart grid functionality, are frequently more expensive than their older equivalents. The inclusion of new features and advancements might push up the total price of instrument transformers. Instrument transformer materials, such as specific alloys and insulating materials, can be rather costly. Transformers require high-quality materials to ensure their longevity, efficiency, and dependability.


OPPORTUNITIES: Digitalization and smart sensors

Digitalization and smart sensors are altering the instrument transformer industry, providing considerable benefits in terms of accuracy, efficiency, and data-driven insights. Traditional instrument transformers use analog signals, which limits their accuracy and data accessibility. Digitalization entails replacing analog components with digital technology such as microprocessors and communication interfaces, resulting in improved accuracy, real-time data collection, and expanded functionality. Digital processing lowers mistakes and enhances measurement precision, leading to more accurate data. Digital transformers generate continuous data streams, enabling for real-time monitoring and study of grid operation.

CHALLENGES: Environmental Concerns

Traditional instrument transformers, particularly ones with oil-based insulation, might cause environmental problems owing to the materials employed and the potential for environmental damage. Many traditional instrument transformers employ oil as an insulating medium to improve dielectric strength and cooling. The usage of oil, particularly mineral oil, causes environmental issues owing to the possibility of spills and pollution. Unintentional leaks or spills can impact ecosystems and soil quality. Certain metals and insulating materials used in instrument transformers may be considered toxic or represent an environmental danger. The production and disposal of these components must be carefully regulated to reduce their environmental effect.

Global Instrument Transformers Market Ecosystem Analysis

The instrument transformers market is marked by the participation of key companies that are firmly established, financially robust, and possess substantial expertise in the production of instrument transformers. These companies hold a significant market presence and provide a wide array of product offerings. They harness advanced technologies and maintain extensive global sales and marketing networks. Among the notable players in this market are ABB (Switzerland), General Electric (US), Siemens (Germany), Mitsubishi Electric (Japan), and Schneider Electric (France).


Ultra High voltage segment, by voltage, to grow at highest CAGR from 2023 to 2030.

As worldwide energy consumption rises, particularly in rising countries and highly populated cities, there is an increasing demand for efficient and dependable power transmission. Ultra-high voltage transmission allows for the efficient transfer of enormous amounts of power over long distances while minimizing energy losses. The necessity for grid expansion to satisfy rising power demand is a major driving force behind the rise of UHV systems. The integration of renewable energy sources, such as wind and solar, frequently necessitates the transfer of power from remote sites with plentiful renewable resources to urban areas. Ultra-high voltage transmission lines can effectively transfer enormous amounts of electricity across long distances, allowing the integration of renewable energy into the grid.

Transformer and circuit breaker bushing, by application, to emerge as largest segment of instrument transformer market.

Demand for current transformers market is driven by investments in transmission and distribution (T&D) infrastructure projects, which include both extending existing networks and constructing new ones. Transformers and circuit breaker bushings are crucial parts of T&D systems. Energy-efficient transformers and circuit breaker bushings are in high demand due to their ability to decrease transmission losses and increase overall energy efficiency. As energy conservation becomes a top issue, utilities are investing in contemporary, high-performance components.Indoor segment, by enclosure type, to grow at the fastest CAGR from 2023 to 2030.The move towards urban life, along with limited outside space in densely populated places, pushes the choice for indoor instrument transformers, which require less physical space to install. Growing worries about environmental effects and safety laws are driving the development of indoor transformers, which reduce the possibility of oil leaks and are more compatible with severe standards. Indoor transformers are recognized for their increased dependability and lower maintenance requirements, making them a popular choice among utilities looking for cost-effective and efficient solutions.

ASIA PACIFIC Region Holds the Largest Share of the Instrument Transformers Market.

During the forecast period, the Asia Pacific region is anticipated to experience the highest Compound Annual Growth Rate (CAGR). The region encompasses key economies like China, India, Japan, Australia, and the rest of Asia Pacific, including South Korea. Rapid development, particularly in major economies, propels growth in various sectors, including power transmission, distribution, industries, commercial and residential applications, and transportation.

Recent Developments of Instrument Transformers Market industry

  • In November 2022, The General Electric has introduced the Superbute combination. It enables faster installation of primary metering assemblies than typical standalone CTs and VTs while maintaining a high degree of quality and dependability. GE's Superbute Combo CT/VT design includes RevenueSense CT technology, which results in 0.15% accuracy from 1% of rated current to the rating factor. In May 2020, The Metsä Fibre, a renowned subsidiary of Metsä www Group, and ABB Finland had announced a deal under which the firm ABB Finland would offer the electricity and drive technology solutions for Metsä Fibre's projected bioproduct mill in Kemi, Finland.
  • In February 2020, Arteche had launched a Power Voltage Transformer, As long as the plant is linked to a high-voltage line, it will provide a consistent supply even while not in operation. There is no maintenance, eliminating the logistical complexity of an activity that requires transportation to the facility. Simple to implement and put in action.

Key Market Players

KEY PLAYERS IN THE Instrument Transformers Market INCLUDE

Want to explore hidden markets that can drive new revenue in Instrument Transformers Market?

Scope of the Report

Report Attribute Details
Market Size available for years 2019–2030
Base year considered 2022
Forecast period 2023–2030
Forecast units Value (USD Billion)
Segments Covered By Type, By Installation, By Voltage, By Enclosure, By End-User, and  By Application
Geographies covered Asia Pacific, North America, Europe, Middle East and Africa, and South America 
Companies covered ABB (Switzerland), General Electric (US), Mitsubishi Electric (Japan),  Siemens Energy (Germany), Schneider Electric (France), Arteche (Spain), Bharat Heavy Electricals Limited (BHEL) (India), CG Power (India), Nissin Electric Co., Ltd. (Japan), EMEK (Turkey), Indian Transformers and Electricals Pvt. Ltd (India), Mehru (India), Koncar-Instrument Transformers Inc. (Croatia), Pfiffner Group (Switzerland), RITZ Instrument Transformers GmbH (Germany), CHINT Group (China), WEG (Brazil), Amran, Inc (USA), Straton Electricals Private Limited (India), and Dalian Huayi Electric Power Electric Appliances Co., Ltd. (China).

Key Questions Addressed by the Report

What is the current size of the global instrument transformers market?
The global instrument transformers market is estimated to be USD 10.6 billion in 2030.
Who are the major players operating in the Instrument Transformers Market?
Major players in the Instrument Transformers Market include ABB (Switzerland), Siemens (Germany), Schneider Electric (France), and GE (US).
What are the challenges affecting the growth of the instrument transformer market?
Growing competition from unorganized transformer producers poses a significant challenge to the instrument transformer market's trajectory. Unorganized producers often do not adhere to defined industry standards, quality control procedures, or regulatory compliance, resulting in a wide range of goods of different quality. This variety puts uncertainties and hazards into the market, since consumers may have difficulty analyzing the dependability and performance of transformers from unorganized producers.
Which is the second fastest-growing region during the forecast period in the Instrument transformers market?
During the forecast period, North America is expected to be the second fastest-growing region in the instrument transformers market. The CAGR for North America is 5.5%. This is due to the rapid urbanization and surge seen in the demand for electricity that is fostering the growth of the region.
What advantages do modern instrument transformers offer over traditional counterparts?
Modern instrument transformers constitute a significant advancement in the field of power systems, providing several advantages over their conventional counterparts. Enhanced accuracy is a significant characteristic, with newer equipment utilizing sophisticated technology to deliver more exact voltage and current readings. This increased precision is critical for preserving the integrity and stability of power systems, as it ensures that monitoring and control mechanisms respond properly to the dynamic needs of energy grids.


Personalize This Research

  • Triangulate with your Own Data
  • Get Data as per your Format and Definition
  • Gain a Deeper Dive on a Specific Application, Geography, Customer or Competitor
  • Any level of Personalization
Request A Free Customisation

Let Us Help You

  • What are the Known and Unknown Adjacencies Impacting the Instrument Transformers Market
  • What will your New Revenue Sources be?
  • Who will be your Top Customer; what will make them switch?
  • Defend your Market Share or Win Competitors
  • Get a Scorecard for Target Partners
Customized Workshop Request

Table of Contents

Exclusive indicates content/data unique to MarketsandMarkets and not available with any competitors.

TITLE
PAGE NO
INTRODUCTION
30
RESEARCH METHODOLOGY
37
EXECUTIVE SUMMARY
50
PREMIUM INSIGHTS
56
MARKET OVERVIEW
62
  • 5.1 INTRODUCTION
  • 5.2 MARKET DYNAMICS
    DRIVERS
    - Rising demand for electricity
    - Strategic focus on grid modernization
    - High emphasis on integrating renewable energy sources into power grids
    RESTRAINTS
    - Substantial upfront cost associated with instrument transformers
    - Fluctuating raw material prices
    OPPORTUNITIES
    - Growing use of digital technologies and smart sensors in instrument transformers
    - Rapid economic development and population growth in emerging markets
    CHALLENGES
    - Lack of standardized cybersecurity protocols
    - Environmental concerns associated with manufacturing, use, and disposal of instrument transformers
  • 5.3 TRENDS/DISRUPTIONS IMPACTING CUSTOMERS’ BUSINESSES
    TRENDS INFLUENCING CUSTOMER BUSINESS
  • 5.4 VALUE CHAIN ANALYSIS
    RAW MATERIAL SUPPLIERS
    COMPONENT MANUFACTURERS
    INSTRUMENT TRANSFORMER MANUFACTURERS
    DISTRIBUTORS
    END USERS
    POST-SALES SERVICE PROVIDERS
  • 5.5 ECOSYSTEM ANALYSIS
  • 5.6 TECHNOLOGY TRENDS
    ADOPTION OF DIGITAL AND SMART GRID TECHNOLOGIES
    USE OF ADVANCED MATERIALS AND 3D PRINTING TECHNOLOGY
  • 5.7 PATENT ANALYSIS
  • 5.8 TRADE ANALYSIS
    IMPORT SCENARIO
    EXPORT SCENARIO
  • 5.9 KEY CONFERENCES AND EVENTS, 2024–2025
  • 5.10 TARIFF AND REGULATORY LANDSCAPE
    TARIFF ANALYSIS
    REGULATORY BODIES, GOVERNMENT AGENCIES, AND OTHER ORGANIZATIONS
    REGULATORY FRAMEWORK
  • 5.11 PRICING ANALYSIS
    AVERAGE SELLING PRICE TREND, BY REGION
    INDICATIVE PRICING ANALYSIS, BY VOLTAGE
  • 5.12 PORTER’S FIVE FORCES ANALYSIS
    THREAT OF NEW ENTRANTS
    BARGAINING POWER OF SUPPLIERS
    BARGAINING POWER OF BUYERS
    THREAT OF SUBSTITUTES
    INTENSITY OF COMPETITIVE RIVALRY
  • 5.13 KEY STAKEHOLDERS AND BUYING CRITERIA
    KEY STAKEHOLDERS IN BUYING PROCESS
    BUYING CRITERIA
INSTRUMENT TRANSFORMER MARKET, BY TYPE
96
  • 6.1 INTRODUCTION
  • 6.2 CURRENT
    ABILITY TO MEASURE CURRENTS WITH HIGH ACCURACY TO BOOST DEMAND
  • 6.3 POTENTIAL
    UTILIZATION IN METERING, PROTECTION, AND CONTROL OF POWER SYSTEMS TO FUEL SEGMENTAL GROWTH
    INDUCTIVE
    CAPACITIVE
  • 6.4 COMBINED
    REDUCED TOTAL COST, LOWER MATERIAL COSTS, AND LESS SPACE REQUIREMENT TO ACCELERATE DEMAND
INSTRUMENT TRANSFORMER MARKET, BY ENCLOSURE TYPE
103
  • 7.1 INTRODUCTION
  • 7.2 INDOOR
    PROTECTION AGAINST ACCIDENTAL CONTACT WITH HAZARDOUS INTERNAL COMPONENTS, DRIPPING WATER, AND FIBERS TO BOOST DEMAND
  • 7.3 OUTDOOR
    NEED TO PROTECT TRANSFORMERS FROM HARSH ENVIRONMENTAL CONDITIONS AND POSSIBLE CONTAMINATION TO FUEL DEMAND
INSTRUMENT TRANSFORMER MARKET, BY DIELECTRIC MEDIUM
107
  • 8.1 INTRODUCTION
  • 8.2 LIQUID
    HIGH-VOLTAGE APPLICATIONS TO DRIVE MARKET
  • 8.3 SF6 GAS
    LESS SPACE REQUIREMENTS TO BOOST DEMAND
  • 8.4 SOLID
    HIGH MECHANICAL STRENGTH, RESISTANCE TO AGING AND CHEMICAL DEGRADATION, AND LOW MOISTURE ABSORPTION FEATURES TO BOOST DEMAND
INSTRUMENT TRANSFORMER MARKET, BY VOLTAGE
113
  • 9.1 INTRODUCTION
  • 9.2 DISTRIBUTION
    NEED FOR ACCURATE MEASUREMENT AND MONITORING OF ELECTRICAL PARAMETERS TO FUEL DEMAND
  • 9.3 SUB-TRANSMISSION
    INCREASING USE IN SUBSTATIONS AND SWITCHYARDS OF CAPTIVE POWER PLANTS TO FOSTER SEGMENTAL GROWTH
  • 9.4 HV TRANSMISSION
    NEED TO TRANSMIT POWER OVER LONG DISTANCES TO BOOST INSTRUMENT TRANSFORMER DEMAND
  • 9.5 EHV TRANSMISSION
    IMPLEMENTATION OF CAPACITIVE POTENTIAL TRANSFORMERS IN EHV TRANSMISSION SYSTEMS TO ACCELERATE MARKET GROWTH
  • 9.6 UHV TRANSMISSION
    RISING USE OF CAPACITIVE POTENTIAL TRANSFORMERS IN UHV TRANSMISSION GRIDS TO DRIVE MARKET
INSTRUMENT TRANSFORMER MARKET, BY APPLICATION
121
  • 10.1 INTRODUCTION
  • 10.2 TRANSFORMER & CIRCUIT BREAKER BUSHING
    IMPROVED PERFORMANCE, RELIABILITY, AND DURABILITY BENEFITS TO DRIVE MARKET
  • 10.3 SWITCHGEAR ASSEMBLIES
    INCREASING NEED FOR ACCURATE MONITORING, CONTROL, AND PROTECTION OF ELECTRICAL POWER SYSTEMS TO BOOST DEMAND
  • 10.4 RELAYING
    RISING FOCUS OF HEAVY INDUSTRIES ON PROTECTING CRITICAL ELECTRICAL EQUIPMENT TO PROPEL MARKET
  • 10.5 METERING & PROTECTION
    SURGING DEMAND FOR PRECISE MEASUREMENT AND MONITORING OF ELECTRICAL PARAMETERS IN POWER SYSTEMS TO DRIVE MARKET
  • 10.6 PRIMARY METERING UNITS
    PRESSING NEED FOR ACCURATE MEASUREMENT OF HIGH INCOMING VOLTAGE TO BOOST DEMAND
INSTRUMENT TRANSFORMER MARKET, BY END USER
129
  • 11.1 INTRODUCTION
  • 11.2 POWER UTILITIES
    INCREASING FOCUS OF POWER UTILITIES ON EFFICIENT ENERGY MANAGEMENT TO BOOST DEMAND
  • 11.3 TRANSMISSION UTILITIES
    NEED TO TRANSMIT ELECTRICITY OVER LONG DISTANCES WITH MINIMAL POWER LOSSES TO BOOST DEMAND
  • 11.4 DISTRIBUTION UTILITIES
    RISING USE OF INSTRUMENT TRANSFORMERS TO ENSURE ACCURATE MEASUREMENT AND MONITORING OF ELECTRICAL PARAMETERS IN HIGH-VOLTAGE SYSTEMS TO DRIVE MARKET
  • 11.5 POWER GENERATION PLANTS
    INCREASING EMPHASIS ON REFURBISHING AGING POWER INFRASTRUCTURE TO FUEL MARKET GROWTH
  • 11.6 RAILWAYS & METROS
    GROWING INVESTMENTS IN RAIL INFRASTRUCTURE EXPANSION TO BOOST DEMAND
  • 11.7 INDUSTRIES & OEMS
    NEED TO PREVENT DAMAGE TO EXPENSIVE MACHINERY IN MANUFACTURING PLANTS TO ACCELERATE DEMAND
    OIL & GAS
    CEMENT
    CHEMICALS
    AUTOMOTIVE
    INDUSTRIAL MACHINERY
INSTRUMENT TRANSFORMER MARKET, BY REGION
140
  • 12.1 INTRODUCTION
  • 12.2 ASIA PACIFIC
    RECESSION IMPACT ON MARKET IN ASIA PACIFIC
    BY TYPE
    BY DIELECTRIC MEDIUM
    BY VOLTAGE
    BY ENCLOSURE TYPE
    BY APPLICATION
    BY END USER
    BY COUNTRY
    - China
    - India
    - Japan
    - South Korea
    - Australia
    - Rest of Asia Pacific
  • 12.3 EUROPE
    RECESSION IMPACT ON MARKET IN EUROPE
    BY TYPE
    BY DIELECTRIC MEDIUM
    BY VOLTAGE
    BY ENCLOSURE TYPE
    BY APPLICATION
    BY END USER
    BY COUNTRY
    - Germany
    - UK
    - France
    - Spain
    - Sweden
    - Norway
    - Russia
    - Rest of Europe
  • 12.4 NORTH AMERICA
    BY TYPE
    BY DIELECTRIC MEDIUM
    BY VOLTAGE
    BY ENCLOSURE TYPE
    BY APPLICATION
    BY END USER
    BY COUNTRY
    - US
    - Canada
    - Mexico
  • 12.5 MIDDLE EAST & AFRICA
    RECESSION IMPACT ON MARKET IN MIDDLE EAST & AFRICA
    BY TYPE
    BY DIELECTRIC MEDIUM
    BY VOLTAGE
    BY ENCLOSURE TYPE
    BY APPLICATION
    BY END USER
    BY COUNTRY
    - GCC countries
    - South Africa
    - Rest of Middle East & Africa
  • 12.6 SOUTH AMERICA
    GROWING FOCUS ON OIL AND GAS EXPLORATION AND PRODUCTION ACTIVITIES TO FOSTER MARKET GROWTH
    RECESSION IMPACT ON MARKET IN SOUTH AMERICA
    BY TYPE
    BY DIELECTRIC MEDIUM
    BY VOLTAGE
    BY ENCLOSURE TYPE
    BY APPLICATION
    BY END USER
    BY COUNTRY
    - Brazil
    - Argentina
    - Chile
    - Rest of South America
COMPETITIVE LANDSCAPE
221
  • 13.1 INTRODUCTION
  • 13.2 STRATEGIES ADOPTED BY KEY PLAYERS, 2019–2022
  • 13.3 MARKET SHARE ANALYSIS, 2022
  • 13.4 REVENUE ANALYSIS OF TOP PLAYERS, 2018–2022
  • 13.5 COMPANY EVALUATION MATRIX, 2022
    STARS
    PERVASIVE PLAYERS
    EMERGING LEADERS
    PARTICIPANTS
    COMPANY FOOTPRINT (KEY PLAYERS)
  • 13.6 START-UP/SME EVALUATION MATRIX, 2022
    PROGRESSIVE COMPANIES
    RESPONSIVE COMPANIES
    DYNAMIC COMPANIES
    STARTING BLOCKS
    COMPETITIVE BENCHMARKING
  • 13.7 COMPETITIVE SCENARIOS
    PRODUCT LAUNCHES
    DEALS
    OTHERS
COMPANY PROFILES
243
  • 14.1 KEY PLAYERS
    ABB
    - Business overview
    - Products offered
    - Recent developments
    - MnM view
    GENERAL ELECTRIC
    - Business overview
    - Products offered
    - Recent developments
    - MnM view
    MITSUBISHI ELECTRIC
    - Business overview
    - Products offered
    - Recent developments
    - MnM view
    SCHNEIDER ELECTRIC
    - Business overview
    - Products offered
    - MnM view
    SIEMENS ENERGY
    - Business overview
    - Products offered
    - Recent developments
    - MnM view
    ARTECHE
    - Business overview
    - Products offered
    - Recent developments
    - MnM view
    BHARAT HEAVY ELECTRICALS LIMITED (BHEL)
    - Business overview
    - Products offered
    CG POWER AND INDUSTRIAL SOLUTIONS
    - Business overview
    - Products offered
    - Recent developments
    NISSIN ELECTRIC CO., LTD.
    - Business overview
    - Products offered
    EMEK ELEKTRIK ENDÜSTRISI A.S
    - Business overview
    - Products offered
    INDIAN TRANSFORMERS AND ELECTRICALS PVT. LTD
    - Business overview
    - Products offered
    MEHRU
    - Business overview
    - Products offered
    KONCAR - INSTRUMENT TRANSFORMERS INC.
    - Business overview
    - Products offered
    PFIFFNER GROUP
    - Business overview
    - Products offered
    - Recent developments
    RITZ INSTRUMENT TRANSFORMERS GMBH
    - Business overview
    - Products offered
  • 14.2 OTHER PLAYERS
    CHINT GROUP
    WEG
    AMRAN, INC.
    STRATON ELECTRICALS PVT. LTD.
    DALIAN HUAYI ELECTRIC POWER ELECTRIC APPLIANCES CO., LTD.
    ENPAY ENDÜSTRIYEL PAZARLAMA VE YATIRIM A.S. (ENPAY)
    DALIAN NORTH INSTRUMENT TRANSFORMER GROUP CO., LTD.
    SIEYUAN ELECTRIC CO., LTD.
    AUTOMATIC ELECTRIC LTD.
    VAMET INDUSTRIES
APPENDIX
297
  • 15.1 INSIGHTS FROM INDUSTRY EXPERTS
  • 15.2 DISCUSSION GUIDE
  • 15.3 KNOWLEDGESTORE: MARKETSANDMARKETS’ SUBSCRIPTION PORTAL
  • 15.4 CUSTOMIZATION OPTIONS
  • 15.5 RELATED REPORTS
  • 15.6 AUTHOR DETAILS
LIST OF TABLES
 
  • TABLE 1 LIST OF MAJOR SECONDARY SOURCES
  • TABLE 2 LIST OF PRIMARY INTERVIEW PARTICIPANTS
  • TABLE 3 INSTRUMENT TRANSFORMER MARKET SNAPSHOT, 2023 VS. 2030
  • TABLE 4 COMPARISON OF CURRENT AND POTENTIAL TRANSFORMERS
  • TABLE 5 GLOBAL ELECTRICITY DEMAND AND SUPPLY, BY SCENARIO (TWH)
  • TABLE 6 ROLE OF KEY COMPANIES IN ECOSYSTEM
  • TABLE 7 MARKET: INNOVATIONS AND PATENT REGISTRATIONS, MARCH 2021–DECEMBER 2023
  • TABLE 8 IMPORT SCENARIO FOR HS CODE 8504-COMPLIANT PRODUCTS, BY COUNTRY, 2020–2022 (USD THOUSAND )
  • TABLE 9 EXPORT SCENARIO FOR HS CODE 8504-COMPLIANT PRODUCTS, BY COUNTRY, 2020–2022 (USD THOUSAND)
  • TABLE 10 MARKET: LIST OF KEY CONFERENCES AND EVENTS
  • TABLE 11 COUNTRY-WISE IMPORT TARIFF FOR HS CODE 8504-COMPLIANT PRODUCTS, 2022
  • TABLE 12 NORTH AMERICA: LIST OF REGULATORY BODIES, GOVERNMENT AGENCIES, AND OTHER ORGANIZATIONS
  • TABLE 13 EUROPE: LIST OF REGULATORY BODIES, GOVERNMENT AGENCIES, AND OTHER ORGANIZATIONS
  • TABLE 14 ASIA PACIFIC: LIST OF REGULATORY BODIES, GOVERNMENT AGENCIES, AND OTHER ORGANIZATIONS
  • TABLE 15 ROW: LIST OF REGULATORY BODIES, GOVERNMENT AGENCIES, AND OTHER ORGANIZATIONS
  • TABLE 16 MARKET: CODES AND REGULATIONS
  • TABLE 17 MARKET: PORTER’S FIVE FORCES ANALYSIS
  • TABLE 18 INFLUENCE OF KEY STAKEHOLDERS ON BUYING PROCESS FOR END USERS
  • TABLE 19 KEY BUYING CRITERIA FOR END USERS
  • TABLE 20 MARKET, BY TYPE, 2019–2022 (USD MILLION)
  • TABLE 21 MARKET, BY TYPE, 2023–2030 (USD MILLION)
  • TABLE 22 CURRENT: MARKET, BY REGION, 2019–2022 (USD MILLION)
  • TABLE 23 CURRENT: MARKET, BY REGION, 2023–2030 (USD MILLION)
  • TABLE 24 POTENTIAL: MARKET, BY REGION, 2019–2022 (USD MILLION)
  • TABLE 25 POTENTIAL: MARKET, BY REGION, 2023–2030 (USD MILLION)
  • TABLE 26 COMBINED: MARKET, BY REGION, 2019–2022 (USD MILLION)
  • TABLE 27 COMBINED: MARKET, BY REGION, 2023–2030 (USD MILLION)
  • TABLE 28 MARKET, BY ENCLOSURE TYPE, 2019–2022 (USD MILLION)
  • TABLE 29 MARKET, BY ENCLOSURE TYPE, 2023–2030 (USD MILLION)
  • TABLE 30 INDOOR: MARKET, BY REGION, 2019–2022 (USD MILLION)
  • TABLE 31 INDOOR: MARKET, BY REGION, 2023–2030 (USD MILLION)
  • TABLE 32 OUTDOOR: MARKET, BY REGION, 2019–2022 (USD MILLION)
  • TABLE 33 OUTDOOR: MARKET, BY REGION, 2023–2030 (USD MILLION)
  • TABLE 34 MARKET, BY DIELECTRIC MEDIUM, 2019–2022 (USD MILLION)
  • TABLE 35 MARKET, BY DIELECTRIC MEDIUM, 2023–2030 (USD MILLION)
  • TABLE 36 LIQUID: MARKET, BY REGION, 2019–2022 (USD MILLION)
  • TABLE 37 LIQUID: MARKET, BY REGION, 2023–2030 (USD MILLION)
  • TABLE 38 SF6 GAS: MARKET, BY REGION, 2019–2022 (USD MILLION)
  • TABLE 39 SF6 GAS: MARKET, BY REGION, 2023–2030 (USD MILLION)
  • TABLE 40 SOLID: MARKET, BY REGION, 2019–2022 (USD MILLION)
  • TABLE 41 SOLID: MARKET, BY REGION, 2023–2030 (USD MILLION)
  • TABLE 42 MARKET, BY VOLTAGE, 2019–2022 (USD MILLION)
  • TABLE 43 MARKET, BY VOLTAGE, 2023–2030 (USD MILLION)
  • TABLE 44 DISTRIBUTION: MARKET, BY REGION, 2019–2022 (USD MILLION)
  • TABLE 45 DISTRIBUTION: MARKET, BY REGION, 2023–2030 (USD MILLION)
  • TABLE 46 SUB-TRANSMISSION: MARKET, BY REGION, 2019–2022 (USD MILLION)
  • TABLE 47 SUB-TRANSMISSION: MARKET, BY REGION, 2023–2030 (USD MILLION)
  • TABLE 48 HV TRANSMISSION: MARKET, BY REGION, 2019–2022 (USD MILLION)
  • TABLE 49 HV TRANSMISSION: MARKET, BY REGION, 2023–2030 (USD MILLION)
  • TABLE 50 EHV TRANSMISSION: MARKET, BY REGION, 2019–2022 (USD MILLION)
  • TABLE 51 EHV TRANSMISSION: MARKET, BY REGION, 2023–2030 (USD MILLION)
  • TABLE 52 UHV TRANSMISSION: MARKET, BY REGION, 2019–2022 (USD MILLION)
  • TABLE 53 UHV TRANSMISSION: MARKET, BY REGION, 2023–2030 (USD MILLION)
  • TABLE 54 MARKET, BY APPLICATION, 2019–2022 (USD MILLION)
  • TABLE 55 MARKET, BY APPLICATION, 2023–2030 (USD MILLION)
  • TABLE 56 TRANSFORMER & CIRCUIT BREAKER BUSHING: MARKET, BY REGION, 2019–2022 (USD MILLION)
  • TABLE 57 TRANSFORMER & CIRCUIT BREAKER BUSHING: MARKET, BY REGION, 2023–2030 (USD MILLION)
  • TABLE 58 SWITCHGEAR ASSEMBLIES: MARKET, BY REGION, 2019–2022 (USD MILLION)
  • TABLE 59 SWITCHGEAR ASSEMBLIES: MARKET, BY REGION, 2023–2030 (USD MILLION)
  • TABLE 60 RELAYING: MARKET, BY REGION, 2019–2022 (USD MILLION)
  • TABLE 61 RELAYING: MARKET, BY REGION, 2023–2030 (USD MILLION)
  • TABLE 62 METERING & PROTECTION: MARKET, BY REGION, 2019–2022 (USD MILLION)
  • TABLE 63 METERING & PROTECTION: MARKET, BY REGION, 2023–2030 (USD MILLION)
  • TABLE 64 PRIMARY METERING UNITS: MARKET, BY REGION, 2019–2022 (USD MILLION)
  • TABLE 65 PRIMARY METERING UNITS: MARKET, BY REGION, 2023–2030 (USD MILLION)
  • TABLE 66 MARKET, BY END USER, 2019–2022 (USD MILLION)
  • TABLE 67 MARKET, BY END USER, 2023–2030 (USD MILLION)
  • TABLE 68 POWER UTILITIES: MARKET, BY REGION, 2019–2022 (USD MILLION)
  • TABLE 69 POWER UTILITIES: MARKET, BY REGION, 2023–2030 (USD MILLION)
  • TABLE 70 POWER UTILITIES: MARKET, BY UTILITY TYPE, 2019–2022 (USD MILLION)
  • TABLE 71 POWER UTILITIES: MARKET, BY UTILITY TYPE, 2023–2030 (USD MILLION)
  • TABLE 72 POWER GENERATION PLANTS: MARKET, BY REGION, 2019–2022 (USD MILLION)
  • TABLE 73 POWER GENERATION PLANTS: MARKET, BY REGION, 2023–2030 (USD MILLION)
  • TABLE 74 RAILWAYS & METROS: MARKET, BY REGION, 2019–2022 (USD MILLION)
  • TABLE 75 RAILWAYS & METROS: MARKET, BY REGION, 2023–2030 (USD MILLION)
  • TABLE 76 INDUSTRIES & OEMS: MARKET, BY INDUSTRY, 2019–2022 (USD MILLION)
  • TABLE 77 INDUSTRIES & OEMS: MARKET, BY INDUSTRY, 2023–2030 (USD MILLION)
  • TABLE 78 INDUSTRIES & OEMS: MARKET, BY REGION, 2019–2022 (USD MILLION)
  • TABLE 79 INDUSTRIES & OEMS: MARKET, BY REGION, 2023–2030 (USD MILLION)
  • TABLE 80 MARKET, BY REGION, 2019–2022 (USD MILLION)
  • TABLE 81 MARKET, BY REGION, 2023–2030 (USD MILLION)
  • TABLE 82 MARKET, BY REGION, 2019–2022 (THOUSAND UNITS)
  • TABLE 83 MARKET, BY REGION, 2023–2030 (THOUSAND UNITS)
  • TABLE 84 ASIA PACIFIC: MARKET, BY TYPE, 2019–2022 (USD MILLION)
  • TABLE 85 ASIA PACIFIC: MARKET, BY TYPE, 2023–2030 (USD MILLION)
  • TABLE 86 ASIA PACIFIC: MARKET, BY DIELECTRIC MEDIUM, 2019–2022 (USD MILLION)
  • TABLE 87 ASIA PACIFIC: MARKET, BY DIELECTRIC MEDIUM, 2023–2030 (USD MILLION)
  • TABLE 88 ASIA PACIFIC: MARKET, BY VOLTAGE, 2019–2022 (USD MILLION)
  • TABLE 89 ASIA PACIFIC: MARKET, BY VOLTAGE, 2023–2030 (USD MILLION)
  • TABLE 90 ASIA PACIFIC: MARKET, BY ENCLOSURE TYPE, 2019–2022 (USD MILLION)
  • TABLE 91 ASIA PACIFIC: MARKET, BY ENCLOSURE TYPE, 2023–2030 (USD MILLION)
  • TABLE 92 ASIA PACIFIC: MARKET, BY APPLICATION, 2019–2022 (USD MILLION)
  • TABLE 93 ASIA PACIFIC: MARKET, BY APPLICATION, 2023–2030 (USD MILLION)
  • TABLE 94 ASIA PACIFIC: MARKET, BY END USER, 2019–2022 (USD MILLION)
  • TABLE 95 ASIA PACIFIC: MARKET, BY END USER, 2023–2030 (USD MILLION)
  • TABLE 96 ASIA PACIFIC: MARKET, BY COUNTRY, 2019–2022 (USD MILLION)
  • TABLE 97 ASIA PACIFIC: MARKET, BY COUNTRY, 2023–2030 (USD MILLION)
  • TABLE 98 CHINA: MARKET, BY TYPE, 2019–2022 (USD MILLION)
  • TABLE 99 CHINA: MARKET, BY TYPE, 2023–2030 (USD MILLION)
  • TABLE 100 CHINA: MARKET, BY APPLICATION, 2019–2022 (USD MILLION)
  • TABLE 101 CHINA: MARKET, BY APPLICATION, 2023–2030 (USD MILLION)
  • TABLE 102 INDIA: MARKET, BY TYPE, 2019–2022 (USD MILLION)
  • TABLE 103 INDIA: MARKET, BY TYPE, 2023–2030 (USD MILLION)
  • TABLE 104 INDIA: MARKET, BY APPLICATION, 2019–2022 (USD MILLION)
  • TABLE 105 INDIA: MARKET, BY APPLICATION, 2023–2030 (USD MILLION)
  • TABLE 106 JAPAN: MARKET, BY TYPE, 2019–2022 (USD MILLION)
  • TABLE 107 JAPAN: MARKET, BY TYPE, 2023–2030 (USD MILLION)
  • TABLE 108 JAPAN: MARKET, BY APPLICATION, 2019–2022 (USD MILLION)
  • TABLE 109 JAPAN: MARKET, BY APPLICATION, 2023–2030 (USD MILLION)
  • TABLE 110 SOUTH KOREA: MARKET, BY TYPE, 2019–2022 (USD MILLION)
  • TABLE 111 SOUTH KOREA: MARKET, BY TYPE, 2023–2030 (USD MILLION)
  • TABLE 112 SOUTH KOREA: MARKET, BY APPLICATION, 2019–2022 (USD MILLION)
  • TABLE 113 SOUTH KOREA: MARKET, BY APPLICATION, 2023–2030 (USD MILLION)
  • TABLE 114 AUSTRALIA: MARKET, BY TYPE, 2019–2022 (USD MILLION)
  • TABLE 115 AUSTRALIA: MARKET, BY TYPE, 2023–2030 (USD MILLION)
  • TABLE 116 AUSTRALIA: MARKET, BY APPLICATION, 2019–2022 (USD MILLION)
  • TABLE 117 AUSTRALIA: MARKET, BY APPLICATION, 2023–2030 (USD MILLION)
  • TABLE 118 REST OF ASIA PACIFIC: MARKET, BY TYPE, 2019–2022 (USD MILLION)
  • TABLE 119 REST OF ASIA PACIFIC: MARKET, BY TYPE, 2023–2030 (USD MILLION)
  • TABLE 120 REST OF ASIA PACIFIC: MARKET, BY APPLICATION, 2019–2022 (USD MILLION)
  • TABLE 121 REST OF ASIA PACIFIC: MARKET, BY APPLICATION, 2023–2030 (USD MILLION)
  • TABLE 122 EUROPE: MARKET, BY TYPE, 2019–2022 (USD MILLION)
  • TABLE 123 EUROPE: MARKET, BY TYPE, 2023–2030 (USD MILLION)
  • TABLE 124 EUROPE: MARKET, BY DIELECTRIC MEDIUM, 2019–2022 (USD MILLION)
  • TABLE 125 EUROPE: MARKET, BY DIELECTRIC MEDIUM, 2023–2030 (USD MILLION)
  • TABLE 126 EUROPE: MARKET, BY VOLTAGE, 2019–2022 (USD MILLION)
  • TABLE 127 EUROPE: MARKET, BY VOLTAGE, 2023–2030 (USD MILLION)
  • TABLE 128 EUROPE: MARKET, BY ENCLOSURE TYPE, 2019–2022 (USD MILLION)
  • TABLE 129 EUROPE: MARKET, BY ENCLOSURE TYPE, 2023–2030 (USD MILLION)
  • TABLE 130 EUROPE: MARKET, BY APPLICATION, 2019–2022 (USD MILLION)
  • TABLE 131 EUROPE: MARKET, BY APPLICATION, 2023–2030 (USD MILLION)
  • TABLE 132 EUROPE: MARKET, BY END USER, 2019–2022 (USD MILLION)
  • TABLE 133 EUROPE: MARKET, BY END USER, 2023–2030 (USD MILLION)
  • TABLE 134 EUROPE: MARKET, BY COUNTRY, 2019–2022 (USD MILLION)
  • TABLE 135 EUROPE: MARKET, BY COUNTRY, 2023–2030 (USD MILLION)
  • TABLE 136 GERMANY: MARKET, BY TYPE, 2019–2022 (USD MILLION)
  • TABLE 137 GERMANY: MARKET, BY TYPE, 2023–2030 (USD MILLION)
  • TABLE 138 GERMANY: MARKET, BY APPLICATION, 2019–2022 (USD MILLION)
  • TABLE 139 GERMANY: MARKET, BY APPLICATION, 2023–2030 (USD MILLION)
  • TABLE 140 UK: MARKET, BY TYPE, 2019–2022 (USD MILLION)
  • TABLE 141 UK: MARKET, BY TYPE, 2023–2030 (USD MILLION)
  • TABLE 142 UK: MARKET, BY APPLICATION, 2019–2022 (USD MILLION)
  • TABLE 143 UK: MARKET, BY APPLICATION, 2023–2030 (USD MILLION)
  • TABLE 144 FRANCE: MARKET, BY TYPE, 2019–2022 (USD MILLION)
  • TABLE 145 FRANCE: MARKET, BY TYPE, 2023–2030 (USD MILLION)
  • TABLE 146 FRANCE: MARKET, BY APPLICATION, 2019–2022 (USD MILLION)
  • TABLE 147 FRANCE: MARKET, BY APPLICATION, 2023–2030 (USD MILLION)
  • TABLE 148 SPAIN: MARKET, BY TYPE, 2019–2022 (USD MILLION)
  • TABLE 149 SPAIN: MARKET, BY TYPE, 2023–2030 (USD MILLION)
  • TABLE 150 SPAIN: MARKET, BY APPLICATION, 2019–2022 (USD MILLION)
  • TABLE 151 SPAIN: MARKET, BY APPLICATION, 2023–2030 (USD MILLION)
  • TABLE 152 SWEDEN: MARKET, BY TYPE, 2019–2022 (USD MILLION)
  • TABLE 153 SWEDEN: MARKET, BY TYPE, 2023–2030 (USD MILLION)
  • TABLE 154 SWEDEN: MARKET, BY APPLICATION, 2019–2022 (USD MILLION)
  • TABLE 155 SWEDEN: MARKET, BY APPLICATION, 2023–2030 (USD MILLION)
  • TABLE 156 NORWAY: MARKET, BY TYPE, 2019–2022 (USD MILLION)
  • TABLE 157 NORWAY: MARKET, BY TYPE, 2023–2030 (USD MILLION)
  • TABLE 158 NORWAY: MARKET, BY APPLICATION, 2019–2022 (USD MILLION)
  • TABLE 159 NORWAY: MARKET, BY APPLICATION, 2023–2030 (USD MILLION)
  • TABLE 160 RUSSIA: MARKET, BY TYPE, 2019–2022 (USD MILLION)
  • TABLE 161 RUSSIA: MARKET, BY TYPE, 2023–2030 (USD MILLION)
  • TABLE 162 RUSSIA: MARKET, BY APPLICATION, 2019–2022 (USD MILLION)
  • TABLE 163 RUSSIA: MARKET, BY APPLICATION, 2023–2030 (USD MILLION)
  • TABLE 164 REST OF EUROPE: MARKET, BY TYPE, 2019–2022 (USD MILLION)
  • TABLE 165 REST OF EUROPE: MARKET, BY TYPE, 2023–2030 (USD MILLION)
  • TABLE 166 REST OF EUROPE: MARKET, BY APPLICATION, 2019–2022 (USD MILLION)
  • TABLE 167 REST OF EUROPE: MARKET, BY APPLICATION, 2023–2030 (USD MILLION)
  • TABLE 168 NORTH AMERICA: MARKET, BY TYPE, 2019–2022 (USD MILLION)
  • TABLE 169 NORTH AMERICA: MARKET, BY TYPE, 2023–2030 (USD MILLION)
  • TABLE 170 NORTH AMERICA: MARKET, BY DIELECTRIC MEDIUM, 2019–2022 (USD MILLION)
  • TABLE 171 NORTH AMERICA: MARKET, BY DIELECTRIC MEDIUM, 2023–2030 (USD MILLION)
  • TABLE 172 NORTH AMERICA: MARKET, BY VOLTAGE, 2019–2022 (USD MILLION)
  • TABLE 173 NORTH AMERICA: MARKET, BY VOLTAGE, 2023–2030 (USD MILLION)
  • TABLE 174 NORTH AMERICA: MARKET, BY ENCLOSURE TYPE, 2019–2022 (USD MILLION)
  • TABLE 175 NORTH AMERICA: MARKET, BY ENCLOSURE TYPE, 2023–2030 (USD MILLION)
  • TABLE 176 NORTH AMERICA: MARKET, BY APPLICATION, 2019–2022 (USD MILLION)
  • TABLE 177 NORTH AMERICA: MARKET, BY APPLICATION, 2023–2030 (USD MILLION)
  • TABLE 178 NORTH AMERICA: MARKET, BY END USER, 2019–2022 (USD MILLION)
  • TABLE 179 NORTH AMERICA: MARKET, BY END USER, 2023–2030 (USD MILLION)
  • TABLE 180 NORTH AMERICA: MARKET, BY COUNTRY, 2019–2022 (USD MILLION)
  • TABLE 181 NORTH AMERICA: MARKET, BY COUNTRY, 2023–2030 (USD MILLION)
  • TABLE 182 US: MARKET, BY TYPE, 2019–2022 (USD MILLION)
  • TABLE 183 US: MARKET, BY TYPE, 2023–2030 (USD MILLION)
  • TABLE 184 US: MARKET, BY APPLICATION, 2019–2022 (USD MILLION)
  • TABLE 185 US: MARKET, BY APPLICATION, 2023–2030 (USD MILLION)
  • TABLE 186 CANADA: MARKET, BY TYPE, 2019–2022 (USD MILLION)
  • TABLE 187 CANADA: MARKET, BY TYPE, 2023–2030 (USD MILLION)
  • TABLE 188 CANADA: MARKET, BY APPLICATION, 2019–2022 (USD MILLION)
  • TABLE 189 CANADA: MARKET, BY APPLICATION, 2023–2030 (USD MILLION)
  • TABLE 190 MEXICO: MARKET, BY TYPE, 2019–2022 (USD MILLION)
  • TABLE 191 MEXICO: MARKET, BY TYPE, 2023–2030 (USD MILLION)
  • TABLE 192 MEXICO: MARKET, BY APPLICATION, 2019–2022 (USD MILLION)
  • TABLE 193 MEXICO: MARKET, BY APPLICATION, 2023–2030 (USD MILLION)
  • TABLE 194 MIDDLE EAST & AFRICA: MARKET, BY TYPE, 2019–2022 (USD MILLION)
  • TABLE 195 MIDDLE EAST & AFRICA: MARKET, BY TYPE, 2023–2030 (USD MILLION)
  • TABLE 196 MIDDLE EAST & AFRICA: MARKET, BY DIELECTRIC MEDIUM, 2019–2022 (USD MILLION)
  • TABLE 197 MIDDLE EAST & AFRICA: MARKET, BY DIELECTRIC MEDIUM, 2023–2030 (USD MILLION)
  • TABLE 198 MIDDLE EAST & AFRICA: MARKET, BY VOLTAGE, 2019–2022 (USD MILLION)
  • TABLE 199 MIDDLE EAST & AFRICA: MARKET, BY VOLTAGE, 2023–2030 (USD MILLION)
  • TABLE 200 MIDDLE EAST & AFRICA: MARKET, BY ENCLOSURE TYPE, 2019–2022 (USD MILLION)
  • TABLE 201 MIDDLE EAST & AFRICA: MARKET, BY ENCLOSURE TYPE, 2023–2030 (USD MILLION)
  • TABLE 202 MIDDLE EAST & AFRICA: MARKET, BY APPLICATION, 2019–2022 (USD MILLION)
  • TABLE 203 MIDDLE EAST & AFRICA: MARKET, BY APPLICATION, 2023–2030 (USD MILLION)
  • TABLE 204 MIDDLE EAST & AFRICA: MARKET, BY END USER, 2019–2022 (USD MILLION)
  • TABLE 205 MIDDLE EAST & AFRICA: MARKET, BY END USER, 2023–2030 (USD MILLION)
  • TABLE 206 MIDDLE EAST & AFRICA: MARKET, BY COUNTRY, 2019–2022 (USD MILLION)
  • TABLE 207 MIDDLE EAST & AFRICA: MARKET, BY COUNTRY, 2023–2030 (USD MILLION)
  • TABLE 208 SAUDI ARABIA: MARKET, BY TYPE, 2019–2022 (USD MILLION)
  • TABLE 209 SAUDI ARABIA: MARKET, BY TYPE, 2023–2030 (USD MILLION)
  • TABLE 210 SAUDI ARABIA: MARKET, BY APPLICATION, 2019–2022 (USD MILLION)
  • TABLE 211 SAUDI ARABIA: MARKET, BY APPLICATION, 2023–2030 (USD MILLION)
  • TABLE 212 UAE: MARKET, BY TYPE, 2019–2022 (USD MILLION)
  • TABLE 213 UAE: MARKET, BY TYPE, 2023–2030 (USD MILLION)
  • TABLE 214 UAE: MARKET, BY APPLICATION, 2019–2022 (USD MILLION)
  • TABLE 215 UAE: MARKET, BY APPLICATION, 2023–2030 (USD MILLION)
  • TABLE 216 QATAR: MARKET, BY TYPE, 2019–2022 (USD MILLION)
  • TABLE 217 QATAR: MARKET, BY TYPE, 2023–2030 (USD MILLION)
  • TABLE 218 QATAR: MARKET, BY APPLICATION, 2019–2022 (USD MILLION)
  • TABLE 219 QATAR: MARKET, BY APPLICATION, 2023–2030 (USD MILLION)
  • TABLE 220 REST OF GCC COUNTRIES: MARKET, BY TYPE, 2019–2022 (USD MILLION)
  • TABLE 221 REST OF GCC COUNTRIES: MARKET, BY TYPE, 2023–2030 (USD MILLION)
  • TABLE 222 REST OF GCC COUNTRIES: MARKET, BY APPLICATION, 2019–2022 (USD MILLION)
  • TABLE 223 REST OF GCC COUNTRIES: MARKET, BY APPLICATION, 2023–2030 (USD MILLION)
  • TABLE 224 SOUTH AFRICA: MARKET, BY TYPE, 2019–2022 (USD MILLION)
  • TABLE 225 SOUTH AFRICA: MARKET, BY TYPE, 2023–2030 (USD MILLION)
  • TABLE 226 SOUTH AFRICA: MARKET, BY APPLICATION, 2019–2022 (USD MILLION)
  • TABLE 227 SOUTH AFRICA: MARKET, BY APPLICATION, 2023–2030 (USD MILLION)
  • TABLE 228 REST OF MIDDLE EAST & AFRICA: MARKET, BY TYPE, 2019–2022 (USD MILLION)
  • TABLE 229 REST OF MIDDLE EAST & AFRICA: MARKET, BY TYPE, 2023–2030 (USD MILLION)
  • TABLE 230 REST OF MIDDLE EAST & AFRICA: MARKET, BY APPLICATION, 2019–2022 (USD MILLION)
  • TABLE 231 REST OF MIDDLE EAST & AFRICA: MARKET, BY APPLICATION, 2023–2030 (USD MILLION)
  • TABLE 232 SOUTH AMERICA: MARKET, BY TYPE, 2019–2022 (USD MILLION)
  • TABLE 233 SOUTH AMERICA: MARKET, BY TYPE, 2023–2030 (USD MILLION)
  • TABLE 234 SOUTH AMERICA: MARKET, BY DIELECTRIC MEDIUM, 2019–2022 (USD MILLION)
  • TABLE 235 SOUTH AMERICA: MARKET, BY DIELECTRIC MEDIUM, 2023–2030 (USD MILLION)
  • TABLE 236 SOUTH AMERICA: MARKET, BY VOLTAGE, 2019–2022 (USD MILLION)
  • TABLE 237 SOUTH AMERICA: MARKET, BY VOLTAGE, 2023–2030 (USD MILLION)
  • TABLE 238 SOUTH AMERICA: MARKET, BY ENCLOSURE TYPE, 2019–2022 (USD MILLION)
  • TABLE 239 SOUTH AMERICA: MARKET, BY ENCLOSURE TYPE, 2023–2030 (USD MILLION)
  • TABLE 240 SOUTH AMERICA: MARKET, BY APPLICATION, 2019–2022 (USD MILLION)
  • TABLE 241 SOUTH AMERICA: MARKET, BY APPLICATION, 2023–2030 (USD MILLION)
  • TABLE 242 SOUTH AMERICA: MARKET, BY END USER, 2019–2022 (USD MILLION)
  • TABLE 243 SOUTH AMERICA: MARKET, BY END USER, 2023–2030 (USD MILLION)
  • TABLE 244 SOUTH AMERICA: MARKET, BY COUNTRY, 2019–2022 (USD MILLION)
  • TABLE 245 SOUTH AMERICA: MARKET, BY COUNTRY, 2023–2030 (USD MILLION)
  • TABLE 246 BRAZIL: MARKET, BY TYPE, 2019–2022 (USD MILLION)
  • TABLE 247 BRAZIL: MARKET, BY TYPE, 2023–2030 (USD MILLION)
  • TABLE 248 BRAZIL: MARKET, BY APPLICATION, 2019–2022 (USD MILLION)
  • TABLE 249 BRAZIL: MARKET, BY APPLICATION, 2023–2030 (USD MILLION)
  • TABLE 250 ARGENTINA: MARKET, BY TYPE, 2019–2022 (USD MILLION)
  • TABLE 251 ARGENTINA: MARKET, BY TYPE, 2023–2030 (USD MILLION)
  • TABLE 252 ARGENTINA: MARKET, BY APPLICATION, 2019–2022 (USD MILLION)
  • TABLE 253 ARGENTINA: MARKET, BY APPLICATION, 2023–2030 (USD MILLION)
  • TABLE 254 CHILE: MARKET, BY TYPE, 2019–2022 (USD MILLION)
  • TABLE 255 CHILE: MARKET, BY TYPE, 2023–2030 (USD MILLION)
  • TABLE 256 CHILE: MARKET, BY APPLICATION, 2019–2022 (USD MILLION)
  • TABLE 257 CHILE: MARKET, BY APPLICATION, 2023–2030 (USD MILLION)
  • TABLE 258 REST OF SOUTH AMERICA: MARKET, BY TYPE, 2019–2022 (USD MILLION)
  • TABLE 259 REST OF SOUTH AMERICA: MARKET, BY TYPE, 2023–2030 (USD MILLION)
  • TABLE 260 REST OF SOUTH AMERICA: MARKET, BY APPLICATION, 2019–2022 (USD MILLION)
  • TABLE 261 REST OF SOUTH AMERICA: MARKET, BY APPLICATION, 2023–2030 (USD MILLION)
  • TABLE 262 STRATEGIES ADOPTED BY MAJOR PLAYERS, 2019–2022
  • TABLE 263 MARKET: DEGREE OF COMPETITION
  • TABLE 264 TYPE FOOTPRINT
  • TABLE 265 DIELECTRIC MEDIUM FOOTPRINT
  • TABLE 266 ENCLOSURE TYPE FOOTPRINT
  • TABLE 267 APPLICATION FOOTPRINT
  • TABLE 268 END USER FOOTPRINT
  • TABLE 269 REGION FOOTPRINT
  • TABLE 270 OVERALL COMPANY FOOTPRINT
  • TABLE 271 MARKET: COMPETITIVE BENCHMARKING OF START-UPS/SMES
  • TABLE 272 MARKET: LIST OF KEY START-UPS/SMES
  • TABLE 273 MARKET: PRODUCT LAUNCHES, FEBRUARY 2020–MARCH 2023
  • TABLE 274 INSTRUMENTAL TRANSFORMER MARKET: DEALS, OCTOBER 2021– DECEMBER 2023
  • TABLE 275 MARKET: OTHERS, APRIL 2019–DECEMBER 2023
  • TABLE 276 ABB: COMPANY OVERVIEW
  • TABLE 277 ABB: PRODUCTS OFFERED
  • TABLE 278 ABB: DEALS
  • TABLE 279 GENERAL ELECTRIC: COMPANY OVERVIEW
  • TABLE 280 GENERAL ELECTRIC: PRODUCTS OFFERED
  • TABLE 281 GENERAL ELECTRIC: PRODUCT LAUNCHES
  • TABLE 282 GENERAL ELECTRIC: DEALS
  • TABLE 283 MITSUBISHI ELECTRIC: COMPANY OVERVIEW
  • TABLE 284 MITSUBISHI ELECTRIC: PRODUCTS OFFERED
  • TABLE 285 MITSUBISHI ELECTRIC: DEALS
  • TABLE 286 SCHNEIDER ELECTRIC: COMPANY OVERVIEW
  • TABLE 287 SCHNEIDER ELECTRIC: PRODUCTS OFFERED
  • TABLE 288 SIEMENS ENERGY: COMPANY OVERVIEW
  • TABLE 289 SIEMENS ENERGY: PRODUCTS OFFERED
  • TABLE 290 SIEMENS ENERGY: DEALS
  • TABLE 291 ARTECHE: COMPANY OVERVIEW
  • TABLE 292 ARTECHE: PRODUCTS OFFERED
  • TABLE 293 ARTECHE: PRODUCT LAUNCHES
  • TABLE 294 ARTECHE: DEALS
  • TABLE 295 ARTECHE: OTHER DEVELOPMENTS
  • TABLE 296 BHEL: COMPANY OVERVIEW
  • TABLE 297 BHEL: PRODUCTS OFFERED
  • TABLE 298 CG POWER AND INDUSTRIAL SOLUTIONS: COMPANY OVERVIEW
  • TABLE 299 CG POWER AND INDUSTRIAL SOLUTIONS: PRODUCTS OFFERED
  • TABLE 300 CG POWER AND INDUSTRIAL SOLUTIONS: PRODUCT LAUNCHES
  • TABLE 301 NISSIN ELECTRIC CO., LTD.: COMPANY OVERVIEW
  • TABLE 302 NISSIN ELECTRIC CO., LTD.: PRODUCTS OFFERED
  • TABLE 303 EMEK ELEKTRIK ENDÜSTRISI A.S: COMPANY OVERVIEW
  • TABLE 304 EMEK ELEKTRIK ENDÜSTRISI A.S: PRODUCTS OFFERED
  • TABLE 305 INDIAN TRANSFORMERS AND ELECTRICALS PVT. LTD: COMPANY OVERVIEW
  • TABLE 306 INDIAN TRANSFORMERS AND ELECTRICALS PVT. LTD: PRODUCTS OFFERED
  • TABLE 307 MEHRU: COMPANY OVERVIEW
  • TABLE 308 MEHRU: PRODUCTS OFFERED
  • TABLE 309 KONCAR - INSTRUMENT TRANSFORMERS INC.: COMPANY OVERVIEW
  • TABLE 310 KONCAR - INSTRUMENT TRANSFORMERS INC.: PRODUCTS OFFERED
  • TABLE 311 PFIFFNER GROUP: COMPANY OVERVIEW
  • TABLE 312 PFIFFNER GROUP: PRODUCTS OFFERED
  • TABLE 313 PFIFFNER GROUP: DEALS
  • TABLE 314 RITZ INSTRUMENT TRANSFORMERS GMBH: COMPANY OVERVIEW
  • TABLE 315 RITZ INSTRUMENT TRANSFORMERS GMBH: PRODUCTS OFFERED
LIST OF FIGURES
 
  • FIGURE 1 MARKET SEGMENTATION
  • FIGURE 2 COUNTRIES COVERED
  • FIGURE 3 MARKET: RESEARCH DESIGN
  • FIGURE 4 DATA TRIANGULATION
  • FIGURE 5 BREAKDOWN OF PRIMARIES: BY COMPANY TYPE, DESIGNATION, AND REGION
  • FIGURE 6 MARKET: BOTTOM-UP APPROACH
  • FIGURE 7 MARKET: TOP-DOWN APPROACH
  • FIGURE 8 METRICS CONSIDERED TO ANALYZE AND ASSESS DEMAND FOR INSTRUMENT TRANSFORMERS
  • FIGURE 9 METRICS CONSIDERED TO ASSESS SUPPLY OF INSTRUMENT TRANSFORMERS
  • FIGURE 10 MARKET: SUPPLY-SIDE ANALYSIS
  • FIGURE 11 ASIA PACIFIC DOMINATED MARKET IN 2022
  • FIGURE 12 CURRENT TRANSFORMERS TO DOMINATE MARKET THROUGHOUT FORECAST PERIOD
  • FIGURE 13 OUTDOOR ENCLOSURES TO ACCOUNT FOR LARGER MARKET SHARE IN 2023
  • FIGURE 14 DISTRIBUTION SEGMENT TO HOLD LARGEST SHARE OF INSTRUMENT TRANSFORMER MARKET IN 2023
  • FIGURE 15 TRANSFORMER & CIRCUIT BREAKER BUSHING APPLICATION TO LEAD INSTRUMENT TRANSFORMER MARKET IN 2023
  • FIGURE 16 POWER UTILITIES TO LEAD INSTRUMENT TRANSFORMER MARKET THROUGHOUT FORECAST PERIOD
  • FIGURE 17 LIQUID DIELECTRIC INSTRUMENT TRANSFORMERS TO CAPTURE LARGEST MARKET SHARE IN 2023
  • FIGURE 18 SURGING DEMAND FOR ELECTRICITY TO BOOST ADOPTION OF INSTRUMENT TRANSFORMERS IN COMING YEARS
  • FIGURE 19 INSTRUMENT TRANSFORMER MARKET IN ASIA PACIFIC TO GROW AT HIGHEST CAGR DURING FORECAST PERIOD
  • FIGURE 20 OUTDOOR SEGMENT AND CHINA ACCOUNTED FOR LARGEST SHARES OF INSTRUMENT TRANSFORMER MARKET IN ASIA PACIFIC IN 2022
  • FIGURE 21 CURRENT TRANSFORMERS TO HOLD LARGEST SHARE OF INSTRUMENT TRANSFORMER MARKET IN 2030
  • FIGURE 22 OUTDOOR ENCLOSURES TO ACCOUNT FOR LARGER SHARE OF INSTRUMENT TRANSFORMER MARKET IN 2030
  • FIGURE 23 DISTRIBUTION SEGMENT TO CAPTURE LARGEST SHARE OF INSTRUMENT TRANSFORMER MARKET IN 2030
  • FIGURE 24 TRANSFORMER & CIRCUIT BREAKER BUSHING SEGMENT TO DOMINATE INSTRUMENT TRANSFORMER MARKET IN 2030
  • FIGURE 25 POWER UTILITIES SEGMENT LED INSTRUMENT TRANSFORMER MARKET IN 2030
  • FIGURE 26 LIQUID SEGMENT TO LEAD INSTRUMENT TRANSFORMER MARKET IN 2030
  • FIGURE 27 INSTRUMENT TRANSFORMERS: DRIVERS, RESTRAINTS, OPPORTUNITIES, AND THREATS
  • FIGURE 28 GLOBAL INVESTMENTS IN POWER GRIDS, 2015–2022
  • FIGURE 29 GLOBAL RENEWABLE ELECTRICITY CAPACITY EXPANSION, 2005–2028
  • FIGURE 30 AVERAGE ANNUAL PRICE OF COPPER, 2017–2023 (USD/KG)
  • FIGURE 31 CUMULATIVE ENERGY SAVINGS IN BUILDINGS IN SELECTED COUNTRIES, 2017–2040
  • FIGURE 32 ENERGY INVESTMENTS IN EMERGING MARKETS, BY SOURCE TYPE, 2019 AND 2022
  • FIGURE 33 TRENDS INFLUENCING CUSTOMER BUSINESS
  • FIGURE 34 VALUE CHAIN ANALYSIS: INSTRUMENT TRANSFORMER MARKET
  • FIGURE 35 INSTRUMENT TRANSFORMER BUSINESS ECOSYSTEM
  • FIGURE 36 INSTRUMENT TRANSFORMER MARKET: INNOVATIONS AND PATENT REGISTRATIONS, 2013–2023
  • FIGURE 37 IMPORT VALUE OF HS CODE 8504-COMPLIANT PRODUCTS IN TOP 5 COUNTRIES, 2018–2022 (USD THOUSAND)
  • FIGURE 38 EXPORT VALUE OF HS CODE 8504-COMPLIANT PRODUCTS IN TOP 5 COUNTRIES, 2018–2022 (USD THOUSAND)
  • FIGURE 39 AVERAGE SELLING PRICE OF INSTRUMENT TRANSFORMERS, BY REGION, 2019–2030 (USD/UNIT)
  • FIGURE 40 INSTRUMENT TRANSFORMER MARKET: PORTER’S FIVE FORCES ANALYSIS
  • FIGURE 41 INFLUENCE OF KEY STAKEHOLDERS ON BUYING PROCESS FOR END USERS
  • FIGURE 42 INFLUENCE OF KEY STAKEHOLDERS ON BUYING PROCESS FOR END USERS
  • FIGURE 43 INSTRUMENT TRANSFORMER MARKET, BY TYPE, 2022
  • FIGURE 44 INSTRUMENT TRANSFORMER MARKET, BY ENCLOSURE TYPE, 2023
  • FIGURE 45 INSTRUMENT TRANSFORMER MARKET, BY DIELECTRIC MEDIUM, 2023
  • FIGURE 46 INSTRUMENT TRANSFORMER MARKET, BY VOLTAGE, 2023
  • FIGURE 47 INSTRUMENT TRANSFORMER MARKET, BY APPLICATION, 2023
  • FIGURE 48 INSTRUMENT TRANSFORMER MARKET, BY END USER, 2023
  • FIGURE 49 INSTRUMENT TRANSFORMER MARKET SHARE, BY REGION, 2023
  • FIGURE 50 ASIA PACIFIC TO WITNESS HIGHEST CAGR IN INSTRUMENT TRANSFORMER MARKET DURING FORECAST PERIOD
  • FIGURE 51 ASIA PACIFIC: INSTRUMENT TRANSFORMER MARKET SNAPSHOT
  • FIGURE 52 EUROPE: INSTRUMENT TRANSFORMER MARKET SNAPSHOT
  • FIGURE 53 MARKET SHARE ANALYSIS OF KEY PLAYERS, 2022
  • FIGURE 54 INSTRUMENT TRANSFORMER MARKET: REVENUE ANALYSIS OF TOP 5 PLAYERS, 2018–2022
  • FIGURE 55 INSTRUMENT TRANSFORMER MARKET: COMPANY EVALUATION MATRIX, 2022
  • FIGURE 56 INSTRUMENT TRANSFORMER MARKET: START-UP/SME EVALUATION MATRIX, 2022
  • FIGURE 57 ABB: COMPANY SNAPSHOT
  • FIGURE 58 GENERAL ELECTRIC: COMPANY SNAPSHOT
  • FIGURE 59 MITSUBISHI ELECTRIC: COMPANY SNAPSHOT
  • FIGURE 60 SCHNEIDER ELECTRIC: COMPANY SNAPSHOT
  • FIGURE 61 SIEMENS ENERGY: COMPANY SNAPSHOT
  • FIGURE 62 ARTECHE: COMPANY SNAPSHOT
  • FIGURE 63 BHEL: COMPANY SNAPSHOT
  • FIGURE 64 CG POWER AND INDUSTRIAL SOLUTIONS: COMPANY SNAPSHOT
  • FIGURE 65 NISSIN ELECTRIC CO., LTD.: COMPANY SNAPSHOT
  • FIGURE 66 KONCAR- INSTRUMENT TRANSFORMERS INC.: COMPANY SNAPSHOT


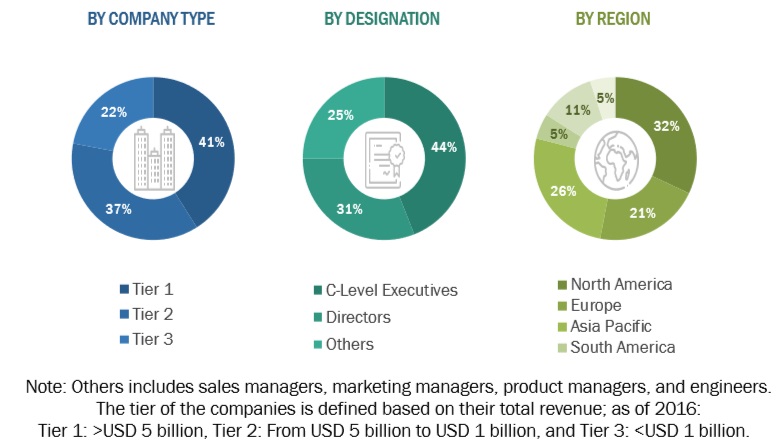
This study involved substantial efforts to determine the current size of the instrument transformers market. It began with a rigorous secondary research procedure to acquire information on the market, analogous markets, and the overall industry. These results, assumptions, and market size projections were then carefully evaluated by contacting industry experts from throughout the whole value chain using primary research methods. The entire market size was determined by completing a country-specific analysis. Following that, the market was dissected further, with data cross-referenced to estimate the size of various market segments and sub-segments.

Secondary Research

Several secondary sources were used during the secondary research process to discover and collect material for this study. Secondary sources include company annual reports, press announcements, investor presentations, white papers, certified publications, articles by recognized writers, manufacturers' organizations, directories, and databases.

Secondary research was primarily conducted to obtain key information about the industry's supply chain, the total pool of key players, market classification and segmentation based on industry trends to the lowest level, regional markets, and key developments from both market and technology perspectives.

Primary Research

During the main research process, several primary sources were interviewed to gather qualitative and quantitative data for this study. Primary supply-side sources include industry professionals such as CEOs, vice presidents, marketing directors, technology and innovation directors, and other important executives from various top firms and organizations in the worldwide instrument transformers market.   
Instrument Transformers Market Size, and Share

To know about the assumptions considered for the study, download the pdf brochure

Market Size Estimation

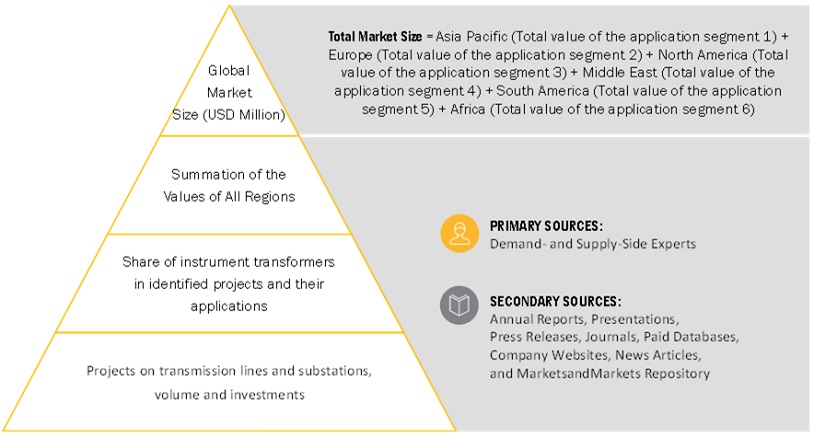
The size of the market and its related submarkets was estimated and validated using both top-down and bottom-up techniques. The research method used to estimate market size includes secondary research to identify key firms, as well as primary and secondary research to assess their market shares in relevant areas. This procedure comprises analyzing the annual and financial reports of key market businesses, as well as conducting in-depth interviews with industry specialists such as CEOs, VPs, directors, and marketing executives to gain valuable insights. All percentage shares, splits, and breakdowns were derived using secondary sources and confirmed with original sources. To get at the final quantitative and qualitative data, all conceivable parameters affecting the markets included in this research study were accounted for, examined in great depth, validated by primary research, and assessed.

Global Instrument Transformers Market Size: Bottom-Up Approach
Instrument Transformers Market Bottom Up Approach

To know about the assumptions considered for the study, Request for Free Sample Report

Data Triangulation

After calculating the overall market size using the process indicated above, the whole market was divided into several categories and sub-segments. Data triangulation including market breakdown procedures were used, when appropriate, to complete the whole market engineering process and provide correct statistics for all segments and sub-segments. The data has been triangulated by examining numerous aspects and trends on both the demand and supply sides. In addition, the market has been verified using top-down and bottom-up approaches.

Market Definition

The electricity used by residential, commercial, and industrial users comes from centralized power facilities located far from the consumption locations. These power plants are linked to end customers via a complicated transmission and distribution infrastructure. This network extends beyond individual electric companies and, in some cases, across entire countries, such as Europe. To manage energy flow, numerous measurements are taken across the grid to determine its electrical status. Real-time voltage and current measurements at several sites offer information about the system's state. Measurements are taken at power plant outputs, as well as at the input and output of lines that meet at transmission or distribution substations. These metrics are used for invoicing reasons, allowing firms to track their power output and consumer use. Vigilant monitoring avoids overloading, diagnoses defects, and optimizes generation and distribution for efficient grid management.

Instrument transformers are specialized electrical devices that safely and precisely monitor high voltage and current in power networks. They serve as an important connection between high-voltage power lines and low-voltage measuring devices, allowing for safe and reliable monitoring of vital electrical parameters. Instrument transformers essentially convert high voltage or current values into safer and more controllable levels that may be measured by equipment like as meters, relays, and safety devices.

This transformation is accomplished by electromagnetic induction, which occurs when a change in current or voltage in the transformer's main winding causes a proportionate change in the secondary winding.

The scope of this study covers, but is not limited to, all accuracy classes for instrument transformers described by IEEE, CSA, IEC, and ANSI standards..

Key Stakeholders

  • Banks, venture capitalists, financial institutions, and other investors
  • Companies related to electric power generation, transmission, and distribution
  • Energy associations
  • Environment associations
  • Energy efficiency consultants
  • Government and industry associations
  • Government and research organizations
  • Manufacturing industry
  • Public & private power generation, transmission & distribution companies (utilities)
  • Smart grid project developers
  • State and national regulatory authorities
  • Sub-station equipment manufacturing companies
  • Venture capital firms

Objectives of the Study

  • The instruments transformers market will be defined, described, segmented, and forecasted based on installation, insulation, voltage, current,  and end-user.
  • To forecast market size for five key regions: North America, South America, Europe, Asia Pacific, and the Middle East and Africa, as well as the key countries within each region.
  • To provide comprehensive information about market growth drivers, restraints, opportunities, and industry-specific challenges.
  • To strategically analyze the subsegments in terms of individual growth trends, prospects, and contributions to overall market size.
  • To examine market opportunities for stakeholders and the competitive landscape for market leaders.
  • To profile the key players strategically and thoroughly analyze their market shares and core competencies.
  • To monitor and analyze competitive developments in the instruments transformers market, such as agreements, sales contracts, partnerships, new product launches, acquisitions, joint ventures, contracts, expansions, and investments.
  • This report examines the value of the instruments transformers market.

Available Customizations

With the given market data, MarketsandMarkets offers customizations according to your specific needs. The following customization options are available for a report:

Product Analysis

  • Product Matrix, which provides a detailed comparison of the product portfolio of each company

Company Information

  • Detailed analyses and profiling of additional market players

Previous Versions of this Report

Instrument Transformers Market by Type (Current, potential, and combined), Installation (liquid, SF6 gas, solid), Enclosure (indoor and outdoor), Voltage, End-User, and Region (North America, Europe, APAC, Latin America, MEA) - Global Forecast to 2030

Report Code EP 5867
Published in Jan, 2018, By MarketsandMarkets™
"Our USP is "providing game-changing business opportunities reports with free customization" - so please feel free to provide us with your specific areas of interest / business challenges in much greater detail !!"

We appreciate your interest in this report. Once you fill out the form, you'll be immediately directed to an exclusive solution tailored to your needs. This high-value offering can help boost your revenue by 30% - a must-see opportunity for anyone looking to maximize growth.


By clicking the "Submit" button, you are agreeing to the Terms of Use and Privacy Policy.

Custom Market Research Services

We Will Customise The Research For You, In Case The Report Listed Above Does Not Meet With Your Requirements

Get 10% Free Customisation

Growth opportunities and latent adjacency in Instrument Transformers Market

DMCA.com Protection Status