Industrial Filtration Market Size, Share, Growth, Analysis

Industrial Filtration Market by Type (Air & Liquid), Product (Filter Press, Bag, Drum, Depth, Cartridge, HEPA, ULPA), Filter Media (Activated Charcoal, Fiberglass, Filter Paper, Metal, Nonwoven Fabric), Industry and Region - Global Forecast to 2029

Report Code: EP 4471 Mar, 2024, by marketsandmarkets.com

[305 Pages Report] The global industrial filtration market is forecast to reach USD 47.1 billion by 2029 from an estimated USD 37.1 billion in 2024, at a CAGR of 4.9% during the forecast period (2024-2029). Changes in concerns evoked by environmental sustainability, which was increasingly becoming an important focus of industries collectively with stringent regulatory requirements to be implemented globally would propel the industry to make investments in the advanced filtration solutions that would quicken emission reduction, wastes minimization, and compliance with set standards. All that, included with the help of the IoT and digitalization which would aid in the constant monitoring, prediction of maintenance, and the overall optimization of the filtration systems would then lead to greater efficiency and cost savings.

Industrial Filtration Market

To know about the assumptions considered for the study, Request for Free Sample Report

Industrial Filtration Market Opportunities

To know about the assumptions considered for the study, download the pdf brochure

Industrial Filtration Market Dynamics

Driver: Increasing expenditure on refinery and petrochemical infrastructure development

All the same oil refineries and the petrochemical plants are the foundation for almost the entire global energy market. Refiners refine crude oil into products such as gasoline, diesel, jet fuel and other types of petrochemicals that can be useful in a volatile of products starting from plastic to medicine. Due to rising global energy needs there is further rise in the demand of the Petroleum refineries and petro chemical plants. This has shifted focus and increases investment on new refineries and petro chemical structures around the globe, therefore, the growth in demand for products of refinery and petrochemical filterage.

Today, there are more than seven hundred refineries in the world whose total refining capability is over hundred million barrels per day according to the Oil & Gas Journal. Most of these refineries are however located in the first world countries of United States, Europe and Japan. As earlier highlighted the developing world has little or no refining capacity, and majority rely on imported petroleum products as source of energy. ". For this reason, the investments into construction of new refineries in these countries are getting more and more colossal.

Restraint: Availability of low-cost and inferior-quality industrial filtration products

In the industrial air filtration market, one is able to see that industrial filters come in different price range based on the type of product, technology used, and the filter media used. Filter products have a manufacturing standard that is very helpful in the improvement of air and water that we breathe and use. Every end-use industry employs industrial filters in order to prevent unscheduled stoppage in operation, to protect an industry from the ’contamination effect’, to reduce maintenance expense, and to conserve resources in the environment. These factors contribute to high cost of Industrial filters. However, manufacturers are faced with various issues via the gray market which comes in terms of low quality imitations of genuine products or cheap overhaul services. What appears at first is particularly a very strong cost focus at time of purchase while there is room for local competitors to supply what appear to be cheaper to some of the same products offered by the MNEs in many emerging economies. Products that have poor filtration capacity may cause equipment failure that can culminate into a safety issue or have to be repaired after which the company incurs a lot of costs. Besides, the use of inferior filters will also convey a wrong image of the company and its products such as inefficiency and poor quality – this will always have a negative effect on the overall production process. Even the whole environment can be an area of concern when these products of inferior quality are used. When the contaminants are not effectively filtered they found a way of polluting and affecting natural resources thus having legal as well as financial repercussions.

Opportunities: Advancements in filter technologies

The development of filters as a technology has advanced but the technologies applied to filter service and monitoring have somewhat stagnated. Now, most filters are changed with reference to certain time intervals or by technicians’ naked eyes which can hardly be accurate; this is likely to create inefficiencies. Failure to change the filters as often as recommended will lead to increased costs, unrequired shutdowns and on the same note, failure to remove them once they are clogged will lead to narrowing down of the flow. There are several novelties that are currently being worked upon in terms of the filter monitoring to meet this challenge. In more general terms, probably, the most accurate approach is to periodically measure both pressure drop and flow rate across the filter. Together with this information it provides a better view of the state of the filter sometimes being compared to the dashboard of a car that shows information on the health of the engine. Best time for maintenance will be provided from this filter industry, as this will not allow early replacement of the component hence will enhance timely check if warranted. That may help to gain proper control of cost per service output and minimize time devoted to equipment downtimes for filtration systems to run at their best.

Challenges: Frequent replacement and disposal of industrial filters

There are many industrial filters used in industries to purify air and water but in turn produce much wastes that have to be continuously replaced and disposed of. It is possible to make a distinction between environmental, economical, and logistic issues in all these challenges.

Without any doubt, these issues have to be solved towards sustainable and proper industrial practice. It is of utmost significance that strategies that are in the pipeline, for instance, filter regeneration, recycling opportunities, or even prognostic maintenance through real-time data, so as to enhance the technology for extension of lifespans of filters to the environment and economic effects arisen from discreet filter replacement and maintenance.

Industrial Filtration Market Ecosystem

Leading companies in this market include well-established, financially secure producers of industrial filtration. These corporations have been long operating in the industrial filters market and have a differentiated product portfolio, modern manufacturing technologies, and robust sales and marketing networks. Major companies in this market Eaton (US), Danaher (US), Parker - Hannifin (US), 3M (US), Cummins (US).

Industrial Filtration Market Ecosystem

The chemicals & petrochemicals segment is expected to be the largest market by end user industry during the forecast period.

The industrial filtration market segment by end-users industry is food & beverage, chemicals & petrochemicals, power generation, oil & gas, pharmaceuticals, metals & mining, automotive and others. The industrial filtration business is clasified into chemicals and petrochemicals, which is anticipated to grow at the highest rate due to the fact that during the continuum of refining raw materials such as chemicals and hydrocarbons, the processes that make use of filtration in the finest manner includes procedures intended for separation of impurities, contaminants, and particulates. Such a strict selection is used in order to maintain high quality of products, compliance with the legislation requirements, and equipment preservation.

By filter media, the fiberglass segment is expected to be the second largest segment during the forecast period.

Based on filter media, this report divides the industrial filtration market into Activated Carbon/Charcoal, Fiberglass, Filter Paper, Metal, Nonwoven Fabric, and Others. Fiberglass which is comparatively lighter is well-known and used extensively in the food and beverages, chemicals, metals and mining, power generation and distribution, pulp and paper and electronics industries. It also fitted for high temperature applications to noble ends, for thermal protection. Some of the properties that have been attributed to the material include hardness, resistance to corrosion products, moderate tensile/compressive strength, and mechanical properties amongst others.

“North America”: The largest in the Industrial Filtration market.

North America is the largest region in the Industrial Filtration market and other regions include Europe Asia-Pacific Latin America Middle East and Africa. It appears that industries in the North America require a supply of products such as oil and gas, industrial water treatment, pharmaceuticals, process industries, manufacturing, and metals and mining. Besides that, there is a facility such as the Blue Plains Wastewater Treatment Facility in the region where industries benefit from the reclaimed water.

North American Industrial Filtration Market Size, and Share

Key Market Players

The industrial filtration market is dominated by a few major players that have a wide regional presence. The major players in the Industrial filtration industry are Eaton (US), Danaher (US), Parker - Hannifin (US), 3M (US), Cummins (US). Between 2020 and 2023, strategies such as product launches, contracts, agreements, partnerships, collaborations, alliances, acquisitions, and expansions are followed by these companies to capture a larger Industrial filtration market share.

Want to explore hidden markets that can drive new revenue in Industrial Filtration Market?

Scope of the Report

Report Metric

Details

Market size available for years

  • 2020–2029

Base year considered

  • 2023

Forecast period

  • 2024–2029

Forecast units

  • Value (USD)

Segments Covered

  • End user Industry, type, product, filter media, and region

Geographies covered

  • Asia Pacific, North America, Europe, Middle East & Africa, and South America

Companies covered

  • Danaher (US), Parker - Hannifin (US), EATON (Ireland), Donaldson (US), MANN + HUMMEL (Germany), Fleetlife (US), Alfa Laval (Sweden), Camfil (Sweden), HYDAC (Germany), Lenntech (Netherlands), W.L. Gore (US), Hengst (Germany), Sulphurnet (Netherlands), Sharplex (India), Cummins (US), EFC Filtration (Belgium), Forain Italia (Italy), DRM.DR Muller AG (Switzerland)

This research report categorizes the market by End user Industry, type, product, filter media, and region

On the basis of end user industry, the industrial filtration market has been segmented as follows:
  • Food & Beverage
  • Chemicals & Petrochemicals
  • Power Generation
  • Oil & Gas
  • Pharmaceuticals
  • Metals & Mining
  • Automotive
  • Other Industries
On the basis of type, the industrial filtration market has been segmented as follows:
  • Liquid
  • Air
On the basis of product, the industrial filtration market has been segmented as follows:
  • Filter Press
  • Bag Filter
  • Drum Filter
  • Depth Filter
  • Cartridge Filter
  • HEPA Filter
  • ULPA Filter
  • Electrostatic Precipitator
  • Other products
On the basis of filter media, the industrial filtration market has been segmented as follows:
  • Activated Carbon/ Charcoal
  • Fiberglass
  • Filter Paper
  • Metal
  • Nonwoven Fabric
  • Other filter media
On the basis of region, the industrial filtration market has been segmented as follows:
  • Asia Pacific
  • Europe
  • North America
  • Middle East & Africa
  • South America

Recent Developments

  • In August 2022, Eaton's Filtration Division has showcased filtration solutions for life sciences and industrial processing at ACHEMA 2022. Highlights include the new BECO CARBON depth filter sheets with integrated activated carbon and the Simplex 72X pipeline strainers, offering efficient filtration for various applications.
  • In March 2020, Danaher acquired the Biopharma business of GE’s Life Science division, now known as Cytiva. Cytiva is a leading provider of instruments, consumables, and software that support the research, discovery, process development, and manufacturing workflow of biopharmaceutical drugs.
  • In September 2023, Parker Hannifin's Industrial Gas Filtration division introduces BHA® replacement dust cartridges for Donaldson Downflo® Evolution (DFE) collectors. These cartridges promise both cost savings and improved air cleaning performance compared to the original DFE filters.
  • In December 2021, 3M and NEOGEN have entered into a definitive agreement under which 3M will separate its food safety business and simultaneously combine it with NEOGEN, this combination will create an innovative leader in the food safety sector with a comprehensive product range and a strategic focus on the category’s long-term growth opportunities.

Frequently Asked Questions (FAQ):

To speak to our analyst for a discussion on the above findings, click Speak to Analyst

Exclusive indicates content/data unique to MarketsandMarkets and not available with any competitors.

INTRODUCTION
29
RESEARCH METHODOLOGY
36
EXECUTIVE SUMMARY
52
PREMIUM INSIGHTS
57
MARKET OVERVIEW
61
  • 5.1 INTRODUCTION
  • 5.2 MARKET DYNAMICS
    DRIVERS
    - Increasing need to extend service life and improve performance of industrial machinery
    - Growing emphasis on maintaining compliance with emission regulations
    - Rising investment in refineries and petrochemical infrastructure development
    RESTRAINTS
    - Availability of low-cost industrial filtration products in gray markets
    OPPORTUNITIES
    - Increasing R&D to reduce industrial machine breakdowns
    - Rapid advancements in filter monitoring technologies
    CHALLENGES
    - Frequent replacement and disposal of industrial wastes
    - Difficulties in capturing microscopic contaminants
  • 5.3 TRENDS/DISRUPTIONS IMPACTING CUSTOMERS’ BUSINESSES
  • 5.4 PRICING ANALYSIS
    AVERAGE SELLING PRICE TREND, BY PRODUCT
    AVERAGE SELLING PRICE OF INDUSTRIAL FILTRATION PRODUCTS, BY REGION
  • 5.5 VALUE CHAIN ANALYSIS
    RAW MATERIAL PROVIDERS/COMPONENT MANUFACTURERS/SUPPLIERS
    INDUSTRIAL FILTRATION MANUFACTURERS/ASSEMBLERS
    DISTRIBUTORS/RESELLERS
    END USERS
    MAINTENANCE SERVICE PROVIDERS
  • 5.6 ECOSYSTEM ANALYSIS
  • 5.7 INVESTMENT AND FUNDING SCENARIO
  • 5.8 TECHNOLOGY ANALYSIS
    KEY TECHNOLOGY
    - Filter media technology
    COMPLEMENTARY TECHNOLOGY
    - Internet of Things (IoT)
  • 5.9 PATENT ANALYSIS
  • 5.10 TRADE ANALYSIS
    EXPORT SCENARIO
    IMPORT SCENARIO
  • 5.11 KEY CONFERENCES AND EVENTS, 2024–2025
  • 5.12 TARIFFS, REGULATORY LANDSCAPE, AND STANDARDS
    TARIFF RELATED TO INDUSTRIAL FILTRATION PRODUCTS
    REGULATORY BODIES, GOVERNMENT AGENCIES, AND OTHER ORGANIZATIONS
    CODES AND REGULATIONS RELATED TO INDUSTRIAL FILTRATION PRODUCTS
  • 5.13 PORTER’S FIVE FORCES ANALYSIS
    THREAT OF NEW ENTRANTS
    BARGAINING POWER OF SUPPLIERS
    BARGAINING POWER OF BUYERS
    THREAT OF SUBSTITUTES
    INTENSITY OF COMPETITIVE RIVALRY
  • 5.14 CASE STUDY ANALYSIS
    JONELL SYSTEMS DEVELOPS INDUSTRIAL FILTRATION SOLUTIONS TO ADDRESS SEMI-SOLID CLOGGING ISSUES IN EUROPEAN REFINERY
    CAMFIL SIGNS AGREEMENT WITH BORGESIUS BAKERY TO SUPPLY PROSAFE AIR FILTERS TO ENSURE PROCESS SAFETY
    FILTRATION GROUP DEVELOPS INDUSTRIAL FILTER CARTRIDGES TO REMOVE FOOD CONTAMINANTS
  • 5.15 KEY STAKEHOLDERS AND BUYING CRITERIA
    KEY STAKEHOLDERS IN BUYING PROCESS
    BUYING CRITERIA
INDUSTRIAL FILTRATION MARKET, BY TYPE
98
  • 6.1 INTRODUCTION
  • 6.2 LIQUID
    INCREASING USE OF STERILE LIQUIDS IN PRODUCT FORMULATION AND BIOLOGICAL PROCESSES IN PHARMACEUTICALS INDUSTRY TO DRIVE MARKET
    - By technology
  • 6.3 AIR
    GROWING EMPHASIS ON MAINTAINING HYGIENIC ENVIRONMENT AT WORKPLACES TO FUEL MARKET GROWTH
    - By technology
INDUSTRIAL FILTRATION MARKET, BY PRODUCT
111
  • 7.1 INTRODUCTION
  • 7.2 FILTER PRESS
    FOCUS ON CONSISTENT PRODUCT QUALITY TO DRIVE MARKET
  • 7.3 BAG FILTER
    CAPABILITY TO HANDLE LARGE VOLUMES OF CONTAMINANTS TO BOOST SEGMENTAL GROWTH
  • 7.4 DRUM FILTER
    ABILITY TO PROCESS LARGE VOLUMES OF LIQUID STREAMS EFFICIENTLY AND UNINTERRUPTEDLY TO PROPEL MARKET GROWTH
  • 7.5 DEPTH FILTER
    NEED TO CAPTURE PARTICLES OF VARIOUS SIZES DURING FILTRATION TO BOOST DEMAND
  • 7.6 CARTRIDGE FILTER
    QUICK AND EASY INSTALLATION AND REPLACEMENT TO FOSTER SEGMENTAL GROWTH
  • 7.7 HEPA FILTER
    NEED TO MAINTAIN HEALTHY AND CLEAN INDOOR ENVIRONMENT TO BOOST DEMAND
  • 7.8 ULPA FILTER
    STRINGENT REGULATORY REQUIREMENTS FOR CLEANLINESS AND PARTICULATE CONTROL TO BOOST DEMAND
  • 7.9 ELECTROSTATIC PRECIPITATOR
    POWER GENERATION, CEMENT PRODUCTION, METALLURGY, PULP AND PAPER MANUFACTURING APPLICATIONS TO CONTRIBUTE MOST TO HIGH DEMAND
  • 7.10 OTHER PRODUCTS
INDUSTRIAL FILTRATION MARKET, BY FILTER MEDIA
123
  • 8.1 INTRODUCTION
  • 8.2 ACTIVATED CARBON/CHARCOAL
    HIGH POROSITY AND LARGE SURFACE AREA TO BOOST DEMAND
  • 8.3 FIBERGLASS
    HIGH STRENGTH, EFFICIENCY, AND CORROSION RESISTANCE TO DRIVE MARKET
  • 8.4 FILTER PAPER
    COST-EFFECTIVENESS, BIODEGRADABILITY, AND HIGH FILTRATION EFFICIENCY TO INCREASE DEMAND
  • 8.5 METAL
    REUSABILITY AND HIGH PARTICULATE MATTER CAPTURING ABILITY TO INCREASE ADOPTION
  • 8.6 NONWOVEN FABRIC
    HIGH ABSORBENCY, DURABILITY, AND ELASTICITY FEATURES TO BOOST DEMAND
  • 8.7 OTHER FILTER MEDIA
INDUSTRIAL FILTRATION MARKET, BY INDUSTRY
132
  • 9.1 INTRODUCTION
  • 9.2 FOOD & BEVERAGES
    STRONG FOCUS OF FOOD PROCESSING PLANTS ON MAINTAINING PRODUCT QUALITY, SAFETY, AND SHELF LIFE TO DRIVE MARKET
  • 9.3 CHEMICALS & PETROCHEMICALS
    STRINGENT REGULATORY REQUIREMENTS FOR PURITY, CONSISTENCY, AND SAFETY OF CHEMICAL AND PETROCHEMICAL PRODUCTS TO BOOST DEMAND
  • 9.4 OIL & GAS
    SURGING NEED TO MAXIMIZE CONTAMINANT REMOVAL AND MINIMIZE MAINTENANCE DOWNTIME TO STIMULATE MARKET GROWTH
  • 9.5 PHARMACEUTICALS
    RISING DEMAND FOR REMOVAL OF SUSPENDED PARTICLES AND BACTERIA FROM WATER AND AIR TO DRIVE MARKET
  • 9.6 METALS & MINING
    NEED TO IMPROVE PROCESS WATER QUALITY AND MAKE IT SUITABLE FOR REUSE TO BOOST DEMAND
  • 9.7 AUTOMOTIVE
    ENVIRONMENTAL SUSTAINABILITY INITIATIVES AND INTENSE FOCUS ON HIGH PRODUCT QUALITY TO CONTRIBUTE TO MARKET GROWTH
  • 9.8 POWER GENERATION
    NEED TO MAINTAIN SUPERIOR PERFORMANCE OF POWER EQUIPMENT TO BOOST DEMAND
  • 9.9 OTHER INDUSTRIES
INDUSTRIAL FILTRATION MARKET, BY REGION
143
  • 10.1 INTRODUCTION
  • 10.2 NORTH AMERICA
    RECESSION IMPACT: NORTH AMERICA
    BY TYPE
    - By technology
    BY PRODUCT
    BY FILTER MEDIA
    BY INDUSTRY
    BY COUNTRY
    - US
    - Canada
    - Mexico
  • 10.3 EUROPE
    RECESSION IMPACT: EUROPE
    BY TYPE
    - By technology
    BY PRODUCT
    BY FILTER MEDIA
    BY INDUSTRY
    BY COUNTRY
    - Germany
    - UK
    - France
    - Italy
    - Russia
    - Rest of Europe
  • 10.4 ASIA PACIFIC
    RECESSION IMPACT: ASIA PACIFIC
    BY TYPE
    - By technology
    BY PRODUCT
    BY FILTER MEDIA
    BY INDUSTRY
    BY COUNTRY
    - China
    - India
    - Japan
    - Australia
    - South Korea
    - Rest of Asia Pacific
  • 10.5 MIDDLE EAST & AFRICA
    RECESSION IMPACT: MIDDLE EAST & AFRICA
    BY TYPE
    - By technology
    BY PRODUCT
    BY FILTER MEDIA
    BY INDUSTRY
    BY COUNTRY
    - GCC countries
    - South Africa
    - Rest of Middle East & Africa
  • 10.6 SOUTH AMERICA
    RECESSION IMPACT: SOUTH AMERICA
    BY TYPE
    - By technology
    BY PRODUCT
    BY FILTER MEDIA
    BY INDUSTRY
    BY COUNTRY
    - Brazil
    - Argentina
    - Rest of South America
COMPETITIVE LANDSCAPE
209
  • 11.1 INTRODUCTION
  • 11.2 OVERVIEW OF STRATEGIES ADOPTED BY KEY PLAYERS, 2021–2023
  • 11.3 MARKET SHARE ANALYSIS, 2023
    DANAHER CORPORATION
    PARKER HANNIFIN CORP
    3M
    CUMMINS INC.
    EATON
  • 11.4 COMPANY EVALUATION MATRIX: KEY PLAYERS, 2023
    STARS
    EMERGING LEADERS
    PERVASIVE PLAYERS
    PARTICIPANTS
  • 11.5 COMPANY FOOTPRINT: KEY PLAYERS, 2023
    TYPE FOOTPRINT
    REGION FOOTPRINT
    PRODUCT FOOTPRINT
    FILTER MEDIA FOOTPRINT
    INDUSTRY FOOTPRINT
    OVERALL COMPANY FOOTPRINT
  • 11.6 COMPANY EVALUATION MATRIX: START-UPS/SMES, 2023
    PROGRESSIVE COMPANIES
    RESPONSIVE COMPANIES
    DYNAMIC COMPANIES
    STARTING BLOCKS
  • 11.7 COMPETITIVE BENCHMARKING: START-UPS/SMES
    LIST OF KEY START-UPS/SMES
    COMPETITIVE BENCHMARKING OF KEY START-UPS/SMES
  • 11.8 COMPETITIVE SCENARIOS AND TRENDS
    PRODUCT LAUNCHES
    EXPANSIONS
  • 11.9 COMPANY VALUATION AND FINANCIAL METRICS
  • 11.10 BRAND/PRODUCT COMPARATIVE ANALYSIS
COMPANY PROFILES
229
  • 12.1 KEY PLAYERS
    ALFA LAVAL
    - Business overview
    - Products/Solutions/Services offered
    - Recent developments
    - MnM view
    CAMFIL
    - Business overview
    - Products/Solutions/Services offered
    - Recent developments
    - MnM view
    DONALDSON COMPANY, INC.
    - Business overview
    - Products/Solutions/Services offered
    - Recent developments
    - MnM view
    PARKER HANNIFIN CORP
    - Business overview
    - Products/Solutions/Services offered
    - Recent developments
    - MnM view
    CUMMINS INC.
    - Business overview
    - Products/Solutions/Services offered
    - Recent developments
    - MnM view
    EATON
    - Business overview
    - Products/Solutions/Services offered
    - Recent developments
    - MnM view
    FILTRATION GROUP
    - Business overview
    - Products/Solutions/Services offered
    - Recent developments
    - MnM view
    FREUDENBERG GROUP
    - Business overview
    - Products/Solutions/Services offered
    - Recent developments
    - MnM view
    MANN+HUMMEL
    - Business overview
    - Products/Solutions/Services offered
    - Recent developments
    - MnM view
    DANAHER CORPORATION
    - Business overview
    - Products/Solutions/Services offered
    - Recent developments
    - MnM view
    3M
    - Business overview
    - Products/Solutions/Services offered
    - Recent developments
    - MnM view
    BABCOCK & WILCOX
    - Business overview
    - Products/Solutions/Services offered
    - Recent developments
    W.L. GORE
    - Business overview
    - Products/Solutions/Services offered
    - Recent developments
    LENNTECH B.V.
    - Business overview
    - Products/Solutions/Services offered
    HENGST SE
    - Business overview
    - Products/Solutions/Services offered
    - Recent developments
    FLEETLIFE INC.
    - Business overview
    - Products/Solutions/Services offered
    - Recent developments
  • 12.2 OTHER PLAYERS
    FORAIN ITALIA
    EFC FILTRATION B.V.
    HYDAC
    DRM, DR. MUELLER AG
    SHARPLEX FILTERS (INDIA) PVT. LTD.
    SULPHERNET
    PEARL FILTRATION
    SAIFILTER
    ANAND FILTERS
APPENDIX
285
  • 13.1 INSIGHTS FROM INDUSTRY EXPERTS
  • 13.2 DISCUSSION GUIDE
  • 13.3 KNOWLEDGESTORE: MARKETSANDMARKETS’ SUBSCRIPTION PORTAL
  • 13.4 CUSTOMIZATION OPTIONS
  • 13.5 RELATED REPORTS
  • 13.6 AUTHOR DETAILS
LIST OF TABLES
 
  • TABLE 1 INDUSTRIAL FILTRATION MARKET: INDUSTRY-/COUNTRY-WISE ANALYSIS
  • TABLE 2 INDUSTRIAL FILTRATION MARKET SNAPSHOT
  • TABLE 3 ENVIRONMENTAL PROTECTION ACTS AND LAWS
  • TABLE 4 LIST OF REFINERY AND PETROCHEMICAL INFRASTRUCTURE PROJECTS
  • TABLE 5 AVERAGE SELLING PRICE TREND, BY PRODUCT, 2021–2023 (USD/UNIT)
  • TABLE 6 AVERAGE SELLING PRICE OF INDUSTRIAL FILTRATION PRODUCTS, BY REGION, 2021–2023 (USD/UNIT)
  • TABLE 7 ROLE OF COMPANIES IN INDUSTRIAL FILTRATION ECOSYSTEM
  • TABLE 8 EATON: FUNDING DETAILS
  • TABLE 9 CUMMINS: FUNDING DETAILS
  • TABLE 10 ZWITTERCO: FUNDING DETAILS
  • TABLE 11 MARKET: LIST OF MAJOR PATENTS, 2020–2021
  • TABLE 12 EXPORT DATA FOR HS CODE 842199-COMPLIANT PRODUCTS, BY COUNTRY, 2020–2022 (USD THOUSAND)
  • TABLE 13 IMPORT SCENARIO FOR HS CODE 842199-COMPLIANT PRODUCTS, BY COUNTRY, 2020–2022 (USD THOUSAND)
  • TABLE 14 MARKET: LIST OF CONFERENCES AND EVENTS, 2024–2025
  • TABLE 15 MARKET: AVERAGE TARIFF, 2022
  • TABLE 16 NORTH AMERICA: LIST OF REGULATORY BODIES, GOVERNMENT AGENCIES, AND OTHER ORGANIZATIONS
  • TABLE 17 EUROPE: LIST OF REGULATORY BODIES, GOVERNMENT AGENCIES, AND OTHER ORGANIZATIONS
  • TABLE 18 ASIA PACIFIC: LIST OF REGULATORY BODIES, GOVERNMENT AGENCIES, AND OTHER ORGANIZATIONS
  • TABLE 19 SOUTH AMERICA: REGULATORY BODIES, GOVERNMENT AGENCIES, AND OTHER ORGANIZATIONS
  • TABLE 20 MIDDLE EAST & AFRICA: REGULATORY BODIES, GOVERNMENT AGENCIES, AND OTHER ORGANIZATIONS
  • TABLE 21 GLOBAL: LIST OF REGULATORY BODIES, GOVERNMENT AGENCIES, AND OTHER ORGANIZATIONS
  • TABLE 22 NORTH AMERICA: CODES AND REGULATIONS
  • TABLE 23 ASIA PACIFIC: CODES AND REGULATIONS
  • TABLE 24 GLOBAL: CODES AND REGULATIONS
  • TABLE 25 INDUSTRIAL FILTRATION MARKET: PORTER’S FIVE FORCES ANALYSIS
  • TABLE 26 INFLUENCE OF STAKEHOLDERS ON BUYING PROCESS FOR TOP THREE INDUSTRIES
  • TABLE 27 KEY BUYING CRITERIA FOR TOP THREE INDUSTRIES
  • TABLE 28 MARKET, BY TYPE, 2020–2022 (USD MILLION)
  • TABLE 29 INDUSTRIAL FILTRATION MARKET, BY TYPE, 2023–2029 (USD MILLION)
  • TABLE 30 LIQUID: MARKET, BY REGION, 2020–2022 (USD MILLION)
  • TABLE 31 LIQUID: MARKET, BY REGION, 2023–2029 (USD MILLION)
  • TABLE 32 LIQUID: MARKET, BY TECHNOLOGY, 2020–2022 (USD MILLION)
  • TABLE 33 LIQUID: MARKET, BY TECHNOLOGY, 2023–2029 (USD MILLION)
  • TABLE 34 PRESSURE FILTRATION: INDUSTRIAL LIQUID FILTRATION MARKET, BY REGION, 2020–2022 (USD MILLION)
  • TABLE 35 PRESSURE FILTRATION: INDUSTRIAL LIQUID FILTRATION MARKET, BY REGION, 2023–2029 (USD MILLION)
  • TABLE 36 CENTRIFUGAL FILTRATION: INDUSTRIAL LIQUID FILTRATION MARKET, BY REGION, 2020–2022 (USD MILLION)
  • TABLE 37 CENTRIFUGAL FILTRATION: INDUSTRIAL LIQUID FILTRATION MARKET, BY REGION, 2023–2029 (USD MILLION)
  • TABLE 38 GRAVITY FILTRATION: INDUSTRIAL LIQUID FILTRATION MARKET, BY REGION, 2020–2022 (USD MILLION)
  • TABLE 39 GRAVITY FILTRATION: INDUSTRIAL LIQUID FILTRATION MARKET, BY REGION, 2023–2029 (USD MILLION)
  • TABLE 40 VACUUM FILTRATION: INDUSTRIAL LIQUID FILTRATION MARKET, BY REGION, 2020–2022 (USD MILLION)
  • TABLE 41 VACUUM FILTRATION: INDUSTRIAL LIQUID FILTRATION MARKET, BY REGION, 2023–2029 (USD MILLION)
  • TABLE 42 OTHER TECHNOLOGIES: INDUSTRIAL LIQUID FILTRATION MARKET, BY REGION, 2020–2022 (USD MILLION)
  • TABLE 43 OTHER TECHNOLOGIES: INDUSTRIAL LIQUID FILTRATION MARKET, BY REGION, 2023–2029 (USD MILLION)
  • TABLE 44 AIR: FILTRATION MARKET, BY REGION, 2020–2022 (USD MILLION)
  • TABLE 45 AIR: FILTRATION MARKET, BY REGION, 2023–2029 (USD MILLION)
  • TABLE 46 AIR: FILTRATION MARKET, BY TECHNOLOGY, 2020–2022 (USD MILLION)
  • TABLE 47 AIR: FILTRATION MARKET, BY TECHNOLOGY, 2023–2029 (USD MILLION)
  • TABLE 48 MECHANICAL: INDUSTRIAL AIR FILTRATION MARKET, BY REGION, 2020–2022 (USD MILLION)
  • TABLE 49 MECHANICAL: INDUSTRIAL AIR FILTRATION MARKET, BY REGION, 2023–2029 (USD MILLION)
  • TABLE 50 ELECTRONIC: INDUSTRIAL AIR FILTRATION MARKET, BY REGION, 2020–2022 (USD MILLION)
  • TABLE 51 ELECTRONIC: INDUSTRIAL AIR FILTRATION MARKET, BY REGION, 2023–2029 (USD MILLION)
  • TABLE 52 GAS-PHASE: INDUSTRIAL AIR FILTRATION MARKET, BY REGION, 2020–2022 (USD MILLION)
  • TABLE 53 GAS-PHASE: INDUSTRIAL AIR FILTRATION MARKET, BY REGION, 2023–2029 (USD MILLION)
  • TABLE 54 MARKET, BY PRODUCT, 2020–2022 (USD MILLION)
  • TABLE 55 INDUSTRIAL FILTRATION MARKET, BY PRODUCT, 2023–2029 (USD MILLION)
  • TABLE 56 FILTER PRESS: MARKET, BY REGION, 2020–2022 (USD MILLION)
  • TABLE 57 FILTER PRESS: MARKET, BY REGION, 2023–2029 (USD MILLION)
  • TABLE 58 BAG FILTER: MARKET, BY REGION, 2020–2022 (USD MILLION)
  • TABLE 59 BAG FILTER: MARKET, BY REGION, 2023–2029 (USD MILLION)
  • TABLE 60 DRUM FILTER: MARKET, BY REGION, 2020–2022 (USD MILLION)
  • TABLE 61 DRUM FILTER: MARKET, BY REGION, 2023–2029 (USD MILLION)
  • TABLE 62 DEPTH FILTER: MARKET, BY REGION, 2020–2022 (USD MILLION)
  • TABLE 63 DEPTH FILTER: MARKET, BY REGION, 2023–2029 (USD MILLION)
  • TABLE 64 CARTRIDGE FILTER: MARKET, BY REGION, 2020–2022 (USD MILLION)
  • TABLE 65 CARTRIDGE FILTER: MARKET, BY REGION, 2023–2029 (USD MILLION)
  • TABLE 66 HEPA FILTER: MARKET, BY REGION, 2020–2022 (USD MILLION)
  • TABLE 67 HEPA FILTER: MARKET, BY REGION, 2023–2029 (USD MILLION)
  • TABLE 68 ULPA FILTER: MARKET, BY REGION, 2020–2022 (USD MILLION)
  • TABLE 69 ULPA FILTER: MARKET, BY REGION, 2023–2029 (USD MILLION)
  • TABLE 70 ELECTROSTATIC PRECIPITATOR: MARKET, BY REGION, 2020–2022 (USD MILLION)
  • TABLE 71 ELECTROSTATIC PRECIPITATOR: MARKET, BY REGION, 2023–2029 (USD MILLION)
  • TABLE 72 OTHER PRODUCTS: MARKET, BY REGION, 2020–2022 (USD MILLION)
  • TABLE 73 OTHER PRODUCTS: MARKET, BY REGION, 2023–2029 (USD MILLION)
  • TABLE 74 MARKET, BY FILTER MEDIA, 2020–2022 (USD MILLION)
  • TABLE 75 INDUSTRIAL FILTRATION MARKET, BY FILTER MEDIA, 2023–2029 (USD MILLION)
  • TABLE 76 ACTIVATED CARBON/CHARCOAL: MARKET, BY REGION, 2020–2022 (USD MILLION)
  • TABLE 77 ACTIVATED CARBON/CHARCOAL: MARKET, BY REGION, 2023–2029 (USD MILLION)
  • TABLE 78 FIBERGLASS: MARKET, BY REGION, 2020–2022 (USD MILLION)
  • TABLE 79 FIBERGLASS: MARKET, BY REGION, 2023–2029 (USD MILLION)
  • TABLE 80 FILTER PAPER: MARKET, BY REGION, 2020–2022 (USD MILLION)
  • TABLE 81 FILTER PAPER: MARKET, BY REGION, 2023–2029 (USD MILLION)
  • TABLE 82 METAL: MARKET, BY REGION, 2020–2022 (USD MILLION)
  • TABLE 83 METAL: MARKET, BY REGION, 2023–2029 (USD MILLION)
  • TABLE 84 NONWOVEN FABRIC: MARKET, BY REGION, 2020–2022 (USD MILLION)
  • TABLE 85 NONWOVEN FABRIC: MARKET, BY REGION, 2023–2029 (USD MILLION)
  • TABLE 86 OTHER FILTER MEDIA: MARKET, BY REGION, 2020–2022 (USD MILLION)
  • TABLE 87 OTHER FILTER MEDIA: MARKET, BY REGION, 2023–2029 (USD MILLION)
  • TABLE 88 MARKET, BY INDUSTRY, 2020–2022 (USD MILLION)
  • TABLE 89 INDUSTRIAL FILTRATION MARKET, BY INDUSTRY, 2023–2029 (USD MILLION)
  • TABLE 90 FOOD & BEVERAGES: MARKET, BY REGION, 2020–2022 (USD MILLION)
  • TABLE 91 FOOD & BEVERAGES: MARKET, BY REGION, 2023–2029 (USD MILLION)
  • TABLE 92 CHEMICALS & PETROCHEMICALS: MARKET, BY REGION, 2020–2022 (USD MILLION)
  • TABLE 93 CHEMICALS & PETROCHEMICALS: MARKET, BY REGION, 2023–2029 (USD MILLION)
  • TABLE 94 OIL & GAS: MARKET, BY REGION, 2020–2022 (USD MILLION)
  • TABLE 95 OIL & GAS: MARKET, BY REGION, 2023–2029 (USD MILLION)
  • TABLE 96 PHARMACEUTICALS: MARKET, BY REGION, 2020–2022 (USD MILLION)
  • TABLE 97 PHARMACEUTICALS: MARKET, BY REGION, 2023–2029 (USD MILLION)
  • TABLE 98 METALS & MINING: MARKET, BY REGION, 2020–2022 (USD MILLION)
  • TABLE 99 METALS & MINING: MARKET, BY REGION, 2023–2029 (USD MILLION)
  • TABLE 100 AUTOMOTIVE: MARKET, BY REGION, 2020–2022 (USD MILLION)
  • TABLE 101 AUTOMOTIVE: MARKET, BY REGION, 2023–2029 (USD MILLION)
  • TABLE 102 POWER GENERATION: MARKET, BY REGION, 2020–2022 (USD MILLION)
  • TABLE 103 POWER GENERATION: MARKET, BY REGION, 2023–2029 (USD MILLION)
  • TABLE 104 OTHER INDUSTRIES: MARKET, BY REGION, 2020–2022 (USD MILLION)
  • TABLE 105 OTHER INDUSTRIES: MARKET, BY REGION, 2023–2029 (USD MILLION)
  • TABLE 106 MARKET, BY REGION, 2020–2022 (USD MILLION)
  • TABLE 107 INDUSTRIAL FILTRATION MARKET, BY REGION, 2023–2029 (USD MILLION)
  • TABLE 108 MARKET, BY REGION, 2020–2022 (THOUSAND UNITS)
  • TABLE 109 MARKET, BY REGION, 2023–2029 (THOUSAND UNITS)
  • TABLE 110 NORTH AMERICA: INDUSTRIAL FILTRATION MARKET, BY TYPE, 2020–2022 (USD MILLION)
  • TABLE 111 NORTH AMERICA: MARKET, BY TYPE, 2023–2029 (USD MILLION)
  • TABLE 112 NORTH AMERICA: INDUSTRIAL LIQUID FILTRATION MARKET, BY TECHNOLOGY, 2020–2022 (USD MILLION)
  • TABLE 113 NORTH AMERICA: INDUSTRIAL LIQUID FILTRATION MARKET, BY TECHNOLOGY, 2023–2029 (USD MILLION)
  • TABLE 114 NORTH AMERICA: INDUSTRIAL AIR FILTRATION MARKET, BY TECHNOLOGY, 2020–2022 (USD MILLION)
  • TABLE 115 NORTH AMERICA: INDUSTRIAL AIR FILTRATION MARKET, BY TECHNOLOGY, 2023–2029 (USD MILLION)
  • TABLE 116 NORTH AMERICA: INDUSTRIAL AIR FILTRATION MARKET, BY PRODUCT, 2020–2022 (USD MILLION)
  • TABLE 117 NORTH AMERICA: INDUSTRIAL AIR FILTRATION MARKET, BY PRODUCT, 2023–2029 (USD MILLION)
  • TABLE 118 NORTH AMERICA: MARKET, BY FILTER MEDIA, 2020–2022 (USD MILLION)
  • TABLE 119 NORTH AMERICA: MARKET, BY FILTER MEDIA, 2023–2029 (USD MILLION)
  • TABLE 120 NORTH AMERICA: MARKET, BY INDUSTRY, 2020–2022 (USD MILLION)
  • TABLE 121 NORTH AMERICA: MARKET, BY INDUSTRY, 2023–2029 (USD MILLION)
  • TABLE 122 NORTH AMERICA: MARKET, BY COUNTRY, 2020–2022 (USD MILLION)
  • TABLE 123 NORTH AMERICA: MARKET, BY COUNTRY, 2023–2029 (USD MILLION)
  • TABLE 124 US: INDUSTRIAL FILTRATION MARKET, BY INDUSTRY, 2020–2022 (USD MILLION)
  • TABLE 125 US: MARKET, BY INDUSTRY, 2023–2029 (USD MILLION)
  • TABLE 126 CANADA: MARKET, BY INDUSTRY, 2020–2022 (USD MILLION)
  • TABLE 127 CANADA: MARKET, BY INDUSTRY, 2023–2029 (USD MILLION)
  • TABLE 128 MEXICO: MARKET, BY INDUSTRY, 2020–2022 (USD MILLION)
  • TABLE 129 MEXICO: MARKET, BY INDUSTRY, 2023–2029 (USD MILLION)
  • TABLE 130 EUROPE: INDUSTRIAL FILTRATION MARKET, BY TYPE, 2020–2022 (USD MILLION)
  • TABLE 131 EUROPE: MARKET, BY TYPE, 2023–2029 (USD MILLION)
  • TABLE 132 EUROPE: INDUSTRIAL LIQUID FILTRATION MARKET, BY TECHNOLOGY, 2020–2022 (USD MILLION)
  • TABLE 133 EUROPE: INDUSTRIAL LIQUID FILTRATION MARKET, BY TECHNOLOGY, 2023–2029 (USD MILLION)
  • TABLE 134 EUROPE: INDUSTRIAL AIR FILTRATION MARKET, BY TECHNOLOGY, 2020–2022 (USD MILLION)
  • TABLE 135 EUROPE: INDUSTRIAL AIR FILTRATION MARKET, BY TECHNOLOGY, 2023–2029 (USD MILLION)
  • TABLE 136 EUROPE: INDUSTRIAL AIR FILTRATION MARKET, BY PRODUCT, 2020–2022 (USD MILLION)
  • TABLE 137 EUROPE: INDUSTRIAL AIR FILTRATION MARKET, BY PRODUCT, 2023–2029 (USD MILLION)
  • TABLE 138 EUROPE: MARKET, BY FILTER MEDIA, 2020–2022 (USD MILLION)
  • TABLE 139 EUROPE: MARKET, BY FILTER MEDIA, 2023–2029 (USD MILLION)
  • TABLE 140 EUROPE: MARKET, BY INDUSTRY, 2020–2022 (USD MILLION)
  • TABLE 141 EUROPE: MARKET, BY INDUSTRY, 2023–2029 (USD MILLION)
  • TABLE 142 EUROPE: MARKET, BY COUNTRY, 2020–2022 (USD MILLION)
  • TABLE 143 EUROPE: MARKET, BY COUNTRY, 2023–2029 (USD MILLION)
  • TABLE 144 GERMANY: MARKET, BY INDUSTRY, 2020–2022 (USD MILLION)
  • TABLE 145 GERMANY: MARKET, BY INDUSTRY, 2023–2029 (USD MILLION)
  • TABLE 146 UK: INDUSTRIAL FILTRATION MARKET, BY INDUSTRY, 2020–2022 (USD MILLION)
  • TABLE 147 UK: MARKET, BY INDUSTRY, 2023–2029 (USD MILLION)
  • TABLE 148 FRANCE: MARKET, BY INDUSTRY, 2020–2022 (USD MILLION)
  • TABLE 149 FRANCE: MARKET, BY INDUSTRY, 2023–2029 (USD MILLION)
  • TABLE 150 ITALY: MARKET, BY INDUSTRY, 2020–2022 (USD MILLION)
  • TABLE 151 ITALY: MARKET, BY INDUSTRY, 2023–2029 (USD MILLION)
  • TABLE 152 RUSSIA: MARKET, BY INDUSTRY, 2020–2022 (USD MILLION)
  • TABLE 153 RUSSIA: MARKET, BY INDUSTRY, 2023–2029 (USD MILLION)
  • TABLE 154 REST OF EUROPE: MARKET, BY INDUSTRY, 2020–2022 (USD MILLION)
  • TABLE 155 REST OF EUROPE: MARKET, BY INDUSTRY, 2023–2029 (USD MILLION)
  • TABLE 156 ASIA PACIFIC: INDUSTRIAL FILTRATION MARKET, BY TYPE, 2020–2022 (USD MILLION)
  • TABLE 157 ASIA PACIFIC: MARKET, BY TYPE, 2023–2029 (USD MILLION)
  • TABLE 158 ASIA PACIFIC: INDUSTRIAL LIQUID FILTRATION MARKET, BY TECHNOLOGY, 2020–2022 (USD MILLION)
  • TABLE 159 ASIA PACIFIC: INDUSTRIAL LIQUID FILTRATION MARKET, BY TECHNOLOGY, 2023–2029 (USD MILLION)
  • TABLE 160 ASIA PACIFIC: INDUSTRIAL AIR FILTRATION MARKET, BY TECHNOLOGY, 2020–2022 (USD MILLION)
  • TABLE 161 ASIA PACIFIC: INDUSTRIAL AIR FILTRATION MARKET, BY TECHNOLOGY, 2023–2029 (USD MILLION)
  • TABLE 162 ASIA PACIFIC: INDUSTRIAL AIR FILTRATION MARKET, BY PRODUCT, 2020–2022 (USD MILLION)
  • TABLE 163 ASIA PACIFIC: INDUSTRIAL AIR FILTRATION MARKET, BY PRODUCT, 2023–2029 (USD MILLION)
  • TABLE 164 ASIA PACIFIC: MARKET, BY FILTER MEDIA, 2020–2022 (USD MILLION)
  • TABLE 165 ASIA PACIFIC: MARKET, BY FILTER MEDIA, 2023–2029 (USD MILLION)
  • TABLE 166 ASIA PACIFIC: MARKET, BY INDUSTRY, 2020–2022 (USD MILLION)
  • TABLE 167 ASIA PACIFIC: MARKET, BY INDUSTRY, 2023–2029 (USD MILLION)
  • TABLE 168 ASIA PACIFIC: MARKET, BY COUNTRY, 2020–2022 (USD MILLION)
  • TABLE 169 ASIA PACIFIC: MARKET, BY COUNTRY, 2023–2029 (USD MILLION)
  • TABLE 170 CHINA: MARKET, BY INDUSTRY, 2020–2022 (USD MILLION)
  • TABLE 171 CHINA: MARKET, BY INDUSTRY, 2023–2029 (USD MILLION)
  • TABLE 172 INDIA: MARKET, BY INDUSTRY, 2020–2022 (USD MILLION)
  • TABLE 173 INDIA: MARKET, BY INDUSTRY, 2023–2029 (USD MILLION)
  • TABLE 174 JAPAN: MARKET, BY INDUSTRY, 2020–2022 (USD MILLION)
  • TABLE 175 JAPAN: MARKET, BY INDUSTRY, 2023–2029 (USD MILLION)
  • TABLE 176 AUSTRALIA: MARKET, BY INDUSTRY, 2020–2022 (USD MILLION)
  • TABLE 177 AUSTRALIA: MARKET, BY INDUSTRY, 2023–2029 (USD MILLION)
  • TABLE 178 SOUTH KOREA: INDUSTRIAL FILTRATION MARKET, BY INDUSTRY, 2020–2022 (USD MILLION)
  • TABLE 179 SOUTH KOREA: MARKET, BY INDUSTRY, 2023–2029 (USD MILLION)
  • TABLE 180 REST OF ASIA PACIFIC: MARKET, BY INDUSTRY, 2020–2022 (USD MILLION)
  • TABLE 181 REST OF ASIA PACIFIC: MARKET, BY INDUSTRY, 2023–2029 (USD MILLION)
  • TABLE 182 MIDDLE EAST & AFRICA: MARKET, BY TYPE, 2020–2022 (USD MILLION)
  • TABLE 183 MIDDLE EAST & AFRICA: INDUSTRIAL FILTRATION MARKET, BY TYPE, 2023–2029 (USD MILLION)
  • TABLE 184 MIDDLE EAST & AFRICA: INDUSTRIAL LIQUID FILTRATION MARKET, BY TECHNOLOGY, 2020–2022 (USD MILLION)
  • TABLE 185 MIDDLE EAST & AFRICA: INDUSTRIAL LIQUID FILTRATION MARKET, BY TECHNOLOGY, 2023–2029 (USD MILLION)
  • TABLE 186 MIDDLE EAST & AFRICA: INDUSTRIAL AIR FILTRATION MARKET, BY TECHNOLOGY, 2020–2022 (USD MILLION)
  • TABLE 187 MIDDLE EAST & AFRICA: INDUSTRIAL AIR FILTRATION MARKET, BY TECHNOLOGY, 2023–2029 (USD MILLION)
  • TABLE 188 MIDDLE EAST & AFRICA: INDUSTRIAL AIR FILTRATION MARKET, BY PRODUCT, 2020–2022 (USD MILLION)
  • TABLE 189 MIDDLE EAST & AFRICA: INDUSTRIAL AIR FILTRATION MARKET, BY PRODUCT, 2023–2029 (USD MILLION)
  • TABLE 190 MIDDLE EAST & AFRICA: MARKET, BY FILTER MEDIA, 2020–2022 (USD MILLION)
  • TABLE 191 MIDDLE EAST & AFRICA: MARKET, BY FILTER MEDIA, 2023–2029 (USD MILLION)
  • TABLE 192 MIDDLE EAST & AFRICA: MARKET, BY INDUSTRY, 2020–2022 (USD MILLION)
  • TABLE 193 MIDDLE EAST & AFRICA: MARKET, BY INDUSTRY, 2023–2029 (USD MILLION)
  • TABLE 194 MIDDLE EAST & AFRICA: MARKET, BY COUNTRY, 2020–2022 (USD MILLION)
  • TABLE 195 MIDDLE EAST & AFRICA: MARKET, BY COUNTRY, 2023–2029 (USD MILLION)
  • TABLE 196 GCC COUNTRIES: MARKET, BY COUNTRY, 2020–2022 (USD MILLION)
  • TABLE 197 GCC COUNTRIES: MARKET, BY COUNTRY, 2023–2029 (USD MILLION)
  • TABLE 198 SAUDI ARABIA: MARKET, BY INDUSTRY, 2020–2022 (USD MILLION)
  • TABLE 199 SAUDI ARABIA: MARKET, BY INDUSTRY, 2023–2029 (USD MILLION)
  • TABLE 200 UAE: MARKET, BY INDUSTRY, 2020–2022 (USD MILLION)
  • TABLE 201 UAE: MARKET, BY INDUSTRY, 2023–2029 (USD MILLION)
  • TABLE 202 REST OF GCC COUNTRIES: MARKET, BY INDUSTRY, 2020–2022 (USD MILLION)
  • TABLE 203 REST OF GCC COUNTRIES: MARKET, BY INDUSTRY, 2023–2029 (USD MILLION)
  • TABLE 204 SOUTH AFRICA: MARKET, BY INDUSTRY, 2020–2022 (USD MILLION)
  • TABLE 205 SOUTH AFRICA: MARKET, BY INDUSTRY, 2023–2029 (USD MILLION)
  • TABLE 206 REST OF MIDDLE EAST & AFRICA: MARKET, BY INDUSTRY, 2020–2022 (USD MILLION)
  • TABLE 207 REST OF MIDDLE EAST & AFRICA: MARKET, BY INDUSTRY, 2023–2029 (USD MILLION)
  • TABLE 208 SOUTH AMERICA: INDUSTRIAL FILTRATION MARKET, BY TYPE, 2020–2022 (USD MILLION)
  • TABLE 209 SOUTH AMERICA: MARKET, BY TYPE, 2023–2029 (USD MILLION)
  • TABLE 210 SOUTH AMERICA: INDUSTRIAL LIQUID FILTRATION MARKET, BY TECHNOLOGY, 2020–2022 (USD MILLION)
  • TABLE 211 SOUTH AMERICA: INDUSTRIAL LIQUID FILTRATION MARKET, BY TECHNOLOGY, 2023–2029 (USD MILLION)
  • TABLE 212 SOUTH AMERICA: INDUSTRIAL AIR FILTRATION MARKET, BY TECHNOLOGY, 2020–2022 (USD MILLION)
  • TABLE 213 SOUTH AMERICA: INDUSTRIAL AIR FILTRATION MARKET, BY TECHNOLOGY, 2023–2029 (USD MILLION)
  • TABLE 214 SOUTH AMERICA: INDUSTRIAL AIR FILTRATION MARKET, BY PRODUCT, 2020–2022 (USD MILLION)
  • TABLE 215 SOUTH AMERICA: INDUSTRIAL AIR FILTRATION MARKET, BY PRODUCT, 2023–2029 (USD MILLION)
  • TABLE 216 SOUTH AMERICA: MARKET, BY FILTER MEDIA, 2020–2022 (USD MILLION)
  • TABLE 217 SOUTH AMERICA: MARKET, BY FILTER MEDIA, 2023–2029 (USD MILLION)
  • TABLE 218 SOUTH AMERICA: MARKET, BY INDUSTRY, 2020–2022 (USD MILLION)
  • TABLE 219 SOUTH AMERICA: MARKET, BY INDUSTRY, 2023–2029 (USD MILLION)
  • TABLE 220 SOUTH AMERICA: MARKET, BY COUNTRY, 2020–2022 (USD MILLION)
  • TABLE 221 SOUTH AMERICA: MARKET, BY COUNTRY, 2023–2029 (USD MILLION)
  • TABLE 222 BRAZIL: MARKET, BY INDUSTRY, 2020–2022 (USD MILLION)
  • TABLE 223 BRAZIL: MARKET, BY INDUSTRY, 2023–2029 (USD MILLION)
  • TABLE 224 ARGENTINA: MARKET, BY INDUSTRY, 2020–2022 (USD MILLION)
  • TABLE 225 ARGENTINA: MARKET, BY INDUSTRY, 2023–2029 (USD MILLION)
  • TABLE 226 REST OF SOUTH AMERICA: MARKET, BY INDUSTRY, 2020–2022 (USD MILLION)
  • TABLE 227 REST OF SOUTH AMERICA: MARKET, BY INDUSTRY, 2023–2029 (USD MILLION)
  • TABLE 228 INDUSTRIAL FILTRATION MARKET: STRATEGIES ADOPTED BY KEY PLAYERS, 2021–2023
  • TABLE 229 MARKET: DEGREE OF COMPETITION
  • TABLE 230 TYPE FOOTPRINT
  • TABLE 231 REGION FOOTPRINT
  • TABLE 232 PRODUCT FOOTPRINT
  • TABLE 233 FILTER MEDIA FOOTPRINT
  • TABLE 234 INDUSTRY FOOTPRINT
  • TABLE 235 MARKET: LIST OF KEY START-UPS/SMES
  • TABLE 236 MARKET: COMPETITIVE BENCHMARKING OF KEY START-UPS/SMES
  • TABLE 237 MARKET: PRODUCT LAUNCHES, JANUARY 2021– SEPTEMBER 2023
  • TABLE 238 MARKET: EXPANSIONS, JANUARY 2021– DECEMBER 2023
  • TABLE 239 ALFA LAVAL: COMPANY OVERVIEW, 2022
  • TABLE 240 ALFA LAVAL: PRODUCTS/SOLUTIONS/SERVICES OFFERED
  • TABLE 241 ALFA LAVAL: PRODUCT/SERVICE LAUNCHES/ENHANCEMENTS
  • TABLE 242 ALFA LAVAL: EXPANSIONS
  • TABLE 243 CAMFIL: COMPANY OVERVIEW, 2022
  • TABLE 244 CAMFIL: PRODUCTS/SOLUTIONS/SERVICES OFFERED
  • TABLE 245 CAMFIL: PRODUCT/SERVICE LAUNCHES/ENHANCEMENTS
  • TABLE 246 CAMFIL: DEALS
  • TABLE 247 CAMFIL: EXPANSIONS
  • TABLE 248 DONALDSON COMPANY, INC: COMPANY OVERVIEW 2022
  • TABLE 249 DONALDSON COMPANY, INC.: PRODUCTS/SOLUTIONS/SERVICES OFFERED
  • TABLE 250 DONALDSON COMPANY, INC.: PRODUCT/SERVICE LAUNCHES/ENHANCEMENTS
  • TABLE 251 DONALDSON COMPANY, INC.: DEALS
  • TABLE 252 DONALDSON COMPANY, INC.: EXPANSIONS
  • TABLE 253 PARKER HANNIFIN CORP: COMPANY OVERVIEW, 2022
  • TABLE 254 PARKER HANNIFIN CORP: PRODUCTS/SOLUTIONS/SERVICES OFFERED
  • TABLE 255 PARKER HANNIFIN CORP: PRODUCT/SERVICE LAUNCHES/ENHANCEMENTS
  • TABLE 256 CUMMINS INC: COMPANY OVERVIEW, 2022
  • TABLE 257 CUMMINS INC.: PRODUCTS/SOLUTIONS/SERVICES OFFERED
  • TABLE 258 CUMMINS INC.: DEALS
  • TABLE 259 EATON: COMPANY OVERVIEW, 2022
  • TABLE 260 EATON: PRODUCTS/SOLUTIONS/SERVICES OFFERED
  • TABLE 261 EATON: PRODUCT/SERVICE LAUNCHES/ENHANCEMENTS
  • TABLE 262 FILTRATION GROUP: COMPANY OVERVIEW, 2022
  • TABLE 263 FILTRATION GROUP: PRODUCTS/SOLUTIONS/SERVICES OFFERED
  • TABLE 264 FILTRATION GROUP: PRODUCT/SERVICE LAUNCHES/ENHANCEMENTS
  • TABLE 265 FILTRATION GROUP: DEALS
  • TABLE 266 FREUDENBERG GROUP: COMPANY OVERVIEW, 2022
  • TABLE 267 FREUDENBERG GROUP: PRODUCTS/SOLUTIONS/SERVICES OFFERED
  • TABLE 268 FREUDENBERG GROUP: DEALS
  • TABLE 269 FREUDENBERG: EXPANSIONS
  • TABLE 270 MANN+HUMMEL: COMPANY OVERVIEW, 2022
  • TABLE 271 MANN+HUMMEL: PRODUCTS/SOLUTIONS/SERVICES OFFERED
  • TABLE 272 MANN+HUMMEL: PRODUCT/SERVICE LAUNCHES/ENHANCEMENTS
  • TABLE 273 MANN+HUMMEL: DEALS
  • TABLE 274 MANN+HUMMEL: EXPANSIONS
  • TABLE 275 DANAHER CORPORATION: COMPANY OVERVIEW, 2022
  • TABLE 276 DANAHER CORPORATION: PRODUCTS/SOLUTIONS/SERVICES OFFERED
  • TABLE 277 DANAHER: DEALS
  • TABLE 278 3M: COMPANY OVERVIEW, 2022
  • TABLE 279 3M: PRODUCTS/SOLUTIONS/SERVICES OFFERED
  • TABLE 280 3M: PRODUCT/SERVICE LAUNCHES/ENHANCEMENTS
  • TABLE 281 3M: DEALS
  • TABLE 282 3M: OTHERS
  • TABLE 283 BABCOCK & WILCOX: COMPANY OVERVIEW, 2022
  • TABLE 284 BABCOCK & WILCOX: PRODUCTS/SOLUTIONS/SERVICES OFFERED
  • TABLE 285 BABCOCK & WILCOX: PRODUCT/SERVICE LAUNCHES/ENHANCEMENTS
  • TABLE 286 W.L. GORE: COMPANY OVERVIEW, 2022
  • TABLE 287 W.L. GORE: PRODUCTS/SOLUTIONS/SERVICES OFFERED
  • TABLE 288 W.L. GORE: PRODUCT/SERVICE LAUNCHES/ENHANCEMENTS
  • TABLE 289 LENNTECH B.V.: COMPANY OVERVIEW, 2022
  • TABLE 290 LENNTECH B.V.: PRODUCTS/SOLUTIONS/SERVICES OFFERED
  • TABLE 291 HENGST SE: COMPANY OVERVIEW, 2022
  • TABLE 292 HENGST SE: PRODUCTS/SOLUTIONS/SERVICES OFFERED
  • TABLE 293 HENGST SE: PRODUCT/SERVICE LAUNCHES/ENHANCEMENTS
  • TABLE 294 FLEETLIFE INC.: COMPANY OVERVIEW, 2022
  • TABLE 295 FLEETLIFE INC.: PRODUCTS/SOLUTIONS/SERVICES OFFERED
  • TABLE 296 FLEETLIFE INC.: PRODUCT/SERVICE LAUNCHES/ENHANCEMENTS
LIST OF FIGURES
 
  • FIGURE 1 INDUSTRIAL FILTRATION MARKET: RESEARCH DESIGN
  • FIGURE 2 DATA TRIANGULATION METHODOLOGY
  • FIGURE 3 MAIN METRICS CONSIDERED TO ANALYZE AND ASSESS DEMAND FOR INDUSTRIAL FILTRATION PRODUCTS
  • FIGURE 4 MARKET SIZE ESTIMATION METHODOLOGY: BOTTOM-UP APPROACH
  • FIGURE 5 MARKET SIZE ESTIMATION METHODOLOGY: TOP-DOWN APPROACH
  • FIGURE 6 KEY STEPS CONSIDERED TO ASSESS SUPPLY OF INDUSTRIAL FILTRATION PRODUCTS
  • FIGURE 7 MARKET: SUPPLY-SIDE ANALYSIS
  • FIGURE 8 COMPANY REVENUE ANALYSIS, 2023
  • FIGURE 9 NORTH AMERICA DOMINATED MARKET IN 2023
  • FIGURE 10 LIQUID SEGMENT TO HOLD LARGER SHARE OF MARKET, BY TYPE, IN 2029
  • FIGURE 11 NONWOVEN FABRIC SEGMENT TO LEAD MARKET, BY FILTER MEDIA, THROUGHOUT FORECAST PERIOD
  • FIGURE 12 BAG FILTER SEGMENT TO CAPTURE LARGEST SHARE OF MARKET, BY PRODUCT, IN 2029
  • FIGURE 13 CHEMICALS & PETROCHEMICALS SEGMENT TO CAPTURE LARGEST SHARE OF MARKET, BY INDUSTRY, IN 2029
  • FIGURE 14 GROWING FOCUS ON PROTECTING HEALTH AND WELL-BEING OF EMPLOYEES IN INDUSTRIAL SETTINGS TO DRIVE MARKET IN COMING YEARS
  • FIGURE 15 ASIA PACIFIC TO WITNESS HIGHEST CAGR IN MARKET DURING FORECAST PERIOD
  • FIGURE 16 CHEMICALS & PETROCHEMICALS INDUSTRY AND US DOMINATED NORTH AMERICAN MARKET IN 2023
  • FIGURE 17 LIQUID SEGMENT TO HOLD LARGER SHARE OF MARKET IN 2029
  • FIGURE 18 BAG FILTER SEGMENT TO HOLD MAJORITY OF MARKET SHARE IN 2029
  • FIGURE 19 NONWOVEN FABRIC TO DOMINATE MARKET IN 2029
  • FIGURE 20 CHEMICALS & PETROCHEMICALS INDUSTRY TO CAPTURE LARGEST SHARE OF MARKET IN 2029
  • FIGURE 21 INDUSTRIAL FILTRATION MARKET: DRIVERS, RESTRAINTS, OPPORTUNITIES, AND CHALLENGES
  • FIGURE 22 COSTS RELATED TO DAIRY PLANT EQUIPMENT AFTER PURIFICATION
  • FIGURE 23 DISTILLATION CAPACITY ADDITIONS IN EXISTING PROJECTS, BY REGION, 2022–2027
  • FIGURE 24 MARKET: TRENDS/DISRUPTIONS IMPACTING CUSTOMERS’ BUSINESS
  • FIGURE 25 AVERAGE SELLING PRICE TREND, BY PRODUCT, 2021–2023
  • FIGURE 26 AVERAGE SELLING PRICE OF INDUSTRIAL FILTRATION PRODUCTS, BY REGION, 2021–2023
  • FIGURE 27 MARKET: VALUE CHAIN ANALYSIS
  • FIGURE 28 INDUSTRIAL FILTRATION ECOSYSTEM ANALYSIS
  • FIGURE 29 FUNDING SCENARIO FOR TOP PLAYERS
  • FIGURE 30 MARKET: PATENTS APPLIED AND GRANTED, 2013–2022
  • FIGURE 31 EXPORT DATA FOR HS CODE 842199-COMPLIANT PRODUCTS, BY COUNTRY, 2020–2022 (USD THOUSAND)
  • FIGURE 32 IMPORT DATA FOR HS CODE 842199-COMPLIANT PRODUCTS, 2020–2022 (USD THOUSAND)
  • FIGURE 33 INDUSTRIAL FILTRATION MARKET: PORTER’S FIVE FORCES ANALYSIS
  • FIGURE 34 INFLUENCE OF KEY STAKEHOLDERS ON BUYING PROCESS FOR TOP THREE INDUSTRIES
  • FIGURE 35 KEY BUYING CRITERIA FOR TOP THREE INDUSTRIES
  • FIGURE 36 LIQUID SEGMENT HELD LARGER MARKET SHARE IN 2023
  • FIGURE 37 BAG FILTER SEGMENT HELD LARGEST MARKET SHARE IN 2023
  • FIGURE 38 NONWOVEN FABRIC SEGMENT CAPTURED LARGEST MARKET SHARE IN 2023
  • FIGURE 39 CHEMICALS & PETROCHEMICALS INDUSTRY ACCOUNTED FOR LARGEST MARKET SHARE IN 2023
  • FIGURE 40 ASIA PACIFIC TO EXHIBIT HIGHEST CAGR IN MARKET DURING FORECAST PERIOD
  • FIGURE 41 INDUSTRIAL FILTRATION MARKET SHARE, BY REGION, 2023
  • FIGURE 42 NORTH AMERICA: REGIONAL SNAPSHOT
  • FIGURE 43 EUROPE: REGIONAL SNAPSHOT
  • FIGURE 44 INDUSTRIAL FILTRATION MARKET SHARE ANALYSIS, 2023
  • FIGURE 45 REVENUE ANALYSIS OF FIVE KEY PLAYERS, 2019–2023
  • FIGURE 46 MARKET: COMPANY EVALUATION MATRIX, KEY PLAYERS, 2023
  • FIGURE 47 MARKET: COMPANY EVALUATION MATRIX, START-UPS/SMES, 2022
  • FIGURE 48 FINANCIAL METRICS
  • FIGURE 49 COMPANY VALUATION
  • FIGURE 50 INDUSTRIAL FILTRATION: BRAND/PRODUCT COMPARISON
  • FIGURE 51 ALFA LAVAL: COMPANY SNAPSHOT
  • FIGURE 52 DONALDSON COMPANY, INC.: COMPANY SNAPSHOT
  • FIGURE 53 PARKER HANNIFIN CORP: COMPANY SNAPSHOT
  • FIGURE 54 CUMMINS INC.: COMPANY SNAPSHOT
  • FIGURE 55 EATON: COMPANY SNAPSHOT
  • FIGURE 56 FREUDENBERG GROUP: COMPANY SNAPSHOT
  • FIGURE 57 MANN+HUMMEL: COMPANY SNAPSHOT
  • FIGURE 58 DANAHER CORPORATION: COMPANY SNAPSHOT
  • FIGURE 59 3M: COMPANY SNAPSHOT
  • FIGURE 60 BABCOCK & WILCOX: COMPANY SNAPSHOT


The study involved major activities in estimating the current size of the industrial filtration market. Exhaustive secondary research was done to collect information on the peer and parent markets. The next step was to validate these findings, assumptions, and sizing with industry experts across the value chain through primary research. Both top-down and bottom-up approaches were employed to estimate the complete market size. Thereafter, market breakdown and data triangulation were used to estimate the market size of the segments and subsegments.

Secondary Research

The secondary sources referred to for this research study comprises of annual reports of companies, investor presentations of companies, press releases, white papers, certified publications, articles by recognized authors, and databases of various companies and associations. Secondary research was mainly used to obtain key information about the supply chain and to identify the key players offering industrial filtration products, market classification, and segmentation according to the offerings of the leading players, along with the industry trends to the bottom-most level, regional markets, and key developments from both market- and technology-oriented perspectives.

Primary Research

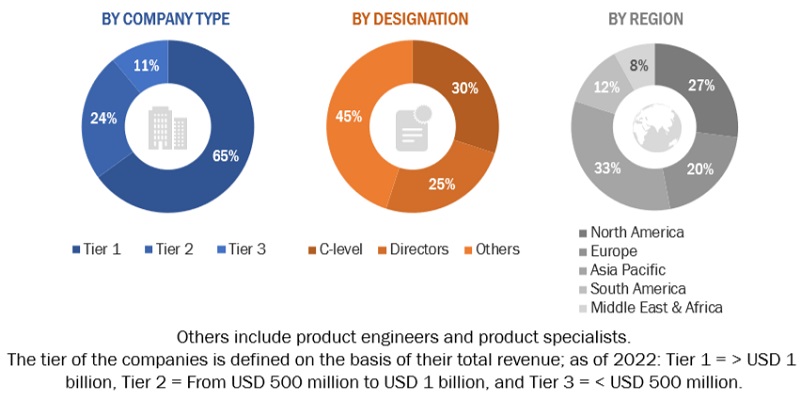
In order to gather qualitative and quantitative data for this study, a variety of primary sources from the supply and demand sides were interviewed throughout the primary research phase. Chief executive officers (CEO), vice presidents, mechanical design engineers, senior R&D engineers, sales executives, production supervisors, and related key executives from various companies and organizations operating in the industrial filtration market were among the primary sources from the supply side.

Throughout the whole market engineering process, a number of data triangulation techniques were employed in conjunction with a combination of top-down and bottom-up methodologies to generate market size estimates and projections for each of the segments and subsegments included in this study. In order to highlight important details and insights throughout the study, a thorough market engineering approach involved conducting extensive qualitative and quantitative assessments.

Following is the breakdown of primary respondents:
Industrial Filtration  Market Size, and Share

To know about the assumptions considered for the study, download the pdf brochure

Market Size Estimation

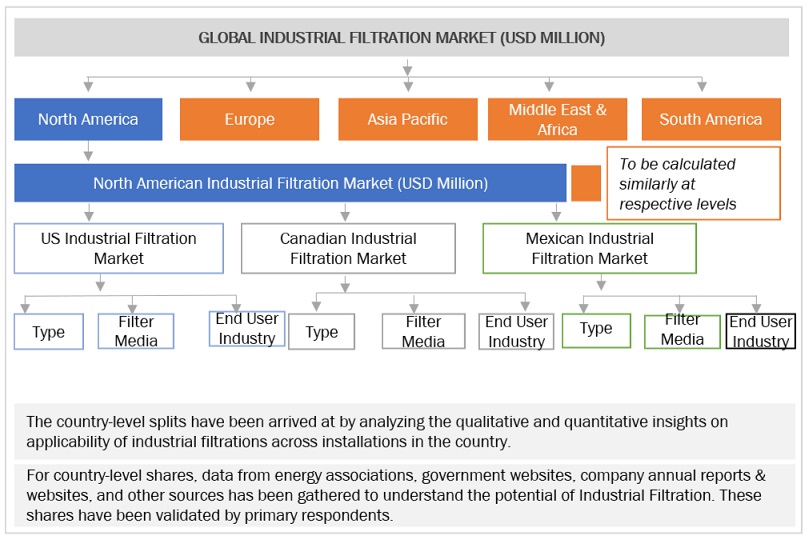
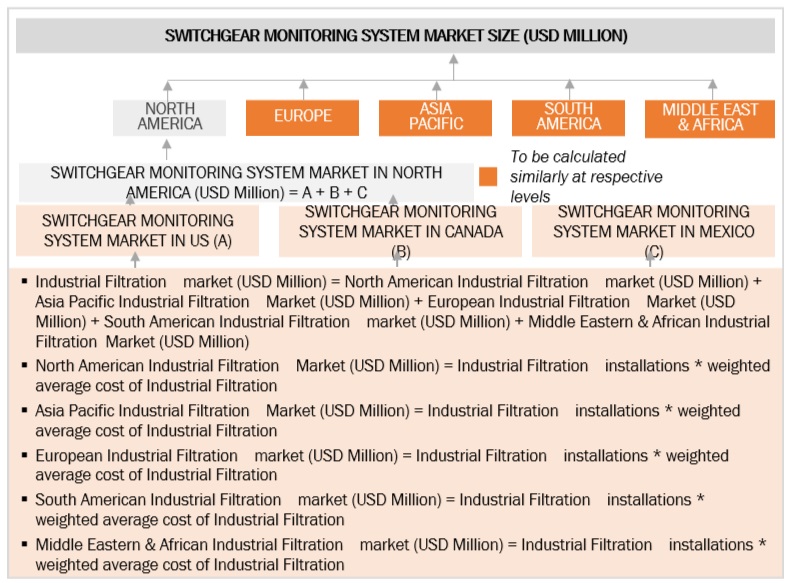
Both top-down and bottom-up approaches were used to estimate and validate the total size of the industrial filtration market. These methods were also used extensively to estimate the size of various subsegments in the market. The research methodology used to estimate the market size includes the following:

  • The key players in the industry and market have been identified through extensive secondary research, and their market share in the respective regions has been determined through both secondary and primary research.
  • The industry’s value chain and market size, in terms of value, have been determined through primary and secondary research processes.
  • All percentage shares, splits, and breakdowns have been determined using secondary sources and verified through primaries.

Global Industrial Filtration Market Size: Top-down Approach
Industrial Filtration  Market Top Down Approach

To know about the assumptions considered for the study, Request for Free Sample Report

Global Industrial Filtration Market Size: Bottom-Up Approach
Industrial Filtration  Market Bottom Up Approach

Data Triangulation

After arriving at the overall market size from the estimation process explained above, the total market has been split into several segments and subsegments. The complete market engineering process is done to arrive at the exact statistics for all the segments and subsegments, also data triangulation and market breakdown processes have been employed, wherever applicable. The data has been triangulated by examining various factors and trends from both the demand- and supply sides. Along with this, the market has been validated through both the top-down and bottom-up approaches.

Market Definition

Industrial filtration is the process of removing suspended solids from liquids or air with the help of filter media. It helps in reducing emissions, preventing downtime due to failures, extending the service life of the machines, and removing clogging in pipelines. Industrial filters are used across numerous end-use industries, such as manufacturing, power generation, oil & gas, pharmaceuticals, metals & mining, and process industries.

The industrial filtration market refers to the year-on-year sales of industrial filters by key manufacturers across end-user industries. Industrial filters are used for treating both air and liquids using different filtration technologies and filter media.

Key Stakeholders

  • Chemical and pharmaceutical companies
  • Distributors
  • Filtration and environmental associations
  • Filtration technology providers
  • Government and research organizations
  • Industrial filter manufacturers
  • Industrial filter media manufacturers
  • Mining companies
  • Power generation companies
  • Raw material suppliers
  • Oil & gas operators

Objectives Of The Study

  • To define, describe, segment, and forecast the industrial filtration market based on type, product, filter media, and end user industry.
  • To forecast the market size for five key regions: North America, South America, Europe, Asia Pacific, and Middle East & Africa, along with their key countries
  • To provide detailed information about the key drivers, restraints, opportunities, and challenges influencing the growth of the market
  • To strategically analyze the subsegments with respect to individual growth trends, prospects, and contributions of each segment to the overall market size
  • To analyze market opportunities for stakeholders and the competitive landscape of the market
  • To strategically profile the key players and comprehensively analyze their market shares and core competencies
  • To analyze competitive developments, such as sales contracts, agreements, investments, expansions, new product launches, mergers, partnerships, collaborations, and acquisitions, in the market

Available Customizations:

With the given market data, MarketsandMarkets offers customizations as per the client’s specific needs. The following customization options are available for this report:

Geographic Analysis

  • Further breakdown of region or country-specific analysis

Company Information

  • Detailed analyses and profiling of additional market players (up to 5)
Custom Market Research Services

We will customize the research for you, in case the report listed above does not meet with your exact requirements. Our custom research will comprehensively cover the business information you require to help you arrive at strategic and profitable business decisions.

Request Customization

Instant Answers with GPT - Ask Now!

Ask real questions. Get complete answers !
Report Code
EP 4471
Published ON
Mar, 2024
Choose License Type
BUY NOW
  • SHARE
X
Request Customization
Speak to Analyst
Speak to Analyst
OR FACE-TO-FACE MEETING
PERSONALIZE THIS RESEARCH
  • Triangulate with your Own Data
  • Get Data as per your Format and Definition
  • Gain a Deeper Dive on a Specific Application, Geography, Customer or Competitor
  • Any level of Personalization
REQUEST A FREE CUSTOMIZATION
LET US HELP YOU!
  • What are the Known and Unknown Adjacencies Impacting the Industrial Filtration Market
  • What will your New Revenue Sources be?
  • Who will be your Top Customer; what will make them switch?
  • Defend your Market Share or Win Competitors
  • Get a Scorecard for Target Partners
CUSTOMIZED WORKSHOP REQUEST
knowledgestore logo

Want to explore hidden markets that can drive new revenue in Industrial Filtration Market?

Find Hidden Markets
  • Call Us
  • +1-888-600-6441 (Corporate office hours)
  • +1-888-600-6441 (US/Can toll free)
  • +44-800-368-9399 (UK office hours)
CONNECT WITH US
ABOUT TRUST ONLINE
©2024 MarketsandMarkets Research Private Ltd. All rights reserved
DMCA.com Protection Status
Website Feedback