The research study involved 4 major activities in estimating the size of the industrial cybersecurity market. Exhaustive secondary research has been done to collect important information about the market and peer markets. The validation of these findings, assumptions, and sizing with the help of primary research with industry experts across the supply chain has been the next step. Both top-down and bottom-up approaches have been used to estimate the market size. Post which the market breakdown and data triangulation have been adopted to estimate the market sizes of segments and sub-segments.
Secondary Research
In the secondary research process, various secondary sources have been referred to for identifying and collecting information required for this study. The secondary sources include annual reports, press releases, investor presentations of companies, white papers, and articles from recognized authors. Secondary research has been mainly done to obtain key information about the market’s value chain, the pool of key market players, market segmentation according to industry trends, regional outlook, and developments from both market and technology perspectives.
Primary Research
In primary research, various primary sources from both supply and demand sides have been interviewed to obtain qualitative and quantitative insights required for this report. Primary sources from the supply side include experts such as CEOs, vice presidents, marketing directors, manufacturers, technology and innovation directors, end users, and related executives from multiple key companies and organizations operating in the industrial cybersecurity market ecosystem. After interacting with industry experts, brief sessions were conducted with highly experienced independent consultants to reinforce the findings from our primary respondents. This, along with the in-house subject matter experts’ opinions, has led us to the findings as described in the remainder of this report. The breakdown of primary respondents is as follows:
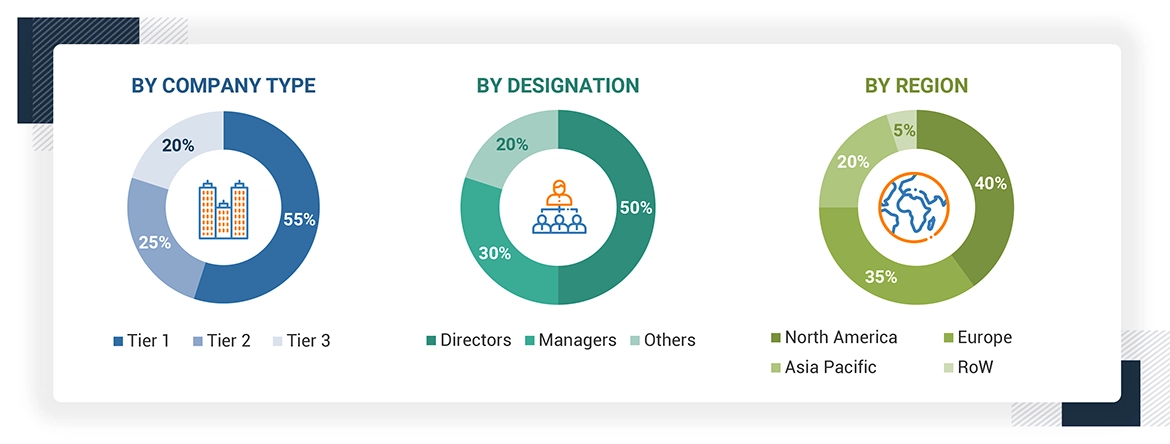
Note: Other designations include sales and marketing executives, researchers, and members of various industrial cybersecurity organizations. Three tiers of companies are defined based on their total revenue as of 2023; tier 1: revenue more than or equal to USD 500 million, tier 2: revenue between USD 100 million and USD 500 million, and tier 3: revenue less than or equal to USD 100 million.
About the assumptions considered for the study, To know download the pdf brochure
Market Size Estimation
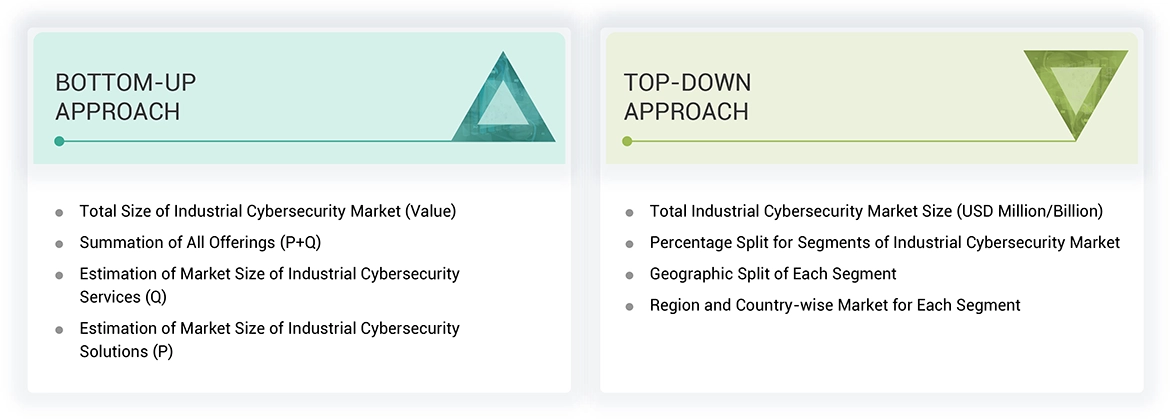
The bottom-up procedure has been employed to arrive at the overall size of the industrial cybersecurity market.
-
Identifying and analyzing major providers of industrial cybersecurity solutions and service providers, as well as studying their portfolios and understanding different technologies used
-
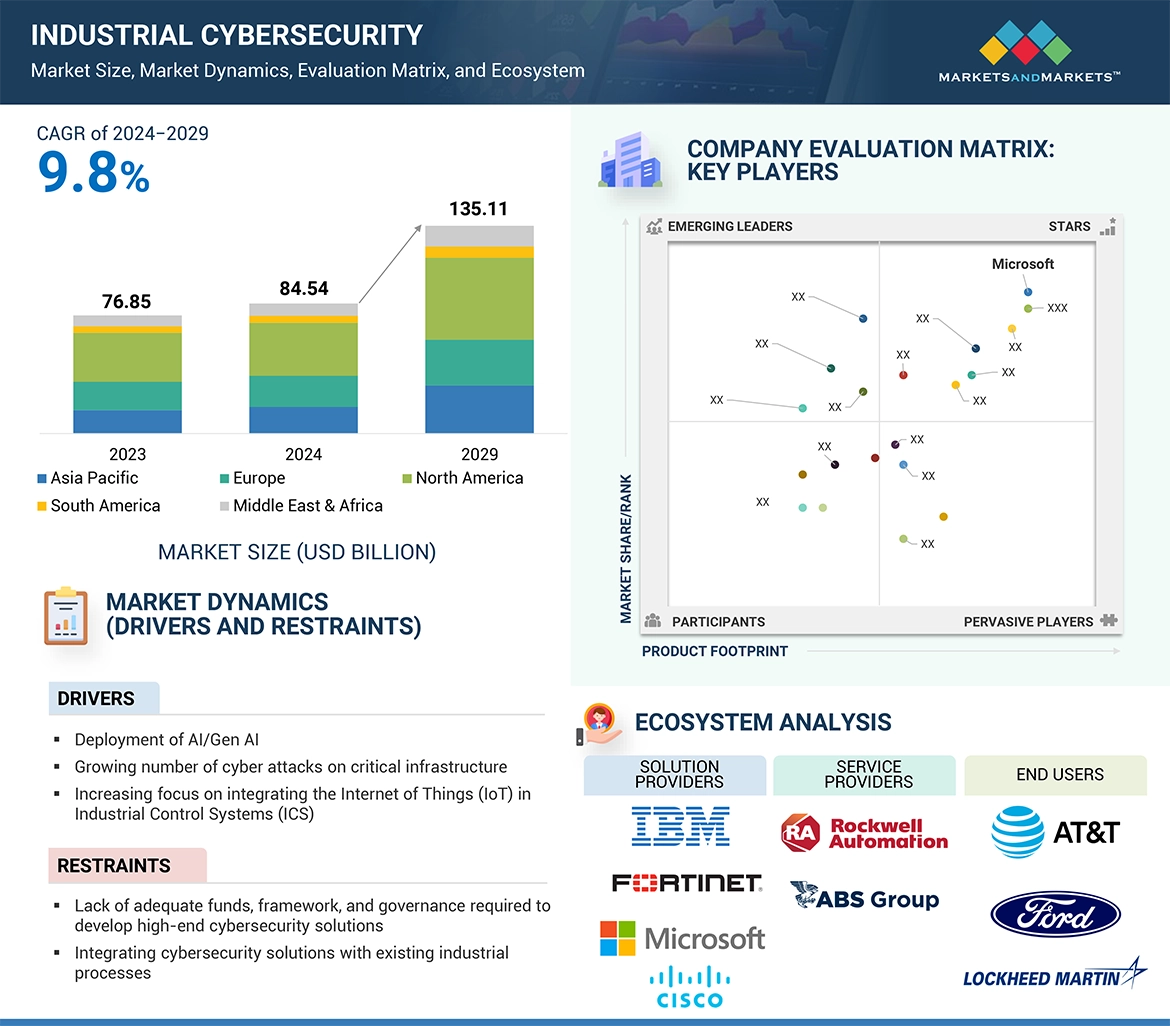
The market size of industrial cybersecurity solutions was estimated by calculating the total value generated from cybersecurity software, hardware, and platform deployments across various industries
-
The market size of industrial cybersecurity services was estimated by summing up revenues from services like managed and professional services. Arriving at the market estimates by analyzing the revenue of companies and then combining these figures to arrive at the market size
-
Studying various paid and unpaid sources, such as annual reports, press releases, white papers, and databases, to gather the required information
-
Tracking the ongoing developments and identifying the upcoming developments in the market that include investments, research and development activities, product launches, contracts, collaborations, and partnerships undertaken, and forecasting the market size based on these developments
-
Carrying out multiple discussions with key opinion leaders to understand the types of industrial cybersecurity hardware and software designed and developed, thereby analyzing the break-up of the scope of work carried out by the major companies in the industrial cybersecurity market
-
Arriving at the market estimates by analyzing the revenue generated by key companies providing industrial cybersecurity solutions on the basis of their locations (countries) and then combining the market size for each country to get the market estimate by region
-
Verifying and crosschecking the estimates at every level by discussing with key opinion leaders, including CXOs, directors, and operation managers, and then finally with the domain experts at MarketsandMarkets
The top-down approach has been used to estimate and validate the total size of the industrial cybersecurity market.
-
Focusing on top-line investments and expenditures being made in the ecosystems of various applications
-
Calculating the market size, considering revenues from major players through the cost of industrial cybersecurity solutions
-
Segmenting each application of the industrial cybersecurity system in each region and deriving the global market size based on the region
-
Acquiring and analyzing information related to revenues generated by players through their crucial offerings
-
Conducting multiple on-field discussions with key opinion leaders involved in developing various industrial cybersecurity solutions
-
Estimating geographical splits by using secondary sources on the basis of various factors, such as the number of players in a specific country and region and types of industrial cybersecurity solutions offered across end-user industries.
Industrial Cybersecurity Market : Top-Down and Bottom-Up Approach


 HIGHEST CAGR MARKET IN 2024-2029
 INDIA FASTEST GROWING MARKET IN THE REGION
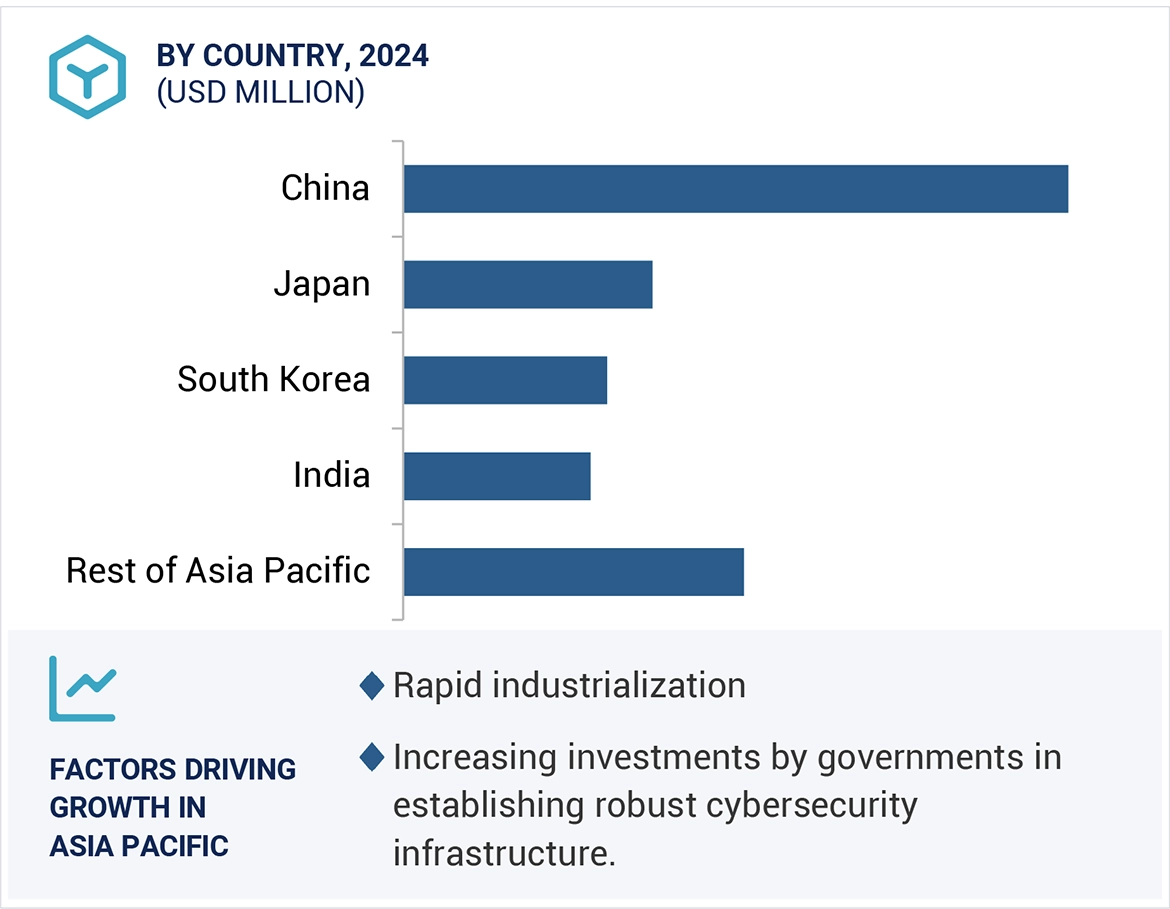


Growth opportunities and latent adjacency in Industrial Cybersecurity Market