In-flight Content Market Size, Share, and Growth Drivers

In-flight Content Market by Type (Movie, TV Shows, Music, Games, Magazine, News), Access (Seatback Display Unit, Portable Device), Operation (Stored, Streamed) , Platform (Commercial Aviation, Business Aviation) and Region - Global Forecast to 2029

Report Code: AS 9031 May, 2024, by marketsandmarkets.com

The Inflight Content Market is projected to grow from USD 691 million in 2024 to USD 931 million by 2029, at a CAGR of 6.1% from 2024 to 2029. The inflight content market has rapidly evolved, becoming a crucial aspect of the airline industry. This market includes a wide range of entertainment options, such as movies, TV shows, music, and games, for passengers during their flights. This chapter discusses the market dynamicssuch as drivers, restraints, opportunities, and challenges pertaining to the inflight content market, and how these factors are expected to influence the growth of the key market players, including Panasonic Avionics Corporation (US), Collins Aerospace (US), Astronics Corporation (US), and Thales (France). As airlines seek to enhance passenger satisfaction and explore new revenue streams, the Inflight Content Industry remains a dynamic segment of the aviation industry.


In-flight Content Market

In-flight Content Market

In-flight Content Market Forecast to 2029

To know about the assumptions considered for the study, Request for Free Sample Report

Inflight content market Dynamics:

Driver:  Increasing consumer preference for high-quality in-flight content services

Increasing consumer preference for high-quality in-flight content services is reshaping the airline industry. Travelers today expect a rich and engaging in-flight entertainment (IFE) experience, featuring a diverse range of movies, TV shows, music, and games. This demand stems from a broader trend where passengers seek a more enjoyable and immersive travel experience.

The importance of IFE is underscored by statistics from Honeywell, which indicate that 73% of buyers consider customer experience a crucial factor in their purchasing decisions. This highlights the competitive edge that high-quality IFE can provide airlines in attracting and retaining customers. Moreover, about 89% of passengers regard a fast Wi-Fi connection as critical to their ability to stream content in flight. Recognizing this, airlines such as JetBlue (US) and Southwest Airlines (US) have implemented high-speed Wi-Fi services on most of their flights, allowing passengers to stream content seamlessly, work online, and stay connected during their journey.

Additionally, many airlines are now providing advanced IFE systems and faster internet connectivity to enhance the passenger experience. This offerings not only meets current consumer demands but also positions airlines to remain competitive in a market where customer expectations continue to rise. By prioritizing high-quality in-flight content and connectivity, airlines can significantly improve customer satisfaction and loyalty, ultimately driving their business success.

Restraint: Data security concerns

As airlines increasingly rely on digital platforms to deliver entertainment and connectivity services, safeguarding sensitive data has become a critical priority. The use of these platforms involves the collection and storage of various types of passenger data, such as viewing habits, preferences, and payment information for premium content.
The potential risks associated with data breaches are substantial. If an airline's in-flight entertainment system is compromised, the consequences could include unauthorized access to passengers' personal and financial information. This could lead to identity theft, financial fraud, and other forms of cybercrime. The fear of such breaches can make passengers wary of using in-flight connectivity services, potentially diminishing their overall travel experience and satisfaction.

Opportunity: Trend of cloud-based content streaming

Cloud-based content streaming represents a significant opportunity in the in-flight content market by leveraging cloud technology to deliver seamless, high-quality entertainment and information to passengers. This method involves storing content on remote servers and streaming it directly to passengers’ devices via the aircraft’s Wi-Fi system. Compared to traditional systems that rely on pre-loaded media, cloud streaming allows airlines to provide a broader selection of movies, TV shows, music, and real-time updates, which can be refreshed more frequently. This ensures passengers can always access the latest entertainment options, enhancing their in-flight experience

Challenge: Costly installation of in-flight entertainment devices

Outfitting an aircraft with IFE systems requires a substantial initial investment which includes the purchase of high-quality screens, control units, and other necessary hardware, along with the associated installation labor costs. Given the complexity of integrating these systems into aircraft cabins without compromising space or passenger comfort, the expenses can quickly escalate.

Moreover, these installations are not a one-time expense. IFE devices require regular maintenance and periodic upgrades to stay current with technological advancements and passenger expectations. Airlines must continually invest in new software updates, improved hardware, and better user interfaces to remain competitive. This ongoing financial commitment can strain budgets, especially for smaller carriers or those operating on thin margins.

Additionally, the weight of these IFE systems can lead to increased fuel consumption, further driving up operational costs. Some airlines might consider using passengers' personal devices to deliver entertainment content via onboard Wi-Fi as an alternative. However, this approach still necessitates a robust connectivity infrastructure and has its own set of challenges and costs

Ecosystem Map For The Inflight Content Market

In-flight Content Market by Ecosystem

Based on type, the movie segment is projected to grow at the highest CAGR during the forecast period.

Based on type, the in-flight content market has been segmented into movie, TV show, live TV, music, game, magazine, news, and other types. The movie segment is estimated to grow at the highest CAGR of 6.9% during the forecast period. This is because airlines curate a diverse selection of films, including recent blockbusters, classic favorites, documentaries, and international cinema, to cater to the varied tastes of their passengers.

Based on access, the portable device segment will have the highest CAGR< during the forecast period.

Based on access, the in-flight content market has been segmented into seatback display unit  and portable device. Portable segment will dominate the market with highest CAGR during the forecast period. This is because passengers are using their personal devices to access various entertainment options during flights. Airlines provide onboard Wi-Fi connectivity and dedicated in-flight entertainment platforms, enabling passengers to stream movies, TV shows, and music directly on their smartphones, tablets, or laptops.

Based on operation, the stored segment is estimated to lead the market in 2024

Based on operation, the in-flight content market has been classified into stored and streamed. The stored segment will lead the market as it ensures passengers to have reliable entertainment options throughout their flight, regardless of Wi-Fi availability or quality. This approach enhances the in-flight experience by providing consistent and high-quality entertainment.

Based on platform, the commercial aviation segment will dominate the inflight content market

Based on platform, the in-flight content market has been segmented into commercial aviation and business aviation. The commercial aviation platforms have entertainment systems, connectivity solutions, and real-time information services onboard, which significantly contribute to the overall travel experience. High-quality in-flight content can turn routine commercial flights into enjoyable and productive journeys, which is critical to passenger loyalty and airline differentiation. This results in increased demand for inflight content services leading the segment with highest market share and CAGR.

The North America region is estimated to have the highest market share in 2024.

North America is poised to have the highest market share in the inflight content market due to its robust technological infrastructure, significant investment in aviation innovation, and a high concentration of frequent flyers. The region's airlines are at the forefront of adopting cutting-edge inflight entertainment systems, driven by a competitive market that prioritizes enhancing passenger experience. Additionally, North America's strong entertainment and media industries provide a rich source of premium content, catering to diverse passenger preferences. The combination of advanced technology, consumer demand for superior travel experiences, and an abundant supply of high-quality content positions North America as a leader in the inflight content market.

In-flight Content Market by Region

In-flight Content Market by Region

To know about the assumptions considered for the study, download the pdf brochure

Key Market Players

The major players in the Inflight Content Companies are Panasonic Avionics Corporation (US), Collins Aerospace (US), Astronics Corporation (US), and Thales (France). These players have adopted various growth strategies expand their presence in the inflight content market.

Get online access to the report on the World's First Market Intelligence Cloud

  • Easy to Download Historical Data & Forecast Numbers
  • Company Analysis Dashboard for high growth potential opportunities
  • Research Analyst Access for customization & queries
  • Competitor Analysis with Interactive dashboard
  • Latest News, Updates & Trend analysis
Request Sample

Scope of the Report

Report Metric

Details

Estimated Value USD 691 million in 2024
Projected Value USD 931 million by 2029
Growth Rate CAGR of 6.1%

Market size available for years

2020-2029

Base year considered

2023

Forecast period

2024-2029

Forecast units

Value (USD)

Segments Covered

By Type, Access, Operation, Platform and Region


Geographies covered

North America, Europe, Asia Pacific, the Middle East and Rest of the World

Companies covered

Panasonic Avionics Corporation (US), Thales (France), Anuvu (US), Collins Aerospace (US), Astronics Corporation (US),  Viasat, Inc. (US), Gogo Business Aviation LLC ( US), Display Interactive (France), Ideanova Technologies, Inc. (US) among others.

In-flight Content Market Highlights

This research report categorizes the In- flight Content markets based on Type, Access, Operation, Platform and Region.

Segment

Subsegment

By Type

  • Movie
  • TV Show
  • Music
  • Game
  • Magazine
  • News 
  • Other Types

By Access

  • Seatback Display Unit
  • Portable Device

By Operation

  • Stored
  • Streamed.

By Platform

  • Commercial Aviation
  • Business Aviation

By Region

  • North America
  • Europe
  • Asia Pacific
  • Middle East
  • Rest of the World

Recent Developments

  • In February 2024, As part of a contract with Thales, Air India will equip 51 aircraft with Thales’ AVANT Up in-flight entertainment system. These will include 40 existing aircraft (777 and 787) retrofit and 11 new aircraft (787 and A350) line fit.
  • In December 2023, Panasonic Avionics Corporation signed an agreement with Icelandair for the installation of its Astrova in-flight entertainment solution and a suite of digital solutions on the airline’s new fleet of Airbus A321neo LR aircraft.
  • In November 2023, Panasonic Avionics Corporation signed an agreement for the installation of the Astrova seat-end solution on EGYPTAIR’s new Airbus A350-900 fleet.
  • In November 2023, Ethiopian Airlines Group awarded a contract to Thales to supply AVANT Up in-flight entertainment system for its upcoming aircraft, Airbus A350-1000.
  • In November 2023, Anuvu entered an exclusive content partnership with learning and development company BecomingX, co-founded by survival expert and television personality Bear Grylls.
  • In October 2023, Porter Airlines and Viasat announced a partnership where Viasat’s wireless in-flight entertainment systems will be factory-installed on an additional 20 new Embraer E195-E2 aircraft on order. The in-flight Wi-Fi also enables access to a wide range of free streaming entertainment, including movies and popular TV series.
  • In October 2023, Anuvu announced a pioneering partnership that will introduce the largest Arabic podcast platform, Podeo, to in-flight listeners for the first time.
  • In June 2023, Panasonic Avionics Corporation and SAUDIA, the national flag carrier of Saudi Arabia, signed an agreement for the installation of the Astrova seat-end solution on up to 30 aircraft.
  • In July 2022, LOT Polish Airlines and Thales signed a nine-year in-flight entertainment turnkey maintenance agreement extension for the airline’s B787 Fleet. The renewal of this agreement also includes support from a dedicated Thales team based at Warsaw, Frederic Chopin Airport.

Frequently Asked Questions (FAQs):

To speak to our analyst for a discussion on the above findings, click Speak to Analyst

TABLE OF CONTENTS
 
1 INTRODUCTION (Page No. - 23)
    1.1 STUDY OBJECTIVES 
    1.2 MARKET DEFINITION 
           1.2.1 INCLUSIONS AND EXCLUSIONS
    1.3 STUDY SCOPE 
           1.3.1 MARKETS COVERED
           1.3.2 REGIONS COVERED
           1.3.3 YEARS CONSIDERED
    1.4 CURRENCY CONSIDERED 
    1.5 STAKEHOLDERS 
 
2 RESEARCH METHODOLOGY (Page No. - 28)
    2.1 RESEARCH DATA 
           2.1.1 SECONDARY DATA
                    2.1.1.1 Key data from secondary sources
           2.1.2 PRIMARY DATA
                    2.1.2.1 Primary sources
                    2.1.2.2 Key data from primary sources
                    2.1.2.3 Breakdown of primary interviews
    2.2 FACTOR ANALYSIS 
           2.2.1 INTRODUCTION
           2.2.2 DEMAND-SIDE INDICATORS
                    2.2.2.1 Passenger traffic
                    2.2.2.2 Emerging countries
           2.2.3 SUPPLY-SIDE INDICATORS
    2.3 MARKET SIZE ESTIMATION 
           2.3.1 BOTTOM-UP APPROACH
           2.3.2 TOP-DOWN APPROACH
    2.4 DATA TRIANGULATION 
    2.5 RESEARCH ASSUMPTIONS 
    2.6 RESEARCH LIMITATIONS 
    2.7 RISK ASSESSMENT 
 
3 EXECUTIVE SUMMARY (Page No. - 39)
 
4 PREMIUM INSIGHTS (Page No. - 43)
    4.1 ATTRACTIVE OPPORTUNITIES FOR PLAYERS IN IN-FLIGHT CONTENT MARKET 
    4.2 IN-FLIGHT CONTENT MARKET, BY TYPE 
    4.3 IN-FLIGHT CONTENT MARKET, BY OPERATION 
    4.4 IN-FLIGHT CONTENT MARKET, BY OPERATION 
    4.5 IN-FLIGHT CONTENT MARKET, BY PLATFORM 
    4.6 IN-FLIGHT CONTENT MARKET, BY COUNTRY 
 
5 MARKET OVERVIEW (Page No. - 46)
    5.1 INTRODUCTION 
    5.2 MARKET DYNAMICS 
           5.2.1 DRIVERS
                    5.2.1.1 Increasing consumer preference for high-quality in-flight content services
                    5.2.1.2 Significant recovery in global air traffic
                    5.2.1.3 Rising BYOD trend with high-speed internet
                    5.2.1.4 Growing investments in personalized in-flight content
           5.2.2 RESTRAINTS
                    5.2.2.1 Data security concerns
                    5.2.2.2 High cost of content licensing and subscriptions
           5.2.3 OPPORTUNITIES
                    5.2.3.1 Emerging trend of cloud-based content streaming
                    5.2.3.2 Focus on regional content
                    5.2.3.3 Advertising and ancillary revenue opportunities
           5.2.4 CHALLENGES
                    5.2.4.1 Streaming limitations
                    5.2.4.2 Stringent regulations and certifications
                    5.2.4.3 Costly installation of in-flight entertainment devices
    5.3 TRENDS AND DISRUPTIONS IMPACTING CUSTOMERS’ BUSINESSES 
    5.4 ECOSYSTEM ANALYSIS 
           5.4.1 PROMINENT COMPANIES
           5.4.2 PRIVATE AND SMALL ENTERPRISES
           5.4.3 END USERS
    5.5 VALUE CHAIN ANALYSIS 
    5.6 BUSINESS MODELS 
    5.7 USE CASE ANALYSIS 
           5.7.1 IN-FLIGHT VR’S VIRTUAL REALITY DEVICE
           5.7.2 IN-FLIGHT DUBLIN’S EVERHUB WIRELESS IN-FLIGHT ENTERTAINMENT SYSTEM
           5.7.3 EMIRATES’ WI-FI-BASED IN-FLIGHT ENTERTAINMENT SYSTEM
    5.8 TECHNOLOGY ANALYSIS 
           5.8.1 KEY TECHNOLOGY
                    5.8.1.1 Content delivery
           5.8.2 COMPLEMENTARY TECHNOLOGY
                    5.8.2.1 Content management and access
           5.8.3 ADJACENT TECHNOLOGY
                    5.8.3.1 High-fidelity audio
                    5.8.3.2 Noise cancellation
                    5.8.3.3 High-throughput, low-latency satellite connectivity
    5.9 TRADE ANALYSIS 
           5.9.1 IMPORT DATA
           5.9.2 EXPORT DATA
    5.10 REGULATORY LANDSCAPE 
    5.11 KEY STAKEHOLDERS AND BUYING CRITERIA 
           5.11.1 KEY STAKEHOLDERS IN BUYING PROCESS
           5.11.2 BUYING CRITERIA
    5.12 PRICING ANALYSIS 
    5.13 OPERATIONAL DATA 
    5.14 KEY CONFERENCES AND EVENTS 
 
6 INDUSTRY TRENDS (Page No. - 71)
    6.1 INTRODUCTION 
    6.2 TECHNOLOGY TRENDS 
           6.2.1 CLOUD-BASED STREAMING
           6.2.2 AUGMENTED REALITY AND VIRTUAL REALITY INTEGRATION
           6.2.3 5G ON BOARD
           6.2.4 TRULY WIRELESS IN-FLIGHT ENTERTAINMENT SYSTEM
           6.2.5 NEXT-GEN CONTENT DELIVERY
    6.3 IMPACT OF MEGATRENDS 
           6.3.1 ARTIFICIAL INTELLIGENCE AND MACHINE LEARNING
           6.3.2 BIG DATA AND ANALYTICS
           6.3.3 DIGITALIZATION
    6.4 SUPPLY CHAIN ANALYSIS 
    6.5 PATENT ANALYSIS 
 
7 IN-FLIGHT CONTENT MARKET, BY TYPE (Page No. - 80)
    7.1 INTRODUCTION 
    7.2 MOVIE 
           7.2.1 AIRLINES’ COMMITMENT TO EXCELLENT CUSTOMER SERVICE
    7.3 TV SHOW 
           7.3.1 AVAILABILITY OF LATEST SHOWS OF VARYING GENRES
    7.4 MUSIC 
           7.4.1 HIGH DEMAND FOR QUALITY MUSIC FROM PASSENGERS
    7.5 GAME 
           7.5.1 COMPREHENSIVE SELECTION OF IN-FLIGHT GAMES
    7.6 MAGAZINE 
           7.6.1 PASSENGER PREFERENCE FOR HIGH-QUALITY, VISUALLY APPEALING CONTENT
    7.7 NEWS 
           7.7.1 PARTNERSHIPS WITH MEDIA ORGANIZATIONS TO PROVIDE CURATED CONTENT
    7.8 OTHER TYPES 
 
8 IN-FLIGHT CONTENT MARKET, BY ACCESS (Page No. - 85)
    8.1 INTRODUCTION 
    8.2 SEATBACK DISPLAY UNIT (SDU) 
           8.2.1 INTEGRATION OF HIGH-RESOLUTION TOUCHSCREENS AND WIRELESS CONNECTIVITY TECHNOLOGIES
    8.3 PORTABLE DEVICE 
           8.3.1 ENHANCED PASSENGER EXPERIENCE WITH PERSONALIZED IN-FLIGHT CONTENT
 
9 IN-FLIGHT CONTENT MARKET, BY OPERATION (Page No. - 88)
    9.1 INTRODUCTION 
    9.2 STORED 
           9.2.1 UNINTERRUPTED ACCESS TO OFFLINE ENTERTAINMENT
    9.3 STREAMED 
           9.3.1 INNOVATIONS IN STREAMING TECHNOLOGIES
 
10 IN-FLIGHT CONTENT MARKET, BY PLATFORM (Page No. - 91)
     10.1 INTRODUCTION 
     10.2 COMMERCIAL AVIATION 
             10.2.1 AVAILABILITY OF HIGH-QUALITY IN-FLIGHT CONTENT OFFERINGS
     10.3 BUSINESS AVIATION 
             10.3.1 FOCUS ON HIGH-SPEED, LOW-LATENCY INTERNET SERVICES
 
11 IN-FLIGHT CONTENT MARKET, BY REGION (Page No. - 94)
     11.1 INTRODUCTION 
     11.2 NORTH AMERICA 
             11.2.1 RECESSION IMPACT ANALYSIS
             11.2.2 PESTLE ANALYSIS
             11.2.3 US
                        11.2.3.1 Strategic partnerships between airlines and content providers to drive market
             11.2.4 CANADA
                        11.2.4.1 Commitment to enhancing passenger experience to drive market
     11.3 EUROPE 
             11.3.1 RECESSION IMPACT ANALYSIS
             11.3.2 PESTLE ANALYSIS
             11.3.3 UK
                        11.3.3.1 Strategic developments in in-flight content to drive market
             11.3.4 GERMANY
                        11.3.4.1 Increasing adoption of wireless streaming solutions to drive market
             11.3.5 FRANCE
                        11.3.5.1 Collaborations between industry leaders to drive market
             11.3.6 ITALY
                        11.3.6.1 Cultural enrichment by airlines to drive market
             11.3.7 SPAIN
                        11.3.7.1 Rising passenger demand for personalized entertainment to drive market
             11.3.8 REST OF EUROPE
     11.4 ASIA PACIFIC 
             11.4.1 RECESSION IMPACT ANALYSIS
             11.4.2 PESTLE ANALYSIS
             11.4.3 CHINA
                        11.4.3.1 Focus on providing high-quality entertainment experience to drive market
             11.4.4 INDIA
                        11.4.4.1 Diverse cultural preferences to drive market
             11.4.5 JAPAN
                        11.4.5.1 Presence of prominent anime and gaming industries to drive market
             11.4.6 SOUTH KOREA
                        11.4.6.1 Growing popularity of K-wave content to drive market
             11.4.7 AUSTRALIA
                        11.4.7.1 Developments in satellite connectivity to drive market
             11.4.8 REST OF ASIA PACIFIC
     11.5 MIDDLE EAST 
             11.5.1 RECESSION IMPACT ANALYSIS
             11.5.2 PESTLE ANALYSIS
             11.5.3 GULF COOPERATION COUNCIL (GCC)
                        11.5.3.1 UAE
                                     11.5.3.1.1 Growing preferences for regional content to drive market
                        11.5.3.2 Saudi Arabia
                                     11.5.3.2.1 Increasing integration of interactive features to drive market
                        11.5.3.3 Qatar
                                     11.5.3.3.1 Luxury travel offerings to drive market
             11.5.4 TURKEY
                        11.5.4.1 Government initiatives to promote local content creation to drive market
     11.6 REST OF THE WORLD 
             11.6.1 RECESSION IMPACT ANALYSIS
             11.6.2 PESTLE ANALYSIS
             11.6.3 BRAZIL
                        11.6.3.1 Strategic initiatives from domestic airlines to drive market
             11.6.4 MEXICO
                        11.6.4.1 Localization through partnerships with domestic content providers to drive market
             11.6.5 SOUTH AFRICA
                        11.6.5.1 Innovations in cost-effective in-flight content solutions to drive market
             11.6.6 OTHERS
 
12 COMPETITIVE LANDSCAPE (Page No. - 153)
     12.1 INTRODUCTION 
     12.2 KEY PLAYER STRATEGIES/RIGHT TO WIN, 2020–2024 
     12.3 MARKET RANKING ANALYSIS, 2023 
     12.4 REVENUE ANALYSIS, 2020–2023 
     12.5 MARKET SHARE ANALYSIS, 2023 
     12.6 COMPANY EVALUATION MATRIX: KEY PLAYERS, 2023 
             12.6.1 STARS
             12.6.2 EMERGING LEADERS
             12.6.3 PERVASIVE PLAYERS
             12.6.4 PARTICIPANTS
             12.6.5 COMPANY FOOTPRINT
     12.7 COMPANY EVALUATION MATRIX: START-UPS/SMES, 2023 
             12.7.1 PROGRESSIVE COMPANIES
             12.7.2 RESPONSIVE COMPANIES
             12.7.3 DYNAMIC COMPANIES
             12.7.4 STARTING BLOCKS
             12.7.5 COMPETITIVE BENCHMARKING
     12.8 BRAND/PRODUCT COMPARISON 
     12.9 COMPETITIVE SCENARIO AND TRENDS 
             12.9.1 SERVICE LAUNCHES
             12.9.2 DEALS
             12.9.3 OTHERS
 
13 COMPANY PROFILES (Page No. - 181)
     13.1 KEY PLAYERS 
             13.1.1 PANASONIC AVIONICS CORPORATION
                        13.1.1.1 Business overview
                        13.1.1.2 Services/Solutions offered
                        13.1.1.3 Recent developments
                        13.1.1.4 MnM view
                                     13.1.1.4.1 Key strengths
                                     13.1.1.4.2 Strategic choices
                                     13.1.1.4.3 Weaknesses and competitive threats
             13.1.2 ANUVU
                        13.1.2.1 Business overview
                        13.1.2.2 Services/Solutions offered
                        13.1.2.3 Recent developments
                        13.1.2.4 MnM view
                                     13.1.2.4.1 Key strengths
                                     13.1.2.4.2 Strategic choices
                                     13.1.2.4.3 Weaknesses and competitive threats
             13.1.3 COLLINS AEROSPACE
                        13.1.3.1 Business overview
                        13.1.3.2 Services/Solutions offered
                        13.1.3.3 MnM view
                                     13.1.3.3.1 Key strengths
                                     13.1.3.3.2 Strategic choices
                                     13.1.3.3.3 Weaknesses and competitive threats
             13.1.4 ASTRONICS CORPORATION
                        13.1.4.1 Business overview
                        13.1.4.2 Services/Solutions offered
                        13.1.4.3 MnM view
                                     13.1.4.3.1 Key strengths
                                     13.1.4.3.2 Strategic choices
                                     13.1.4.3.3 Weaknesses and competitive threats
             13.1.5 THALES
                        13.1.5.1 Business overview
                        13.1.5.2 Services/Solutions offered
                        13.1.5.3 Recent developments
                        13.1.5.4 MnM view
                                     13.1.5.4.1 Key strengths
                                     13.1.5.4.2 Strategic choices
                                     13.1.5.4.3 Weaknesses and competitive threats
             13.1.6 VIASAT, INC.
                        13.1.6.1 Business overview
                        13.1.6.2 Services/Solutions offered
                        13.1.6.3 Recent developments
             13.1.7 GOGO BUSINESS AVIATION, LLC
                        13.1.7.1 Business overview
                        13.1.7.2 Services/Solutions offered
                        13.1.7.3 Recent developments
             13.1.8 DISPLAY INTERACTIVE
                        13.1.8.1 Business overview
                        13.1.8.2 Services/Solutions offered
                        13.1.8.3 Recent developments
             13.1.9 IDEANOVA TECHNOLOGIES, INC.
                        13.1.9.1 Business overview
                        13.1.9.2 Services/Solutions offered
             13.1.10 STELLAR GROUP PTY LTD.
                        13.1.10.1 Business overview
                        13.1.10.2 Services/Solutions offered
                        13.1.10.3 Recent developments
             13.1.11 KINAI INFOTECH LLP
                        13.1.11.1 Business overview
                        13.1.11.2 Services/Solutions offered
             13.1.12 AEROPLAY ENTERTAINMENT
                        13.1.12.1 Business overview
                        13.1.12.2 Services/Solutions offered
                        13.1.12.3 Recent developments
             13.1.13 BURRANA
                        13.1.13.1 Business overview
                        13.1.13.2 Services/Solutions offered
                        13.1.13.3 Recent developments
             13.1.14 IMMFLY
                        13.1.14.1 Business overview
                        13.1.14.2 Services/Solutions offered
                        13.1.14.3 Recent developments
             13.1.15 AIRFI
                        13.1.15.1 Business overview
                        13.1.15.2 Services/Solutions offered
                        13.1.15.3 Recent developments
     13.2 OTHER PLAYERS 
             13.2.1 APIOS
             13.2.2 TOUCH IN-FLIGHT SOLUTIONS, INC.
             13.2.3 IMAGES IN MOTION
             13.2.4 MOMENT
             13.2.5 MAXPOSURE LIMITED
             13.2.6 SPAFAX
             13.2.7 AXINOM
             13.2.8 PXCOM
             13.2.9 WEST ENTERTAINMENT
             13.2.10 DIGECOR, INC.
 
14 APPENDIX (Page No. - 225)
     14.1 DISCUSSION GUIDE 
     14.2 OTHER MAPPED COMPANIES 
     14.3 KNOWLEDGESTORE: MARKETSANDMARKETS’ SUBSCRIPTION PORTAL 
     14.4 CUSTOMIZATION OPTIONS 
     14.5 RELATED REPORTS 
     14.6 AUTHOR DETAILS 
 
LIST OF TABLES (235 TABLES)
 
TABLE 1 INCLUSIONS AND EXCLUSIONS
TABLE 2 USD EXCHANGE RATES
TABLE 3 IN-FLIGHT CONTENT OFFERED BY AIRLINES
TABLE 4 ROLE OF COMPANIES IN ECOSYSTEM
TABLE 5 BUSINESS MODELS
TABLE 6 ANALYSIS OF CONTENT DELIVERY TECHNOLOGIES
TABLE 7 ANALYSIS OF CONTENT MANAGEMENT AND ACCESS TECHNOLOGIES
TABLE 8 NORTH AMERICA: REGULATORY BODIES, GOVERNMENT AGENCIES, AND OTHER ORGANIZATIONS
TABLE 9 EUROPE: REGULATORY BODIES, GOVERNMENT AGENCIES, AND OTHER ORGANIZATIONS
TABLE 10 ASIA PACIFIC: REGULATORY BODIES, GOVERNMENT AGENCIES, AND OTHER ORGANIZATIONS
TABLE 11 REST OF THE WORLD: REGULATORY BODIES, GOVERNMENT AGENCIES, AND OTHER ORGANIZATIONS
TABLE 12 INFLUENCE OF STAKEHOLDERS ON BUYING PROCESS, BY PLATFORM (%)
TABLE 13 KEY BUYING CRITERIA, BY PLATFORM
TABLE 14 INDICATIVE PRICING ANALYSIS, BY END USER, 2023 (USD)
TABLE 15 NEW AIRCRAFT ORDERS, BY OEM (UNITS) 2023–2024
TABLE 16 NEW AIRCRAFT ORDERS, BY AIRCRAFT TYPE (UNITS) 2023–2024
TABLE 17 YOY PENETRATION OF IN-FLIGHT CONTENT INTO ACTIVE AIRCRAFT FLEET
TABLE 18 KEY CONFERENCES AND EVENTS, 2024–2025
TABLE 19 PATENT ANALYSIS
TABLE 20 IN-FLIGHT CONTENT MARKET, BY TYPE, 2020–2023 (USD MILLION)
TABLE 21 IN-FLIGHT CONTENT MARKET, BY TYPE, 2024–2029 (USD MILLION)
TABLE 22 IN-FLIGHT CONTENT MARKET, BY ACCESS, 2020–2023 (USD MILLION)
TABLE 23 IN-FLIGHT CONTENT MARKET, BY ACCESS, 2024–2029 (USD MILLION)
TABLE 24 IN-FLIGHT CONTENT MARKET, BY OPERATION, 2020–2023 (USD MILLION)
TABLE 25 IN-FLIGHT CONTENT MARKET, BY OPERATION, 2024–2029 (USD MILLION)
TABLE 26 IN-FLIGHT CONTENT MARKET, BY PLATFORM, 2020–2023 (USD MILLION)
TABLE 27 IN-FLIGHT CONTENT MARKET, BY PLATFORM, 2024–2029 (USD MILLION)
TABLE 28 IN-FLIGHT CONTENT MARKET, BY REGION, 2020–2023 (USD MILLION)
TABLE 29 IN-FLIGHT CONTENT MARKET, BY REGION, 2024–2029 (USD MILLION)
TABLE 30 NORTH AMERICA: IN-FLIGHT CONTENT MARKET, BY COUNTRY, 2020–2023 (USD MILLION)
TABLE 31 NORTH AMERICA: IN-FLIGHT CONTENT MARKET, BY COUNTRY, 2024–2029 (USD MILLION)
TABLE 32 NORTH AMERICA: IN-FLIGHT CONTENT MARKET, BY TYPE, 2020–2023 (USD MILLION)
TABLE 33 NORTH AMERICA: IN-FLIGHT CONTENT MARKET, BY TYPE, 2024–2029 (USD MILLION)
TABLE 34 NORTH AMERICA: IN-FLIGHT CONTENT MARKET, BY ACCESS, 2020–2023 (USD MILLION)
TABLE 35 NORTH AMERICA: IN-FLIGHT CONTENT MARKET, BY ACCESS, 2024–2029 (USD MILLION)
TABLE 36 NORTH AMERICA: IN-FLIGHT CONTENT MARKET, BY OPERATION, 2020–2023 (USD MILLION)
TABLE 37 NORTH AMERICA: IN-FLIGHT CONTENT MARKET, BY OPERATION, 2024–2029 (USD MILLION)
TABLE 38 NORTH AMERICA: IN-FLIGHT CONTENT MARKET, BY PLATFORM, 2020–2023 (USD MILLION)
TABLE 39 NORTH AMERICA: IN-FLIGHT CONTENT MARKET, BY PLATFORM, 2024–2029 (USD MILLION)
TABLE 40 US: IN-FLIGHT CONTENT MARKET, BY TYPE, 2020–2023 (USD MILLION)
TABLE 41 US: IN-FLIGHT CONTENT MARKET, BY TYPE, 2024–2029 (USD MILLION)
TABLE 42 US: IN-FLIGHT CONTENT MARKET, BY PLATFORM, 2020–2023 (USD MILLION)
TABLE 43 US: IN-FLIGHT CONTENT MARKET, BY PLATFORM, 2024–2029 (USD MILLION)
TABLE 44 CANADA: IN-FLIGHT CONTENT MARKET, BY TYPE, 2020–2023 (USD MILLION)
TABLE 45 CANADA: IN-FLIGHT CONTENT MARKET, BY TYPE, 2024–2029 (USD MILLION)
TABLE 46 CANADA: IN-FLIGHT CONTENT MARKET, BY PLATFORM, 2020–2023 (USD MILLION)
TABLE 47 CANADA: IN-FLIGHT CONTENT MARKET, BY PLATFORM, 2024–2029 (USD MILLION)
TABLE 48 EUROPE: IN-FLIGHT CONTENT MARKET, BY COUNTRY, 2020–2023 (USD MILLION)
TABLE 49 EUROPE: IN-FLIGHT CONTENT MARKET, BY COUNTRY, 2024–2029 (USD MILLION)
TABLE 50 EUROPE: IN-FLIGHT CONTENT MARKET, BY TYPE, 2020–2023 (USD MILLION)
TABLE 51 EUROPE: IN-FLIGHT CONTENT MARKET, BY TYPE, 2024–2029 (USD MILLION)
TABLE 52 EUROPE: IN-FLIGHT CONTENT MARKET, BY ACCESS, 2020–2023 (USD MILLION)
TABLE 53 EUROPE: IN-FLIGHT CONTENT MARKET, BY ACCESS, 2024–2029 (USD MILLION)
TABLE 54 EUROPE: IN-FLIGHT CONTENT MARKET, BY OPERATION, 2020–2023 (USD MILLION)
TABLE 55 EUROPE: IN-FLIGHT CONTENT MARKET, BY OPERATION, 2024–2029 (USD MILLION)
TABLE 56 EUROPE: IN-FLIGHT CONTENT MARKET, BY PLATFORM, 2020–2023 (USD MILLION)
TABLE 57 EUROPE: IN-FLIGHT CONTENT MARKET, BY PLATFORM, 2024–2029 (USD MILLION)
TABLE 58 UK: IN-FLIGHT CONTENT MARKET, BY TYPE, 2020–2023 (USD MILLION)
TABLE 59 UK: IN-FLIGHT CONTENT MARKET, BY TYPE, 2024–2029 (USD MILLION)
TABLE 60 UK: IN-FLIGHT CONTENT MARKET, BY PLATFORM, 2020–2023 (USD MILLION)
TABLE 61 UK: IN-FLIGHT CONTENT MARKET, BY PLATFORM, 2024–2029 (USD MILLION)
TABLE 62 GERMANY: IN-FLIGHT CONTENT MARKET, BY TYPE, 2020–2023 (USD MILLION)
TABLE 63 GERMANY: IN-FLIGHT CONTENT MARKET, BY TYPE, 2024–2029 (USD MILLION)
TABLE 64 GERMANY: IN-FLIGHT CONTENT MARKET, BY PLATFORM, 2020–2023 (USD MILLION)
TABLE 65 GERMANY: IN-FLIGHT CONTENT MARKET, BY PLATFORM, 2024–2029 (USD MILLION)
TABLE 66 FRANCE: IN-FLIGHT CONTENT MARKET, BY TYPE, 2020–2023 (USD MILLION)
TABLE 67 FRANCE: IN-FLIGHT CONTENT MARKET, BY TYPE, 2024–2029 (USD MILLION)
TABLE 68 FRANCE: IN-FLIGHT CONTENT MARKET, BY PLATFORM, 2020–2023 (USD MILLION)
TABLE 69 FRANCE: IN-FLIGHT CONTENT MARKET, BY PLATFORM, 2024–2029 (USD MILLION)
TABLE 70 ITALY: IN-FLIGHT CONTENT MARKET, BY TYPE, 2020–2023 (USD MILLION)
TABLE 71 ITALY: IN-FLIGHT CONTENT MARKET, BY TYPE, 2024–2029 (USD MILLION)
TABLE 72 ITALY: IN-FLIGHT CONTENT MARKET, BY PLATFORM, 2020–2023 (USD MILLION)
TABLE 73 ITALY: IN-FLIGHT CONTENT MARKET, BY PLATFORM, 2024–2029 (USD MILLION)
TABLE 74 SPAIN: IN-FLIGHT CONTENT MARKET, BY TYPE, 2020–2023 (USD MILLION)
TABLE 75 SPAIN: IN-FLIGHT CONTENT MARKET, BY TYPE, 2024–2029 (USD MILLION)
TABLE 76 SPAIN: IN-FLIGHT CONTENT MARKET, BY PLATFORM, 2020–2023 (USD MILLION)
TABLE 77 SPAIN: IN-FLIGHT CONTENT MARKET, BY PLATFORM, 2024–2029 (USD MILLION)
TABLE 78 REST OF EUROPE: IN-FLIGHT CONTENT MARKET, BY TYPE, 2020–2023 (USD MILLION)
TABLE 79 REST OF EUROPE: IN-FLIGHT CONTENT MARKET, BY TYPE, 2024–2029 (USD MILLION)
TABLE 80 REST OF EUROPE: IN-FLIGHT CONTENT MARKET, BY PLATFORM, 2020–2023 (USD MILLION)
TABLE 81 REST OF EUROPE: IN-FLIGHT CONTENT MARKET, BY PLATFORM, 2024–2029 (USD MILLION)
TABLE 82 ASIA PACIFIC: IN-FLIGHT CONTENT MARKET, BY COUNTRY, 2020–2023 (USD MILLION)
TABLE 83 ASIA PACIFIC: IN-FLIGHT CONTENT MARKET, BY COUNTRY, 2024–2029 (USD MILLION)
TABLE 84 ASIA PACIFIC: IN-FLIGHT CONTENT MARKET, BY TYPE, 2020–2023 (USD MILLION)
TABLE 85 ASIA PACIFIC: IN-FLIGHT CONTENT MARKET, BY TYPE, 2024–2029 (USD MILLION)
TABLE 86 ASIA PACIFIC: IN-FLIGHT CONTENT MARKET, BY ACCESS, 2020–2023 (USD MILLION)
TABLE 87 ASIA PACIFIC: IN-FLIGHT CONTENT MARKET, BY ACCESS, 2024–2029 (USD MILLION)
TABLE 88 ASIA PACIFIC: IN-FLIGHT CONTENT MARKET, BY OPERATION, 2020–2023 (USD MILLION)
TABLE 89 ASIA PACIFIC: IN-FLIGHT CONTENT MARKET, BY OPERATION, 2024–2029 (USD MILLION)
TABLE 90 ASIA PACIFIC: IN-FLIGHT CONTENT MARKET, BY PLATFORM, 2020–2023 (USD MILLION)
TABLE 91 ASIA PACIFIC: IN-FLIGHT CONTENT MARKET, BY PLATFORM, 2024–2029 (USD MILLION)
TABLE 92 CHINA: IN-FLIGHT CONTENT MARKET, BY TYPE, 2020–2023 (USD MILLION)
TABLE 93 CHINA: IN-FLIGHT CONTENT MARKET, BY TYPE, 2024–2029 (USD MILLION)
TABLE 94 CHINA: IN-FLIGHT CONTENT MARKET, BY PLATFORM, 2020–2023 (USD MILLION)
TABLE 95 CHINA: IN-FLIGHT CONTENT MARKET, BY PLATFORM, 2024–2029 (USD MILLION)
TABLE 96 INDIA: IN-FLIGHT CONTENT MARKET, BY TYPE, 2020–2023 (USD MILLION)
TABLE 97 INDIA: IN-FLIGHT CONTENT MARKET, BY TYPE, 2024–2029 (USD MILLION)
TABLE 98 INDIA: IN-FLIGHT CONTENT MARKET, BY PLATFORM, 2020–2023 (USD MILLION)
TABLE 99 INDIA: IN-FLIGHT CONTENT MARKET, BY PLATFORM, 2024–2029 (USD MILLION)
TABLE 100 JAPAN: IN-FLIGHT CONTENT MARKET, BY TYPE, 2020–2023 (USD MILLION)
TABLE 101 JAPAN: IN-FLIGHT CONTENT MARKET, BY TYPE, 2024–2029 (USD MILLION)
TABLE 102 JAPAN: IN-FLIGHT CONTENT MARKET, BY PLATFORM, 2020–2023 (USD MILLION)
TABLE 103 JAPAN: IN-FLIGHT CONTENT MARKET, BY PLATFORM, 2024–2029 (USD MILLION)
TABLE 104 SOUTH KOREA: IN-FLIGHT CONTENT MARKET, BY TYPE, 2020–2023 (USD MILLION)
TABLE 105 SOUTH KOREA: IN-FLIGHT CONTENT MARKET, BY TYPE, 2024–2029 (USD MILLION)
TABLE 106 SOUTH KOREA: IN-FLIGHT CONTENT MARKET, BY PLATFORM, 2020–2023 (USD MILLION)
TABLE 107 SOUTH KOREA: IN-FLIGHT CONTENT MARKET, BY PLATFORM, 2024–2029 (USD MILLION)
TABLE 108 AUSTRALIA: IN-FLIGHT CONTENT MARKET, BY TYPE, 2020–2023 (USD MILLION)
TABLE 109 AUSTRALIA: IN-FLIGHT CONTENT MARKET, BY TYPE, 2024–2029 (USD MILLION)
TABLE 110 AUSTRALIA: IN-FLIGHT CONTENT MARKET, BY PLATFORM, 2020–2023 (USD MILLION)
TABLE 111 AUSTRALIA: IN-FLIGHT CONTENT MARKET, BY PLATFORM, 2024–2029 (USD MILLION)
TABLE 112 REST OF ASIA PACIFIC: IN-FLIGHT CONTENT MARKET, BY TYPE, 2020–2023 (USD MILLION)
TABLE 113 REST OF ASIA PACIFIC: IN-FLIGHT CONTENT MARKET, BY TYPE, 2024–2029 (USD MILLION)
TABLE 114 REST OF ASIA PACIFIC: IN-FLIGHT CONTENT MARKET, BY PLATFORM, 2020–2023 (USD MILLION)
TABLE 115 REST OF ASIA PACIFIC: IN-FLIGHT CONTENT MARKET, BY PLATFORM, 2024–2029 (USD MILLION)
TABLE 116 MIDDLE EAST: IN-FLIGHT CONTENT MARKET, BY COUNTRY, 2020–2023 (USD MILLION)
TABLE 117 MIDDLE EAST: IN-FLIGHT CONTENT MARKET, BY COUNTRY, 2024–2029 (USD MILLION)
TABLE 118 MIDDLE EAST: IN-FLIGHT CONTENT MARKET, BY TYPE, 2020–2023 (USD MILLION)
TABLE 119 MIDDLE EAST: IN-FLIGHT CONTENT MARKET, BY TYPE, 2024–2029 (USD MILLION)
TABLE 120 MIDDLE EAST: IN-FLIGHT CONTENT MARKET, BY ACCESS, 2020–2023 (USD MILLION)
TABLE 121 MIDDLE EAST: IN-FLIGHT CONTENT MARKET, BY ACCESS, 2024–2029 (USD MILLION)
TABLE 122 MIDDLE EAST: IN-FLIGHT CONTENT MARKET, BY OPERATION, 2020–2023 (USD MILLION)
TABLE 123 MIDDLE EAST: IN-FLIGHT CONTENT MARKET, BY OPERATION, 2024–2029 (USD MILLION)
TABLE 124 MIDDLE EAST: IN-FLIGHT CONTENT MARKET, BY PLATFORM, 2020–2023 (USD MILLION)
TABLE 125 MIDDLE EAST: IN-FLIGHT CONTENT MARKET, BY PLATFORM, 2024–2029 (USD MILLION)
TABLE 126 UAE: IN-FLIGHT CONTENT MARKET, BY TYPE, 2020–2023 (USD MILLION)
TABLE 127 UAE: IN-FLIGHT CONTENT MARKET, BY TYPE, 2024–2029 (USD MILLION)
TABLE 128 UAE: IN-FLIGHT CONTENT MARKET, BY PLATFORM, 2020–2023 (USD MILLION)
TABLE 129 UAE: IN-FLIGHT CONTENT MARKET, BY PLATFORM, 2024–2029 (USD MILLION)
TABLE 130 SAUDI ARABIA: IN-FLIGHT CONTENT MARKET, BY TYPE, 2020–2023 (USD MILLION)
TABLE 131 SAUDI ARABIA: IN-FLIGHT CONTENT MARKET, BY TYPE, 2024–2029 (USD MILLION)
TABLE 132 SAUDI ARABIA: IN-FLIGHT CONTENT MARKET, BY PLATFORM, 2020–2023 (USD MILLION)
TABLE 133 SAUDI ARABIA: IN-FLIGHT CONTENT MARKET, BY PLATFORM, 2024–2029 (USD MILLION)
TABLE 134 QATAR: IN-FLIGHT CONTENT MARKET, BY TYPE, 2020–2023 (USD MILLION)
TABLE 135 QATAR: IN-FLIGHT CONTENT MARKET, BY TYPE, 2024–2029 (USD MILLION)
TABLE 136 QATAR: IN-FLIGHT CONTENT MARKET, BY PLATFORM, 2020–2023 (USD MILLION)
TABLE 137 QATAR: IN-FLIGHT CONTENT MARKET, BY PLATFORM, 2024–2029 (USD MILLION)
TABLE 138 TURKEY: IN-FLIGHT CONTENT MARKET, BY TYPE, 2020–2023 (USD MILLION)
TABLE 139 TURKEY: IN-FLIGHT CONTENT MARKET, BY TYPE, 2024–2029 (USD MILLION)
TABLE 140 TURKEY: IN-FLIGHT CONTENT MARKET, BY PLATFORM, 2020–2023 (USD MILLION)
TABLE 141 TURKEY: IN-FLIGHT CONTENT MARKET, BY PLATFORM, 2024–2029 (USD MILLION)
TABLE 142 REST OF THE WORLD: IN-FLIGHT CONTENT MARKET, BY COUNTRY, 2020–2023 (USD MILLION)
TABLE 143 REST OF THE WORLD: IN-FLIGHT CONTENT MARKET, BY COUNTRY, 2024–2029 (USD MILLION)
TABLE 144 REST OF THE WORLD: IN-FLIGHT CONTENT MARKET, BY TYPE, 2020–2023 (USD MILLION)
TABLE 145 REST OF THE WORLD: IN-FLIGHT CONTENT MARKET, BY TYPE, 2024–2029 (USD MILLION)
TABLE 146 REST OF THE WORLD: IN-FLIGHT CONTENT MARKET, BY ACCESS, 2020–2023 (USD MILLION)
TABLE 147 REST OF THE WORLD: IN-FLIGHT CONTENT MARKET, BY ACCESS, 2024–2029 (USD MILLION)
TABLE 148 REST OF THE WORLD: IN-FLIGHT CONTENT MARKET, BY OPERATION, 2020–2023 (USD MILLION)
TABLE 149 REST OF THE WORLD: IN-FLIGHT CONTENT MARKET, BY OPERATION, 2024–2029 (USD MILLION)
TABLE 150 REST OF THE WORLD: IN-FLIGHT CONTENT MARKET, BY PLATFORM, 2020–2023 (USD MILLION)
TABLE 151 REST OF THE WORLD: IN-FLIGHT CONTENT MARKET, BY PLATFORM, 2024–2029 (USD MILLION)
TABLE 152 BRAZIL: IN-FLIGHT CONTENT MARKET, BY TYPE, 2020–2023 (USD MILLION)
TABLE 153 BRAZIL: IN-FLIGHT CONTENT MARKET, BY TYPE, 2024–2029 (USD MILLION)
TABLE 154 BRAZIL: IN-FLIGHT CONTENT MARKET, BY PLATFORM, 2020–2023 (USD MILLION)
TABLE 155 BRAZIL: IN-FLIGHT CONTENT MARKET, BY PLATFORM, 2024–2029 (USD MILLION)
TABLE 156 MEXICO: IN-FLIGHT CONTENT MARKET, BY TYPE, 2020–2023 (USD MILLION)
TABLE 157 MEXICO: IN-FLIGHT CONTENT MARKET, BY TYPE, 2024–2029 (USD MILLION)
TABLE 158 MEXICO: IN-FLIGHT CONTENT MARKET, BY PLATFORM, 2020–2023 (USD MILLION)
TABLE 159 MEXICO: IN-FLIGHT CONTENT MARKET, BY PLATFORM, 2024–2029 (USD MILLION)
TABLE 160 SOUTH AFRICA: IN-FLIGHT CONTENT MARKET, BY TYPE, 2020–2023 (USD MILLION)
TABLE 161 SOUTH AFRICA: IN-FLIGHT CONTENT MARKET, BY TYPE, 2024–2029 (USD MILLION)
TABLE 162 SOUTH AFRICA: IN-FLIGHT CONTENT MARKET, BY PLATFORM, 2020–2023 (USD MILLION)
TABLE 163 SOUTH AFRICA: IN-FLIGHT CONTENT MARKET, BY PLATFORM, 2024–2029 (USD MILLION)
TABLE 164 OTHERS: IN-FLIGHT CONTENT MARKET, BY TYPE, 2020–2023 (USD MILLION)
TABLE 165 OTHERS: IN-FLIGHT CONTENT MARKET, BY TYPE, 2024–2029 (USD MILLION)
TABLE 166 OTHERS: IN-FLIGHT CONTENT MARKET, BY PLATFORM, 2020–2023 (USD MILLION)
TABLE 167 OTHERS: IN-FLIGHT CONTENT MARKET, BY PLATFORM, 2024–2029 (USD MILLION)
TABLE 168 KEY PLAYER STRATEGIES/RIGHT TO WIN, 2020–2024
TABLE 169 IN-FLIGHT CONTENT MARKET: DEGREE OF COMPETITION
TABLE 170 PLATFORM FOOTPRINT
TABLE 171 ACCESS FOOTPRINT
TABLE 172 REGION FOOTPRINT
TABLE 173 LIST OF START-UPS/SMES
TABLE 174 COMPETITIVE BENCHMARKING OF START-UPS/SMES
TABLE 175 IN-FLIGHT CONTENT MARKET: SERVICE LAUNCHES, 2020–2024
TABLE 176 IN-FLIGHT CONTENT MARKET: DEALS, 2020–2024
TABLE 177 IN-FLIGHT CONTENT MARKET: OTHERS, 2020–2024
TABLE 178 PANASONIC AVIONICS CORPORATION: COMPANY OVERVIEW
TABLE 179 PANASONIC AVIONICS CORPORATION: SERVICES/SOLUTIONS OFFERED
TABLE 180 PANASONIC AVIONICS CORPORATION: DEALS
TABLE 181 PANASONIC AVIONICS CORPORATION: OTHERS
TABLE 182 ANUVU: COMPANY OVERVIEW
TABLE 183 ANUVU: SERVICES/SOLUTIONS OFFERED
TABLE 184 ANUVU: DEALS
TABLE 185 ANUVU: OTHERS
TABLE 186 COLLINS AEROSPACE: COMPANY OVERVIEW
TABLE 187 COLLINS AEROSPACE: SERVICES/SOLUTIONS OFFERED
TABLE 188 ASTRONICS CORPORATION: COMPANY OVERVIEW
TABLE 189 ASTRONICS CORPORATION: SERVICES/SOLUTIONS OFFERED
TABLE 190 THALES: COMPANY OVERVIEW
TABLE 191 THALES: SERVICES/SOLUTIONS OFFERED
TABLE 192 THALES: DEALS
TABLE 193 THALES: OTHERS
TABLE 194 VIASAT, INC.: COMPANY OVERVIEW
TABLE 195 VIASAT, INC.: SERVICES/SOLUTIONS OFFERED
TABLE 196 VIASAT, INC.: DEALS
TABLE 197 VIASAT, INC.: OTHERS
TABLE 198 GOGO BUSINESS AVIATION, LLC: COMPANY OVERVIEW
TABLE 199 GOGO BUSINESS AVIATION, LLC: SERVICES/SOLUTIONS OFFERED
TABLE 200 GOGO BUSINESS AVIATION, LLC: SERVICE LAUNCHES
TABLE 201 DISPLAY INTERACTIVE: COMPANY OVERVIEW
TABLE 202 DISPLAY INTERACTIVE: SERVICES/SOLUTIONS OFFERED
TABLE 203 DISPLAY INTERACTIVE: OTHERS
TABLE 204 IDEANOVA TECHNOLOGIES, INC.: COMPANY OVERVIEW
TABLE 205 IDEANOVA TECHNOLOGIES, INC.: SERVICES/SOLUTIONS OFFERED
TABLE 206 STELLAR GROUP PTY LTD.: COMPANY OVERVIEW
TABLE 207 STELLAR GROUP PTY LTD.: SERVICES/SOLUTIONS OFFERED
TABLE 208 STELLAR GROUP PTY LTD.: DEALS
TABLE 209 KINAI INFOTECH LLP: COMPANY OVERVIEW
TABLE 210 KINAI INFOTECH LLP: SERVICES/SOLUTIONS OFFERED
TABLE 211 AEROPLAY ENTERTAINMENT: COMPANY OVERVIEW
TABLE 212 AEROPLAY ENTERTAINMENT: SERVICES/SOLUTIONS OFFERED
TABLE 213 AEROPLAY ENTERTAINMENT: DEALS
TABLE 214 AEROPLAY ENTERTAINMENT: OTHERS
TABLE 215 BURRANA: COMPANY OVERVIEW
TABLE 216 BURRANA: SERVICES/SOLUTIONS OFFERED
TABLE 217 BURRANA: SERVICE LAUNCHES
TABLE 218 IMMFLY: COMPANY OVERVIEW
TABLE 219 IMMFLY: SERVICES/SOLUTIONS OFFERED
TABLE 220 IMMFLY: DEALS
TABLE 221 IMMFLY: OTHERS
TABLE 222 AIRFI: COMPANY OVERVIEW
TABLE 223 AIRFI: SERVICES/SOLUTIONS OFFERED
TABLE 224 AIRFI: DEALS
TABLE 225 AIRFI: OTHERS
TABLE 226 APIOS: COMPANY OVERVIEW
TABLE 227 TOUCH IN-FLIGHT SOLUTIONS, INC.: COMPANY OVERVIEW
TABLE 228 IMAGES IN MOTION: COMPANY OVERVIEW
TABLE 229 MOMENT: COMPANY OVERVIEW
TABLE 230 MAXPOSURE LIMITED: COMPANY OVERVIEW
TABLE 231 SPAFAX: COMPANY OVERVIEW
TABLE 232 AXINOM: COMPANY OVERVIEW
TABLE 233 PXCOM: COMPANY OVERVIEW
TABLE 234 WEST ENTERTAINMENT: COMPANY OVERVIEW
TABLE 235 DIGECOR, INC.: COMPANY OVERVIEW
 
 
LIST OF FIGURES (55 FIGURES)
 
FIGURE 1 IN-FLIGHT CONTENT MARKET SEGMENTATION
FIGURE 2 RESEARCH DESIGN MODEL
FIGURE 3 RESEARCH DESIGN
FIGURE 4 GLOBAL PASSENGER TRAFFIC, 2015–2030
FIGURE 5 G7 AND BRIC SHARE OF GLOBAL GDP, 1997 VS. 2010 VS. 2023
FIGURE 6 BOTTOM-UP APPROACH
FIGURE 7 TOP-DOWN APPROACH
FIGURE 8 DATA TRIANGULATION
FIGURE 9 IN-FLIGHT CONTENT MARKET, BY TYPE, 2024–2029
FIGURE 10 IN-FLIGHT CONTENT MARKET, BY ACCESS, 2024–2029
FIGURE 11 IN-FLIGHT CONTENT MARKET, BY OPERATION, 2024–2029
FIGURE 12 IN-FLIGHT CONTENT MARKET, BY PLATFORM, 2024–2029
FIGURE 13 IN-FLIGHT CONTENT MARKET, BY REGION, 2024–2029
FIGURE 14 INCREASING AIR PASSENGER TRAFFIC TO DRIVE MARKET
FIGURE 15 MOVIE SEGMENT TO BE DOMINANT DURING FORECAST PERIOD
FIGURE 16 PORTABLE DEVICE SEGMENT TO HOLD HIGHER SHARE DURING FORECAST PERIOD
FIGURE 17 STORED SEGMENT TO BE LARGER THAN STREAMED SEGMENT DURING FORECAST PERIOD
FIGURE 18 COMMERCIAL AVIATION TO SECURE LEADING MARKET POSITION DURING FORECAST PERIOD
FIGURE 19 SAUDI ARABIA TO BE FASTEST-GROWING MARKET FOR IN-FLIGHT CONTENT DURING FORECAST PERIOD
FIGURE 20 IN-FLIGHT CONTENT MARKET DYNAMICS
FIGURE 21 TRENDS AND DISRUPTIONS IMPACTING CUSTOMERS’ BUSINESSES
FIGURE 22 ECOSYSTEM ANALYSIS
FIGURE 23 VALUE CHAIN ANALYSIS
FIGURE 24 BUSINESS MODELS
FIGURE 25 IMPORT DATA, BY COUNTRY, 2019–2022 (USD THOUSAND)
FIGURE 26 EXPORT DATA, BY COUNTRY, 2019–2022 (USD THOUSAND)
FIGURE 27 INFLUENCE OF STAKEHOLDERS ON BUYING PROCESS, BY PLATFORM
FIGURE 28 KEY BUYING CRITERIA, BY PLATFORM
FIGURE 29 NEW AIRCRAFT ORDERS, BY OEM
FIGURE 30 NEW AIRCRAFT ORDERS, BY AIRCRAFT TYPE
FIGURE 31 TECHNOLOGY TRENDS IN IN-FLIGHT CONTENT MARKET
FIGURE 32 SUPPLY CHAIN ANALYSIS
FIGURE 33 PATENT ANALYSIS
FIGURE 34 MOVIE TO BE LARGEST SEGMENT DURING FORECAST PERIOD
FIGURE 35 PORTABLE DEVICE TO BE LARGEST SEGMENT DURING FORECAST PERIOD
FIGURE 36 STORED TO BE LARGEST SEGMENT DURING FORECAST PERIOD
FIGURE 37 COMMERCIAL AVIATION TO BE LARGEST SEGMENT DURING FORECAST PERIOD
FIGURE 38 NORTH AMERICA TO BE LARGEST MARKET FOR IN-FLIGHT CONTENT DURING FORECAST PERIOD
FIGURE 39 NORTH AMERICA: IN-FLIGHT CONTENT MARKET SNAPSHOT
FIGURE 40 EUROPE: IN-FLIGHT CONTENT MARKET SNAPSHOT
FIGURE 41 ASIA PACIFIC: IN-FLIGHT CONTENT MARKET SNAPSHOT
FIGURE 42 MIDDLE EAST: IN-FLIGHT CONTENT MARKET SNAPSHOT
FIGURE 43 MARKET RANKING OF KEY PLAYERS, 2023
FIGURE 44 REVENUE ANALYSIS OF TOP FIVE PLAYERS, 2020–2023
FIGURE 45 MARKET SHARE ANALYSIS OF KEY PLAYERS, 2023
FIGURE 46 COMPANY EVALUATION MATRIX (KEY PLAYERS), 2023
FIGURE 47 COMPANY FOOTPRINT
FIGURE 48 COMPANY EVALUATION MATRIX (START-UPS/SMES), 2023
FIGURE 49 BRAND/PRODUCT COMPARISON
FIGURE 50 PANASONIC AVIONICS CORPORATION: COMPANY SNAPSHOT
FIGURE 51 COLLINS AEROSPACE: COMPANY SNAPSHOT
FIGURE 52 ASTRONICS CORPORATION: COMPANY SNAPSHOT
FIGURE 53 THALES: COMPANY SNAPSHOT
FIGURE 54 VIASAT, INC: COMPANY SNAPSHOT
FIGURE 55 GOGO BUSINESS AVIATION, LLC: COMPANY SNAPSHOT


This research study involved the extensive use of secondary sources, directories, and databases, such as the International Air Transport Association (IATA), Federal Aviation Administration (FAA), and CAPA- Center for Aviation to identify and collect relevant information on the in-flight content market. The primary sources included industry experts from the concerned market, preferred suppliers, manufacturers, solution providers, technology developers, alliances, and organizations related to all segments of the industry’s value chain. All primary sources were interviewed to obtain and verify critical qualitative and quantitative information as well as to assess the prospects of the market.

Secondary Research

The market share of the companies offering in-flight content for airlines was procured based on the secondary data available through paid and unpaid sources and by analyzing the product portfolios of major companies and rating them based on their performance and quality. In the secondary research process, sources such as corporate filings; annual reports, press releases, and investor presentations of companies; white papers, journals, and certified publications; articles by recognized authors; and directories & databases were used to identify and collect information for this study.

Secondary research was mainly used to obtain key information about the industry's value and supply chain. The method was also used to identify the essential players by various products, market classifications, and segmentations according to their offerings. Secondary information helped to understand the industry trends related to the type, access, operation, platform and critical developments from the market and technology-oriented perspectives.

Primary Research

Extensive primary research was conducted after obtaining information about the current scenario of the inflight content market through secondary research. Several primary interviews were conducted with market experts from both demand and supply sides across North America, Europe, Asia Pacific, Middle East and Rest of the World. This primary data was collected through questionnaires, emails, and telephonic interviews. Primary sources from the supply side included various industry experts, such as chief experience officers (CXOs), vice presidents (VPs), directors from business development, marketing, and product development/innovation teams, related key executives from airline cloud providers, independent aviation consultants, aircraft manufactures, integrators and inflight content providers. Interviews were conducted to gather insights such as market statistics, data on revenue collected from the products & services, market breakdowns, market size estimations, market forecasting, and data triangulation. Primary research also helped understand trends related to type, access operation, platform and region.

In-flight Content Market
 Size, and Share

To know about the assumptions considered for the study, download the pdf brochure

Market Size Estimation

Both top-down and bottom-up approaches were used to estimate and validate the size of the in-flight content market. The research methodology used to estimate the market size also included the following details:

  • The key players were identified through secondary research, and their market ranking was determined through primary and secondary research. This included a study of the annual and financial reports of the top market players and extensive interviews of leaders, including chief executive officers (CEOs), directors, and marketing executives.
  • All percentage shares, splits, and breakdowns were determined using secondary sources and verified through primary sources. All possible parameters that affect the markets covered in this research study were accounted for, viewed in extensive detail, verified through primary research, and analyzed to obtain the final quantitative and qualitative data. This data was consolidated, enhanced with detailed inputs, analyzed by MarketsandMarkets, and presented in this report.

Bottom-Up Approach

The bottom-up approach was employed to arrive at the overall size of the in-flight content market. The growth in the penetration of in-flight content has been tracked through primary avenue such as penetration of Inflight content in the current fleet of aircraft.

In-flight Content Market
 Size, and Bottom-Up Approach

Top-Down Approach

In the top-down approach, the size of the in-flight content market was used to estimate the size of individual markets (mentioned in the market segmentation) through percentage splits from secondary and primary research. For the calculation of the sizes of specific segments, the size of the most appropriate immediate parent market was used to implement the top-down approach.

In-flight Content Market
 Size, and Top-Down Approach

Data triangulation

After arriving at the overall size of the in-flight content market from the market size estimation process explained above, the total market was split into several segments and subsegments. The data triangulation and market breakdown procedures explained below were implemented, wherever applicable, to complete the overall market engineering process and arrive at the estimated sizes of different market segments and subsegments. The data was triangulated by studying various factors and trends from both the demand and supply sides. Additionally, the market size was validated using both the top-down and bottom-up approaches.

Market Definition

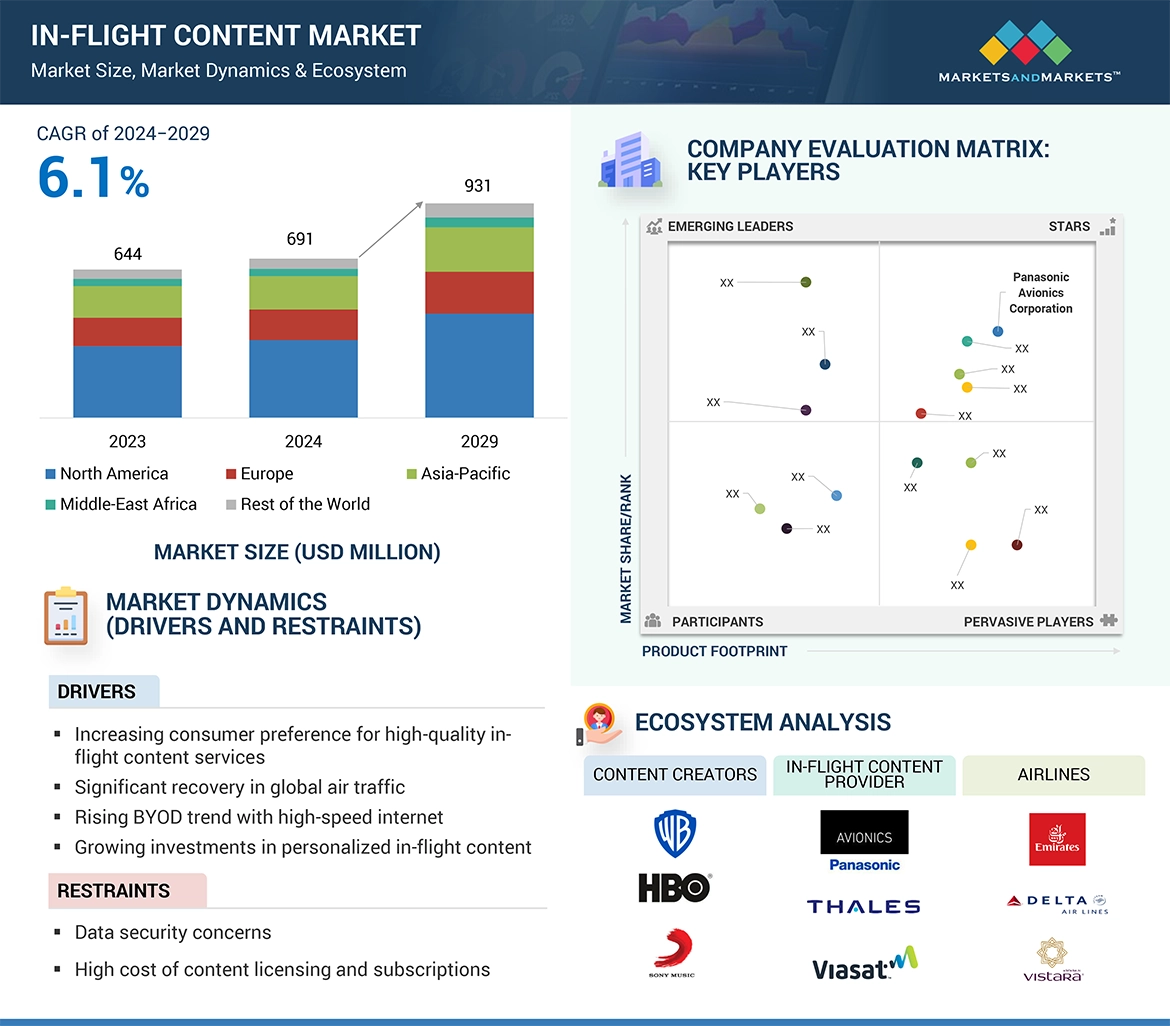
In-flight content refers to a wide range of multimedia entertainment options available for passengers during air travel, including movies, TV shows, music, audiobooks, podcasts, and interactive games, all accessible through the aircraft's in-flight entertainment system. This content selection by airlines aims to enhance the passenger experience during long flights and provide relaxation. In-flight content allows passengers to engage in entertainment and interactive digital games of various genres, from puzzles to immersive adventures, catering to diverse demographics and preferences of different age groups. Airlines invest in sourcing and curating high-quality content to differentiate their services, grow customer loyalty, and elevate the overall in-flight experience for travelers.
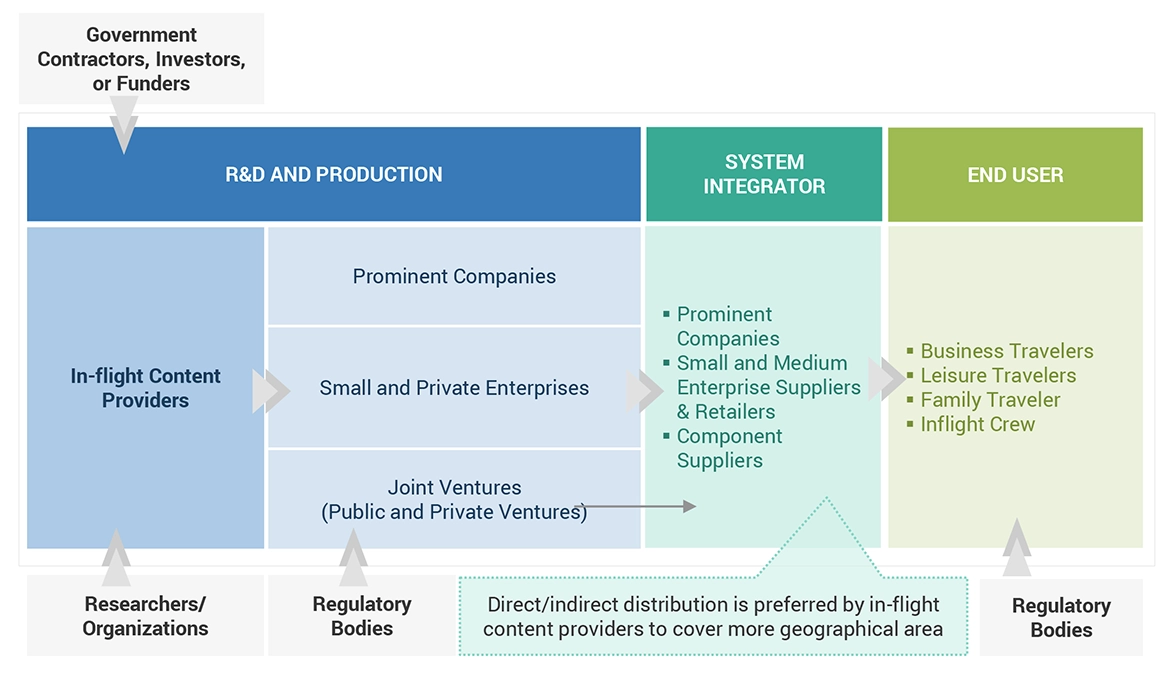
Stakeholders

Various stakeholders of the market are listed below:

  • Airlines
  • In-flight Content Providers
  • Internet Service Providers
  • Satellite Operators
  • Aircraft Manufacturers
  • Regulatory Bodies
  • Technology Providers
  • Content Providers
  • Investors
  • Passengers

Report Objectives

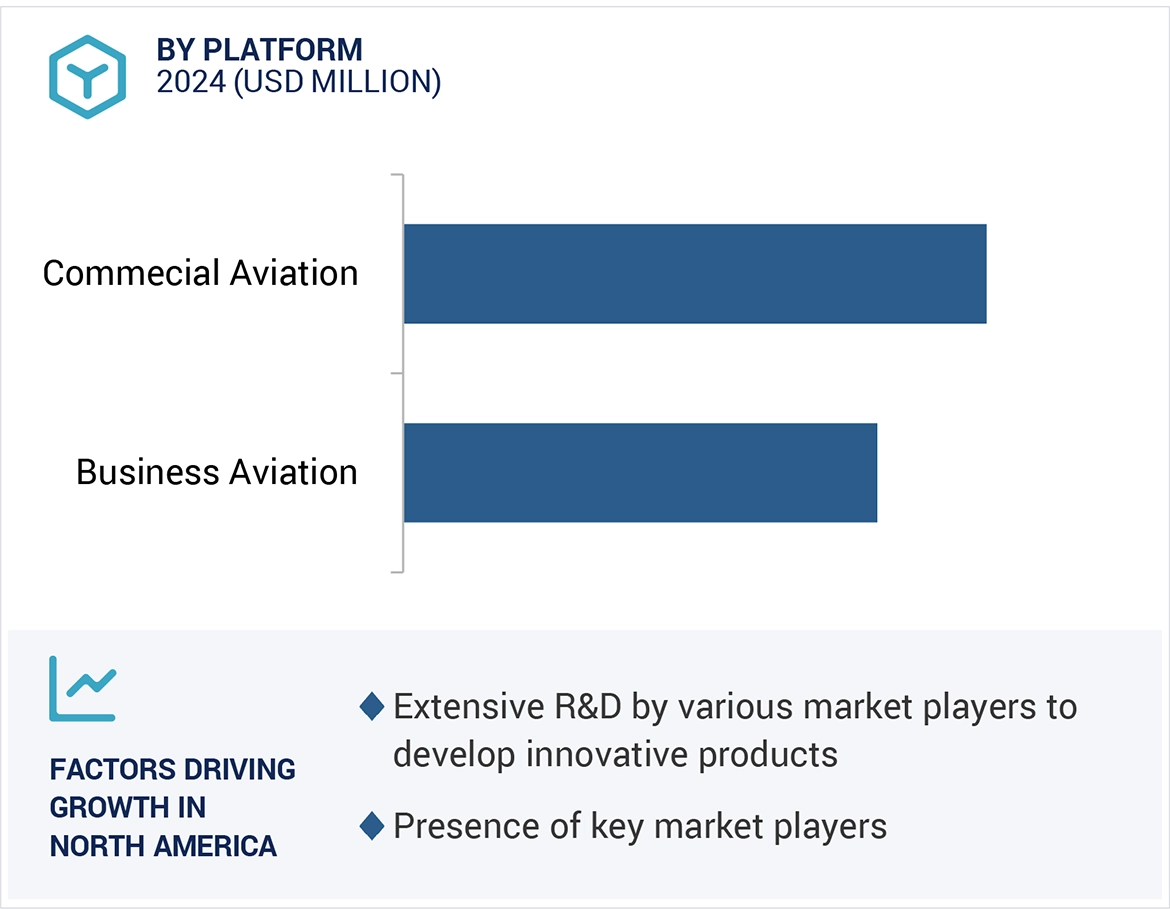
  • To define, describe, segment, and forecast the size of the in-flight content market based on type, access, operation, platform, and region
  • To forecast the size of market segments with respect to five major regions, namely North America, Europe, Asia Pacific, the Middle East, and the Rest of the World, along with the major countries in each region
  • To identify and analyze key drivers, restraints, opportunities, and challenges influencing the market growth
  • To strategically analyze micromarkets1 with respect to individual growth trends, prospects, and their contribution to the overall market
  • To analyze opportunities for stakeholders in the market by identifying key trends
  • To profile key players and comprehensively analyze their market shares and core competencies2
  • To provide a detailed competitive landscape of the in-flight content market, along with a ranking analysis, market share analysis, and revenue analysis of key players
  • To identify detailed financial positions, key products, and unique selling points of leading companies in the market
  • To analyze the degree of competition in the market by identifying key growth strategies, such as, product/service launches, contracts, and partnerships, adopted by key players

1. Micromarkets are further segments and subsegments of the In-flight Content market.

2. Core competencies of companies were captured in terms of their key developments and strategies adopted to sustain their position in the market.

Available Customizations:

Along with the market data, MarketsandMarkets offers customizations as per the specific needs of companies. The following customization options are available for the report:

Product Analysis

  • Product matrix, which gives a detailed comparison of the product portfolio of each company.

Regional Analysis

  • Further breakdown of the market segments at the country level

Company Information

  • Detailed analysis and profiling of additional market players (up to 5)
Custom Market Research Services

We will customize the research for you, in case the report listed above does not meet with your exact requirements. Our custom research will comprehensively cover the business information you require to help you arrive at strategic and profitable business decisions.

Request Customization
Report Code
AS 9031
Published ON
May, 2024
Choose License Type
BUY NOW
  • SHARE
X
Request Customization
Speak to Analyst
Speak to Analyst
OR FACE-TO-FACE MEETING
PERSONALIZE THIS RESEARCH
  • Triangulate with your Own Data
  • Get Data as per your Format and Definition
  • Gain a Deeper Dive on a Specific Application, Geography, Customer or Competitor
  • Any level of Personalization
REQUEST A FREE CUSTOMIZATION
LET US HELP YOU!
  • What are the Known and Unknown Adjacencies Impacting the In-flight Content Market
  • What will your New Revenue Sources be?
  • Who will be your Top Customer; what will make them switch?
  • Defend your Market Share or Win Competitors
  • Get a Scorecard for Target Partners
CUSTOMIZED WORKSHOP REQUEST
  • Call Us
  • +1-888-600-6441 (Corporate office hours)
  • +1-888-600-6441 (US/Can toll free)
  • +44-800-368-9399 (UK office hours)
CONNECT WITH US
ABOUT TRUST ONLINE
©2024 MarketsandMarkets Research Private Ltd. All rights reserved
DMCA.com Protection Status Website Feedback