Immunotherapy Drugs Market by Type (mAb, Checkpoint Inhibitor, Interferon, Cancer Vaccine), Application (Cancer, Autoimmune, Inflammatory, Hematology, Neurology), Route of Administration (Intravenous, Subcutaneous), End User - Global Forecast to 2029
Market Growth Outlook Summary
The global immunotherapy drugs market growth in terms of revenue was estimated to be worth $285.3 billion in 2024 and is poised to reach $580.6 billion by 2029, growing at a CAGR of 15.3% from 2024 to 2029. The comprehensive research encompasses an exhaustive examination of industry trends, meticulous pricing analysis, patent scrutiny, insights derived from conferences and webinars, identification of key stakeholders, and a nuanced understanding of market purchasing dynamics.
This growth is driven by technological advancements in antibody engineering, increasing demand for antibody therapies in clinical cancer treatment, and a growing preference for personalized medicines and targeted therapies. Immunotherapy drugs are designed to enhance the immune response or modulate the immune system's regulatory mechanisms, thereby enabling the body to effectively target and eliminate disease-causing agents or cells. However, the market faces challenges such as the complexities involved in developing antibody therapeutics. Key drivers of the market growth include technological advancements in antibody engineering, the rising demand for antibody therapies in clinical cancer treatment, and the increasing need for personalized medicines and targeted therapies.
Immunotherapy Drugs Market Trends
To know about the assumptions considered for the study, Request for Free Sample Report
Immunotherapy Drugs Market Dynamics
DRIVER: Technological advancements in antibody engineering
Advancements in antibody engineering are significantly driving the growth of the immunotherapy drugs market by leveraging molecular biology techniques to enhance antibodies for therapeutic and diagnostic purposes, the development of highly targeted and effective treatments is facilitated. Technologies such as recombinant DNA enable the customization of antibodies for specific therapeutic applications, increasing their clinical efficacy. Platforms like Wacker's ESETEC and Ligand Pharmaceuticals' Pelican Expression Technology optimize the production and secretion of antibody fragments, further propelling market growth. These innovations are crucial in meeting the rising demand for personalized medicines and targeted therapies, thereby expanding the market for immunotherapy drugs.
RESTRAINT: Stringent regulatory approval process for immunotherapy drugs
Developing and commercializing immunotherapy drugs faces rigorous evaluation and compliance with complex regulatory frameworks. The US FDA and European Medicines Agency (EMA) impose stringent guidelines, resulting in prolonged approval timelines and significant financial investments. Smaller companies face challenges due to these exhaustive requirements. Guidelines from the EMA and WHO cover development, production, and evaluation of antibody therapeutics. Regulatory rejections, such as those experienced by Y-mAbs Therapeutics and Eli Lilly, highlight the challenges. Market players must diligently adhere to these regulations to navigate the approval process and succeed in the competitive landscape of antibody therapeutics.
OPPORTUNITY: Increasing collaborations among pharmaceutical companies, CROs, CDMOs, and academic institutions
A collaborative approach fosters a synergistic environment, driving advancements in R&D and commercialization of Immunotherapy Drugs. Academic institutions contribute cutting-edge research, while pharmaceutical companies offer formulation expertise and market knowledge. CROs ensure robust scientific validation and regulatory compliance. Notable collaborations include AstraZeneca and the University Health Network's phase II study on AZD2936 for LA-HNSCC, and Salipro Biotech's multi-target antibody research agreement with Icosagen. This collaborative strategy promotes innovation, accelerates drug development, reduces costs, and enhances global market penetration, positioning antibody fragment-based therapies for substantial market growth and clinical impact.
CHALLENGE: Complexities in development of antibody therapeutics
The production of antibody therapeutics is intricate and time-consuming, involving cell line development, bioreactor cultivation, and purification, leading to high production costs and affecting market competitiveness. Compliance with stringent regulatory guidelines further increases costs and causes delays. Manufacturing involves complex operations and rigorous quality assurance, making antibody therapies more expensive than small-molecule medicines. Limited specialized manufacturing facilities force companies to outsource production, adding to costs and posing a challenge to market growth. The use of expression systems for antibody fragments through recombinant DNA technology is critical but resource-intensive.
IMMUNOTHERAPY DRUGS MARKET ECOSYSTEM
Based on the current scenario of commercializing immunotherapy drugs, the immunotherapy drugs value chain includes four integral steps. These are research & development; Manufacturing,Packaging, Distribution, Marketing Sales and After Sales. Within this value chain, Formulation Development, Extraction, Synthesis, Packaging and Sterlization are critical steps in commercializing immunotherapy drugs. The supply chain for immunotherapy drugs spans the entire process of sourcing materials to distribute the final product to healthcare providers (hospitals, clinics/physician settings) or patients. Based on the complexity of immunotherapy drugs manufacturing and the need for stringent quality control, establishing a robust supply chain is essential for ensuring the safety, efficacy, and scalability of immunotherapy drugs.
Ecosystem analysis: Immunotherapy Drugs Market
Source: Annual Reports, SEC Filings, Investor Presentations, Expert Interviews, and MarketsandMarkets Analysis
The Antibody drugs segment maintains major market share of the immunotherapy drugs industry in the forecast period.
Based on type, the immunotherapy drugs market is divided into antibody drugs, inhibitor drugs, interferons & interleukins, cancer vaccines, and other immunotherapy drugs, which include oncolytic virus therapy and t-cell therapy. Antibody drugs hold the major market share in 2023. Rising cancer rates along with the growing adoption of biological therapies, increased spending on R&D by both governments and Immunotherapy Drug Companies coupled with favorable government policies are driving this market.
The Cancer segment is anticipated to dominate immunotherapy drugs industry through 2023-2029.
Based on applications, the immunotherapy drugs market is divided into cancer, autoimmune & inflammatory diseases, hematology, osteology, neurology, and other applications, including ophthalmology, dermatology, and cardiovascular diseases. Cancer commanded the largest market share in 2023 due to the projected growth in burden of cancer cases throughout the world along with rising product approvals for cancer application, and increased R&D Spending.
The Intravenous Route segment of the immunotherapy drugs industry is anticipated to grow at the fastest pace throughout the forecast period.
Based on the route of administration, the immunotherapy drugs market is broadly segmented into intravenous, subcutaneous, and other routes of administration (intravitreal and intramuscular). In 2023, the intravenous route of administration segment accounted for the largest share of the immunotherapy drugs market. This segment is also expected to grow at the highest CAGR during the forecast period. The large share and high growth rate are attributed to the growing preference for intravenous routes owing to its direct delivery into the bloodstream, ensuring rapid and consistent therapeutic effects for several conditions, including cancer and autoimmune diseases.
Hospitals segment of the immunotherapy drugs industry generated the highest revenue in 2024 in the market.
Based on end users, the immunotherapy drugs market is broadly segmented into hospitals, long-term care facilities, and other end users (specialty care centers). In 2023, the hospitals segment commanded the largest share of the immunotherapy drugs market. Hospitals extensively use mAbs for their targeted therapy, rapid diagnostic applications, and efficacy in treating several disease indications, including cancer, autoimmune disorders, and infectious diseases.
The North America immunotherapy drugs industry is expected to dominate the market.
The immunotherapy drugs market has been segmented into six major regions: North America, Europe, the Asia Pacific, Latin America, the Middle East, and Africa. In 2023, North America accounted for the largest share of the global immunotherapy drugs market. The growth in the North American market can be attributed to rising immunotherapy research, the expansion of the healthcare sector, growing cancer prevalence, and the increasing approval and adoption of immunotherapy drugs for treating cancer and other chronic diseases.
To know about the assumptions considered for the study, download the pdf brochure
The players mapped in the report include Merck & Co., Inc. (US), Johnson & Johnson Services, Inc. (US), F. Hoffman-La Roche Ltd. (Switzerland), Pfizer Inc. (US), AstraZeneca (UK), Novartis AG (Switzerland), Amgen Inc. (US), Gilead Sciences, Inc. (UK), Bristol-Myers Squibb Company (US), Eli Lilly and Company (US), Sanofi (France), Takeda Pharmaceutical Company Limited (Japan), Teva Pharmaceutical Industries Ltd (Israel), GSK PLC (US), and Abbvie Inc. (US).
Scope of the Immunotherapy Drugs Industry:
Report Metric |
Details |
Market Revenue in 2024 |
$285.3 billion |
Projected Revenue by 2029 |
$580.6 billion |
Revenue Rate |
Poised to Grow at a CAGR of 15.3% |
Market Driver |
Technological advancements in antibody engineering |
Market Opportunity |
Increasing collaborations among pharmaceutical companies, CROs, CDMOs, and academic institutions |
This research report categorizes the immunotherapy drugs market to forecast revenue and analyze trends in each of the following submarkets:
By Type
- Antibody Drugs
- Inhibitor Drugs
- Interferons and Interleukins
- Cancer Vaccines
- Other Types
By Application
- Cancer
- Autoimmune and Inflammatory Diseases
- Hematology
- Osteology
- Neurology
- Other Applications
y Route of Administration
- Intravenous
- Subcutaneous
- Other Routes of Administration
By End User
- Hospitals
- Long-Term Care Facilities
- Other End Users
By Region
-
North America
- US
- Canada
-
Europe
- Germany
- UK
- France
- Italy
- Spain
- Rest of Europe
-
Asia Pacific
- China
- South Korea
- Australia
- India
- Japan
- Rest of Asia Pacific
-
Latin America
- Brazil
- Mexico
- Rest of Latin America
-
Middle East
-
GCC
- Saudi Arabia (KSA)
- United Arab Emirates (UAE)
- Rest of GCC
- Rest of Middle East
-
GCC
- Africa
Recent Developments of Immunotherapy Drugs Industry:
- In May 2024, Merck acquired EyeBio (UK), a privately held ophthalmology-focused biotechnology company. Merck gained rights to EyeBio’s pipeline candidate—Restoret (EYE103) through this acquisition. This is an investigational tri-specific antibody that acts as an agonist of the wingless-related integration site (WNT) signaling pathway.
- In December 2023, F. Hoffman-La Roche acquired Telavant Holdings, Inc. (owned by Roivant Sciences Ltd. and Pfizer Inc.) to develop advanced therapies targeted toward gastrointestinal health.
- In May 2023, Janssen Global Services, LLC (a subsidiary company of J&J) collaborated with Cellular Biomedicine Group Inc. (CBMG) to develop and commercialize advanced chimeric antigen receptor (CAR) T-cell therapies to treat B-cell malignancies.
Frequently Asked Questions (FAQ):
Who are the top key players in immunotherapy drugs market?
The players mapped in the report include Merck & Co., Inc. (US), Johnson & Johnson Services, Inc. (US), F. Hoffman-La Roche Ltd. (Switzerland), Pfizer Inc. (US), AstraZeneca (UK), Novartis AG (Switzerland), Amgen Inc. (US), Gilead Sciences, Inc. (UK), Bristol-Myers Squibb Company (US), Eli Lilly and Company (US), Sanofi (France), Takeda Pharmaceutical Company Limited (Japan), Teva Pharmaceutical Industries Ltd (Israel), GSK PLC (US), and Abbvie Inc. (US).
What are the drivers and opportunities for immunotherapy drugs market?
The immunotherapy drugs market is projected to grow from USD 285.3 billion in 2024 to USD 580.6 billion by 2029 at a CAGR of 15.3%. The growth of this market is driven by factors such as the Technological advancements in antibody engineering, Increased demand for antibody therapies in clinical cancer treatment, and Growing demand for personalized medicines and targeted therapies. However, Stringent regulatory approval process for immunotherapy drugs coupled with High cost of monoclonal antibody therapeutics are expected to restrain the growth of this market to a certain extent. .
To speak to our analyst for a discussion on the above findings, click Speak to Analyst
Exclusive indicates content/data unique to MarketsandMarkets and not available with any competitors.
- 5.1 INTRODUCTION
-
5.2 MARKET DYNAMICSDRIVERS- Technological advancements in antibody engineering- Increasing demand for antibody therapeutics in clinical cancer treatment- Growing demand for personalized medicines and targeted therapiesRESTRAINTS- Stringent regulatory approval process for immunotherapy drugs- High cost of monoclonal antibody therapeuticsOPPORTUNITIES- Rising number of approvals for CAR T-cell therapies- Increasing collaborations among pharmaceutical companies, CROs, CDMOs, and academic institutesCHALLENGES- Complexities in development of antibody therapeutics
-
5.3 PORTER’S FIVE FORCES ANALYSISTHREAT OF NEW ENTRANTSTHREAT OF SUBSTITUTESBARGAINING POWER OF SUPPLIERSBARGAINING POWER OF BUYERSINTENSITY OF COMPETITIVE RIVALRY
-
5.4 KEY STAKEHOLDERS & BUYING CRITERIAKEY STAKEHOLDERS IN BUYING PROCESSKEY BUYING CRITERIA
- 5.5 VALUE CHAIN ANALYSIS
- 5.6 SUPPLY CHAIN ANALYSIS
-
5.7 PRICING ANALYSISAVERAGE SELLING PRICE OF IMMUNOTHERAPY DRUGS, BY KEY PLAYERAVERAGE COST RANGE OF IMMUNOTHERAPY DRUGS, BY KEY PLAYER, 2021–2023INDICATIVE PRICE OF ANTIBODY THERAPEUTICS, BY ROUTE OF ADMINISTRATIONINDICATIVE PRICE OF IMMUNOTHERAPY DRUGS, BY REGION
-
5.8 ECOSYSTEM ANALYSISROLE IN ECOSYSTEM (SUPPLY AND DEMAND SIDES)
- 5.9 PATENT ANALYSIS
-
5.10 TECHNOLOGY ANALYSISKEY TECHNOLOGIES- Gene editing- High-throughput screening- Next-generation sequencingCOMPLEMENTARY TECHNOLOGIES- Nanotechnology- Artificial intelligence
-
5.11 INVESTMENT & FUNDING SCENARIOMAJOR INVESTMENTS AND FUNDINGOTHER INVESTMENTS AND FUNDING
- 5.12 KEY CONFERENCES & EVENTS, 2024–2025
-
5.13 CASE STUDY ANALYSISCASE STUDY 1: EFFICACY OF KEYTRUDA IN CANCER TREATMENTCASE STUDY 2: EFFECTIVE USE OF LYNPARZA IN PROSTATE CANCER TREATMENTCASE STUDY 3: CLINICAL TRIALS OF ORPATHYS (SAVOLITINIB)
-
5.14 REGULATORY LANDSCAPEREGULATORY ANALYSIS- North America- Europe- Asia PacificREGULATORY BODIES, GOVERNMENT AGENCIES, AND OTHER ORGANIZATIONS- North America- Europe- Asia Pacific- Latin America- Middle East & Africa
- 6.1 INTRODUCTION
-
6.2 ANTIBODY DRUGSROBUST CLINICAL PIPELINE OF ANTIBODY THERAPEUTICS TO SUPPORT MARKET GROWTH
-
6.3 INHIBITOR DRUGSINCREASED FOCUS ON DEVELOPMENT OF TARGET MEDICINES AND COMBINATION THERAPIES TO FUEL MARKET GROWTH
-
6.4 INTERFERONS & INTERLEUKINSINCREASED FOCUS ON R&D AND DEVELOPMENT OF NEW IMMUNOTHERAPY DRUGS TO AUGMENT MARKET GROWTH
-
6.5 CANCER VACCINESRISING FOCUS ON RESEARCH ACTIVITIES AND CLINICAL TRIALS TO SPUR MARKET GROWTH
- 6.6 OTHER IMMUNOTHERAPY DRUGS
- 7.1 INTRODUCTION
-
7.2 CANCERLARGE R&D SPENDING AND HIGH GOVERNMENT INVESTMENTS TO DRIVE MARKET
-
7.3 AUTOIMMUNE & INFLAMMATORY DISEASESADVANCEMENTS IN MOLECULAR ENGINEERING AND INTRODUCTION OF BIOLOGICAL DRUGS TO PROPEL MARKET GROWTH
-
7.4 HEMATOLOGYINCREASED R&D IN CELL-BASED THERAPIES, MONOCLONAL ANTIBODIES, AND IMMUNE CHECKPOINT INHIBITORS TO AID MARKET GROWTH
-
7.5 OSTEOLOGYGROWING INCIDENCE OF OSTEOPOROSIS-RELATED FRACTURES TO DRIVE MARKET
-
7.6 NEUROLOGYADVANCEMENTS IN NEUROLOGICAL DRUG DEVELOPMENT TO BOOST MARKET GROWTH
- 7.7 OTHER APPLICATIONS
- 8.1 INTRODUCTION
-
8.2 INTRAVENOUS ROUTE OF ADMINISTRATIONDIRECT DELIVERY OF THERAPEUTIC DOSAGE TO PROPEL MARKET GROWTH
-
8.3 SUBCUTANEOUS ROUTE OF ADMINISTRATIONENHANCED PATIENT ADHERENCE AND LOW HEALTHCARE COSTS TO AID MARKET GROWTH
- 8.4 OTHER ROUTES OF ADMINISTRATION
- 9.1 INTRODUCTION
-
9.2 HOSPITALSAVAILABILITY OF ADVANCED HEALTHCARE INFRASTRUCTURE AND EXPERTISE TO AUGMENT MARKET GROWTH
-
9.3 LONG-TERM CARE FACILITIESSPECIALIZED CARE AND CONTINUOUS MONITORING FOR PATIENTS WITH CHRONIC HEALTH CONDITIONS TO DRIVE MARKET
- 9.4 OTHER END USERS
- 10.1 INTRODUCTION
-
10.2 NORTH AMERICANORTH AMERICA: RECESSION IMPACTUS- US to dominate North American immunotherapy drugs market during forecast periodCANADA- Rising government initiatives for research on regenerative medicine to drive market
-
10.3 EUROPEEUROPE: RECESSION IMPACTGERMANY- Increasing investments in healthcare research to fuel market growthUK- Favorable government initiatives and high R&D investments to propel market growthFRANCE- Increasing adoption of immunotherapy drugs and growing focus on healthcare R&D to augment market growthITALY- Strong focus on clinical research and stringent government regulations to propel market growthSPAIN- Favorable government initiatives to spur market growthREST OF EUROPE
-
10.4 ASIA PACIFICASIA PACIFIC: RECESSION IMPACTCHINA- Less-stringent regulatory framework and high incidence of cancer to drive marketJAPAN- Rising geriatric population and increasing government support to augment market growthINDIA- Increasing prevalence of cancer and rising government healthcare investments to aid market growthSOUTH KOREA- Strong biopharmaceutical sector and favorable government initiatives to support market growthAUSTRALIA- High prevalence of cancer and increased expenditure on health services to propel market growthREST OF ASIA PACIFIC
-
10.5 LATIN AMERICALATIN AMERICA: RECESSION IMPACTBRAZIL- Developed healthcare infrastructure and unified public health system to fuel market growthREST OF LATIN AMERICA
-
10.6 MIDDLE EASTMIDDLE EAST: RECESSION IMPACTGCC COUNTRIES- Saudi Arabia- UAE- Rest of GCC CountriesREST OF MIDDLE EAST
-
10.7 AFRICAINCREASING HEALTHCARE FUNDING AND RISING INCIDENCE OF CANCER TO DRIVE MARKETAFRICA: RECESSION IMPACT
- 11.1 INTRODUCTION
-
11.2 KEY PLAYER STRATEGY/RIGHT TO WINOVERVIEW OF STRATEGIES ADOPTED BY KEY PLAYERS IN IMMUNOTHERAPY DRUGS MARKET
- 11.3 REVENUE ANALYSIS
- 11.4 MARKET SHARE ANALYSIS
-
11.5 COMPANY EVALUATION MATRIX: KEY PLAYERS, 2023STARSEMERGING LEADERSPERVASIVE PLAYERSPARTICIPANTSCOMPANY FOOTPRINT: KEY PLAYERS, 2023- Company footprint- Type footprint- Application footprint- Route of administration footprint- Region footprint
-
11.6 COMPANY EVALUATION MATRIX: STARTUPS/SMES, 2023PROGRESSIVE COMPANIESRESPONSIVE COMPANIESDYNAMIC COMPANIESSTARTING BLOCKSCOMPETITIVE BENCHMARKING: STARTUPS/SMES, 2023
- 11.7 COMPANY VALUATION & FINANCIAL METRICS
- 11.8 BRAND/PRODUCT COMPARISON
-
11.9 COMPETITIVE SCENARIOPRODUCT APPROVALSDEALSOTHER DEVELOPMENTS
-
12.1 KEY PLAYERSMERCK & CO., INC.- Business overview- Products/Services/Solutions offered- Recent developments- MnM viewJOHNSON & JOHNSON SERVICES, INC.- Business overview- Products/Services/Solutions offered- Recent developments- MnM viewF. HOFFMANN-LA ROCHE LTD.- Business overview- Products/Services/Solutions offered- Recent developments- MnM viewASTRAZENECA- Business overview- Products/Services/Solutions offered- Recent developmentsPFIZER INC.- Business overview- Products/Services/Solutions offered- Recent developmentsAMGEN INC.- Business overview- Products/Services/Solutions offered- Recent developmentsNOVARTIS AG- Business overview- Products/Services/Solutions offered- Recent developmentsELI LILLY AND COMPANY- Business overview- Products/Services/Solutions offered- Recent developmentsSANOFI- Business overview- Products/Services/Solutions offered- Recent developmentsBRISTOL-MYERS SQUIBB COMPANY- Business overview- Products/Services/Solutions offered- Recent developmentsGILEAD SCIENCES, INC.- Business overview- Products/Services/Solutions offered- Recent developmentsTAKEDA PHARMACEUTICAL COMPANY LIMITED- Business overview- Products/Services/Solutions offered- Recent developmentsTEVA PHARMACEUTICAL INDUSTRIES LTD.- Business overview- Products/Services/Solutions offered- Recent developmentsABBVIE INC.- Business overview- Products/Services/Solutions offered- Recent developmentsGSK PLC- Business overview- Products/Services/Solutions offered- Recent developments
-
12.2 OTHER PLAYERSIMMUNOCORE HOLDINGS PLCASTELLAS PHARMA INC.GENMAB A/SMACROGENICS, INC.FERRING BVY-MABS THERAPEUTICS, INC.BIOGENKYOWA KIRIN CO., LTD.SWEDISH ORPHAN BIOVITRUM ABBOEHRINGER INGELHEIM INTERNATIONAL GMBH
- 13.1 DISCUSSION GUIDE
- 13.2 KNOWLEDGESTORE: MARKETSANDMARKETS’ SUBSCRIPTION PORTAL
- 13.3 CUSTOMIZATION OPTIONS
- 13.4 RELATED REPORTS
- 13.5 AUTHOR DETAILS
- TABLE 1 IMMUNOTHERAPY DRUGS MARKET: INCLUSIONS & EXCLUSIONS
- TABLE 2 IMMUNOTHERAPY DRUGS MARKET: RISK ANALYSIS
- TABLE 3 GLOBAL INFLATION RATE PROJECTIONS, 2021–2028 (% GROWTH)
- TABLE 4 IMMUNOTHERAPY DRUGS MARKET: IMPACT ANALYSIS
- TABLE 5 NUMBER OF APPROVED PRODUCTS BY US FDA/EMA, 2015–2023
- TABLE 6 APPROVED AUTOLOGOUS CAR T-CELL THERAPIES
- TABLE 7 IMMUNOTHERAPY DRUGS MARKET: PORTER’S FIVE FORCES ANALYSIS
- TABLE 8 AVERAGE COST RANGE OF IMMUNOTHERAPY DRUGS, BY KEY PLAYER, 2021–2023
- TABLE 9 INDICATIVE PRICE OF ANTIBODY THERAPEUTICS, BY ROUTE OF ADMINISTRATION
- TABLE 10 INDICATIVE PRICE OF IMMUNOTHERAPY DRUGS, BY REGION
- TABLE 11 IMMUNOTHERAPY DRUGS MARKET: ROLE IN ECOSYSTEM (SUPPLY AND DEMAND SIDES)
- TABLE 12 IMMUNOTHERAPY DRUGS MARKET: MAJOR INVESTMENTS AND FUNDING, JANUARY 2021–MAY 2024
- TABLE 13 IMMUNOTHERAPY DRUGS MARKET: LIST OF KEY CONFERENCES & EVENTS, JANUARY 2024–DECEMBER 2025
- TABLE 14 NORTH AMERICA: LIST OF REGULATORY BODIES, GOVERNMENT AGENCIES, AND OTHER ORGANIZATIONS
- TABLE 15 EUROPE: LIST OF REGULATORY BODIES, GOVERNMENT AGENCIES, AND OTHER ORGANIZATIONS
- TABLE 16 ASIA PACIFIC: LIST OF REGULATORY BODIES, GOVERNMENT AGENCIES, AND OTHER ORGANIZATIONS
- TABLE 17 LATIN AMERICA: LIST OF REGULATORY BODIES, GOVERNMENT AGENCIES, AND OTHER ORGANIZATIONS
- TABLE 18 MIDDLE EAST & AFRICA: LIST OF REGULATORY BODIES, GOVERNMENT AGENCIES, AND OTHER ORGANIZATIONS
- TABLE 19 IMMUNOTHERAPY DRUGS MARKET, BY TYPE, 2022–2029 (USD BILLION)
- TABLE 20 IMMUNOTHERAPY DRUGS MARKET, BY TYPE, 2022–2029 (UNITS)
- TABLE 21 ANTIBODY DRUGS MARKET, BY REGION, 2022–2029 (USD BILLION)
- TABLE 22 NORTH AMERICA: ANTIBODY DRUGS MARKET, BY COUNTRY, 2022–2029 (USD BILLION)
- TABLE 23 EUROPE: ANTIBODY DRUGS MARKET, BY COUNTRY, 2022–2029 (USD BILLION)
- TABLE 24 ASIA PACIFIC: ANTIBODY DRUGS MARKET, BY COUNTRY, 2022–2029 (USD BILLION)
- TABLE 25 LATIN AMERICA: ANTIBODY DRUGS MARKET, BY COUNTRY, 2022–2029 (USD BILLION)
- TABLE 26 MIDDLE EAST: ANTIBODY DRUGS MARKET, BY COUNTRY, 2022–2029 (USD BILLION)
- TABLE 27 GCC COUNTRIES: ANTIBODY DRUGS MARKET, BY COUNTRY, 2022–2029 (USD BILLION)
- TABLE 28 INHIBITOR DRUGS MARKET, 2022–2029 (USD BILLION)
- TABLE 29 NORTH AMERICA: INHIBITOR DRUGS MARKET, BY COUNTRY, 2022–2029 (USD BILLION)
- TABLE 30 EUROPE: INHIBITOR DRUGS MARKET, BY COUNTRY, 2022–2029 (USD BILLION)
- TABLE 31 ASIA PACIFIC: INHIBITOR DRUGS MARKET, BY COUNTRY, 2022–2029 (USD BILLION)
- TABLE 32 LATIN AMERICA: INHIBITOR DRUGS MARKET, BY COUNTRY, 2022–2029 (USD BILLION)
- TABLE 33 MIDDLE EAST: INHIBITOR DRUGS MARKET, BY COUNTRY, 2022–2029 (USD BILLION)
- TABLE 34 GCC COUNTRIES: INHIBITOR DRUGS MARKET, BY COUNTRY, 2022–2029 (USD BILLION)
- TABLE 35 INTERFERONS & INTERLEUKINS MARKET, BY REGION, 2022–2029 (USD BILLION)
- TABLE 36 NORTH AMERICA: INTERFERONS & INTERLEUKINS MARKET, BY COUNTRY, 2022–2029 (USD BILLION)
- TABLE 37 EUROPE: INTERFERONS & INTERLEUKINS MARKET, BY COUNTRY, 2022–2029 (USD BILLION)
- TABLE 38 ASIA PACIFIC: INTERFERONS & INTERLEUKINS MARKET, BY COUNTRY, 2022–2029 (USD BILLION)
- TABLE 39 LATIN AMERICA: INTERFERONS & INTERLEUKINS MARKET, BY COUNTRY, 2022–2029 (USD BILLION)
- TABLE 40 MIDDLE EAST: INTERFERONS & INTERLEUKINS MARKET, BY COUNTRY, 2022–2029 (USD BILLION)
- TABLE 41 GCC COUNTRIES: INTERFERONS & INTERLEUKINS MARKET, BY COUNTRY, 2022–2029 (USD BILLION)
- TABLE 42 CANCER VACCINES MARKET, BY REGION, 2022–2029 (USD BILLION)
- TABLE 43 NORTH AMERICA: CANCER VACCINES MARKET, BY COUNTRY, 2022–2029 (USD BILLION)
- TABLE 44 EUROPE: CANCER VACCINES MARKET, BY COUNTRY, 2022–2029 (USD BILLION)
- TABLE 45 ASIA PACIFIC: CANCER VACCINES MARKET, BY COUNTRY, 2022–2029 (USD BILLION)
- TABLE 46 LATIN AMERICA: CANCER VACCINES MARKET, BY COUNTRY, 2022–2029 (USD BILLION)
- TABLE 47 MIDDLE EAST: CANCER VACCINES MARKET, BY COUNTRY, 2022–2029 (USD BILLION)
- TABLE 48 GCC COUNTRIES: CANCER VACCINES MARKET, BY COUNTRY, 2022–2029 (USD BILLION)
- TABLE 49 OTHER IMMUNOTHERAPY DRUGS MARKET, BY REGION, 2022–2029 (USD BILLION)
- TABLE 50 NORTH AMERICA: OTHER IMMUNOTHERAPY DRUGS MARKET, BY COUNTRY, 2022–2029 (USD BILLION)
- TABLE 51 EUROPE: OTHER IMMUNOTHERAPY DRUGS MARKET, BY COUNTRY, 2022–2029 (USD BILLION)
- TABLE 52 ASIA PACIFIC: OTHER IMMUNOTHERAPY DRUGS MARKET, BY COUNTRY, 2022–2029 (USD BILLION)
- TABLE 53 LATIN AMERICA: OTHER IMMUNOTHERAPY DRUGS MARKET, BY COUNTRY, 2022–2029 (USD BILLION)
- TABLE 54 MIDDLE EAST: OTHER IMMUNOTHERAPY DRUGS MARKET, BY COUNTRY, 2022–2029 (USD BILLION)
- TABLE 55 GCC COUNTRIES: OTHER IMMUNOTHERAPY DRUGS MARKET, BY COUNTRY, 2022–2029 (USD BILLION)
- TABLE 56 IMMUNOTHERAPY DRUGS MARKET, BY APPLICATION, 2022–2029 (USD BILLION)
- TABLE 57 IMMUNOTHERAPY DRUGS MARKET FOR CANCER, BY REGION, 2022–2029 (USD BILLION)
- TABLE 58 NORTH AMERICA: IMMUNOTHERAPY DRUGS MARKET FOR CANCER, BY COUNTRY, 2022–2029 (USD BILLION)
- TABLE 59 EUROPE: IMMUNOTHERAPY DRUGS MARKET FOR CANCER, BY COUNTRY, 2022–2029 (USD BILLION)
- TABLE 60 ASIA PACIFIC: IMMUNOTHERAPY DRUGS MARKET FOR CANCER, BY COUNTRY, 2022–2029 (USD BILLION)
- TABLE 61 LATIN AMERICA: IMMUNOTHERAPY DRUGS MARKET FOR CANCER, BY COUNTRY, 2022–2029 (USD BILLION)
- TABLE 62 MIDDLE EAST: IMMUNOTHERAPY DRUGS MARKET FOR CANCER, BY REGION, 2022–2029 (USD BILLION)
- TABLE 63 GCC COUNTRIES: IMMUNOTHERAPY DRUGS MARKET FOR CANCER, BY COUNTRY, 2022–2029 (USD BILLION)
- TABLE 64 IMMUNOTHERAPY DRUGS MARKET FOR AUTOIMMUNE & INFLAMMATORY DISEASES, BY REGION, 2022–2029 (USD BILLION)
- TABLE 65 NORTH AMERICA: IMMUNOTHERAPY DRUGS MARKET FOR AUTOIMMUNE & INFLAMMATORY DISEASES, BY COUNTRY, 2022–2029 (USD BILLION)
- TABLE 66 EUROPE: IMMUNOTHERAPY DRUGS MARKET FOR AUTOIMMUNE & INFLAMMATORY DISEASES, BY COUNTRY, 2022–2029 (USD BILLION)
- TABLE 67 ASIA PACIFIC: IMMUNOTHERAPY DRUGS MARKET FOR AUTOIMMUNE & INFLAMMATORY DISEASES, BY COUNTRY, 2022–2029 (USD BILLION)
- TABLE 68 LATIN AMERICA: IMMUNOTHERAPY DRUGS MARKET FOR AUTOIMMUNE & INFLAMMATORY DISEASES, BY COUNTRY, 2022–2029 (USD BILLION)
- TABLE 69 MIDDLE EAST: IMMUNOTHERAPY DRUGS MARKET FOR AUTOIMMUNE & INFLAMMATORY DISEASES, BY REGION, 2022–2029 (USD BILLION)
- TABLE 70 GCC COUNTRIES: IMMUNOTHERAPY DRUGS MARKET FOR AUTOIMMUNE & INFLAMMATORY DISEASES, BY COUNTRY, 2022–2029 (USD BILLION)
- TABLE 71 IMMUNOTHERAPY DRUGS MARKET FOR HEMATOLOGY, BY REGION, 2022–2029 (USD BILLION)
- TABLE 72 NORTH AMERICA: IMMUNOTHERAPY DRUGS MARKET FOR HEMATOLOGY, BY COUNTRY, 2022–2029 (USD BILLION)
- TABLE 73 EUROPE: IMMUNOTHERAPY DRUGS MARKET FOR HEMATOLOGY, BY COUNTRY, 2022–2029 (USD BILLION)
- TABLE 74 ASIA PACIFIC: IMMUNOTHERAPY DRUGS MARKET FOR HEMATOLOGY, BY COUNTRY, 2022–2029 (USD BILLION)
- TABLE 75 LATIN AMERICA: IMMUNOTHERAPY DRUGS MARKET FOR HEMATOLOGY, BY COUNTRY, 2022–2029 (USD BILLION)
- TABLE 76 MIDDLE EAST: IMMUNOTHERAPY DRUGS MARKET FOR HEMATOLOGY, BY REGION, 2022–2029 (USD BILLION)
- TABLE 77 GCC COUNTRIES: IMMUNOTHERAPY DRUGS MARKET FOR HEMATOLOGY, BY COUNTRY, 2022–2029 (USD BILLION)
- TABLE 78 IMMUNOTHERAPY DRUGS MARKET FOR OSTEOLOGY, BY REGION, 2022–2029 (USD BILLION)
- TABLE 79 NORTH AMERICA: IMMUNOTHERAPY DRUGS MARKET FOR OSTEOLOGY, BY COUNTRY, 2022–2029 (USD BILLION)
- TABLE 80 EUROPE: IMMUNOTHERAPY DRUGS MARKET FOR OSTEOLOGY, BY COUNTRY, 2022–2029 (USD BILLION)
- TABLE 81 ASIA PACIFIC: IMMUNOTHERAPY DRUGS MARKET FOR OSTEOLOGY, BY COUNTRY, 2022–2029 (USD BILLION)
- TABLE 82 LATIN AMERICA: IMMUNOTHERAPY DRUGS MARKET FOR OSTEOLOGY, BY COUNTRY, 2022–2029 (USD BILLION)
- TABLE 83 MIDDLE EAST: IMMUNOTHERAPY DRUGS MARKET FOR OSTEOLOGY, BY REGION, 2022–2029 (USD BILLION)
- TABLE 84 GCC COUNTRIES: IMMUNOTHERAPY DRUGS MARKET FOR OSTEOLOGY, BY COUNTRY, 2022–2029 (USD BILLION)
- TABLE 85 IMMUNOTHERAPY DRUGS MARKET FOR NEUROLOGY, BY REGION, 2022–2029 (USD BILLION)
- TABLE 86 NORTH AMERICA: IMMUNOTHERAPY DRUGS MARKET FOR NEUROLOGY, BY COUNTRY, 2022–2029 (USD BILLION)
- TABLE 87 EUROPE: IMMUNOTHERAPY DRUGS MARKET FOR NEUROLOGY, BY COUNTRY, 2022–2029 (USD BILLION)
- TABLE 88 ASIA PACIFIC: IMMUNOTHERAPY DRUGS MARKET FOR NEUROLOGY, BY COUNTRY, 2022–2029 (USD BILLION)
- TABLE 89 LATIN AMERICA: IMMUNOTHERAPY DRUGS MARKET FOR NEUROLOGY, BY COUNTRY, 2022–2029 (USD BILLION)
- TABLE 90 MIDDLE EAST: IMMUNOTHERAPY DRUGS MARKET FOR NEUROLOGY, BY REGION, 2022–2029 (USD BILLION)
- TABLE 91 GCC COUNTRIES: IMMUNOTHERAPY DRUGS MARKET FOR NEUROLOGY, BY COUNTRY, 2022–2029 (USD BILLION)
- TABLE 92 IMMUNOTHERAPY DRUGS MARKET FOR OTHER APPLICATIONS, BY REGION, 2022–2029 (USD BILLION)
- TABLE 93 NORTH AMERICA: IMMUNOTHERAPY DRUGS MARKET FOR OTHER APPLICATIONS, BY COUNTRY, 2022–2029 (USD BILLION)
- TABLE 94 EUROPE: IMMUNOTHERAPY DRUGS MARKET FOR OTHER APPLICATIONS, BY COUNTRY, 2022–2029 (USD BILLION)
- TABLE 95 ASIA PACIFIC: IMMUNOTHERAPY DRUGS MARKET FOR OTHER APPLICATIONS, BY COUNTRY, 2022–2029 (USD BILLION)
- TABLE 96 LATIN AMERICA: IMMUNOTHERAPY DRUGS MARKET FOR OTHER APPLICATIONS, BY COUNTRY, 2022–2029 (USD BILLION)
- TABLE 97 MIDDLE EAST: IMMUNOTHERAPY DRUGS MARKET FOR OTHER APPLICATIONS, BY REGION, 2022–2029 (USD BILLION)
- TABLE 98 GCC COUNTRIES: IMMUNOTHERAPY DRUGS MARKET FOR OTHER APPLICATIONS, BY COUNTRY, 2022–2029 (USD BILLION)
- TABLE 99 IMMUNOTHERAPY DRUGS MARKET, BY ROUTE OF ADMINISTRATION, 2022–2029 (USD BILLION)
- TABLE 100 IMMUNOTHERAPY DRUGS MARKET FOR INTRAVENOUS ROUTE OF ADMINISTRATION, BY REGION, 2022–2029 (USD BILLION)
- TABLE 101 NORTH AMERICA: IMMUNOTHERAPY DRUGS MARKET FOR INTRAVENOUS ROUTE OF ADMINISTRATION, BY COUNTRY, 2022–2029 (USD BILLION)
- TABLE 102 EUROPE: IMMUNOTHERAPY DRUGS MARKET FOR INTRAVENOUS ROUTE OF ADMINISTRATION, BY COUNTRY, 2022–2029 (USD BILLION)
- TABLE 103 ASIA PACIFIC: IMMUNOTHERAPY DRUGS MARKET FOR INTRAVENOUS ROUTE OF ADMINISTRATION, BY COUNTRY, 2022–2029 (USD BILLION)
- TABLE 104 LATIN AMERICA: IMMUNOTHERAPY DRUGS MARKET FOR INTRAVENOUS ROUTE OF ADMINISTRATION, BY COUNTRY, 2022–2029 (USD BILLION)
- TABLE 105 MIDDLE EAST: IMMUNOTHERAPY DRUGS MARKET FOR INTRAVENOUS ROUTE OF ADMINISTRATION, BY REGION, 2022–2029 (USD BILLION)
- TABLE 106 GCC COUNTRIES: IMMUNOTHERAPY DRUGS MARKET FOR INTRAVENOUS ROUTE OF ADMINISTRATION, BY COUNTRY, 2022–2029 (USD BILLION)
- TABLE 107 IMMUNOTHERAPY DRUGS MARKET FOR SUBCUTANEOUS ROUTE OF ADMINISTRATION, BY REGION, 2022–2029 (USD BILLION)
- TABLE 108 NORTH AMERICA: IMMUNOTHERAPY DRUGS MARKET FOR SUBCUTANEOUS ROUTE OF ADMINISTRATION, BY COUNTRY, 2022–2029 (USD BILLION)
- TABLE 109 EUROPE: IMMUNOTHERAPY DRUGS MARKET FOR SUBCUTANEOUS ROUTE OF ADMINISTRATION, BY COUNTRY, 2022–2029 (USD BILLION)
- TABLE 110 ASIA PACIFIC: IMMUNOTHERAPY DRUGS MARKET FOR SUBCUTANEOUS ROUTE OF ADMINISTRATION, BY COUNTRY, 2022–2029 (USD BILLION)
- TABLE 111 LATIN AMERICA: IMMUNOTHERAPY DRUGS MARKET FOR SUBCUTANEOUS ROUTE OF ADMINISTRATION, BY COUNTRY, 2022–2029 (USD BILLION)
- TABLE 112 MIDDLE EAST: IMMUNOTHERAPY DRUGS MARKET FOR SUBCUTANEOUS ROUTE OF ADMINISTRATION, BY REGION, 2022–2029 USD BILLION)
- TABLE 113 GCC COUNTRIES: IMMUNOTHERAPY DRUGS MARKET FOR SUBCUTANEOUS ROUTE OF ADMINISTRATION, BY COUNTRY, 2022–2029 (USD BILLION)
- TABLE 114 IMMUNOTHERAPY DRUGS MARKET FOR OTHER ROUTES OF ADMINISTRATION, BY REGION, 2022–2029 (USD BILLION)
- TABLE 115 NORTH AMERICA: IMMUNOTHERAPY DRUGS MARKET FOR OTHER ROUTES OF ADMINISTRATION, BY COUNTRY, 2022–2029 (USD BILLION)
- TABLE 116 EUROPE: IMMUNOTHERAPY DRUGS MARKET FOR OTHER ROUTES OF ADMINISTRATION, BY COUNTRY, 2022–2029 (USD BILLION)
- TABLE 117 ASIA PACIFIC: IMMUNOTHERAPY DRUGS MARKET FOR OTHER ROUTES OF ADMINISTRATION, BY COUNTRY, 2022–2029 (USD BILLION)
- TABLE 118 LATIN AMERICA: IMMUNOTHERAPY DRUGS MARKET FOR OTHER ROUTES OF ADMINISTRATION, BY COUNTRY, 2022–2029 (USD BILLION)
- TABLE 119 MIDDLE EAST: IMMUNOTHERAPY DRUGS MARKET FOR OTHER ROUTES OF ADMINISTRATION, BY REGION, 2022–2029 (USD BILLION)
- TABLE 120 GCC COUNTRIES: IMMUNOTHERAPY DRUGS MARKET FOR OTHER ROUTES OF ADMINISTRATION, BY COUNTRY, 2022–2029 (USD BILLION)
- TABLE 121 IMMUNOTHERAPY DRUGS MARKET, BY END USER, 2022–2029 (USD BILLION)
- TABLE 122 IMMUNOTHERAPY DRUGS MARKET FOR HOSPITALS, BY REGION, 2022–2029 (USD BILLION)
- TABLE 123 NORTH AMERICA: IMMUNOTHERAPY DRUGS MARKET FOR HOSPITALS, BY COUNTRY, 2022–2029 (USD BILLION)
- TABLE 124 EUROPE: IMMUNOTHERAPY DRUGS MARKET FOR HOSPITALS, BY COUNTRY, 2022–2029 (USD BILLION)
- TABLE 125 ASIA PACIFIC: IMMUNOTHERAPY DRUGS MARKET FOR HOSPITALS, BY COUNTRY, 2022–2029 (USD BILLION)
- TABLE 126 LATIN AMERICA: IMMUNOTHERAPY DRUGS MARKET FOR HOSPITALS, BY COUNTRY, 2022–2029 (USD BILLION)
- TABLE 127 MIDDLE EAST: IMMUNOTHERAPY DRUGS MARKET FOR HOSPITALS, BY REGION, 2022–2029 (USD BILLION)
- TABLE 128 GCC COUNTRIES: IMMUNOTHERAPY DRUGS MARKET FOR HOSPITALS, BY COUNTRY, 2022–2029 (USD BILLION)
- TABLE 129 IMMUNOTHERAPY DRUGS MARKET FOR LONG-TERM CARE FACILITIES, BY REGION, 2022–2029 (USD BILLION)
- TABLE 130 NORTH AMERICA: IMMUNOTHERAPY DRUGS MARKET FOR LONG-TERM CARE FACILITIES, BY COUNTRY, 2022–2029 (USD BILLION)
- TABLE 131 EUROPE: IMMUNOTHERAPY DRUGS MARKET FOR LONG-TERM CARE FACILITIES, BY COUNTRY, 2022–2029 (USD BILLION)
- TABLE 132 ASIA PACIFIC: IMMUNOTHERAPY DRUGS MARKET FOR LONG-TERM CARE FACILITIES, BY COUNTRY, 2022–2029 (USD BILLION)
- TABLE 133 LATIN AMERICA: IMMUNOTHERAPY DRUGS MARKET FOR LONG-TERM CARE FACILITIES, BY COUNTRY, 2022–2029 (USD BILLION)
- TABLE 134 MIDDLE EAST: IMMUNOTHERAPY DRUGS MARKET FOR LONG-TERM CARE FACILITIES, BY REGION, 2022–2029 (USD BILLION)
- TABLE 135 GCC COUNTRIES: IMMUNOTHERAPY DRUGS MARKET FOR LONG-TERM CARE FACILITIES, BY COUNTRY, 2022–2029 (USD BILLION)
- TABLE 136 IMMUNOTHERAPY DRUGS MARKET FOR OTHER END USERS, BY REGION, 2022–2029 (USD BILLION)
- TABLE 137 NORTH AMERICA: IMMUNOTHERAPY DRUGS MARKET FOR OTHER END USERS, BY COUNTRY, 2022–2029 (USD BILLION)
- TABLE 138 EUROPE: IMMUNOTHERAPY DRUGS MARKET FOR OTHER END USERS, BY COUNTRY, 2022–2029 (USD BILLION)
- TABLE 139 ASIA PACIFIC: IMMUNOTHERAPY DRUGS MARKET FOR OTHER END USERS, BY COUNTRY, 2022–2029 (USD BILLION)
- TABLE 140 LATIN AMERICA: IMMUNOTHERAPY DRUGS MARKET FOR OTHER END USERS, BY COUNTRY, 2022–2029 (USD BILLION)
- TABLE 141 MIDDLE EAST: IMMUNOTHERAPY DRUGS MARKET FOR OTHER END USERS, BY REGION, 2022–2029 (USD BILLION)
- TABLE 142 GCC COUNTRIES: IMMUNOTHERAPY DRUGS MARKET FOR OTHER END USERS, BY COUNTRY, 2022–2029 (USD BILLION)
- TABLE 143 IMMUNOTHERAPY DRUGS MARKET, BY REGION, 2022–2029 (USD BILLION)
- TABLE 144 NORTH AMERICA: IMMUNOTHERAPY DRUGS MARKET, BY COUNTRY, 2022–2029 (USD BILLION)
- TABLE 145 NORTH AMERICA: IMMUNOTHERAPY DRUGS MARKET, BY TYPE, 2022–2029 (USD BILLION)
- TABLE 146 NORTH AMERICA: IMMUNOTHERAPY DRUGS MARKET, BY ROUTE OF ADMINISTRATION, 2022–2029 (USD BILLION)
- TABLE 147 NORTH AMERICA: IMMUNOTHERAPY DRUGS MARKET, BY APPLICATION, 2022–2029 (USD BILLION)
- TABLE 148 NORTH AMERICA: IMMUNOTHERAPY DRUGS MARKET, BY END USER, 2022–2029 (USD BILLION)
- TABLE 149 US: IMMUNOTHERAPY DRUGS MARKET, BY TYPE, 2022–2029 (USD BILLION)
- TABLE 150 US: IMMUNOTHERAPY DRUGS MARKET, BY ROUTE OF ADMINISTRATION, 2022–2029 (USD BILLION)
- TABLE 151 US: IMMUNOTHERAPY DRUGS MARKET, BY APPLICATION, 2022–2029 (USD BILLION)
- TABLE 152 US: IMMUNOTHERAPY DRUGS MARKET, BY END USER, 2022–2029 (USD BILLION)
- TABLE 153 CANADA: IMMUNOTHERAPY DRUGS MARKET, BY TYPE, 2022–2029 (USD BILLION)
- TABLE 154 CANADA: IMMUNOTHERAPY DRUGS MARKET, BY ROUTE OF ADMINISTRATION, 2022–2029 (USD BILLION)
- TABLE 155 CANADA: IMMUNOTHERAPY DRUGS MARKET, BY APPLICATION, 2022–2029 (USD BILLION)
- TABLE 156 CANADA: IMMUNOTHERAPY DRUGS MARKET, BY END USER, 2022–2029 (USD BILLION)
- TABLE 157 EUROPE: IMMUNOTHERAPY DRUGS MARKET, BY COUNTRY, 2022–2029 (USD BILLION)
- TABLE 158 EUROPE: IMMUNOTHERAPY DRUGS MARKET, BY TYPE, 2022–2029 (USD BILLION)
- TABLE 159 EUROPE: IMMUNOTHERAPY DRUGS MARKET, BY ROUTE OF ADMINISTRATION, 2022–2029 (USD BILLION)
- TABLE 160 EUROPE: IMMUNOTHERAPY DRUGS MARKET, BY APPLICATION, 2022–2029 (USD BILLION)
- TABLE 161 EUROPE: IMMUNOTHERAPY DRUGS MARKET, BY END USER, 2022–2029 (USD BILLION)
- TABLE 162 GERMANY: IMMUNOTHERAPY DRUGS MARKET, BY TYPE, 2022–2029 (USD BILLION)
- TABLE 163 GERMANY: IMMUNOTHERAPY DRUGS MARKET, BY ROUTE OF ADMINISTRATION, 2022–2029 (USD BILLION)
- TABLE 164 GERMANY: IMMUNOTHERAPY DRUGS MARKET, BY APPLICATION, 2022–2029 (USD BILLION)
- TABLE 165 GERMANY: IMMUNOTHERAPY DRUGS MARKET, BY END USER, 2022–2029 (USD BILLION)
- TABLE 166 UK: IMMUNOTHERAPY DRUGS MARKET, BY TYPE, 2022–2029 (USD BILLION)
- TABLE 167 UK: IMMUNOTHERAPY DRUGS MARKET, BY ROUTE OF ADMINISTRATION, 2022–2029 (USD BILLION)
- TABLE 168 UK: IMMUNOTHERAPY DRUGS MARKET, BY APPLICATION, 2022–2029 (USD BILLION)
- TABLE 169 UK: IMMUNOTHERAPY DRUGS THERAPEUTICS MARKET, BY END USER, 2022–2029 (USD BILLION)
- TABLE 170 FRANCE: IMMUNOTHERAPY DRUGS MARKET, BY TYPE, 2022–2029 (USD BILLION)
- TABLE 171 FRANCE: IMMUNOTHERAPY DRUGS MARKET, BY ROUTE OF ADMINISTRATION, 2022–2029 (USD BILLION)
- TABLE 172 FRANCE: IMMUNOTHERAPY DRUGS MARKET, BY APPLICATION, 2022–2029 (USD BILLION)
- TABLE 173 FRANCE: IMMUNOTHERAPY DRUGS MARKET, BY END USER, 2022–2029 (USD BILLION)
- TABLE 174 ITALY: IMMUNOTHERAPY DRUGS MARKET, BY TYPE, 2022–2029 (USD BILLION)
- TABLE 175 ITALY: IMMUNOTHERAPY DRUGS MARKET, BY ROUTE OF ADMINISTRATION, 2022–2029 (USD BILLION)
- TABLE 176 ITALY: IMMUNOTHERAPY DRUGS MARKET, BY APPLICATION, 2022–2029 (USD BILLION)
- TABLE 177 ITALY: IMMUNOTHERAPY DRUGS MARKET, BY END USER, 2022–2029 (USD BILLION)
- TABLE 178 SPAIN: IMMUNOTHERAPY DRUGS MARKET, BY TYPE, 2022–2029 (USD BILLION)
- TABLE 179 SPAIN: IMMUNOTHERAPY DRUGS MARKET, BY ROUTE OF ADMINISTRATION, 2022–2029 (USD MILLION)
- TABLE 180 SPAIN: IMMUNOTHERAPY DRUGS MARKET, BY APPLICATION, 2022–2029 (USD BILLION)
- TABLE 181 SPAIN: IMMUNOTHERAPY DRUGS MARKET, BY END USER, 2022–2029 (USD BILLION)
- TABLE 182 REST OF EUROPE: IMMUNOTHERAPY DRUGS MARKET, BY TYPE, 2022–2029 (USD BILLION)
- TABLE 183 REST OF EUROPE: IMMUNOTHERAPY DRUGS MARKET, BY ROUTE OF ADMINISTRATION, 2022–2029 (USD BILLION)
- TABLE 184 REST OF EUROPE: IMMUNOTHERAPY DRUGS MARKET, BY APPLICATION, 2022–2029 (USD BILLION)
- TABLE 185 REST OF EUROPE: IMMUNOTHERAPY DRUGS MARKET, BY END USER, 2022–2029 (USD BILLION)
- TABLE 186 ASIA PACIFIC: IMMUNOTHERAPY DRUGS MARKET, BY COUNTRY, 2022–2029 (USD BILLION)
- TABLE 187 ASIA PACIFIC: IMMUNOTHERAPY DRUGS MARKET, BY TYPE, 2022–2029 (USD BILLION)
- TABLE 188 ASIA PACIFIC: IMMUNOTHERAPY DRUGS, BY ROUTE OF ADMINISTRATION, 2022–2029 (USD BILLION)
- TABLE 189 ASIA PACIFIC: IMMUNOTHERAPY DRUGS MARKET, BY APPLICATION, 2022–2029 (USD BILLION)
- TABLE 190 ASIA PACIFIC: IMMUNOTHERAPY DRUGS MARKET, BY END USER, 2022–2029 (USD BILLION)
- TABLE 191 CHINA: IMMUNOTHERAPY DRUGS MARKET, BY TYPE, 2022–2029 (USD BILLION)
- TABLE 192 CHINA: IMMUNOTHERAPY DRUGS MARKET, BY ROUTE OF ADMINISTRATION, 2022–2029 (USD BILLION)
- TABLE 193 CHINA: IMMUNOTHERAPY DRUGS MARKET, BY APPLICATION, 2022–2029 (USD BILLION)
- TABLE 194 CHINA: IMMUNOTHERAPY DRUGS MARKET, BY END USER, 2022–2029 (USD BILLION)
- TABLE 195 JAPAN: IMMUNOTHERAPY DRUGS MARKET, BY TYPE, 2022–2029 (USD BILLION)
- TABLE 196 JAPAN: IMMUNOTHERAPY DRUGS MARKET, BY ROUTE OF ADMINISTRATION, 2022–2029 (USD BILLION)
- TABLE 197 JAPAN: IMMUNOTHERAPY DRUGS MARKET, BY APPLICATION, 2022–2029 (USD BILLION)
- TABLE 198 JAPAN: IMMUNOTHERAPY DRUGS MARKET, BY END USER, 2022–2029 (USD BILLION)
- TABLE 199 INDIA: IMMUNOTHERAPY DRUGS MARKET, BY TYPE, 2022–2029 (USD BILLION)
- TABLE 200 INDIA: IMMUNOTHERAPY DRUGS MARKET, BY ROUTE OF ADMINISTRATION, 2022–2029 (USD BILLION)
- TABLE 201 INDIA: IMMUNOTHERAPY DRUGS MARKET, BY APPLICATION, 2022–2029 (USD BILLION)
- TABLE 202 INDIA: IMMUNOTHERAPY DRUGS MARKET, BY END USER, 2022–2029 (USD BILLION)
- TABLE 203 SOUTH KOREA: IMMUNOTHERAPY DRUGS MARKET, BY TYPE, 2022–2029 (USD BILLION)
- TABLE 204 SOUTH KOREA: IMMUNOTHERAPY DRUGS MARKET, BY ROUTE OF ADMINISTRATION, 2022–2029 (USD BILLION)
- TABLE 205 SOUTH KOREA: IMMUNOTHERAPY DRUGS MARKET, BY APPLICATION, 2022–2029 (USD BILLION)
- TABLE 206 SOUTH KOREA: IMMUNOTHERAPY DRUGS MARKET, BY END USER, 2022–2029 (USD BILLION)
- TABLE 207 AUSTRALIA: IMMUNOTHERAPY DRUGS MARKET, BY TYPE, 2022–2029 (USD BILLION)
- TABLE 208 AUSTRALIA: IMMUNOTHERAPY DRUGS MARKET, BY ROUTE OF ADMINISTRATION, 2022–2029 (USD BILLION)
- TABLE 209 AUSTRALIA: IMMUNOTHERAPY DRUGS MARKET, BY APPLICATION, 2022–2029 (USD BILLION)
- TABLE 210 AUSTRALIA: IMMUNOTHERAPY DRUGS MARKET, BY END USER, 2022–2029 (USD BILLION)
- TABLE 211 REST OF ASIA PACIFIC: IMMUNOTHERAPY DRUGS MARKET, BY TYPE, 2022–2029 (USD BILLION)
- TABLE 212 REST OF ASIA PACIFIC: IMMUNOTHERAPY DRUGS MARKET, BY ROUTE OF ADMINISTRATION, 2022–2029 (USD BILLION)
- TABLE 213 REST OF ASIA PACIFIC: IMMUNOTHERAPY DRUGS MARKET, BY APPLICATION, 2022–2029 (USD BILLION)
- TABLE 214 REST OF ASIA PACIFIC: IMMUNOTHERAPY DRUGS MARKET, BY END USER, 2022–2029 (USD BILLION)
- TABLE 215 LATIN AMERICA: IMMUNOTHERAPY DRUGS MARKET, BY COUNTRY, 2022–2029 (USD BILLION)
- TABLE 216 LATIN AMERICA: IMMUNOTHERAPY DRUGS MARKET, BY TYPE, 2022–2029 (USD BILLION)
- TABLE 217 LATIN AMERICA: IMMUNOTHERAPY DRUGS MARKET, BY ROUTE OF ADMINISTRATION, 2022–2029 (USD BILLION)
- TABLE 218 LATIN AMERICA: IMMUNOTHERAPY DRUGS MARKET, BY APPLICATION, 2022–2029 (USD BILLION)
- TABLE 219 LATIN AMERICA: IMMUNOTHERAPY DRUGS MARKET, BY END USER, 2022–2029 (USD BILLION)
- TABLE 220 BRAZIL: IMMUNOTHERAPY DRUGS MARKET, BY TYPE, 2022–2029 (USD BILLION)
- TABLE 221 BRAZIL: IMMUNOTHERAPY DRUGS MARKET, BY ROUTE OF ADMINISTRATION, 2022–2029 (USD BILLION)
- TABLE 222 BRAZIL: IMMUNOTHERAPY DRUGS MARKET, BY APPLICATION, 2022–2029 (USD BILLION)
- TABLE 223 BRAZIL: IMMUNOTHERAPY DRUGS MARKET, BY END USER, 2022–2029 (USD BILLION)
- TABLE 224 REST OF LATIN AMERICA: IMMUNOTHERAPY DRUGS MARKET, BY TYPE, 2022–2029 (USD BILLION)
- TABLE 225 REST OF LATIN AMERICA: IMMUNOTHERAPY DRUGS MARKET, BY ROUTE OF ADMINISTRATION, 2022–2029 (USD BILLION)
- TABLE 226 REST OF LATIN AMERICA: IMMUNOTHERAPY DRUGS MARKET, BY APPLICATION, 2022–2029 (USD BILLION)
- TABLE 227 REST OF LATIN AMERICA: IMMUNOTHERAPY DRUGS MARKET, BY END USER, 2022–2029 (USD BILLION)
- TABLE 228 MIDDLE EAST: IMMUNOTHERAPY DRUGS MARKET, BY REGION, 2022–2029 (USD BILLION)
- TABLE 229 MIDDLE EAST: IMMUNOTHERAPY DRUGS MARKET, BY TYPE, 2022–2029 (USD BILLION)
- TABLE 230 MIDDLE EAST: IMMUNOTHERAPY DRUGS MARKET, BY ROUTE OF ADMINISTRATION, 2022–2029 (USD BILLION)
- TABLE 231 MIDDLE EAST: IMMUNOTHERAPY DRUGS MARKET, BY APPLICATION, 2022–2029 (USD BILLION)
- TABLE 232 MIDDLE EAST: IMMUNOTHERAPY DRUGS MARKET, BY END USER, 2022–2029 (USD BILLION)
- TABLE 233 GCC COUNTRIES: IMMUNOTHERAPY DRUGS MARKET, BY COUNTRY, 2022–2029 (USD BILLION)
- TABLE 234 GCC COUNTRIES: IMMUNOTHERAPY DRUGS MARKET, BY TYPE, 2022–2029 (USD BILLION)
- TABLE 235 GCC COUNTRIES: IMMUNOTHERAPY DRUGS MARKET, BY ROUTE OF ADMINISTRATION, 2022–2029 (USD BILLION)
- TABLE 236 GCC COUNTRIES: IMMUNOTHERAPY DRUGS MARKET, BY APPLICATION, 2022–2029 (USD BILLION)
- TABLE 237 GCC COUNTRIES: IMMUNOTHERAPY DRUGS MARKET, BY END USER, 2022–2029 (USD BILLION)
- TABLE 238 SAUDI ARABIA: IMMUNOTHERAPY DRUGS MARKET, BY TYPE, 2022–2029 (USD BILLION)
- TABLE 239 SAUDI ARABIA: IMMUNOTHERAPY DRUGS MARKET, BY ROUTE OF ADMINISTRATION, 2022–2029 (USD BILLION)
- TABLE 240 SAUDI ARABIA: IMMUNOTHERAPY DRUGS MARKET, BY APPLICATION, 2022–2029 (USD BILLION)
- TABLE 241 SAUDI ARABIA: IMMUNOTHERAPY DRUGS MARKET, BY END USER, 2022–2029 (USD BILLION)
- TABLE 242 UAE: IMMUNOTHERAPY DRUGS MARKET, BY TYPE, 2022–2029 (USD BILLION)
- TABLE 243 UAE: IMMUNOTHERAPY DRUGS MARKET, BY ROUTE OF ADMINISTRATION, 2 022–2029 (USD BILLION)
- TABLE 244 UAE: IMMUNOTHERAPY DRUGS MARKET, BY APPLICATION, 2022–2029 (USD BILLION)
- TABLE 245 UAE: IMMUNOTHERAPY DRUGS MARKET, BY END USER, 2022–2029 (USD BILLION)
- TABLE 246 REST OF GCC COUNTRIES: IMMUNOTHERAPY DRUGS MARKET, BY TYPE, 2022–2029 (USD BILLION)
- TABLE 247 REST OF GCC COUNTRIES: IMMUNOTHERAPY DRUGS, BY ROUTE OF ADMINISTRATION, 2022–2029 (USD BILLION)
- TABLE 248 REST OF GCC COUNTRIES: IMMUNOTHERAPY DRUGS MARKET, BY APPLICATION, 2022–2029 (USD BILLION)
- TABLE 249 REST OF GCC COUNTRIES: IMMUNOTHERAPY DRUGS MARKET, BY END USER, 2022–2029 (USD BILLION)
- TABLE 250 REST OF MIDDLE EAST: IMMUNOTHERAPY DRUGS MARKET, BY TYPE, 2022–2029 (USD BILLION)
- TABLE 251 REST OF MIDDLE EAST: IMMUNOTHERAPY DRUGS MARKET, BY ROUTE OF ADMINISTRATION, 2022–2029 (USD BILLION)
- TABLE 252 REST OF MIDDLE EAST: IMMUNOTHERAPY DRUGS MARKET, BY APPLICATION, 2022–2029 (USD BILLION)
- TABLE 253 REST OF MIDDLE EAST: IMMUNOTHERAPY DRUGS THERAPEUTICS MARKET, BY END USER, 2022–2029 (USD BILLION)
- TABLE 254 AFRICA: IMMUNOTHERAPY DRUGS MARKET, BY TYPE, 2022–2029 (USD BILLION)
- TABLE 255 AFRICA: IMMUNOTHERAPY DRUGS MARKET, BY ROUTE OF ADMINISTRATION, 2022–2029 (USD BILLION)
- TABLE 256 AFRICA: IMMUNOTHERAPY DRUGS MARKET, BY APPLICATION, 2022–2029 (USD BILLION)
- TABLE 257 AFRICA: IMMUNOTHERAPY DRUGS MARKET, BY END USER, 2022–2029 (USD BILLION)
- TABLE 258 OVERVIEW OF STRATEGIES ADOPTED BY KEY PLAYERS IN IMMUNOTHERAPY DRUGS MARKET
- TABLE 259 IMMUNOTHERAPY DRUGS MARKET: DEGREE OF COMPETITION
- TABLE 260 IMMUNOTHERAPY DRUGS MARKET: TYPE FOOTPRINT
- TABLE 261 IMMUNOTHERAPY DRUGS MARKET: APPLICATION FOOTPRINT
- TABLE 262 IMMUNOTHERAPY DRUGS MARKET: ROUTE OF ADMINISTRATION FOOTPRINT
- TABLE 263 IMMUNOTHERAPY DRUGS MARKET: REGION FOOTPRINT
- TABLE 264 IMMUNOTHERAPY DRUGS MARKET: DETAILED LIST OF KEY STARTUPS/SMES
- TABLE 265 IMMUNOTHERAPY DRUGS MARKET: COMPETITIVE BENCHMARKING OF KEY START UPS/SMES
- TABLE 266 IMMUNOTHERAPY DRUGS MARKET: PRODUCT APPROVALS, JANUARY 2021–MAY 2024
- TABLE 267 IMMUNOTHERAPY DRUGS MARKET: DEALS, JANUARY 2021–MAY 2024
- TABLE 268 IMMUNOTHERAPY DRUGS MARKET: OTHER DEVELOPMENTS, JANUARY 2021–MAY 2024
- TABLE 269 MERCK & CO., INC.: COMPANY OVERVIEW
- TABLE 270 MERCK & CO., INC.: PRODUCTS/SERVICES/SOLUTIONS OFFERED
- TABLE 271 MERCK & CO., INC.: PRODUCT APPROVALS, JANUARY 2021–MAY 2024
- TABLE 272 MERCK & CO., INC.: DEALS, JANUARY 2021–MAY 2024
- TABLE 273 JOHNSON & JOHNSON SERVICES, INC.: COMPANY OVERVIEW
- TABLE 274 JOHNSON & JOHNSON SERVICES, INC.: PRODUCTS/SERVICES/SOLUTIONS OFFERED
- TABLE 275 JOHNSON & JOHNSON SERVICES, INC.: PRODUCT APPROVALS, JANUARY 2021–MAY 2024
- TABLE 276 JOHNSON & JOHNSON SERVICES, INC.: DEALS, JANUARY 2021–MAY 2024
- TABLE 277 JOHNSON & JOHNSON SERVICES, INC.: EXPANSIONS, JANUARY 2021–MAY 2024
- TABLE 278 F. HOFFMANN-LA ROCHE LTD.: COMPANY OVERVIEW
- TABLE 279 F. HOFFMANN-LA ROCHE LTD.: PRODUCTS/SERVICES/SOLUTIONS OFFERED
- TABLE 280 F. HOFFMANN-LA ROCHE LTD.: PRODUCT APPROVALS, JANUARY 2021–MAY 2024
- TABLE 281 F. HOFFMANN-LA ROCHE LTD.: DEALS, JANUARY 2021–MAY 2024
- TABLE 282 ASTRAZENECA: COMPANY OVERVIEW
- TABLE 283 ASTRAZENECA: PRODUCTS/SERVICES/SOLUTIONS OFFERED
- TABLE 284 ASTRAZENECA: PRODUCT APPROVALS, JANUARY 2021–MAY 2024
- TABLE 285 ASTRAZENECA: DEALS, JANUARY 2021–MAY 2024
- TABLE 286 ASTRAZENECA: EXPANSIONS, JANUARY 2021–MAY 2024
- TABLE 287 PFIZER INC.: COMPANY OVERVIEW
- TABLE 288 PFIZER INC.: PRODUCTS/SERVICES/SOLUTIONS OFFERED
- TABLE 289 PFIZER INC.: PRODUCT APPROVALS, JANUARY 2021–MAY 2024
- TABLE 290 PFIZER INC.: DEALS, JANUARY 2021–MAY 2024
- TABLE 291 AMGEN INC.: COMPANY OVERVIEW
- TABLE 292 AMGEN INC.: PRODUCTS/SERVICES/SOLUTIONS OFFERED
- TABLE 293 AMGEN INC.: PRODUCT APPROVALS, JANUARY 2021–MAY 2024
- TABLE 294 AMGEN INC.: EXPANSIONS, JANUARY 2021–MAY 2024
- TABLE 295 NOVARTIS AG: COMPANY OVERVIEW
- TABLE 296 NOVARTIS AG: PRODUCTS/SERVICES/SOLUTIONS OFFERED
- TABLE 297 NOVARTIS AG: PRODUCT APPROVALS, JANUARY 2021–MAY 2024
- TABLE 298 NOVARTIS AG: DEALS, JANUARY 2021–MAY 2024
- TABLE 299 ELI LILLY AND COMPANY: COMPANY OVERVIEW
- TABLE 300 ELI LILLY AND COMPANY: PRODUCTS/SERVICES/SOLUTIONS OFFERED
- TABLE 301 ELI LILLY AND COMPANY: PRODUCT APPROVALS, JANUARY 2021–MAY 2024
- TABLE 302 ELI LILLY AND COMPANY.: DEALS, JANUARY 2021–MAY 2024
- TABLE 303 SANOFI: COMPANY OVERVIEW
- TABLE 304 SANOFI: PRODUCTS/SERVICES/SOLUTIONS OFFERED
- TABLE 305 SANOFI: PRODUCT APPROVALS, JANUARY 2021–MAY 2024
- TABLE 306 SANOFI: DEALS, JANUARY 2021–MAY 2024
- TABLE 307 BRISTOL-MYERS SQUIBB COMPANY: COMPANY OVERVIEW
- TABLE 308 BRISTOL-MYERS SQUIBB COMPANY: PRODUCTS/SERVICES/SOLUTIONS OFFERED
- TABLE 309 BRISTOL-MYERS SQUIBB COMPANY: PRODUCT APPROVALS, JANUARY 2021–MAY 2024
- TABLE 310 BRISTOL-MYERS SQUIBB COMPANY: DEALS, JANUARY 2021–MAY 2024
- TABLE 311 GILEAD SCIENCES, INC.: COMPANY OVERVIEW
- TABLE 312 GILEAD SCIENCES, INC.: PRODUCTS/SERVICES/SOLUTIONS OFFERED
- TABLE 313 GILEAD SCIENCES, INC.: PRODUCT APPROVALS, JANUARY 2021–MAY 2024
- TABLE 314 GILEAD SCIENCES, INC.: DEALS, JANUARY 2021–MAY 2024
- TABLE 315 GILEAD SCIENCES, INC.: OTHER DEVELOPMENTS, JANUARY 2021–MAY 2024
- TABLE 316 TAKEDA PHARMACEUTICAL COMPANY LIMITED: COMPANY OVERVIEW
- TABLE 317 TAKEDA PHARMACEUTICAL COMPANY LIMITED: PRODUCTS/SERVICES/SOLUTIONS OFFERED
- TABLE 318 TAKEDA PHARMACEUTICAL COMPANY LIMITED: PRODUCT APPROVALS, JANUARY 2021–MAY 2024
- TABLE 319 TAKEDA PHARMACEUTICAL COMPANY LIMITED: DEALS, JANUARY 2021–MAY 2024
- TABLE 320 TEVA PHARMACEUTICAL INDUSTRIES LTD.: COMPANY OVERVIEW
- TABLE 321 TEVA PHARMACEUTICAL INDUSTRIES LTD.: PRODUCTS/SERVICES/SOLUTIONS OFFERED
- TABLE 322 TEVA PHARMACEUTICAL INDUSTRIES LTD.: DEALS, JANUARY 2021–MAY 2024
- TABLE 323 ABBVIE INC.: COMPANY OVERVIEW
- TABLE 324 ABBVIE INC.: PRODUCTS/SERVICES/SOLUTIONS OFFERED
- TABLE 325 ABBVIE INC.: PRODUCT APPROVALS, JANUARY 2021–MAY 2024
- TABLE 326 ABBVIE INC.: DEALS, JANUARY 2021–MAY 2024
- TABLE 327 GSK PLC: COMPANY OVERVIEW
- TABLE 328 GSK PLC: PRODUCTS/SERVICES/SOLUTIONS OFFERED
- TABLE 329 GSK PLC: PRODUCT APPROVALS, JANUARY 2021–MAY 2024
- TABLE 330 GSK PLC: DEALS, JANUARY 2021–MAY 2024
- TABLE 331 GSK PLC: OTHER DEVELOPMENTS, JANUARY 2021–MAY 2024
- TABLE 332 IMMUNOCORE HOLDINGS PLC: COMPANY OVERVIEW
- TABLE 333 ASTELLAS PHARMA INC.: COMPANY OVERVIEW
- TABLE 334 GENMAB A/S: COMPANY OVERVIEW
- TABLE 335 MACROGENICS, INC.: COMPANY OVERVIEW
- TABLE 336 FERRING BV: COMPANY OVERVIEW
- TABLE 337 Y-MABS THERAPEUTICS, INC.: COMPANY OVERVIEW
- TABLE 338 BIOGEN: COMPANY OVERVIEW
- TABLE 339 KYOWA KIRIN CO., LTD.: COMPANY OVERVIEW
- TABLE 340 SWEDISH ORPHAN BIOVITRUM AB: COMPANY OVERVIEW
- TABLE 341 BOEHRINGER INGELHEIM INTERNATIONAL GMBH: COMPANY OVERVIEW
- FIGURE 1 IMMUNOTHERAPY DRUGS MARKET: SEGMENTS COVERED
- FIGURE 2 IMMUNOTHERAPY DRUGS MARKET: REGIONS COVERED
- FIGURE 3 IMMUNOTHERAPY DRUGS MARKET: YEARS CONSIDERED
- FIGURE 4 IMMUNOTHERAPY DRUGS MARKET: RESEARCH DESIGN
- FIGURE 5 IMMUNOTHERAPY DRUGS MARKET: BREAKDOWN OF PRIMARIES
- FIGURE 6 IMMUNOTHERAPY DRUGS MARKET SIZE ESTIMATION (SUPPLY-SIDE ANALYSIS), 2023
- FIGURE 7 MARKET SIZE ESTIMATION: COMPANY REVENUE ANALYSIS-BASED ESTIMATION, 2023
- FIGURE 8 MARKET SIZE VALIDATION FROM PRIMARY SOURCES
- FIGURE 9 IMMUNOTHERAPY DRUGS MARKET: CAGR PROJECTIONS
- FIGURE 10 IMMUNOTHERAPY DRUGS MARKET: ANALYSIS OF DEMAND-SIDE DRIVERS, RESTRAINTS, OPPORTUNITIES, AND CHALLENGES
- FIGURE 11 DATA TRIANGULATION METHODOLOGY
- FIGURE 12 IMMUNOTHERAPY DRUGS MARKET, BY TYPE, 2024 VS. 2029 (USD BILLION)
- FIGURE 13 IMMUNOTHERAPY DRUGS MARKET, BY APPLICATION, 2024 VS. 2029 (USD BILLION)
- FIGURE 14 IMMUNOTHERAPY DRUGS MARKET, BY ROUTE OF ADMINISTRATION, 2024 VS. 2029 (USD BILLION)
- FIGURE 15 IMMUNOTHERAPY DRUGS MARKET, BY END USER, 2024 VS. 2029 (USD BILLION)
- FIGURE 16 IMMUNOTHERAPY DRUGS MARKET: REGIONAL SNAPSHOT
- FIGURE 17 TECHNOLOGICAL ADVANCEMENTS IN ANTIBODY ENGINEERING TO DRIVE MARKET
- FIGURE 18 US AND ANTIBODY DRUGS SEGMENT COMMANDED LARGEST MARKET SHARE IN 2023
- FIGURE 19 ANTIBODY DRUGS TO DOMINATE NORTH AMERICAN MARKET DURING STUDY PERIOD
- FIGURE 20 IMMUNOTHERAPY DRUGS MARKET: DRIVERS, RESTRAINTS, OPPORTUNITIES, AND CHALLENGES
- FIGURE 21 IMMUNOTHERAPY DRUGS MARKET: PORTER’S FIVE FORCES ANALYSIS
- FIGURE 22 INFLUENCE OF KEY STAKEHOLDERS ON BUYING PROCESS OF IMMUNOTHERAPY DRUGS
- FIGURE 23 KEY BUYING CRITERIA FOR HOSPITALS AND LONG-TERM CARE FACILITIES
- FIGURE 24 IMMUNOTHERAPY DRUGS MARKET: VALUE CHAIN ANALYSIS
- FIGURE 25 IMMUNOTHERAPY DRUGS MARKET: SUPPLY CHAIN ANALYSIS
- FIGURE 26 AVERAGE SELLING PRICE TREND OF IMMUNOTHERAPY DRUGS, BY KEY PLAYER
- FIGURE 27 IMMUNOTHERAPY DRUGS MARKET: ECOSYSTEM MAP
- FIGURE 28 PATENT APPLICATIONS FOR IMMUNOTHERAPY DRUGS (JANUARY 2012–DECEMBER 2023)
- FIGURE 29 NORTH AMERICA: IMMUNOTHERAPY DRUGS MARKET SNAPSHOT
- FIGURE 30 ASIA PACIFIC: IMMUNOTHERAPY DRUGS MARKET SNAPSHOT
- FIGURE 31 REVENUE ANALYSIS OF KEY PLAYERS IN IMMUNOTHERAPY DRUGS MARKET (2021–2023)
- FIGURE 32 MARKET SHARE ANALYSIS OF KEY PLAYERS IN IMMUNOTHERAPY DRUGS MARKET (2023)
- FIGURE 33 IMMUNOTHERAPY DRUGS MARKET: COMPANY EVALUATION MATRIX (KEY PLAYERS), 2023
- FIGURE 34 IMMUNOTHERAPY DRUGS MARKET: COMPANY FOOTPRINT
- FIGURE 35 IMMUNOTHERAPY DRUGS MARKET: COMPANY EVALUATION MATRIX (STARTUPS/SMES), 2023
- FIGURE 36 EV/EBITDA OF KEY PLAYERS
- FIGURE 37 YEAR-TO-DATE (YTD) PRICE TOTAL RETURN AND 5-YEAR STOCK BETA OF KEY PLAYERS
- FIGURE 38 IMMUNOTHERAPY DRUGS MARKET: BRAND/PRODUCT COMPARATIVE ANALYSIS
- FIGURE 39 MERCK & CO., INC.: COMPANY SNAPSHOT (2023)
- FIGURE 40 JOHNSON & JOHNSON SERVICES, INC.: COMPANY SNAPSHOT (2023)
- FIGURE 41 F. HOFFMANN-LA ROCHE LTD.: COMPANY SNAPSHOT (2023)
- FIGURE 42 ASTRAZENECA: COMPANY SNAPSHOT (2023)
- FIGURE 43 PFIZER INC.: COMPANY SNAPSHOT (2023)
- FIGURE 44 AMGEN INC.: COMPANY SNAPSHOT (2023)
- FIGURE 45 NOVARTIS AG: COMPANY SNAPSHOT (2023)
- FIGURE 46 ELI LILLY AND COMPANY.: COMPANY SNAPSHOT (2023)
- FIGURE 47 SANOFI: COMPANY SNAPSHOT (2023)
- FIGURE 48 BRISTOL-MYERS SQUIBB COMPANY: COMPANY SNAPSHOT (2023)
- FIGURE 49 GILEAD SCIENCES, INC.: COMPANY SNAPSHOT (2023)
- FIGURE 50 TAKEDA PHARMACEUTICAL COMPANY LIMITED: COMPANY SNAPSHOT (2023)
- FIGURE 51 TEVA PHARMACEUTICAL INDUSTRIES LTD.: COMPANY SNAPSHOT (2023)
- FIGURE 52 ABBVIE INC.: COMPANY SNAPSHOT (2023)
- FIGURE 53 GSK PLC: COMPANY SNAPSHOT (2023)
This study involved four major activities in estimating the current size of the immunotherapy drugs market. Exhaustive secondary research was carried out to collect information on the market, its peer markets, and its parent market. The next step was to validate these findings, assumptions, and sizing with industry experts across the value chain through primary research. Both top-down and bottom-up approaches were employed to estimate the complete market size. After that, market breakdown and data triangulation procedures were used to estimate the market size of segments.
Secondary Research
Secondary research was used mainly to identify and collect information for the extensive, technical, market-oriented, and commercial study of the immunotherapy drugs market. The secondary sources referred to for this research study include publications from government sources, such as National Institutes of Health (NIH), United States Food and Drug Administration (US FDA), World Health Organization (WHO), European Pharmaceutical Review, American Society of Gene & Cell Therapy (ASGCT), European Society of Gene and Cell Therapy (ESGCT), European Medicines Agency (EMA), and the Alliance for Regenerative Medicine (ARM). Secondary sources also include corporate and regulatory filings, such as annual reports, SEC filings, investor presentations, and financial statements; business magazines and research journals; press releases; and trade, business, and professional associations. Secondary data was collected and analyzed to arrive at the overall size of the immunotherapy drugs market, which was validated through primary research. These sources were also used to obtain key information about major players, market classification, and segmentation according to industry trends, regional/country-level markets, market developments, and technology perspectives.
Primary Research
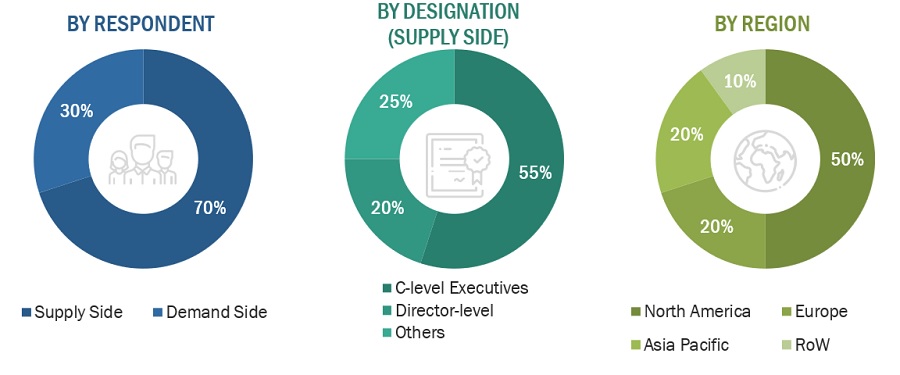
In-depth interviews were conducted with various primary respondents, including key industry participants, subject-matter experts (SMEs), C-level executives of key market players, and industry consultants, among other experts, to obtain and verify the critical qualitative and quantitative information as well as assess the prospects of the market. Various primary sources from both the supply and demand sides of the market were interviewed to obtain qualitative and quantitative information.
To know about the assumptions considered for the study, download the pdf brochure
Market Size Estimation
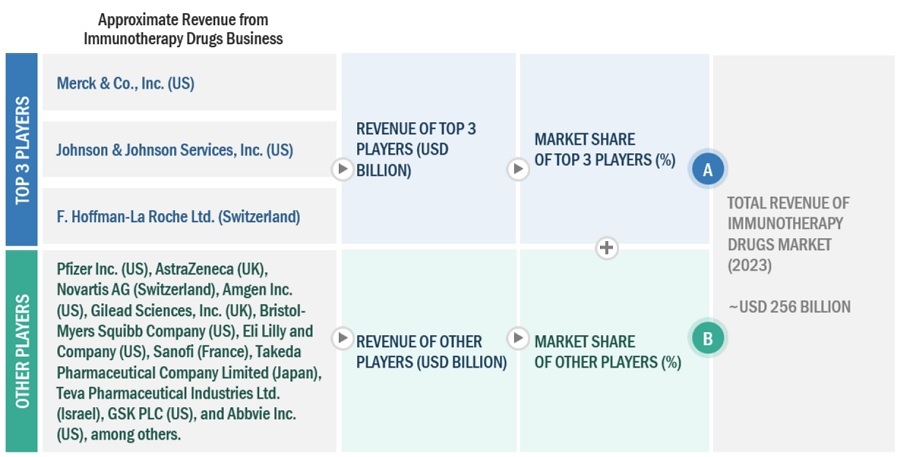
The global size of the immunotherapy drugs market was estimated through multiple approaches. A detailed market estimation approach was followed to estimate and validate the value of the immunotherapy drugs and other dependent submarkets. The research methodology used to estimate the market size includes the following:
- The key players in the industry and markets have been identified through extensive secondary research
- The industry’s supply chain and market size, in terms of value, have been determined through primary and secondary research processes.
- All percentage shares, splits, and breakdowns have been determined using secondary sources and verified through primary sources.
To know about the assumptions considered for the study, Request for Free Sample Report
Data Triangulation
After arriving at the overall market size—using the market size estimation processes—the market was split into several segments. To complete the overall market engineering process and arrive at the exact statistics of each market segment, data triangulation and market breakdown procedures were employed, wherever applicable. The data was triangulated by studying various factors and trends from both the demand and supply sides in the immunotherapy drugs market.
Market Definition
Immunotherapy drugs are a broad category of therapeutic agents that help stimulate the body's immune system to combat diseases. These drugs include antibody therapies, cell & gene therapy, inhibitor drugs, and other drugs such as oncolytic viral therapy and cancer vaccines. These drugs are engineered to enhance the immune response or counteract the immune system's regulatory mechanisms, thereby enabling the body to effectively target and eliminate disease-causing agents or cells. Immunotherapy drugs are used to treat various medical conditions, including cancer, autoimmune diseases, hematology, osteology, neurology, and other therapy areas (such as ophthalmology, dermatology, and cardiovascular disorders).
Stakeholders
- Research Institutes
- Pharmaceutical & Biotechnology Companies
- Venture Capitalists and Investors
- Contract Development & Manufacturing Organizations
- Government Associations
- Healthcare Associations/Institutes
- Business Research & Consulting Service Providers
Report Objectives
- To define, describe, and forecast the immunotherapy market based on type, application, route of administrration, end user, and region
- To provide detailed information about the drivers, restraints, opportunities, and challenges influencing the market growth
- To strategically analyze micromarkets1 with respect to individual growth trends, prospects, and contributions to the overall immunotherapy drugs market
- To analyze market opportunities for stakeholders and provide details of the competitive landscape for key players
- To forecast the size of market segments in North America, Europe, the Asia Pacific (APAC), Latin America, Middle East and Africa
- To profile the key players and comprehensively analyze their core competencies2 in terms of key developments, product portfolios, and financials
- To track and analyze competitive developments, such as partnerships, collaborations, agreements, and acquisitions, in the immunotherapy drugs market
- Micromarkets are the further segments and subsegments of the immunotherapy drugs market.
- Core competencies of companies are captured in terms of the key developments, market shares, and key strategies adopted to sustain their positions in the market.
Available Customizations:
With the given market data, MarketsandMarkets offers customizations as per the company’s specific needs. The following customization options are available for the report:
- Company Information: Detailed analysis and profiling of additional market players (up to five)
- Geographic Analysis: Further breakdown of the Rest of Europe market, by country, based on approvals and feasibility. Further breakdown of the Rest of Asia Pacific market, by country, based on approvals and feasibility
Growth opportunities and latent adjacency in Immunotherapy Drugs Market
To what extent has COVID-19 impacted the global growth of the Immunotherapy Drugs Market?