Hydrogen Technology Testing, Inspection and Certification (TIC) Market

Hydrogen Technology Testing, Inspection and Certification (TIC) Market by Process (Generation, Storage, Transportation/Distribution), Service Type (Testing, Inspection, Certification), Testing Type, Application and Region - Global Forecast to 2029

Report Code: SE 9067 Jul, 2024, by marketsandmarkets.com

[252 Pages Report] The global hydrogen technology testing, inspection, and certification (TIC) market is valued at USD 4.1 billion in 2024 and is projected to reach USD 9.2 billion by 2029; it is expected to register a CAGR of 17.8% during the forecast period. The increase in demand for cleaner fuels and the presence of favourable government polices with respect to decarbonising several sectors, increase in development of hydrogen infrastructure like refueling stations, pipelines and storage facilities, increasing inherent risks and strict regulations in hydrogen processes and progression of technologies that would be instrumental in the advancement of green hydrogen are some of the factors that catalyse the growth of hydrogen technology TIC market constantly.

Hydrogen Technology Testing, Inspection and Certification (TIC) Market

Hydrogen Technology Testing, Inspection and Certification (TIC) Market

Hydrogen Technology Testing, Inspection and Certification (TIC) Market Forecast to 2029

To know about the assumptions considered for the study, Request for Free Sample Report

Market Dynamics:

Driver: Increasing demand of net zero emission fuels

Hydrogen is viewed as an efficient way of generating ‘clean’ power since many nations and corporations seek to minimize their emissions. Green hydrogen has the potential of improving development of renewable energy sources, making the power system more flexible, and providing long-term energy storage mechanism. While the current cost is higher than that of grey and blue hydrogen, the cost of green hydrogen is expected to reduce and approximate the cost of grey and blue hydrogen by 2030. In 2023, it makes up only 0. Aims to produce 1% of the overall hydrogen in the world. Nevertheless, constant reduction of the costs of renewable electricity, which constitutes approximately 70% of hydrogen production costs, and development of electrolysis technologies mean that green hydrogen will become one of the best investment in the sphere of clean energy . Of all the industries, oil and gas, large utilities, and industrial sectors such as steel and fertilizers, have espoused green hydrogen as a solution for managing the variability of renewable power sources as well as decarbonizing industries that are hard to abate such as industrial, chemical, and transport sectors. As of now, almost all the hydrogen being used is grey hydrogen, which is approximately 90 Million tons per year (Mtpa). However, this is expected to reduce as the demand for clean hydrogen increases and the costs of green hydrogen continue to drop. Clean hydrogen share in the total hydrogen demand could be 73 – 100% by 2050, amounting 125 – 585 Mtpa, while grey hydrogen could account for only 1 – 50 Mtpa.

Restraint: Impacts of hydrogen projects on water supply and land use

Green hydrogen production calls for high amounts of renewable energy and water to feed electrolyzers which may put pressure on the available land and water resources. Some inexperienced developing nations with scarce energy may harm the social structure by diverting the power and water to green hydrogen schemes; this may jeopardize the energy transformation and destabilize the society. Electrolysis of water to produce hydrogen is another important process that requires water and approximately one liter of water is required to generate one kilogram of hydrogen. It similarly asserts that a stable and sufficient water supply must be maintained, particularly in arid areas. Desalination of sea water could be used for green hydrogen production but this should not affect water requirements for other purposes like domestic uses or for agricultural purposes. For example, some countries in the Middle East and North Africa are already experiencing water scarcity for domestic and agricultural purposes which may make it difficult to supply water for the production of hydrogen without regard to other competing uses. Secondly, there is the factor of land usage and management. Although the built area of electrolysis plants is small, the renewable energy systems supporting them demand considerable land. Such processes might change the land usage for social and ecological parameters. The analysis and proper selection of locations should be considered in order to use these territories for the implementation of green hydrogen projects according to the principles of the United Nations Sustainable Development Goals.

Opportunity: Emergence of hydrogen fuel cells for the automotive sector

Hydrogen is projected to be adopted in the near future in such sectors as heavy duty vehicles including trucks and buses through a hydrogen fuel cell system for transportation sectors. This market is one where hydrogen and hydrogen fuel cells are to make its significant contribution. Thus, while battery electric vehicles have many advantages over BEVs, hydrogen fuel cell electric vehicles offer their drivers more immediate refueling times and longer distances. Public transportation FCEV buses are already existing in places such as Japan and even the costs of manufacturing these vehicles are steadily declining and are expected to decline steeper as more and more vehicles are produced. Currently hydrogen fuel cell trucks are not very common but forecasts have predicted that they will be around in the coming years. Same also applies to such markets like that of taxis whereby frequent refueling can be very costly and therefore FCEVS have an added advantage over BEVS. This will lead to the creation of reputable hydrogen fuelling stations to accommodate these vehicles. Conversely, low-carbon hydrogen does significantly cut emissions in other industries like the rail, marine transport, and aviation industries.

Challenge: High hydrogen generation, storage, and transportation costs

Creating a hydrogen low-carbon system is extremely challenging because there is no clean hydrogen value chain, while fossil fuels are currently dominating the market, and the number of pilot projects of low-carbon hydrogen is limited. A global market for clean hydrogen must first be developed, and this requires establishing completely new value chains; key issues here include the absence of a hydrogen infrastructure that enables the self-propelled use of fuel cell vehicles. Challenges like hydrogen transport and storage, and the fact that on-site production is very costly are contentious. However, because hydrogen is abundant in the universe, cost can fluctuate significantly depending on how it is developed. The cost structures of types like black, gray, blue, and green hydrogen vary greatly, with green hydrogen, which is critical for attaining Net Zero targets around the globe, being the most expensive due to costs accrued on electrolyzers and renewable power resources.

Hydrogen technology TIC market Ecosystem

Prominent companies in this market include well-established TIC service providers offering services for energy & power sector. These companies have been operating in the market for several years and possess a diversified service portfolio, state-of-the-art technologies, and strong global sales and marketing networks. Prominent companies in this market include SGS SA (Switzerland), Bureau Veritas (France), Intertek Group plc (UK), DEKRA (Germany), TÜV SÜD (Germany), DNV GL (Norway), TÜV RHEINLAND (Germany), Applus+ (Spain), TÜV NORD Group (Germany), Element Materials Technology (UK), and UL LLC (US).

Hydrogen Technology Testing, Inspection and Certification (TIC) Market by Ecosystem

By Generation, Gray hydrogen is anticipated to maintain its position as the largest segment by generation type throughout the forecast period.

This report segments the hydrogen market based on sector into three subsegments: generation type for storing and transporting. The generation type segment is further sub-divided in the gray, blue and green hydrogen. The segments for hydrogen consumption are based on the type of hydrogen produced, namely brown, gray, green, and blue hydrogen. Pricing natural gas is comparatively cheaper or low-cost and this is a main reason why grey hydrogen is produced. Natural gas is a hydrocarbon resource that exists in large quantities across the globe and when the price is low, it can be an economically viable hydrogen feed.

In terms of application, mobility is projected to experience the most rapid growth throughout the forecast period.

This report categorizes the hydrogen market by application into four segments: energy, mobility, chemical & refinery, and others. The "others" segment includes applications in industries such as aerospace and defense. Mobility is anticipated to show the highest growth rate during the forecast period. Increased investments in fuel cells are expected to propel the hydrogen market forward. Governments and organizations worldwide are offering support, incentives, and funding to foster the development, deployment, and commercialization of hydrogen fuel cells, aligning with efforts to promote clean energy and combat climate change.

During the forecast period Asia Pacific is projected to record highest growth rate of the overall hydrogen technology TIC market.

The Asia-Pacific’s hydrogen TIC market is the largest in the world, driven by rapid industrialization particularly in sectors such as chemicals, manufacturing and energy. The region’s strict regulatory landscape focusing on safety, environmental protection and quality standards boosts the demand for TIC services. Also, there are sizeable investments in hydrogen infrastructure inclusive of manufacturing, storage and transportation that require stringent testing and observation of international specifications. Similarly, initiatives from governments to promote clean energy and sustainable development also increase the need for TICs services to ensure that hydrogen technologies remain safe and reliable. These put together make Asia Pacific the dominant market for hydrogen TIC services.

Hydrogen Technology Testing, Inspection and Certification (TIC) Market by Region

Hydrogen Technology Testing, Inspection and Certification (TIC) Market by Region

To know about the assumptions considered for the study, download the pdf brochure

Key Market Players

SGS SA (Switzerland), Bureau Veritas (France), Intertek Group plc (UK), DEKRA (Germany), TÜV SÜD (Germany), DNV GL (Norway), TÜV RHEINLAND (Germany), Applus+ (Spain), TÜV NORD Group (Germany), and UL LLC (US) are some of the key players in the hydrogen technology TIC companies.

Get online access to the report on the World's First Market Intelligence Cloud

  • Easy to Download Historical Data & Forecast Numbers
  • Company Analysis Dashboard for high growth potential opportunities
  • Research Analyst Access for customization & queries
  • Competitor Analysis with Interactive dashboard
  • Latest News, Updates & Trend analysis
Request Sample

Scope of the Report

Report Metric

Details

Market Size Availability for Years

2020–2029

Base Year

2023

Forecast Period

2024–2029

Forecast Units

Value (USD Million/Billion)

Segments Covered

By Process, Service Type, Testing Type, Application, and Region

Geographies Covered

North America, Europe, Asia Pacific, and RoW

Companies Covered

SGS SA (Switzerland), Bureau Veritas (France), Intertek Group plc (UK), DEKRA (Germany), TÜV SÜD (Germany), DNV GL (Norway), TÜV RHEINLAND (Germany), Applus+ (Spain), TÜV NORD Group (Germany), Element Materials Technology (UK), and UL LLC (US) are some of the key players in the hydrogen technology TIC market.

Hydrogen Technology Testing, Inspection and Certification (TIC) Market Highlights

This research report categorizes the hydrogen technology TIC market based process, service type, testing type, application, and region.

Segment

Subsegment

By Process

  • Introduction
  • Generation
  • Storage
  • Transportation/Distribution

By Application

  • Introduction
  • Refining & Chemicals
  • Mobility
  • Energy 
  • Other Applications

By Service Type

  • Introduction
  • Testing
  • Inspection
  • Certification
  • Others

By Testing Type

  • Introduction
  • Pressure Cycle, Leakage and Tightness Test
  • Overpressure, Burst, and Flow Test
  • Hydrogen Permeation and Compatibility Test
  • Hydraulic Test
  • Environmental Simulation Test
  • Electromagnetic Compatibility Test
  • Vibration Test 

By Region

  • Introduction
  • North America
    • Impact of Recession
    • US
    • Canada
    • Mexico
  • Europe
    • Impact of Recession
    • UK
    • Germany
    • France
    • Rest of Europe
  • Asia Pacific
    • Impact of Recession
    • China
    • Japan
    • India
    • South Korea
    • Rest of Asia Pacific
  • RoW
    • Impact of Recession
    • Middle East & Africa
      • GCC Countries
      • Rest of Middle East & Africa
    • South America

Recent Developments

  • In December 2023, Bureau Veritas and Avance Labs, the accredited I-REC (International Renewable Energy Certificate) code manager for tracking and certifying attributes related to hydrogen and its derivative fuels and products, have entered into a memorandum of understanding (MoU). This MoU acknowledges their shared interest and the potential benefits of collaborating in the verification and certification of attributes. Bureau Veritas will serve as the exclusive Assurance Service Provider during the pilot phase of the I-REC (HX) Hydrogen Code.
  • In November 2023, DEKRA has been appointed by the Clean Energy Partnership (CEP) to independently test and certify hydrogen refueling stations following ISO 19880-1c standards. This designation makes DEKRA one of the initial testing organizations authorized by CEP for this role. Additionally, DEKRA has established a formal supply agreement with the Center for Solar Energy and Hydrogen Research Baden-Württemberg (ZSW) in Ulm for comprehensive testing services, including acceptance testing, of these refueling stations.
  • In September 2023, Intertek, a leading total quality assurance provider, has launched its Hydrogen Assurance platform to deliver comprehensive advisory and assurance solutions for hydrogen-based projects.
  • In January 2023, Bureau Veritas has launched a certification scheme dedicated to renewable hydrogen to support the growing renewables sector and accelerate the energy transition. The scheme aims to ensure that hydrogen is produced under safe and sustainable practices, and from renewable energy sources.

Frequently Asked Questions (FAQs):

To speak to our analyst for a discussion on the above findings, click Speak to Analyst

TABLE OF CONTENTS
 
1 INTRODUCTION (Page No. - 23)
    1.1 STUDY OBJECTIVES 
    1.2 MARKET DEFINITION 
    1.3 STUDY SCOPE 
           1.3.1 MARKETS COVERED AND REGIONAL SCOPE
           1.3.2 YEARS CONSIDERED
           1.3.3 INCLUSIONS AND EXCLUSIONS
    1.4 CURRENCY CONSIDERED 
    1.5 LIMITATIONS 
    1.6 STAKEHOLDERS 
 
2 RESEARCH METHODOLOGY (Page No. - 27)
    2.1 RESEARCH APPROACH 
           2.1.1 SECONDARY DATA
                    2.1.1.1 List of key secondary sources
                    2.1.1.2 Key data from secondary sources
           2.1.2 PRIMARY DATA
                    2.1.2.1 Intended participants and key opinion leaders in primary interviews
                    2.1.2.2 Key data from primary sources
                    2.1.2.3 Key industry insights
                    2.1.2.4 Breakdown of primaries
           2.1.3 SECONDARY AND PRIMARY RESEARCH
    2.2 MARKET SIZE ESTIMATION 
           2.2.1 BOTTOM-UP APPROACH
                    2.2.1.1 Approach to estimate market size using bottom-up analysis (demand side)
           2.2.2 TOP-DOWN APPROACH
                    2.2.2.1 Approach to estimate market size using top-down analysis (supply side)
    2.3 DATA TRIANGULATION 
    2.4 RESEARCH ASSUMPTIONS 
    2.5 RISK ANALYSIS 
    2.6 RESEARCH LIMITATIONS 
 
3 EXECUTIVE SUMMARY (Page No. - 37)
 
4 PREMIUM INSIGHTS (Page No. - 42)
    4.1 ATTRACTIVE OPPORTUNITIES FOR PLAYERS IN HYDROGEN TECHNOLOGY TIC MARKET 
    4.2 HYDROGEN TECHNOLOGY TIC MARKET, BY PROCESS 
    4.3 HYDROGEN TECHNOLOGY TIC MARKET, BY APPLICATION 
    4.4 HYDROGEN TECHNOLOGY TIC MARKET, BY SERVICE 
    4.5 HYDROGEN TECHNOLOGY TIC MARKET, BY TESTING TYPE 
    4.6 HYDROGEN TECHNOLOGY TIC MARKET, BY REGION 
 
5 MARKET OVERVIEW (Page No. - 45)
    5.1 INTRODUCTION 
    5.2 MARKET DYNAMICS 
           5.2.1 DRIVERS
                    5.2.1.1 Rising focus on achieving sustainable and low-carbon economy
                    5.2.1.2 Increasing use of low-carbon fuel in transportation sector
                    5.2.1.3 Growing production of green hydrogen
                    5.2.1.4 Rising need to ensure safety and reliability of hydrogen technologies
           5.2.2 RESTRAINTS
                    5.2.2.1 Requirement of substantial renewable energy and water to feed electrolyzers
                    5.2.2.2 Lack of uniformity in global TIC standards
           5.2.3 OPPORTUNITIES
                    5.2.3.1 Adoption of hydrogen fuel cells in transportation sector
                    5.2.3.2 Deployment of blockchain technology in TIC services
           5.2.4 CHALLENGES
                    5.2.4.1 Costly on-site production of hydrogen
                    5.2.4.2 Keeping testing protocols and certifications up to date
    5.3 TRENDS/DISRUPTIONS IMPACTING CUSTOMERS’ BUSINESSES 
    5.4 PRICING ANALYSIS 
           5.4.1 AVERAGE SELLING PRICE TREND OF KEY PLAYERS, BY SERVICE TYPE, 2023
           5.4.2 AVERAGE SELLING PRICE TREND OF CERTIFICATION SERVICES OFFERED BY KEY PLAYERS, 2020–2023
           5.4.3 AVERAGE SELLING PRICE TREND OF CERTIFICATION SERVICES, BY REGION, 2020–2023
    5.5 SUPPLY CHAIN ANALYSIS 
    5.6 ECOSYSTEM ANALYSIS 
    5.7 INVESTMENT AND FUNDING SCENARIO 
    5.8 TECHNOLOGY ANALYSIS 
           5.8.1 KEY TECHNOLOGIES
                    5.8.1.1 Hydrogen fuel cells
                    5.8.1.2 Alkaline electrolysis
           5.8.2 COMPLEMENTARY TECHNOLOGIES
                    5.8.2.1 Material science
           5.8.3 ADJACENT TECHNOLOGIES
                    5.8.3.1 Energy storage management systems
                    5.8.3.2 Solid-state storage
    5.9 PATENT ANALYSIS 
    5.10 TRADE ANALYSIS 
           5.10.1 EXPORT DATA (HS CODE 280410)
           5.10.2 IMPORT DATA (HS CODE 280410)
    5.11 KEY CONFERENCES AND EVENTS, 2023–2024 
    5.12 CASE STUDY ANALYSIS 
           5.12.1 APPLUS+ OFFERED TECHNICAL SUPPORT TO HELP GREEN HYDROGEN PLANT OWNER IN BARCELONA TO SUPPLY HYDROGEN FOR TRANSPORTATION AND INDUSTRIAL APPLICATIONS
           5.12.2 SIEMENS ENERGY COLLABORATED WITH TÜV SÜD TO DEVELOP H2-READY POWER PLANTS TO ENSURE RELIABLE ENERGY SUPPLY
           5.12.3 TÜV SÜD HELPED HYDROGEN-POWERED VEHICLE MANUFACTURERS GAIN SAFE EU MARKET ACCESS BY CLOSING REGULATORY GAPS
    5.13 TARIFF AND REGULATORY LANDSCAPE 
           5.13.1 TARIFF ANALYSIS
           5.13.2 REGULATORY BODIES, GOVERNMENT AGENCIES, AND OTHER ORGANIZATIONS
           5.13.3 REGULATIONS
    5.14 PORTER’S FIVE FORCES ANALYSIS 
           5.14.1 THREAT OF NEW ENTRANTS
           5.14.2 THREAT OF SUBSTITUTES
           5.14.3 BARGAINING POWER OF SUPPLIERS
           5.14.4 BARGAINING POWER OF BUYERS
           5.14.5 INTENSITY OF COMPETITIVE RIVALRY
    5.15 KEY STAKEHOLDERS AND BUYING CRITERIA 
           5.15.1 KEY STAKEHOLDERS IN BUYING PROCESS
           5.15.2 BUYING CRITERIA
    5.16 IMPACT OF AI/GEN AI ON HYDROGEN TECHNOLOGY TIC MARKET 
 
6 HYDROGEN TECHNOLOGY TIC MARKET, BY PROCESS (Page No. - 80)
    6.1 INTRODUCTION 
    6.2 GENERATION 
           6.2.1 GRAY HYDROGEN
                    6.2.1.1 Low cost of production to drive market
           6.2.2 BLUE HYDROGEN
                    6.2.2.1 Rising demand for clean hydrogen to spur demand
           6.2.3 GREEN HYDROGEN
                    6.2.3.1 Increasing focus on achieving net-zero carbon emission targets to boost demand
           6.2.4 OTHERS
    6.3 STORAGE 
           6.3.1 PHYSICAL
                    6.3.1.1 Rising application in buffer tanks to drive market
           6.3.2 MATERIAL-BASED
                    6.3.2.1 Enhanced hydrogen storage performance with improved kinetics to spur demand
    6.4 TRANSPORTATION 
           6.4.1 LONG-DISTANCE
                    6.4.1.1 Growing emphasis on establishing strong hydrogen infrastructure to drive market
           6.4.2 SHORT-DISTANCE
                    6.4.2.1 Increasing demand for emergency power backups to accelerate demand
 
7 HYDROGEN TECHNOLOGY TIC MARKET, BY TESTING TYPE (Page No. - 100)
    7.1 INTRODUCTION 
    7.2 PRESSURE CYCLE, LEAKAGE AND TIGHTNESS TESTING 
           7.2.1 INCREASING NEED TO DETECT AND MINIMIZE FUGITIVE HYDROGEN EMISSIONS TO BOOST DEMAND
    7.3 OVERPRESSURE, BURST, AND FLOW TESTING 
           7.3.1 PRESSING NEED TO MITIGATE RISKS ASSOCIATED WITH HYDROGEN TECHNOLOGIES TO DRIVE MARKET
    7.4 HYDROGEN PERMEATION AND COMPATIBILITY TESTING 
           7.4.1 GROWING DEMAND FOR ACCURATE MEASUREMENTS OF GAS PERMEATION PROPERTIES UNDER HIGH-PRESSURE CONDITIONS TO DRIVE MARKET
    7.5 OTHER TESTING TYPES 
 
8 HYDROGEN TECHNOLOGY TIC MARKET, BY APPLICATION (Page No. - 105)
    8.1 INTRODUCTION 
    8.2 REFINING & CHEMICAL 
           8.2.1 GROWING APPLICATION IN STEELMAKING TO DRIVE MARKET
    8.3 MOBILITY 
           8.3.1 RISING FOCUS ON DECARBONIZING ROAD TRANSPORT SECTOR TO SPUR DEMAND
    8.4 ENERGY 
           8.4.1 INCREASING PRODUCTION OF ELECTRICITY THROUGH ELECTROCHEMICAL PROCESS TO ACCELERATE DEMAND
    8.5 OTHER APPLICATIONS 
 
9 HYDROGEN TECHNOLOGY TIC MARKET, BY SERVICE (Page No. - 113)
    9.1 INTRODUCTION 
    9.2 TESTING 
           9.2.1 GROWING EMPHASIS OF HYDROGEN SECTOR TO INNOVATE STORAGE SOLUTIONS AND DISTRIBUTION NETWORKS TO BOOST DEMAND
    9.3 INSPECTION 
           9.3.1 INCREASING NEED TO ADHERE TO INDUSTRIAL AND GOVERNMENT SAFETY REGULATIONS TO ACCELERATE DEMAND
    9.4 CERTIFICATION 
           9.4.1 RISING FOCUS OF ESTABLISHED PLAYERS TO INTRODUCE CERTIFICATION SCHEMES TO OFFER LUCRATIVE GROWTH OPPORTUNITIES
    9.5 OTHER SERVICES 
 
10 HYDROGEN TECHNOLOGY TIC MARKET, BY REGION (Page No. - 118)
     10.1 INTRODUCTION 
     10.2 NORTH AMERICA 
             10.2.1 MACROECONOMIC OUTLOOK IN NORTH AMERICA
             10.2.2 US
                        10.2.2.1 Growing focus on producing affordable carbon-free hydrogen to boost demand
             10.2.3 CANADA
                        10.2.3.1 Government-led initiatives to support private investors build clean fuel production capacity to spur demand
             10.2.4 MEXICO
                        10.2.4.1 Rising focus on developing green hydrogen to accelerate demand
     10.3 EUROPE 
             10.3.1 MACROECONOMIC OUTLOOK IN EUROPE
             10.3.2 UK
                        10.3.2.1 Increasing focus on reducing natural gas imports to drive market
             10.3.3 GERMANY
                        10.3.3.1 Growing adoption of fuel cell electric vehicles to drive market
             10.3.4 FRANCE
                        10.3.4.1 Rising consumption of oil in industrial and transport sectors to foster market growth
             10.3.5 REST OF EUROPE
     10.4 ASIA PACIFIC 
             10.4.1 MACROECONOMIC OUTLOOK IN ASIA PACIFIC
             10.4.2 CHINA
                        10.4.2.1 Government-led initiatives to deploy fuel cell buses and trucks to offer lucrative growth opportunities
             10.4.3 INDIA
                        10.4.3.1 Growing emphasis on boosting domestic production of green hydrogen to drive market
             10.4.4 JAPAN
                        10.4.4.1 Rising focus on achieving carbon neutrality to accelerate demand
             10.4.5 SOUTH KOREA
                        10.4.5.1 Increasing development of hydrogen technology in electricity, energy, commercial, and marine industries to drive market
             10.4.6 REST OF ASIA PACIFIC
     10.5 ROW 
             10.5.1 MACROECONOMIC OUTLOOK IN ROW
             10.5.2 SOUTH AMERICA
                        10.5.2.1 Presence of untapped crude oil and natural gas reserves to offer lucrative growth opportunities
             10.5.3 MIDDLE EAST & AFRICA
                        10.5.3.1 Rising demand from chemical industry to spur demand
                        10.5.3.2 GCC
                        10.5.3.3 Rest of Middle East & Africa
 
11 COMPETITIVE LANDSCAPE (Page No. - 150)
     11.1 OVERVIEW 
     11.2 KEY PLAYER STRATEGIES/RIGHT TO WIN, 2020–2024 
     11.3 REVENUE ANALYSIS, 2019–2023 
     11.4 MARKET SHARE ANALYSIS, 2023 
     11.5 COMPANY VALUATION AND FINANCIAL METRICS 
     11.6 BRAND/PRODUCT COMPARISON 
     11.7 COMPANY EVALUATION MATRIX: KEY PLAYERS, 2023 
             11.7.1 STARS
             11.7.2 EMERGING LEADERS
             11.7.3 PERVASIVE PLAYERS
             11.7.4 PARTICIPANTS
             11.7.5 COMPANY FOOTPRINT: KEY PLAYERS, 2023
                        11.7.5.1 Company footprint
                        11.7.5.2 Process footprint
                        11.7.5.3 Service footprint
                        11.7.5.4 Testing type footprint
                        11.7.5.5 Application footprint
                        11.7.5.6 Region footprint
     11.8 COMPANY EVALUATION MATRIX: STARTUPS/SMES, 2023 
             11.8.1 PROGRESSIVE COMPANIES
             11.8.2 RESPONSIVE COMPANIES
             11.8.3 DYNAMIC COMPANIES
             11.8.4 STARTING BLOCKS
             11.8.5 COMPETITIVE BENCHMARKING: STARTUPS/SMES, 2023
                        11.8.5.1 Detailed list of key startups/SMEs
                        11.8.5.2 Competitive benchmarking of key startups/SMEs
     11.9 COMPETITIVE SCENARIO AND TRENDS 
                        11.9.1.1 Solution/Service launches
                        11.9.1.2 Deals
                        11.9.1.3 Expansions
                        11.9.1.4 Others
 
12 COMPANY PROFILES (Page No. - 186)
     12.1 KEY PLAYERS 
             12.1.1 SGS SA
                        12.1.1.1 Business overview
                        12.1.1.2 Products/Solutions/Services offered
                        12.1.1.3 Recent developments
                                     12.1.1.3.1 Solution/Service launches
                                     12.1.1.3.2 Deals
                                     12.1.1.3.3 Expansions
                                     12.1.1.3.4 Others
                        12.1.1.4 MnM view
                                     12.1.1.4.1 Key strengths/Right to win
                                     12.1.1.4.2 Strategic choices
                                     12.1.1.4.3 Weaknesses/Competitive threats
             12.1.2 DNV GL
                        12.1.2.1 Business overview
                        12.1.2.2 Products/Solutions/Services offered
                        12.1.2.3 Recent developments
                                     12.1.2.3.1 Solution/Service launches
                                     12.1.2.3.2 Deals
                                     12.1.2.3.3 Expansions
                                     12.1.2.3.4 Others
                        12.1.2.4 MnM view
                                     12.1.2.4.1 Key strengths/Right to win
                                     12.1.2.4.2 Strategic choices
                                     12.1.2.4.3 Weaknesses/Competitive threats
             12.1.3 BUREAU VERITAS
                        12.1.3.1 Business overview
                        12.1.3.2 Products/Solutions/Services offered
                        12.1.3.3 Recent developments
                                     12.1.3.3.1 Solution/Service launches
                                     12.1.3.3.2 Deals
                        12.1.3.4 MnM view
                                     12.1.3.4.1 Key strengths/Right to win
                                     12.1.3.4.2 Strategic choices
                                     12.1.3.4.3 Weaknesses/Competitive threats
             12.1.4 INTERTEK GROUP PLC
                        12.1.4.1 Business overview
                        12.1.4.2 Products/Solutions/Services offered
                        12.1.4.3 Recent developments
                                     12.1.4.3.1 Solution/Service launches
                                     12.1.4.3.2 Deals
                        12.1.4.4 MnM view
                                     12.1.4.4.1 Key strengths/Right to win
                                     12.1.4.4.2 Strategic choices
                                     12.1.4.4.3 Weaknesses/Competitive threats
             12.1.5 TÜV SÜD
                        12.1.5.1 Business overview
                        12.1.5.2 Products/Solutions/Services offered
                        12.1.5.3 Recent developments
                                     12.1.5.3.1 Solution/Service launches
                                     12.1.5.3.2 Deals
                                     12.1.5.3.3 Expansions
                                     12.1.5.3.4 Others
                        12.1.5.4 MnM view
                                     12.1.5.4.1 Key strengths/Right to win
                                     12.1.5.4.2 Strategic choices
                                     12.1.5.4.3 Weaknesses/Competitive threats
             12.1.6 TÜV RHEINLAND
                        12.1.6.1 Business overview
                        12.1.6.2 Products/Solutions/Services offered
                        12.1.6.3 Recent developments
                                     12.1.6.3.1 Solution/Service launches
                                     12.1.6.3.2 Deals
                                     12.1.6.3.3 Expansions
             12.1.7 APPLUS+
                        12.1.7.1 Business overview
                        12.1.7.2 Products/Solutions/Services offered
                        12.1.7.3 Recent developments
                                     12.1.7.3.1 Solution/Service launches
                                     12.1.7.3.2 Deals
             12.1.8 TÜV NORD GROUP
                        12.1.8.2 Products/Solutions/Services offered
                        12.1.8.3 Recent developments
                                     12.1.8.3.1 Solution/Service launches
                                     12.1.8.3.2 Deals
             12.1.9 UL LLC
                        12.1.9.1 Business overview
                        12.1.9.2 Products/Solutions/Services offered
                        12.1.9.3 Recent developments
                                     12.1.9.3.1 Solution/Service launches
                                     12.1.9.3.2 Deals
             12.1.10 DEKRA
                        12.1.10.1 Business overview
                        12.1.10.2 Products/Solutions/Services offered
                        12.1.10.3 Recent developments
                                     12.1.10.3.1 Solution/Service launches
                                     12.1.10.3.2 Deals
     12.2 OTHER PLAYERS 
             12.2.1 ELEMENT MATERIALS TECHNOLOGY
             12.2.2 APAVE
             12.2.3 KIWA
             12.2.4 VDE TESTING AND CERTIFICATION INSTITUTE GMBH
             12.2.5 AMSPEC GROUP
             12.2.6 FORCE TECHNOLOGY
             12.2.7 RINA S.P.A.
             12.2.8 LRQA GROUP LIMITED
             12.2.9 RICARDO
             12.2.10 BALLARD POWER SYSTEMS
             12.2.11 TWI LTD.
             12.2.12 BAKERRISK
             12.2.13 POWERTECH LABS INC.
             12.2.14 RESATO
             12.2.15 AVL
 
13 APPENDIX (Page No. - 245)
     13.1 INSIGHTS FROM INDUSTRY EXPERTS 
     13.2 DISCUSSION GUIDE 
     13.3 KNOWLEDGESTORE: MARKETSANDMARKETS’ SUBSCRIPTION PORTAL 
     13.4 CUSTOMIZATION OPTIONS 
     13.5 RELATED REPORTS 
     13.6 AUTHOR DETAILS 
 
LIST OF TABLES (181 TABLES)
 
TABLE 1 PRODUCTION COST FOR DIFFERENT TYPES OF HYDROGEN
TABLE 2 ROLES OF COMPANIES IN HYDROGEN TECHNOLOGY TIC ECOSYSTEM
TABLE 3 SPECIFICATIONS OF ALKALINE ELECTROLYZER
TABLE 4 LIST OF APPLIED/GRANTED PATENTS RELATED TO HYDROGEN TECHNOLOGY TIC SERVICES, 2020–2022
TABLE 5 EXPORT DATA FOR HS CODE 280410-COMPLIANT PRODUCTS, BY COUNTRY, 2020–2023 (USD THOUSAND)
TABLE 6 IMPORT DATA FOR HS CODE 280410-COMPLIANT PRODUCTS, BY COUNTRY, 2020–2023 (USD THOUSAND)
TABLE 7 HYDROGEN TECHNOLOGY TIC MARKET: LIST OF CONFERENCES AND EVENTS, 2024–2025
TABLE 8 TARIFF DATA FOR HS CODE 280410-COMPLIANT PRODUCTS EXPORTED BY US, 2023
TABLE 9 NORTH AMERICA: LIST OF REGULATORY BODIES, GOVERNMENT AGENCIES, AND OTHER ORGANIZATIONS
TABLE 10 EUROPE: LIST OF REGULATORY BODIES, GOVERNMENT AGENCIES, AND OTHER ORGANIZATIONS
TABLE 11 ASIA PACIFIC: LIST OF REGULATORY BODIES, GOVERNMENT AGENCIES, AND OTHER ORGANIZATIONS
TABLE 12 ROW: LIST OF REGULATORY BODIES, GOVERNMENT AGENCIES, AND OTHER ORGANIZATIONS
TABLE 13 HYDROGEN TECHNOLOGY TIC MARKET: PORTER’S FIVE FORCES ANALYSIS
TABLE 14 INFLUENCE OF KEY STAKEHOLDERS ON BUYING PROCESS, BY APPLICATION (%)
TABLE 15 KEY BUYING CRITERIA FOR TOP THREE APPLICATIONS
TABLE 16 HYDROGEN TECHNOLOGY TIC MARKET, BY PROCESS, 2020–2023 (USD MILLION)
TABLE 17 HYDROGEN TECHNOLOGY TIC MARKET, BY PROCESS, 2024–2029 (USD MILLION)
TABLE 18 GENERATION: HYDROGEN TECHNOLOGY TIC MARKET, BY TYPE, 2020–2023 (USD MILLION)
TABLE 19 GENERATION: HYDROGEN TECHNOLOGY TIC MARKET, BY TYPE, 2024–2029 (USD MILLION)
TABLE 20 GENERATION: HYDROGEN TECHNOLOGY TIC MARKET, BY APPLICATION, 2020–2023 (USD MILLION)
TABLE 21 GENERATION: HYDROGEN TECHNOLOGY TIC MARKET, BY APPLICATION, 2024–2029 (USD MILLION)
TABLE 22 GENERATION: HYDROGEN TECHNOLOGY TIC MARKET, BY REGION, 2020–2023 (USD MILLION)
TABLE 23 GENERATION: HYDROGEN TECHNOLOGY TIC MARKET, BY REGION, 2024–2029 (USD MILLION)
TABLE 24 GENERATION: HYDROGEN TECHNOLOGY TIC MARKET IN NORTH AMERICA, BY COUNTRY, 2020–2023 (USD MILLION)
TABLE 25 GENERATION: HYDROGEN TECHNOLOGY TIC MARKET IN NORTH AMERICA, BY COUNTRY, 2024–2029 (USD MILLION)
TABLE 26 GENERATION: HYDROGEN TECHNOLOGY TIC MARKET IN EUROPE, BY COUNTRY, 2020–2023 (USD MILLION)
TABLE 27 GENERATION: HYDROGEN TECHNOLOGY TIC MARKET IN EUROPE, BY COUNTRY, 2024–2029 (USD MILLION)
TABLE 28 GENERATION: HYDROGEN TECHNOLOGY TIC MARKET IN ASIA PACIFIC, BY COUNTRY, 2020–2023 (USD MILLION)
TABLE 29 GENERATION: HYDROGEN TECHNOLOGY TIC MARKET IN ASIA PACIFIC, BY COUNTRY, 2024–2029 (USD MILLION)
TABLE 30 GENERATION: HYDROGEN TECHNOLOGY TIC MARKET IN ROW, BY REGION, 2020–2023 (USD MILLION)
TABLE 31 GENERATION: HYDROGEN TECHNOLOGY TIC MARKET IN ROW, BY REGION, 2024–2029 (USD MILLION)
TABLE 32 STORAGE: HYDROGEN TECHNOLOGY TIC MARKET, BY TYPE, 2020–2023 (USD MILLION)
TABLE 33 STORAGE: HYDROGEN TECHNOLOGY TIC MARKET, BY TYPE, 2024–2029 (USD MILLION)
TABLE 34 STORAGE: HYDROGEN TECHNOLOGY TIC MARKET, BY APPLICATION, 2020–2023 (USD MILLION)
TABLE 35 STORAGE: HYDROGEN TECHNOLOGY TIC MARKET, BY APPLICATION, 2024–2029 (USD MILLION)
TABLE 36 STORAGE: HYDROGEN TECHNOLOGY TIC MARKET, BY REGION, 2020–2023 (USD MILLION)
TABLE 37 STORAGE: HYDROGEN TECHNOLOGY TIC MARKET, BY REGION, 2024–2029 (USD MILLION)
TABLE 38 STORAGE: HYDROGEN TECHNOLOGY TIC MARKET IN NORTH AMERICA, BY COUNTRY, 2020–2023 (USD MILLION)
TABLE 39 STORAGE: HYDROGEN TECHNOLOGY TIC MARKET IN NORTH AMERICA, BY COUNTRY, 2024–2029 (USD MILLION)
TABLE 40 STORAGE: HYDROGEN TECHNOLOGY TIC MARKET IN EUROPE, BY COUNTRY, 2020–2023 (USD MILLION)
TABLE 41 STORAGE: HYDROGEN TECHNOLOGY TIC MARKET IN EUROPE, BY COUNTRY, 2024–2029 (USD MILLION)
TABLE 42 STORAGE: HYDROGEN TECHNOLOGY TIC MARKET IN ASIA PACIFIC, BY COUNTRY, 2020–2023 (USD MILLION)
TABLE 43 STORAGE: HYDROGEN TECHNOLOGY TIC MARKET IN ASIA PACIFIC, BY COUNTRY, 2024–2029 (USD MILLION)
TABLE 44 STORAGE: HYDROGEN TECHNOLOGY TIC MARKET IN ROW, BY REGION, 2020–2023 (USD MILLION)
TABLE 45 STORAGE: HYDROGEN TECHNOLOGY TIC MARKET IN ROW, BY REGION, 2024–2029 (USD MILLION)
TABLE 46 TRANSPORTATION: HYDROGEN TECHNOLOGY TIC MARKET, BY TYPE, 2020–2023 (USD MILLION)
TABLE 47 TRANSPORTATION: HYDROGEN TECHNOLOGY TIC MARKET, BY TYPE, 2024–2029 (USD MILLION)
TABLE 48 TRANSPORTATION: HYDROGEN TECHNOLOGY TIC MARKET, BY APPLICATION, 2020–2023 (USD MILLION)
TABLE 49 TRANSPORTATION: HYDROGEN TECHNOLOGY TIC MARKET, BY APPLICATION, 2024–2029 (USD MILLION)
TABLE 50 TRANSPORTATION: HYDROGEN TECHNOLOGY TIC MARKET, BY REGION, 2020–2023 (USD MILLION)
TABLE 51 TRANSPORTATION: HYDROGEN TECHNOLOGY TIC MARKET, BY REGION, 2024–2029 (USD MILLION)
TABLE 52 TRANSPORTATION: HYDROGEN TECHNOLOGY TIC MARKET IN NORTH AMERICA, BY COUNTRY, 2020–2023 (USD MILLION)
TABLE 53 TRANSPORTATION: HYDROGEN TECHNOLOGY TIC MARKET IN NORTH AMERICA, BY COUNTRY, 2024–2029 (USD MILLION)
TABLE 54 TRANSPORTATION: HYDROGEN TECHNOLOGY TIC MARKET IN EUROPE, BY COUNTRY, 2020–2023 (USD MILLION)
TABLE 55 TRANSPORTATION: HYDROGEN TECHNOLOGY TIC MARKET IN EUROPE, BY COUNTRY, 2024–2029 (USD MILLION)
TABLE 56 TRANSPORTATION: HYDROGEN TECHNOLOGY TIC MARKET IN ASIA PACIFIC, BY COUNTRY, 2020–2023 (USD MILLION)
TABLE 57 TRANSPORTATION: HYDROGEN TECHNOLOGY TIC MARKET IN ASIA PACIFIC, BY COUNTRY, 2024–2029 (USD MILLION)
TABLE 58 TRANSPORTATION: HYDROGEN TECHNOLOGY TIC MARKET IN ROW, BY REGION, 2020–2023 (USD MILLION)
TABLE 59 TRANSPORTATION: HYDROGEN TECHNOLOGY TIC MARKET IN ROW, BY REGION, 2024–2029 (USD MILLION)
TABLE 60 HYDROGEN TECHNOLOGY TIC MARKET, BY TESTING TYPE, 2020–2023 (USD MILLION)
TABLE 61 HYDROGEN TECHNOLOGY TIC MARKET, BY TESTING TYPE, 2024–2029 (USD MILLION)
TABLE 62 HYDROGEN TECHNOLOGY TIC MARKET, BY APPLICATION, 2020–2023 (USD MILLION)
TABLE 63 HYDROGEN TECHNOLOGY TIC MARKET, BY APPLICATION, 2024–2029 (USD MILLION)
TABLE 64 REFINING & CHEMICAL: HYDROGEN TECHNOLOGY TIC MARKET, BY PROCESS, 2020–2023 (USD MILLION)
TABLE 65 REFINING & CHEMICAL: HYDROGEN TECHNOLOGY TIC MARKET, BY PROCESS, 2024–2029 (USD MILLION)
TABLE 66 MOBILITY: HYDROGEN TECHNOLOGY TIC MARKET, BY PROCESS, 2020–2023 (USD MILLION)
TABLE 67 MOBILITY: HYDROGEN TECHNOLOGY TIC MARKET, BY PROCESS, 2024–2029 (USD MILLION)
TABLE 68 ENERGY: HYDROGEN TECHNOLOGY TIC MARKET, BY PROCESS, 2020–2023 (USD MILLION)
TABLE 69 ENERGY: HYDROGEN TECHNOLOGY TIC MARKET, BY PROCESS, 2024–2029 (USD MILLION)
TABLE 70 OTHER APPLICATIONS: HYDROGEN TECHNOLOGY TIC MARKET, BY PROCESS, 2020–2023 (USD MILLION)
TABLE 71 OTHER APPLICATIONS: HYDROGEN TECHNOLOGY TIC MARKET, BY PROCESS, 2024–2029 (USD MILLION)
TABLE 72 HYDROGEN TECHNOLOGY TIC MARKET, BY SERVICE, 2020–2023 (USD MILLION)
TABLE 73 HYDROGEN TECHNOLOGY TIC MARKET, BY SERVICE, 2024–2029 (USD MILLION)
TABLE 74 HYDROGEN TECHNOLOGY TIC MARKET, BY REGION, 2020–2023 (USD MILLION)
TABLE 75 HYDROGEN TECHNOLOGY TIC MARKET, BY REGION, 2024–2029 (USD MILLION)
TABLE 76 NORTH AMERICA: HYDROGEN TECHNOLOGY TIC MARKET, BY COUNTRY, 2020–2023 (USD MILLION)
TABLE 77 NORTH AMERICA: HYDROGEN TECHNOLOGY TIC MARKET, BY COUNTRY, 2024–2029 (USD MILLION)
TABLE 78 NORTH AMERICA: HYDROGEN TECHNOLOGY TIC MARKET, BY PROCESS, 2020–2023 (USD MILLION)
TABLE 79 NORTH AMERICA: HYDROGEN TECHNOLOGY TIC MARKET, BY PROCESS, 2024–2029 (USD MILLION)
TABLE 80 US: HYDROGEN TECHNOLOGY TIC MARKET, BY PROCESS, 2020–2023 (USD MILLION)
TABLE 81 US: HYDROGEN TECHNOLOGY TIC MARKET, BY PROCESS, 2024–2029 (USD MILLION)
TABLE 82 CANADA: HYDROGEN TECHNOLOGY TIC MARKET, BY PROCESS, 2020–2023 (USD MILLION)
TABLE 83 CANADA: HYDROGEN TECHNOLOGY TIC MARKET, BY PROCESS, 2024–2029 (USD MILLION)
TABLE 84 MEXICO: HYDROGEN TECHNOLOGY TIC MARKET, BY PROCESS, 2020–2023 (USD MILLION)
TABLE 85 MEXICO: HYDROGEN TECHNOLOGY TIC MARKET, BY PROCESS, 2024–2029 (USD MILLION)
TABLE 86 EUROPE: HYDROGEN TECHNOLOGY TIC MARKET, BY COUNTRY, 2020–2023 (USD MILLION)
TABLE 87 EUROPE: HYDROGEN TECHNOLOGY TIC MARKET, BY COUNTRY, 2024–2029 (USD MILLION)
TABLE 88 EUROPE: HYDROGEN TECHNOLOGY TIC MARKET, BY PROCESS, 2020–2023 (USD MILLION)
TABLE 89 EUROPE: HYDROGEN TECHNOLOGY TIC MARKET, BY PROCESS, 2024–2029 (USD MILLION)
TABLE 90 UK: HYDROGEN TECHNOLOGY TIC MARKET, BY PROCESS, 2020–2023 (USD MILLION)
TABLE 91 UK: HYDROGEN TECHNOLOGY TIC MARKET, BY PROCESS, 2024–2029 (USD MILLION)
TABLE 92 GERMANY: HYDROGEN TECHNOLOGY TIC MARKET, BY PROCESS, 2020–2023 (USD MILLION)
TABLE 93 GERMANY: HYDROGEN TECHNOLOGY TIC MARKET, BY PROCESS, 2024–2029 (USD MILLION)
TABLE 94 FRANCE: HYDROGEN TECHNOLOGY TIC MARKET, BY PROCESS, 2020–2023 (USD MILLION)
TABLE 95 FRANCE: HYDROGEN TECHNOLOGY TIC MARKET, BY PROCESS, 2024–2029 (USD MILLION)
TABLE 96 REST OF EUROPE: HYDROGEN TECHNOLOGY TIC MARKET, BY PROCESS, 2020–2023 (USD MILLION)
TABLE 97 REST OF EUROPE: HYDROGEN TECHNOLOGY TIC MARKET, BY PROCESS, 2024–2029 (USD MILLION)
TABLE 98 ASIA PACIFIC: HYDROGEN TECHNOLOGY TIC MARKET, BY COUNTRY, 2020–2023 (USD MILLION)
TABLE 99 ASIA PACIFIC: HYDROGEN TECHNOLOGY TIC MARKET, BY COUNTRY, 2024–2029 (USD MILLION)
TABLE 100 ASIA PACIFIC: HYDROGEN TECHNOLOGY TIC MARKET, BY APPLICATION, 2020–2023 (USD MILLION)
TABLE 101 ASIA PACIFIC: HYDROGEN TECHNOLOGY TIC MARKET, BY APPLICATION, 2024–2029 (USD MILLION)
TABLE 102 CHINA: HYDROGEN TECHNOLOGY TIC MARKET, BY PROCESS, 2020–2023 (USD MILLION)
TABLE 103 CHINA: HYDROGEN TECHNOLOGY TIC MARKET, BY PROCESS, 2024–2029 (USD MILLION)
TABLE 104 INDIA: HYDROGEN TECHNOLOGY TIC MARKET, BY PROCESS, 2020–2023 (USD MILLION)
TABLE 105 INDIA: HYDROGEN TECHNOLOGY TIC MARKET, BY PROCESS, 2024–2029 (USD MILLION)
TABLE 106 JAPAN: HYDROGEN TECHNOLOGY TIC MARKET, BY PROCESS, 2020–2023 (USD MILLION)
TABLE 107 JAPAN: HYDROGEN TECHNOLOGY TIC MARKET, BY PROCESS, 2024–2029 (USD MILLION)
TABLE 108 SOUTH KOREA: HYDROGEN TECHNOLOGY TIC MARKET, BY PROCESS, 2020–2023 (USD MILLION)
TABLE 109 SOUTH KOREA: HYDROGEN TECHNOLOGY TIC MARKET, BY PROCESS, 2024–2029 (USD MILLION)
TABLE 110 REST OF ASIA PACIFIC: HYDROGEN TECHNOLOGY TIC MARKET, BY PROCESS, 2020–2023 (USD MILLION)
TABLE 111 REST OF ASIA PACIFIC: HYDROGEN TECHNOLOGY TIC MARKET, BY PROCESS, 2024–2029 (USD MILLION)
TABLE 112 ROW: HYDROGEN TECHNOLOGY TIC MARKET, BY REGION, 2020–2023 (USD MILLION)
TABLE 113 ROW: HYDROGEN TECHNOLOGY TIC MARKET, BY REGION, 2024–2029 (USD MILLION)
TABLE 114 ROW: HYDROGEN TECHNOLOGY TIC MARKET, BY APPLICATION, 2020–2023 (USD MILLION)
TABLE 115 ROW: HYDROGEN TECHNOLOGY TIC MARKET, BY APPLICATION, 2024–2029 (USD MILLION)
TABLE 116 SOUTH AMERICA: HYDROGEN TECHNOLOGY TIC MARKET, BY PROCESS, 2020–2023 (USD MILLION)
TABLE 117 SOUTH AMERICA: HYDROGEN TECHNOLOGY TIC MARKET, BY PROCESS, 2024–2029 (USD MILLION)
TABLE 118 MIDDLE EAST & AFRICA: HYDROGEN TECHNOLOGY TIC MARKET, BY PROCESS, 2020–2023 (USD MILLION)
TABLE 119 MIDDLE EAST & AFRICA: HYDROGEN TECHNOLOGY TIC MARKET, BY PROCESS, 2024–2029 (USD MILLION)
TABLE 120 MIDDLE EAST & AFRICA: HYDROGEN TECHNOLOGY TIC MARKET, BY COUNTRY, 2020–2023 (USD MILLION)
TABLE 121 MIDDLE EAST & AFRICA: HYDROGEN TECHNOLOGY TIC MARKET, BY COUNTRY, 2024–2029 (USD MILLION)
TABLE 122 KEY PLAYER STRATEGIES/RIGHT TO WIN, 2020–2024
TABLE 123 HYDROGEN TECHNOLOGY TIC MARKET: DEGREE OF COMPETITION, 2023
TABLE 124 HYDROGEN TECHNOLOGY TIC MARKET: PROCESS FOOTPRINT
TABLE 125 HYDROGEN TECHNOLOGY TIC MARKET: SERVICE FOOTPRINT
TABLE 126 HYDROGEN TECHNOLOGY TIC MARKET: TESTING TYPE FOOTPRINT
TABLE 127 HYDROGEN TECHNOLOGY TIC MARKET: APPLICATION FOOTPRINT
TABLE 128 HYDROGEN TECHNOLOGY TIC MARKET: REGION FOOTPRINT
TABLE 129 HYDROGEN TECHNOLOGY TIC MARKET: LIST OF KEY STARTUPS/SMES
TABLE 130 HYDROGEN TECHNOLOGY TIC MARKET: COMPETITIVE BENCHMARKING OF KEY STARTUPS/SMES
TABLE 131 HYDROGEN TECHNOLOGY TIC MARKET: SOLUTION/SERVICE LAUNCHES, FEBRUARY 2020–JUNE 2024
TABLE 132 HYDROGEN TECHNOLOGY TIC MARKET: DEALS, FEBRUARY 2020–JUNE 2024
TABLE 133 HYDROGEN TECHNOLOGY TIC MARKET: EXPANSIONS, FEBRUARY 2020–JUNE 2024
TABLE 134 HYDROGEN TECHNOLOGY TIC MARKET: OTHERS, FEBRUARY 2020–JUNE 2024
TABLE 135 SGS SA: COMPANY OVERVIEW
TABLE 136 SGS SA: PRODUCTS/SOLUTIONS/SERVICES OFFERED
TABLE 137 SGS SA: SOLUTION/SERVICE LAUNCHES
TABLE 138 SGS SA: DEALS
TABLE 139 SGS SA: EXPANSIONS
TABLE 140 SGS SA: OTHERS
TABLE 141 DNV GL: COMPANY OVERVIEW
TABLE 142 DNV GL: PRODUCTS/SOLUTIONS/SERVICES OFFERED
TABLE 143 DNV GL: SOLUTION/SERVICE LAUNCHES
TABLE 144 DNV GL: DEALS
TABLE 145 DNV GL: EXPANSIONS
TABLE 146 DNV GL: OTHERS
TABLE 147 BUREAU VERITAS: COMPANY OVERVIEW
TABLE 148 BUREAU VERITAS: PRODUCTS/SOLUTIONS/SERVICES OFFERED
TABLE 149 BUREAU VERITAS: SOLUTION/SERVICE LAUNCHES
TABLE 150 BUREAU VERITAS: DEALS
TABLE 151 INTERTEK GROUP PLC: COMPANY OVERVIEW
TABLE 152 INTERTEK GROUP PLC: PRODUCTS/SOLUTIONS/SERVICES OFFERED
TABLE 153 INTERTEK GROUP PLC: SOLUTION/SERVICE LAUNCHES
TABLE 154 INTERTEK GROUP PLC: DEALS
TABLE 155 TÜV SÜD: COMPANY OVERVIEW
TABLE 156 TÜV SÜD: PRODUCTS/SOLUTIONS/SERVICES OFFERED
TABLE 157 TÜV SÜD: SOLUTION/SERVICE LAUNCHES
TABLE 158 TÜV SÜD: DEALS
TABLE 159 TÜV SÜD: EXPANSIONS
TABLE 160 TÜV SÜD: OTHERS
TABLE 161 TÜV RHEINLAND: COMPANY OVERVIEW
TABLE 162 TÜV RHEINLAND: PRODUCTS/SOLUTIONS/SERVICES OFFERED
TABLE 163 TÜV RHEINLAND: SOLUTION/SERVICE LAUNCHES
TABLE 164 TÜV RHEINLAND: DEALS
TABLE 165 TÜV RHEINLAND: EXPANSIONS
TABLE 166 APPLUS+: COMPANY OVERVIEW
TABLE 167 APPLUS+: PRODUCTS/SOLUTIONS/SERVICES OFFERED
TABLE 168 APPLUS+: SOLUTION/SERVICE LAUNCHES
TABLE 169 APPLUS+: DEALS
TABLE 170 TÜV NORD GROUP: COMPANY OVERVIEW
TABLE 171 TÜV NORD GROUP: PRODUCTS/SOLUTIONS/SERVICES OFFERED
TABLE 172 TÜV NORD GROUP: SOLUTION/SERVICE LAUNCHES
TABLE 173 TÜV NORD GROUP: DEALS
TABLE 174 UL LLC: COMPANY OVERVIEW
TABLE 175 UL LLC: PRODUCTS/SOLUTIONS/SERVICES OFFERED
TABLE 176 UL SOLUTIONS: SOLUTION/SERVICE LAUNCHES
TABLE 177 UL LLC: DEALS
TABLE 178 DEKRA: COMPANY OVERVIEW
TABLE 179 DEKRA: PRODUCTS/SOLUTIONS/SERVICES OFFERED
TABLE 180 DEKRA: SOLUTION/SERVICE LAUNCHES
TABLE 181 DEKRA: DEALS
 
LIST OF FIGURES (71 FIGURES)
 
FIGURE 1 HYDROGEN TECHNOLOGY TIC MARKET SEGMENTATION AND REGIONAL SCOPE
FIGURE 2 HYDROGEN TECHNOLOGY TIC MARKET: RESEARCH DESIGN
FIGURE 3 HYDROGEN TECHNOLOGY TIC MARKET: BOTTOM-UP APPROACH
FIGURE 4 HYDROGEN TECHNOLOGY TIC MARKET: DEMAND-SIDE APPROACH
FIGURE 5 HYDROGEN TECHNOLOGY TIC MARKET: TOP-DOWN APPROACH
FIGURE 6 HYDROGEN TECHNOLOGY TIC MARKET: SUPPLY-SIDE ANALYSIS
FIGURE 7 DATA TRIANGULATION
FIGURE 8 GLOBAL HYDROGEN TECHNOLOGY TIC MARKET, 2020–2029 (USD MILLION)
FIGURE 9 GENERATION SEGMENT TO ACCOUNT FOR LARGEST MARKET SHARE IN 2024
FIGURE 10 TESTING SEGMENT TO LEAD MARKET IN 2029
FIGURE 11 HYDROGEN PERMEATION AND COMPATIBILITY TESTING SEGMENT TO DOMINATE MARKET IN 2024
FIGURE 12 REFINING & CHEMICAL SEGMENT TO HOLD LARGEST MARKET SHARE IN 2029
FIGURE 13 ASIA PACIFIC TO EXHIBIT HIGHEST CAGR IN GLOBAL HYDROGEN TECHNOLOGY TIC MARKET DURING FORECAST PERIOD
FIGURE 14 GROWING SHIFT TOWARD CLEAN ENERGY SOURCES TO BOOST DEMAND
FIGURE 15 GENERATION SEGMENT TO ACCOUNT FOR LARGEST MARKET SHARE IN 2029
FIGURE 16 REFINING & CHEMICAL SEGMENT TO DOMINATE MARKET IN 2029
FIGURE 17 TESTING SEGMENT TO DOMINATE MARKET IN 2029
FIGURE 18 HYDROGEN PERMEATION AND COMPATIBILITY TESTING SEGMENT TO COMMAND MARKET IN 2029
FIGURE 19 ASIA PACIFIC TO DOMINATE GLOBAL HYDROGEN TECHNOLOGY TIC MARKET DURING FORECAST PERIOD
FIGURE 20 HYDROGEN TECHNOLOGY TIC MARKET: DRIVERS, RESTRAINTS, OPPORTUNITIES, AND CHALLENGES
FIGURE 21 DEVELOPMENTS RELATED TO HYDROGEN AND HYDROGEN-BASED FUELS
FIGURE 22 HYDROGEN TECHNOLOGY TIC MARKET: IMPACT ANALYSIS OF DRIVERS
FIGURE 23 HYDROGEN TECHNOLOGY TIC MARKET: IMPACT ANALYSIS OF RESTRAINTS
FIGURE 24 HYDROGEN TECHNOLOGY TIC MARKET: IMPACT ANALYSIS OF OPPORTUNITIES
FIGURE 25 HYDROGEN TECHNOLOGY TIC MARKET: IMPACT ANALYSIS OF CHALLENGES
FIGURE 26 TRENDS/DISRUPTIONS IMPACTING CUSTOMERS’ BUSINESSES
FIGURE 27 AVERAGE SELLING PRICE TREND OF TIC SERVICES OFFERED BY KEY PLAYERS, 2023, (USD)
FIGURE 28 AVERAGE SELLING PRICE TREND OF CERTIFICATION SERVICES OFFERED BY KEY PLAYERS, 2020–2023 (USD)
FIGURE 29 AVERAGE SELLING PRICE TREND OF CERTIFICATION SERVICES, BY REGION, 2020–2023 (USD)
FIGURE 30 HYDROGEN TECHNOLOGY TIC MARKET: SUPPLY CHAIN ANALYSIS
FIGURE 31 ECOSYSTEM ANALYSIS: HYDROGEN TECHNOLOGY TIC MARKET
FIGURE 32 INVESTMENT AND FUNDING SCENARIO
FIGURE 33 NUMBER OF PATENTS APPLIED AND GRANTED FOR HYDROGEN TECHNOLOGY TIC SERVICES, 2014–2023
FIGURE 34 REGIONAL ANALYSIS OF PATENTS GRANTED FOR HYDROGEN TECHNOLOGY TIC SERVICES, 2014–2023
FIGURE 35 EXPORT DATA FOR HS CODE 280410-COMPLIANT PRODUCTS, BY COUNTRY, 2020–2023 (USD THOUSAND)
FIGURE 36 IMPORT DATA FOR HS CODE 280410-COMPLIANT PRODUCTS, BY COUNTRY, 2020–2022 (USD THOUSAND)
FIGURE 37 HYDROGEN TECHNOLOGY TIC MARKET: PORTER’S FIVE FORCES ANALYSIS–2023
FIGURE 38 INFLUENCE OF STAKEHOLDERS ON BUYING PROCESS, BY APPLICATION
FIGURE 39 BUYING CRITERIA, BY APPLICATION
FIGURE 40 MAJOR APPLICATIONS OF AI IN HYDROGEN TECHNOLOGY TIC ECOSYSTEM
FIGURE 41 HYDROGEN TECHNOLOGY TIC MARKET, BY PROCESS
FIGURE 42 GENERATION SEGMENT TO LEAD MARKET IN 2024
FIGURE 43 HYDROGEN TECHNOLOGY TIC MARKET, BY TESTING TYPE
FIGURE 44 HYDROGEN PERMEATION AND COMPATIBILITY TESTING SEGMENT TO LEAD MARKET IN 2024
FIGURE 45 HYDROGEN TECHNOLOGY TIC MARKET, BY APPLICATION
FIGURE 46 REFINING & CHEMICAL SEGMENT TO CLAIM LARGEST MARKET SHARE IN 2029
FIGURE 47 HYDROGEN TECHNOLOGY TIC MARKET, BY SERVICE
FIGURE 48 TESTING SEGMENT TO ACCOUNT FOR LARGEST MARKET SHARE IN 2029
FIGURE 49 HYDROGEN TECHNOLOGY TIC MARKET, BY REGION
FIGURE 50 INDIA TO EXHIBIT HIGHEST CAGR IN GLOBAL HYDROGEN TECHNOLOGY TIC MARKET DURING FORECAST PERIOD
FIGURE 51 ASIA PACIFIC TO REGISTER HIGHEST CAGR DURING FORECAST PERIOD
FIGURE 52 NORTH AMERICA: HYDROGEN TECHNOLOGY TIC MARKET SNAPSHOT
FIGURE 53 EUROPE: HYDROGEN TECHNOLOGY TIC MARKET SNAPSHOT
FIGURE 54 ASIA PACIFIC: HYDROGEN TECHNOLOGY TIC MARKET SNAPSHOT
FIGURE 55 ROW: HYDROGEN TECHNOLOGY TIC MARKET SNAPSHOT
FIGURE 56 HYDROGEN TECHNOLOGY TIC MARKET: REVENUE ANALYSIS OF FIVE KEY PLAYERS, 2019–2023
FIGURE 57 MARKET SHARE ANALYSIS OF TOP COMPANIES IN HYDROGEN TECHNOLOGY TIC SERVICES, 2023
FIGURE 58 COMPANY VALUATION, 2024 (USD BILLION)
FIGURE 59 FINANCIAL METRICS, 2024 (EV/EBITDA)
FIGURE 60 BRAND/PRODUCT COMPARISON
FIGURE 61 HYDROGEN TECHNOLOGY TIC MARKET: COMPANY EVALUATION MATRIX (KEY PLAYERS), 2023
FIGURE 62 HYDROGEN TECHNOLOGY TIC MARKET: COMPANY FOOTPRINT
FIGURE 63 HYDROGEN TECHNOLOGY TIC: COMPANY EVALUATION MATRIX (STARTUPS/SMES), 2023
FIGURE 64 SGS SA: COMPANY SNAPSHOT
FIGURE 65 DNV GL: COMPANY SNAPSHOT
FIGURE 66 BUREAU VERITAS: COMPANY SNAPSHOT
FIGURE 67 INTERTEK GROUP PLC: COMPANY SNAPSHOT
FIGURE 68 TÜV SÜD: COMPANY SNAPSHOT
FIGURE 69 TÜV RHEINLAND: COMPANY SNAPSHOT
FIGURE 70 APPLUS+: COMPANY SNAPSHOT
FIGURE 71 TÜV NORD GROUP: COMPANY SNAPSHOT
FIGURE 72 DEKRA: COMPANY SNAPSHOT


The study involved four major activities in estimating the size of the hydrogen technology TIC market. Exhaustive secondary research has been carried out to collect information on the market, the peer markets, and the parent market. Both top-down and bottom-up approaches have been employed to estimate the total market size. Market breakdown and data triangulation methods have also been used to estimate the market for segments and subsegments.

Secondary Research

Revenues of companies offering hydrogen technology TIC services have been obtained from the secondary data available through paid and unpaid sources. The revenues have also been derived by analyzing the product portfolio of key companies, and these companies have been rated according to the performance and quality of their products.

In the secondary research process, various sources have been referred to for identifying and collecting information for this study on the hydrogen technology TIC market. Secondary sources considered for this research study include government sources, corporate filings, and trade, business, and professional associations. Secondary data has been collected and analyzed to arrive at the overall market size, which has been further validated through primary research.    

Secondary research has been mainly used to obtain key information about the supply chain of hydrogen technology TIC systems to identify key players based on their products and prevailing industry trends in the hydrogen technology TIC market by processor, type, application, end-user, and region. Secondary research also helped obtain market information- and technology-oriented key developments undertaken by market players to expand their presence and increase their market share.  

Primary Research

Extensive primary research has been conducted after understanding and analyzing the current scenario of the hydrogen technology TIC market through secondary research. Several primary interviews have been conducted with the key opinion leaders from the demand and supply sides across four main regions—North America, Europe, Asia Pacific, and the Rest of Europe. Approximately 25% of the primary interviews were conducted with the demand-side respondents, while approximately 75% were conducted with the supply-side respondents. The primary data has been collected through questionnaires, emails, and telephone interviews.

After interacting with industry experts, brief sessions were conducted with highly experienced independent consultants to reinforce the findings from our primary. This, along with the in-house subject matter experts’ opinions, has led us to the findings as described in the remainder of this report. The breakdown of primary respondents is as follows:

Hydrogen Technology Testing, Inspection and Certification (TIC) Market
 Size, and Share

To know about the assumptions considered for the study, download the pdf brochure

Market Size Estimation

The bottom-up procedure has been employed to arrive at the overall size of the hydrogen technology TIC market.

  • More than 25 companies offering testing, inspection, and certification services for hydrogen technology have been identified, and their services have been mapped based on service type, application, and region.
  • The global hydrogen technology TIC market size has been derived through the data sanity method. The revenues of hydrogen technology TIC service providers have been analyzed through annual reports and press releases and summed up to derive the overall market size.
  • For each company, a percentage has been assigned to the overall revenue to derive the revenues from the hydrogen technology testing, inspection, and certification segment.
  • Each company's percentage has been assigned after analyzing various factors, including service offerings, geographic presence, initiatives, and recent developments/strategies adopted for growth in the hydrogen technology TIC market.
  • For the CAGR, the market trend analysis of hydrogen testing, inspection, and certification was conducted by understanding the industry penetration rate and the demand for the supply of hydrogen testing, inspection, and certification services in different sectors.
  • Estimates at every level were verified and validated by discussing with key opinion leaders, including CXOs, directors, operation managers, and domain experts in MarketsandMarkets.
  • Various paid and unpaid information sources, such as annual reports, press releases, white papers, and databases, have been studied.

Hydrogen Technology Testing, Inspection and Certification (TIC) Market
 Size, and Bottom-Up Approach

The top-down approach has been used to estimate and validate the total size of the hydrogen technology TIC market.

  • The report focused on top-line investments and expenditures in the ecosystems of various industries. The hydrogen technology TIC market has been further segmented based on process, testing, type, service type, and application.
  • Further information has been derived from the market revenue generated by the key hydrogen testing, inspection, and certification service providers.
  • Multiple on-field discussions have been carried out with key opinion leaders from each major company involved in providing hydrogen technology TIC services.
  • The geographic splits have been estimated using secondary sources based on various factors such as the number of players in a specific country, region, and major applications.

Hydrogen Technology Testing, Inspection and Certification (TIC) Market
 Size, and Top-Down Approach

Data Triangulation

After arriving at the overall market size-using the market size estimation processes as explained above-the market has been split into several segments and subsegments. To complete the entire market engineering process and arrive at the exact statistics of each market segment and subsegment, data triangulation and market breakdown procedures have been employed, wherever applicable. The data has been triangulated by studying various factors and trends from the demand and supply sides in the hydrogen technology TIC market.

Market Definition

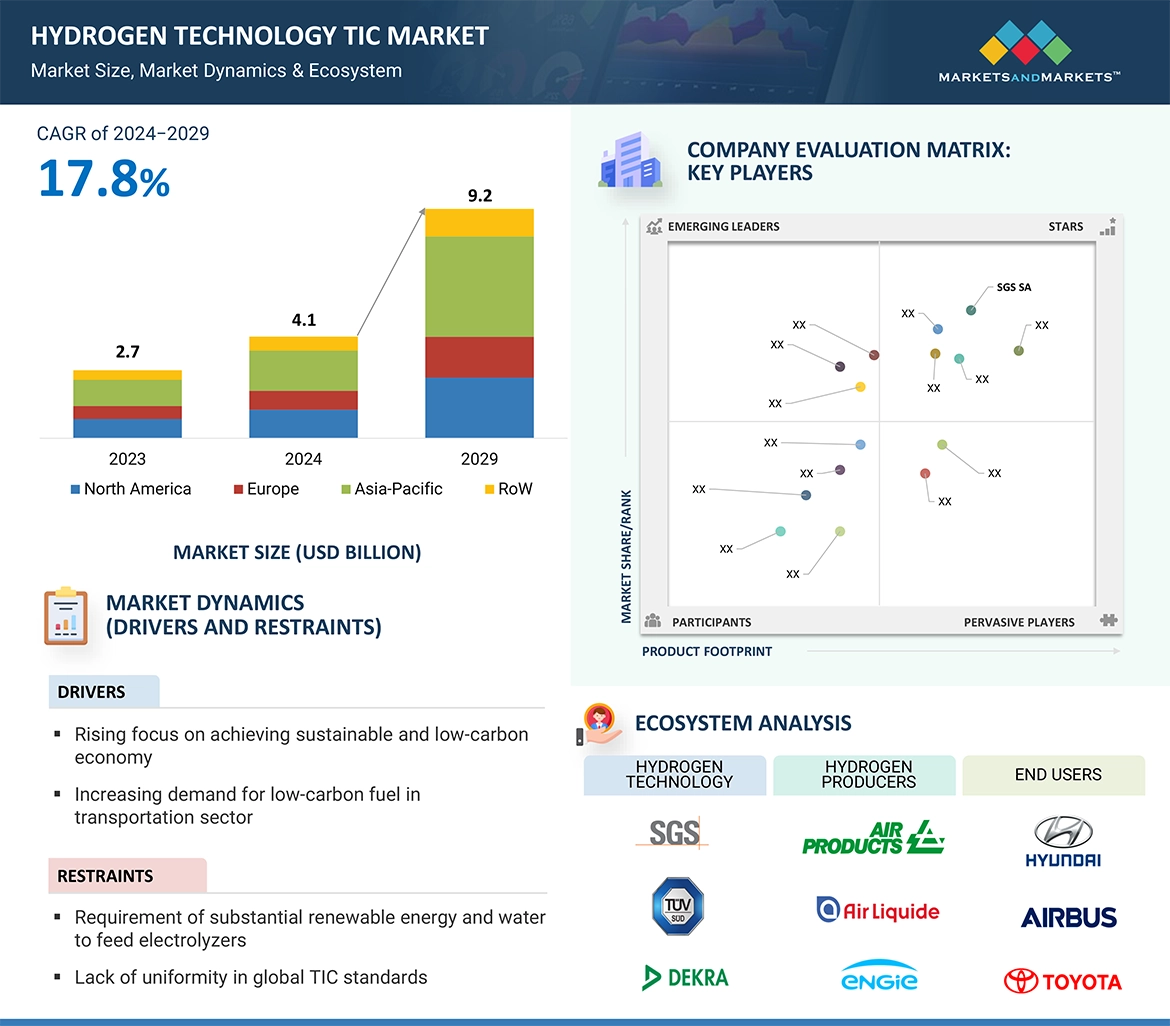
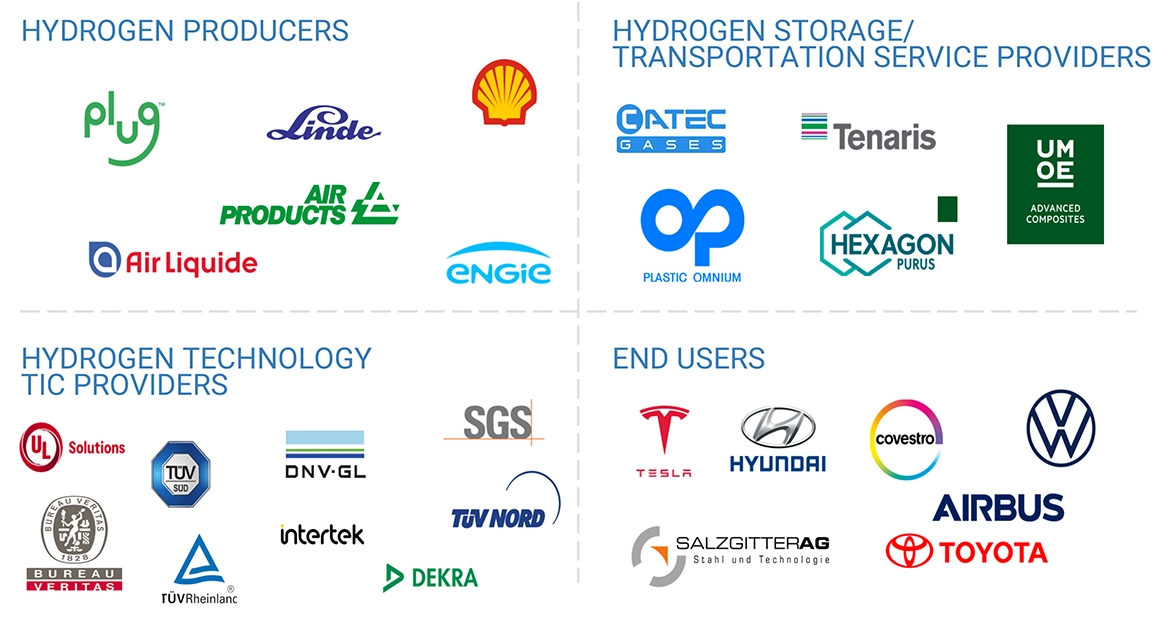
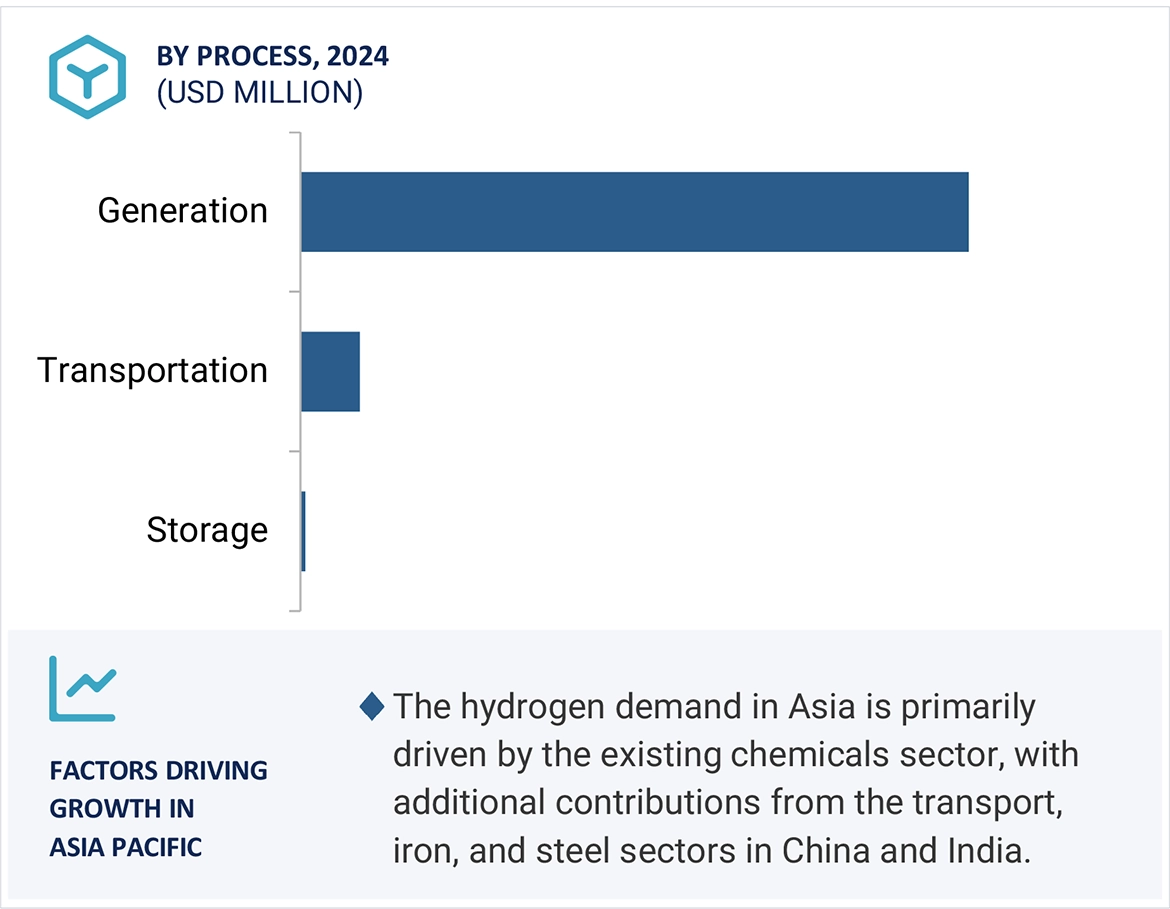
The hydrogen technology testing, inspection, and certification (TIC) market focuses on ensuring the safety, performance, and efficiency of various aspects of the hydrogen value chain. This market encompasses the testing, inspection, and certification of hydrogen technology components related to generation, storage, and transportation. In terms of hydrogen technology, the focus is on evaluating the processes involved in generating hydrogen, such as electrolysis and steam methane reforming, to assess efficiency and environmental impact. Storage methods like compressed gas, liquefied hydrogen, and chemical carriers are tested for effectiveness and safety. Transportation methods, including pipelines, trucks, and ships, undergo testing to ensure safety, efficiency, and infrastructure integrity. The services provided in this market, including testing, inspection, and certification, are crucial for maintaining the safe and reliable operation of hydrogen technologies. Testing involves assessing equipment performance and safety through various tests, while inspection visually identifies defects or hazards. Certification verifies compliance with safety and performance standards set by regulatory bodies, offering assurance to operators and the public. This market serves a range of stakeholders in the hydrogen industry, including equipment manufacturers, developers, project owners, and regulatory bodies. By ensuring that hydrogen technologies meet stringent safety and performance standards, the hydrogen technology TIC Market plays a pivotal role in promoting the safe and sustainable growth of the hydrogen economy.

Key Stakeholders

  • Raw material and testing equipment suppliers
  • Research organizations
  • Technology standards organizations, forums, alliances, and associations
  • Technology investors
  • Analysts and strategic business planners
  • Government bodies, venture capitalists, and private equity firms
  • Manufacturers of fuel cell electric vehicles (FCEVS)
  •  Government organizations
  •  Owners of hydrogen charging stations
  •  Developers and operators of hydrogen fuel pumps
  •  Manufacturers and suppliers of hydrogen generation equipment
  •  Developers of hydrogen generation infrastructure
  •  Institutional investors
  •  Merchant hydrogen producers
  •  Methanol producers
  •  Refinery operators

Report Objectives

  • To define, describe, segment, and forecast the hydrogen technology TIC market, process, service type, testing type, and application, in terms of value
  • To describe and forecast the market for various segments, with respect to four main regions, namely, North America, Europe, Asia Pacific, and the Rest of the World (RoW), in terms of value
  • To forecast and compare the market size of pre-recession with that of the post-recession at the regional level
  • To provide detailed information regarding drivers, restraints, opportunities, and challenges influencing the growth of the hydrogen technology TIC market
  • To provide a detailed overview of the hydrogen technology TIC market’s supply chain, along with the ecosystem, technology trends, use cases, regulatory environment, and porter’s five forces analysis for the market
  • To analyze industry trends, pricing data, patents and innovations, and trade data (export and import data) related to the hydrogen technology TIC.
  • To strategically analyze the micromarkets with respect to individual growth trends, prospects, and contributions to the total market
  • To strategically profile the key players and comprehensively analyze their market share and core competencies2
  • To analyze opportunities for stakeholders and provide a detailed competitive landscape of the market
  • To analyze competitive developments, such as product launches/developments, collaborations, partnerships, acquisitions, and research & development (R&D) activities, carried out by players in the hydrogen technology TIC market
  • To profile key players in the hydrogen technology TIC market and comprehensively analyze their market ranking based on their revenue, market share, and core competencies

Available Customizations

With the given market data, MarketsandMarkets offers customizations according to the specific requirements of companies. The following customization options are available for the report:

  • Detailed analysis and profiling of additional market players based on various blocks of the supply chain
Custom Market Research Services

We will customize the research for you, in case the report listed above does not meet with your exact requirements. Our custom research will comprehensively cover the business information you require to help you arrive at strategic and profitable business decisions.

Request Customization
Report Code
SE 9067
Published ON
Jul, 2024
Choose License Type
BUY NOW
  • SHARE
X
Request Customization
Speak to Analyst
Speak to Analyst
OR FACE-TO-FACE MEETING
PERSONALIZE THIS RESEARCH
  • Triangulate with your Own Data
  • Get Data as per your Format and Definition
  • Gain a Deeper Dive on a Specific Application, Geography, Customer or Competitor
  • Any level of Personalization
REQUEST A FREE CUSTOMIZATION
LET US HELP YOU!
  • What are the Known and Unknown Adjacencies Impacting the Hydrogen Technology Testing, Inspection and Certification (TIC) Market
  • What will your New Revenue Sources be?
  • Who will be your Top Customer; what will make them switch?
  • Defend your Market Share or Win Competitors
  • Get a Scorecard for Target Partners
CUSTOMIZED WORKSHOP REQUEST
  • Call Us
  • +1-888-600-6441 (Corporate office hours)
  • +1-888-600-6441 (US/Can toll free)
  • +44-800-368-9399 (UK office hours)
CONNECT WITH US
ABOUT TRUST ONLINE
©2024 MarketsandMarkets Research Private Ltd. All rights reserved
DMCA.com Protection Status Website Feedback