Human Organoids Market

Human Organoids Market by Product (Pancreas, Kidney, Lung, GIT, Liver Models) Usabilty (Customized, Ready-To-Use), Application (Toxicity, Pathology, Personalized & Regenerative Medicine), Enduser (Pharma-Biotech, CROs, Academia) - Global Forecast to 2025

Report Code: BT 6218 Dec, 2020, by marketsandmarkets.com

The human organoids market is projected to reach USD 1,901 million by 2025, growing at a CAGR of 17.5%. Key growth drivers include technological advancements, an increasing number of transplants, and rising public-private funding. The market is driven by a focus on developing alternatives to animal testing, addressing issues with traditional animal models in drug response prediction. However, the market faces challenges such as a lack of infrastructure for 3D cell culture and a shortage of skilled professionals. The liver segment is expected to hold the largest market share due to advancements in technology and the growing incidence of liver diseases. North America is the leading regional market, with major players like BioIVT, Thermo Fisher Scientific, and Corning contributing significantly. Recent developments include strategic partnerships and collaborations aimed at enhancing organoid applications in drug discovery and regenerative medicine.

Attractive opportunities human organoids market

To know about the assumptions considered for the study, Request for Free Sample Report

Clinical Microbiology Market Dynamics

Drivers: Growing focus on developing alternatives for animal testing models

Animal models are widely used in biomedical research for human-specific diseases. However, there are various cases that demonstrate that animal models cannot always be predictive for human drug response, like in the case of drug toxicology studies. This is because there are wide variations in the metabolism of drugs and toxins in humans as compared to animals, which makes it nearly impossible to study drug metabolism in experimental models such as laboratory rodent species. Additionally, in recent years, several regulations have been implemented that restrict the use of animals in research activities globally. Similarly, several bodies, such as Cruelty Free International and the Fund for the Replacement of Animals in Medical Experiments, oppose the use of animal-based models for research purposes.

It is necessary to develop alternative testing models that can provide an environment with maximum equivalence to that of the human body. Considering this, various institutes are involved in developing alternative methods for drug development and biomedical research. As organoids can serve as alternatives to animal models, the current focus on reducing animal use in research is expected to support the growth of the human organoids market.

Restraints: Issues related to the incorporation of organoids into existing workflows

The lack of infrastructure for 3D cell culture research is significantly limiting the overall growth of the organoids market. The availability of the necessary equipment to use advanced techniques is one of the prerequisites for conducting 3D cell culture-based research. Moreover, various technical challenges are involved in incorporating organoids into existing research workflows as the manufacturing of organoids is capital- and time-intensive. Owing to this, the adoption of organoids in ongoing drug screening and drug discovery activities is limited. This is a major issue as the ongoing drug screening and drug discovery processes will take a long time (up to a few years) to complete.

Organoids are showcasing significant potential in terms of further miniaturizing systems and enabling greater cost reductions in the drug discovery and development process. In spite of these advantages, it is expected to take a few years for this technology to completely replace conventional models. Till the time this scenario persists, organoid manufacturers are expected to witness sporadic growth and may largely be sidelined by conventional technology providers

Opportunityies Increasing focus on drug discovery activities

The increasing demand for new and advanced drugs is driving the overall pace of drug discovery and research. This is the major factor responsible for the rising number of clinical trials conducted for studying and commercializing new drugs. According to ClinicalTrials.gov, the total number of clinical trial studies in 2020 was estimated at 356,282.

A recent study conducted by the Hubrecht Institute states that organoids have the potential to make expensive drugs more cost-effective by identifying patients who are not likely to benefit from the drug. The significant growth in the number of clinical trials across the globe is expected to drive the demand for advanced medical technologies, including organoid models.

Challenges: Dearth of skilled professionals

Skilled professionals, such as researchers and technicians, are required to set up and run experiments involving organoids, and further make observations, obtain results, and analyze the obtained data. The lack of knowledge regarding the underlying scientific principles and the right choice of technique may result in several direct and indirect expenses and increase the workload and time pressure on researchers and service providers. Thus, there is a need for highly skilled personnel for interpretation, method development, validation, operation, and troubleshooting activities.

According to the US Bureau of Labor Statistics, the US economy faces a shortage of STEM (science, technology, engineering, and mathematics) professionals. As per the US Bureau of Labor Statistics, there is a dearth of skilled professionals in the fields of medical research, pharmaceuticals, and sciences. Several European countries, which are among the early adopters of new technologies in the life sciences sector, are facing similar challenges due to the shortage of graduates in STEM fields. Similarly, in India, the shortage of skilled talent in the STEM sector has increased from 6% in January 2014 to 12% in January 2018. This is considered a major challenge in the organoids market. 

Human Organoids Market Store

To know about the assumptions considered for the study, download the pdf brochure

By product, liver segment is expected to have the largest market share during the forecast period

The large share of this segment is attributed to factors such as the significant adoption of new technologies  among researchers and academia (coupled with growing industry-academia collaborations for genomic research), technological advancements in the field of 3D bioprinting  and the increased number of liver tranplants and diseases. 

Delelopmental biology is the largest application segment of the human orgnaoids market

Developmental biology includes the production of gametes, fertilization, development of the embryo, emergence of the adult organism, and senescence. Organoids developed from stem cells or tissues in culture can be converted into structures that resemble the in vivo anatomy and physiology of intact organs. Human organoid cultures provide the potential to study the human development and model disease processes with the same depth of analysis customary for research with nonhuman model organisms. Technological advancements in the field of 3D bioprinting have shown huge potential for organ development as the culture time is very less compared to traditional methods of tissue culture. Patient-derived human organoid studies may accelerate medical research, creating new opportunities for tissue engineering and regenerative medicine and generating knowledge and tools for preclinical studies, including drug development and testing.

Pharceuticals & Biotechnology companies accounted for the largest share of the human organoids market, by end users, in 2020

Pharmaceutical and biotechnology companies mainly focus on developing new drugs for the treatment of various rare diseases. These companies need to submit specific data related to drug development during the drug development process and subsequent filing of applications to regulatory bodies. This necessitates a wide spectrum of services in the early development phases and clinical phases to comply with regulatory requirements. Technical and regulatory challenges related to the development of new drug molecules create complexities for pharmaceutical and biotechnology companies in terms of time and cost. However, due to strict regulations, companies often produce technologically superior products with better safety norms.

Human Organoids Market By Region

North America is the largest regional market for Human Organoids

North America (comprising the US and Canada) dominates the human orgnaoids market. North America is a mature market, with high penetration of human organoids technologies among key end users (pharmaceuticals & biotechnology companies, CROs, academia and others) and well-established distribution channels for human organoids product manufacturers and suppliers. Easy accessibility to and the high adoption of advanced technologies due to the significant per capita annual healthcare expenditure by the US and Canadian governments, as well as supportive government regulations, are driving the growth of the human organoids market in this region.

Key Market Players

BioIVT (US), Thermo Fisher Scientific (US), ZenBio (US), Corning (US), Organovo (US), Cyprio (France), Biopredic International (France), CELLINK (Sweden), Emulate (US), Hµrel Corporation (US), InSphero (Switzerland), Kerafast (US), Kirkstall (UK), and MIMETAS (Netherlands). 

BioIVT  founded in 1981 and is headquartered in New York, US. The company is a leading global provider of biological specimens, including human tissues, cell products, blood, and other biofluids. The company provides a wide range of services, ranging from target and biomarker validation, phenotypic assays to characterize novel therapeutics, and clinical assay development to in vitro hepatic modeling solutions. It is a supplier of ADME-Tox model systems, including hepatocytes and subcellular fractions, to better understand the pharmacokinetics and drug metabolism of newly discovered compounds and the effects on disease processes.

Some of the major end users of the company’s products are research organizations, pharmaceutical and biotechnological companies, medical device companies, and academic research institutes. BioIVT offers its products and services across North America, the Asia Pacific, Europe, and the Middle East & Africa. The company has two distributors in the Asia Pacific region, namely, Veritas Corporation (Japan) and Research Institute for Liver Diseases (Shanghai) Co., Ltd. (China).

Want to explore hidden markets that can drive new revenue in Human Organoids Market?

Scope of the Report

Report Metric

Details

Market Size Available for Years

2017–2025

Base Year Considered

2019

Forecast Period

2020–2025

Forecast Units

Value (USD Million)

Segments Covered

Product, Application, Usability, End Users and Region

Geographies Covered

North America (US & Canada), Europe (Germany, the UK, France, Italy, Spain, and RoE), APAC (Japan, China, India, and the RoAPAC), LATAM (Brazil, Mexico, and RoLATAM), and MEA

Companies Covered

BioIVT (US), Thermo Fisher Scientific (US), Corning Incorporated (US), ZenBio (US), Organovo (US), InSphero (Switzerland), Kaly-Cell (France), STEMCELL Technologies (Canada), Hµrel Corporation (US), CELLINK (US), Kirkstall (US), PRIMACYT Cell Culture Technology (Germany, Cyprio (UK), Biopredic International (France), Kerafast (US), CN Bio Innovations (UK), MIMETAS (Netherlands), Pandorum Technologies (India), Promethera Biosciences (Belgium), Miromatrix (US), System1 Biosciences, Inc. (US), and Cyfuse Biomedical (Japan)

This research report categorizes the human organoids market based on product, application, usabilty, end user, and region. 

By Product

  • Liver
  • Kidney
  • Pancreas
  • Colorectal
  • Heart
  • Others 

By Application

  • Developmental biology
  • Drug toxicity & efficacy testing
  • Disease pathology
  • Personalized medicine
  • Regenerative medicine
  • Other application 

By Usabilty

  • Ready to use products
  • Customizable products 

By End Users 

  • Pharmaceutical & Biotechnology companies
  • CROs
  • Academic & Research Institutes
  • Others

By Region

  • North America
    • US
    • Canada
  • Europe
    • Germany
    • UK
    • France
    • Italy
    • Spain
    • RoE
  • Asia Pacific
    • Japan
    • China
    • India
    • RoAPAC
  • Latin America
    • Brazil
    • Mexico
    • Rest of Latin America
  • Middle East and Africa

Recent Developments

  • In 2020, BIOIVT (US) partnered with upcyte technologies GmbH (Germany) as the exclusive commercial worldwide distributor for its cell products and media, including cells derived from hepatocytes and liver sinusoidal endothelial cells (LSECs).
  • In 2019, Hurel and Cyprotex came into partnership which enabled Cyprotex to independently validate the HµREL multi-donor co­culture model for clearance studies.
  • In 2019, Organovo collaborated with MCRI and Leiden University Medical Center to develop stem cell-based bioprinted tissue treatment for kidney diseases..
  • In 2018, Absolute Antibody merged with Kerafast to increase access to unique reagents.

Frequently Asked Questions (FAQ):

To speak to our analyst for a discussion on the above findings, click Speak to Analyst


Exclusive indicates content/data unique to MarketsandMarkets and not available with any competitors.


TABLE OF CONTENTS
 
1 INTRODUCTION (Page No. - 19)
    1.1 OBJECTIVES OF THE STUDY
    1.2 MARKET DEFINITION
 TABLE 1 INCLUSIONS & EXCLUSIONS
    1.3 MARKET SCOPE
           1.3.1 MARKETS COVERED
           1.3.2 YEARS CONSIDERED FOR THE STUDY
    1.4 CURRENCY
    1.5 STAKEHOLDERS
    1.6 SUMMARY OF CHANGES

2 RESEARCH METHODOLOGY (Page No. - 22)
    2.1 RESEARCH DATA
 FIGURE 1 RESEARCH DESIGN
           2.1.1 SECONDARY DATA
                    2.1.1.1 Secondary sources
           2.1.2 PRIMARY DATA
    FIGURE 2 BREAKDOWN OF PRIMARIES: HUMAN ORGANOIDS MARKET
    2.2 MARKET ESTIMATION METHODOLOGY
 FIGURE 3 RESEARCH METHODOLOGY: HYPOTHESIS BUILDING
           2.2.1 REVENUE MAPPING-BASED MARKET ESTIMATION
           2.2.2 PROCEDURE-BASED MARKET ESTIMATION
    FIGURE 4 MARKET SIZE ESTIMATION: HUMAN ORGANOIDS MARKET
           2.2.3 PRIMARY RESEARCH VALIDATION
    2.3 DATA TRIANGULATION
 FIGURE 5 DATA TRIANGULATION METHODOLOGY
    2.4 RESEARCH ASSUMPTIONS
    2.5 RESEARCH LIMITATIONS

3 EXECUTIVE SUMMARY (Page No. - 31)
  FIGURE 6 HUMAN ORGANOIDS MARKET, BY PRODUCT, 2020 VS. 2025 (USD MILLION)
  FIGURE 7 HUMAN ORGANOIDS MARKET, BY APPLICATION, 2020 VS. 2025 (USD MILLION)
  FIGURE 8 HUMAN ORGANOIDS MARKET SHARE, BY END USER, 2020 VS. 2025
  FIGURE 9 GEOGRAPHICAL SNAPSHOT OF THE HUMAN ORGANOIDS MARKET
 
4 PREMIUM INSIGHTS (Page No. - 34)
    4.1 HUMAN ORGANOIDS MARKET OVERVIEW
 FIGURE 10 GROWING FOCUS ON DEVELOPING ALTERNATIVES FOR ANIMAL TESTING MODELS TO DRIVE MARKET GROWTH
    4.2 HUMAN ORGANOIDS MARKET, BY PRODUCT, 2020 VS. 2025 (USD MILLION)
 FIGURE 11 LIVER ORGANOIDS ARE EXPECTED TO DOMINATE THE HUMAN ORGANOID PRODUCTS MARKET
    4.3 ASIA PACIFIC: HUMAN ORGANOIDS MARKET, BY END USER & COUNTRY (2019)
 FIGURE 12 PHARMACEUTICAL & BIOTECHNOLOGY COMPANIES ACCOUNTED FOR THE LARGEST SHARE OF THE APAC HUMAN ORGANOIDS MARKET IN 2019
    4.4 GEOGRAPHIC ANALYSIS: HUMAN ORGANOIDS MARKET, BY USABILITY (2019)
 FIGURE 13 READY-TO-USE PRODUCTS SEGMENT DOMINATES THE GLOBAL HUMAN ORGANOIDS MARKET
    4.5 HUMAN ORGANOIDS MARKET: GEOGRAPHIC GROWTH OPPORTUNITIES
 FIGURE 14 ASIA PACIFIC TO REGISTER THE HIGHEST CAGR DURING THE FORECAST PERIOD

5 MARKET OVERVIEW (Page No. - 38)
    5.1 INTRODUCTION
    5.2 MARKET DYNAMICS
 FIGURE 15 HUMAN ORGANOIDS MARKET: DRIVERS, RESTRAINTS, OPPORTUNITIES, & CHALLENGES
           5.2.1 DRIVERS
                    5.2.1.1 Growing focus on developing alternatives for animal testing models
                    5.2.1.2 Significant increase in research funding and venture capital investments for the development of human organoids
                    5.2.1.3 Growing initiatives to increase awareness about organoids
       TABLE 2 GROWING INITIATIVES AND EVENTS FOR ORGANOIDS
                    5.2.1.4 Increasing research activities on organoids
       TABLE 3 RESEARCH PROJECTS AND ACTIVITIES
                    5.2.1.5 Increasing prevalence of non-alcoholic fatty liver disease
                    5.2.1.6 Growing need for the early detection of drug toxicity to minimize financial losses due to late-stage drug failure
           5.2.2 RESTRAINTS
                    5.2.2.1 Issues related to the incorporation of organoids into existing workflows
           5.2.3 OPPORTUNITIES
                    5.2.3.1 Increasing focus on drug discovery activities
                    5.2.3.2 Rising demand for organ transplantation
                    5.2.3.3 Growing healthcare market in the Asia Pacific and Latin America
           5.2.4 CHALLENGES
                    5.2.4.1 Dearth of skilled professionals
    5.3 IMPACT OF THE COVID-19 PANDEMIC ON THE HUMAN ORGANOIDS MARKET
    5.4 REGULATORY SCENARIO
    5.5 ECOSYSTEM COVERAGE
    5.6 TECHNOLOGY ANALYSIS
    5.7 PRICING ANALYSIS

6 HUMAN ORGANOIDS MARKET, BY PRODUCT (Page No. - 49)
    6.1 INTRODUCTION
 TABLE 4 HUMAN ORGANOIDS MARKET, BY PRODUCT, 2018-2025 (USD MILLION)
    6.2 LIVER
 TABLE 5 HUMAN LIVER ORGANOIDS MARKET, BY TYPE, 2018-2025 (USD MILLION)
           6.2.1 2D LIVER MODELS
    TABLE 6 2D LIVER MODELS MARKET, BY TYPE, 2018-2025 (USD MILLION)
                    6.2.1.1 Fresh hepatocytes
       TABLE 7 FRESH HEPATOCYTES MARKET, BY REGION, 2018-2025 (USD MILLION)
                    6.2.1.2 Cryopreserved hepatocytes
       TABLE 8 CRYOPRESERVED HEPATOCYTES MARKET, BY REGION, 2018-2025 (USD MILLION)
                    6.2.1.3 Other 2D liver models
       TABLE 9 OTHER 2D LIVER MODELS MARKET, BY REGION, 2018-2025 (USD MILLION)
           6.2.2 3D LIVER MODELS
    TABLE 10 3D LIVER MODELS MARKET, BY TYPE, 2018-2025 (USD MILLION)
    TABLE 11 3D LIVER MODELS MARKET, BY REGION, 2018-2025 (USD MILLION)
                    6.2.2.1 Liver organoids
       TABLE 12 LIVER ORGANOIDS MARKET, BY REGION, 2018-2025 (USD MILLION)
                    6.2.2.2 3D bioprinted liver
       TABLE 13 3D BIOPRINTED LIVER MARKET, BY REGION, 2018-2025 (USD MILLION)
                    6.2.2.3 Spheroids
       TABLE 14 LIVER SPHEROIDS MARKET, BY REGION, 2018-2025 (USD MILLION)
                    6.2.2.4 Liver-on-a-chip
       TABLE 15 LIVER-ON-A-CHIP MARKET, BY REGION, 2018-2025 (USD MILLION)
                    6.2.2.5 Other 3D liver models
       TABLE 16 OTHER 3D LIVER MODELS MARKET, BY REGION, 2018-2025 (USD MILLION)
    6.3 KIDNEY
 TABLE 17 HUMAN KIDNEY ORGANOIDS MARKET, BY TYPE, 2018-2025 (USD MILLION)
           6.3.1 2D KIDNEY MODELS
    TABLE 18 2D KIDNEY MODELS MARKET, BY TYPE, 2018-2025 (USD MILLION)
                    6.3.1.1 Fresh kidney cells
       TABLE 19 FRESH KIDNEY CELLS MARKET, BY REGION, 2018-2025 (USD MILLION)
                    6.3.1.2 Cryopreserved cells
       TABLE 20 KIDNEY CRYOPRESERVED CELLS MARKET, BY REGION, 2018-2025 (USD MILLION)
                    6.3.1.3 Other 2D kidney models
       TABLE 21 OTHER 2D KIDNEY MODELS MARKET, BY REGION, 2018-2025 (USD MILLION)
           6.3.2 3D KIDNEY MODELS
    TABLE 22 3D KIDNEY MODELS MARKET, BY TYPE, 2018-2025 (USD MILLION)
    TABLE 23 3D KIDNEY MODELS MARKET, BY REGION, 2018-2025 (USD MILLION)
                    6.3.2.1 Organoids
       TABLE 24 KIDNEY ORGANOIDS MARKET, BY REGION, 2018-2025 (USD MILLION)
                    6.3.2.2 3D bioprinted kidney
       TABLE 25 3D BIOPRINTED KIDNEY MARKET, BY REGION, 2018-2025 (USD MILLION)
                    6.3.2.3 Spheroids
       TABLE 26 KIDNEY SPHEROIDS MARKET, BY REGION, 2018-2025 (USD MILLION)
                    6.3.2.4 Other 3D kidney models
       TABLE 27 OTHER 3D KIDNEY MODELS MARKET, BY REGION, 2018-2025 (USD MILLION)
    6.4 PANCREAS
 TABLE 28 HUMAN PANCREAS ORGANOIDS MARKET, BY TYPE, 2018-2025 (USD MILLION)
           6.4.1 2D PANCREATIC MODELS
    TABLE 29 2D PANCREATIC MODELS MARKET, BY TYPE, 2018-2025 (USD MILLION)
                    6.4.1.1 Cryopreserved cells
       TABLE 30 PANCREATIC CRYOPRESERVED CELLS MARKET, BY REGION, 2018-2025 (USD MILLION)
                    6.4.1.2 Fresh cells
       TABLE 31 PANCRATIC FRESH CELLS MARKET, BY REGION, 2018-2025 (USD MILLION)
                    6.4.1.3 Other 2D pancreatic models
       TABLE 32 OTHER 2D PANCREATIC MODELS MARKET, BY REGION, 2018-2025 (USD MILLION)
           6.4.2 3D PANCREATIC MODELS
    TABLE 33 3D PANCREATIC MODELS MARKET, BY TYPE, 2018-2025 (USD MILLION)
    TABLE 34 3D PANCREATIC MODELS MARKET, BY REGION, 2018-2025 (USD MILLION)
                    6.4.2.1 Organoids
       TABLE 35 PANCREATIC ORGANOIDS MARKET, BY REGION, 2018-2025 (USD MILLION)
                    6.4.2.2 3D bioprinted pancreas
       TABLE 36 3D BIOPRINTED PANCREAS MARKET, BY REGION, 2018-2025 (USD MILLION)
                    6.4.2.3 Spheroids
       TABLE 37 PANCREATIC SPHEROIDS MARKET, BY REGION, 2018-2025 (USD MILLION)
                    6.4.2.4 Other 3D pancreatic models
       TABLE 38 OTHER 3D PANCREATIC MODELS MARKET, BY REGION, 2018-2025 (USD MILLION)
    6.5 COLORECTAL
 TABLE 39 HUMAN COLORECTAL ORGANOIDS MARKET, BY TYPE, 2018-2025 (USD MILLION)
           6.5.1 2D COLORECTAL MODELS
    TABLE 40 2D COLORECTAL MODELS MARKET, BY TYPE, 2018-2025 (USD MILLION)
                    6.5.1.1 Fresh cells
       TABLE 41 COLORECTAL FRESH CELLS MARKET, BY REGION, 2018-2025 (USD MILLION)
                    6.5.1.2 Cryopreserved cells
       TABLE 42 COLORECTAL CRYOPRESERVED CELLS MARKET, BY REGION, 2018-2025 (USD MILLION)
                    6.5.1.3 Other 2D colorectal models
       TABLE 43 OTHER 2D COLORECTAL MODELS MARKET, BY REGION, 2018-2025 (USD MILLION)
           6.5.2 3D COLORECTAL MODELS
    TABLE 44 3D COLORECTAL MODELS MARKET, BY TYPE, 2018-2025 (USD MILLION)
    TABLE 45 3D COLORECTAL MODELS MARKET, BY REGION, 2018-2025 (USD MILLION)
                    6.5.2.1 Organoids
       TABLE 46 COLORECTAL ORGANOIDS MARKET, BY REGION, 2018-2025 (USD MILLION)
                    6.5.2.2 3D bioprinted models
       TABLE 47 COLORECTAL 3D BIOPRINTED MODELS MARKET, BY REGION, 2018-2025 (USD MILLION)
                    6.5.2.3 Spheroids
       TABLE 48 COLORECTAL SPHEROIDS MARKET, BY REGION, 2018-2025 (USD MILLION)
                    6.5.2.4 Other 3D colorectal models
       TABLE 49 OTHER 3D COLORECTAL MODELS MARKET, BY REGION, 2018-2025 (USD MILLION)
    6.6 HEART
 TABLE 50 HUMAN HEART ORGANOIDS MARKET, BY TYPE, 2018-2025 (USD MILLION)
           6.6.1 2D HEART MODELS
    TABLE 51 2D HEART MODELS MARKET, BY TYPE, 2018-2025 (USD MILLION)
                    6.6.1.1 Fresh cells
       TABLE 52 HEART FRESH CELLS MARKET, BY REGION, 2018-2025 (USD MILLION)
                    6.6.1.2 Cryopreserved cells
       TABLE 53 HEART CRYOPRESERVED CELLS MARKET, BY REGION, 2018-2025 (USD MILLION)
                    6.6.1.3 Other 2D heart models
       TABLE 54 OTHER 2D HEART MODELS MARKET, BY REGION, 2018-2025 (USD MILLION)
           6.6.2 3D HEART MODELS
    TABLE 55 3D HEART MODELS MARKET, BY TYPE, 2018-2025 (USD MILLION)
    TABLE 56 3D HEART MODELS MARKET, BY REGION, 2018-2025 (USD MILLION)
                    6.6.2.1 Organoids
       TABLE 57 HEART ORGANOIDS MARKET, BY REGION, 2018-2025 (USD MILLION)
                    6.6.2.2 3D bioprinted heart
       TABLE 58 3D BIOPRINTED HEART MARKET, BY REGION, 2018-2025 (USD MILLION)
                    6.6.2.3 Spheroids
       TABLE 59 HEART SPHEROIDS MARKET, BY REGION, 2018-2025 (USD MILLION)
                    6.6.2.4 Other 3D heart models
       TABLE 60 OTHER 3D HEART MODELS MARKET, BY REGION, 2018-2025 (USD MILLION)
    6.7 OTHER PRODUCTS
 TABLE 61 HUMAN ORGANOIDS MARKET FOR OTHER PRODUCTS, BY TYPE, 2018-2025 (USD MILLION)
           6.7.1 2D MODELS
    TABLE 62 OTHERS 2D MODELS MARKET, BY TYPE, 2018-2025 (USD MILLION)
                    6.7.1.1 Fresh cells
       TABLE 63 OTHERS FRESH CELLS MARKET, BY REGION, 2018-2025 (USD MILLION)
                    6.7.1.2 Cryopreserved cells
       TABLE 64 OTHERS CRYOPRESERVED CELLS MARKET, BY REGION, 2018-2025 (USD MILLION)
                    6.7.1.3 Other 2D models
       TABLE 65 OTHERS OTHER 2D MODELS MARKET, BY REGION, 2018-2025 (USD MILLION)
           6.7.2 3D MODELS
    TABLE 66 OTHERS 3D MODELS MARKET, BY TYPE, 2018-2025 (USD MILLION)
    TABLE 67 3D OTHER MODELS MARKET, BY REGION, 2018-2025 (USD MILLION)
                    6.7.2.1 Organoids
       TABLE 68 OTHERS ORGANOIDS MARKET, BY REGION, 2018-2025 (USD MILLION)
                    6.7.2.2 3D bioprinted models
       TABLE 69 OTHERS 3D BIOPRINTED MODELS MARKET, BY REGION, 2018-2025 (USD MILLION)
                    6.7.2.3 Spheroids
       TABLE 70 OTHERS SPHEROIDS MARKET, BY REGION, 2018-2025 (USD MILLION)
                    6.7.2.4 Other 3D models
       TABLE 71 OTHERS OTHER 3D MODELS MARKET, BY REGION, 2018-2025 (USD MILLION)

7 HUMAN ORGANOIDS MARKET, BY USABILITY (Page No. - 90)
    7.1 INTRODUCTION
 TABLE 72 HUMAN ORGANOIDS MARKET, BY USABILITY, 2018-2025 (USD MILLION)
    7.2 READY-TO-USE PRODUCTS
           7.2.1 READY-TO-USE PRODUCTS SEGMENT TO DOMINATE THE MARKET AS THEY CAN BE MASS PRODUCED
    TABLE 73 HUMAN ORGANOIDS MARKET FOR READY-TO-USE PRODUCTS, BY REGION, 2018-2025 (USD MILLION)
    7.3 CUSTOMIZABLE PRODUCTS
           7.3.1 CUSTOMIZABLE PRODUCTS CAN FULFIL THE REQUIREMENT FOR A SPECIFIC NEED OF ORGAN TRANSPLANTATION
    TABLE 74 HUMAN ORGANOIDS MARKET FOR CUSTOMIZABLE PRODUCTS, BY REGION, 2018-2025 (USD MILLION)
 
8 HUMAN ORGANOIDS MARKET, BY APPLICATION (Page No. - 94)
    8.1 INTRODUCTION
 TABLE 75 HUMAN ORGANOIDS MARKET, BY APPLICATION, 2018-2025 (USD MILLION)
    8.2 DEVELOPMENTAL BIOLOGY
           8.2.1 TECHNOLOGICAL ADVANCEMENTS IN THE FIELD OF 3D BIOPRINTING WILL BOOST MARKET GROWTH
    TABLE 76 HUMAN ORGANOIDS MARKET FOR DEVELOPMENTAL BIOLOGY, BY REGION, 2018-2025 (USD MILLION)
    8.3 DRUG TOXICITY & EFFICACY TESTING
           8.3.1 DRUG TOXICITY & EFFICACY TESTING WILL WITNESS GROWTH AS ORGANOIDS SHOW HIGH RESISTANCE TOWARDS CLINICAL DOSES
    TABLE 77 HUMAN ORGANOIDS MARKET FOR DRUG TOXICITY & EFFICACY TESTING, BY REGION, 2018-2025 (USD MILLION)
    8.4 DISEASE PATHOLOGY
           8.4.1 DEVELOPMENT OF INTESTINAL ORGANOIDS TO SUPPORT MARKET GROWTH
    TABLE 78 HUMAN ORGANOIDS MARKET FOR DISEASE PATHOLOGY, BY REGION, 2018-2025 (USD MILLION)
    8.5 PERSONALIZED MEDICINE
           8.5.1 HIGH COST OF DEVELOPING ORGANOIDS TO HAMPER MARKET GROWTH
    TABLE 79 HUMAN ORGANOIDS MARKET FOR PERSONALIZED MEDICINE, BY REGION, 2018-2025 (USD MILLION)
    8.6 REGENERATIVE MEDICINE
           8.6.1 ORGANOIDS HOLD A HUGE POTENTIAL IN REGENERATIVE MEDICINE PURPOSES
    TABLE 80 HUMAN ORGANOIDS MARKET FOR REGENERATIVE MEDICINE, BY REGION, 2018-2025 (USD MILLION)
    8.7 OTHER APPLICATIONS
 TABLE 81 HUMAN ORGANOIDS MARKET FOR OTHER APPLICATIONS, BY REGION, 2018-2025 (USD MILLION)

9 HUMAN ORGANOIDS MARKET, BY END USER (Page No. - 102)
    9.1 INTRODUCTION
 TABLE 82 HUMAN ORGANOIDS MARKET, BY END USER, 2018-2025 (USD MILLION)
    9.2 PHARMACEUTICAL & BIOTECHNOLOGY COMPANIES
           9.2.1 PHARMACEUTICAL & BIOTECHNOLOGY COMPANIES ARE THE LARGEST END USERS OF HUMAN ORGANOID PRODUCTS
    TABLE 83 HUMAN ORGANOIDS MARKET FOR PHARMACEUTICAL & BIOTECHNOLOGY COMPANIES, BY REGION, 2018-2025 (USD MILLION)
    9.3 CONTRACT RESEARCH ORGANIZATIONS
           9.3.1 INCREASING OUTSOURCING OF CLINICAL RESEARCH SERVICES BY PHARMACEUTICAL & BIOTECHNOLOGY COMPANIES TO SUPPORT MARKET GROWTH
    TABLE 84 HUMAN ORGANOIDS MARKET FOR CONTRACT RESEARCH ORGANIZATIONS, BY REGION, 2018-2025 (USD MILLION)
    9.4 ACADEMIC & RESEARCH INSTITUTES
           9.4.1 HIGH COST OF TECHNOLOGICALLY ADVANCED ORGANOIDS IS EXPECTED TO HAMPER MARKET GROWTH FOR THESE FACILITIES
    TABLE 85 HUMAN ORGANOIDS MARKET FOR ACADEMIC & RESEARCH INSTITUTES, BY REGION, 2018-2025 (USD MILLION)
    9.5 OTHER END USERS
 TABLE 86 HUMAN ORGANOIDS MARKET FOR OTHER END USERS, BY REGION, 2018-2025 (USD MILLION)

10 HUMAN ORGANOIDS MARKET, BY REGION (Page No. - 107)
    10.1 INTRODUCTION
  TABLE 87 HUMAN ORGANOIDS MARKET, BY REGION, 2018-2025 (USD MILLION)
    10.2 NORTH AMERICA
  FIGURE 16 NORTH AMERICA: HUMAN ORGANOIDS MARKET SNAPSHOT
  TABLE 88 NORTH AMERICA: HUMAN ORGANOIDS MARKET, BY COUNTRY, 2018-2025 (USD MILLION)
  TABLE 89 NORTH AMERICA: HUMAN LIVER ORGANOIDS MARKET, BY TYPE, 2018-2025 (USD MILLION)
  TABLE 90 NORTH AMERICA: HUMAN LIVER ORGANOIDS MARKET FOR 2D MODELS, BY TYPE, 2018-2025 (USD MILLION)
  TABLE 91 NORTH AMERICA: HUMAN LIVER ORGANOIDS MARKET FOR 3D MODELS, BY TYPE, 2018-2025 (USD MILLION)
  TABLE 92 NORTH AMERICA: HUMAN ORGANOIDS MARKET, BY APPLICATION, 2018-2025 (USD MILLION)
  TABLE 93 NORTH AMERICA: HUMAN ORGANOIDS MARKET, BY USABILITY, 2018-2025 (USD MILLION)
  TABLE 94 NORTH AMERICA: HUMAN ORGANOIDS MARKET, BY END USER, 2018-2025 (USD MILLION)
           10.2.1 US
                    10.2.1.1 Ongoing technological advancements in the field of transplantation to drive market growth in the US
        TABLE 95 US: HUMAN LIVER ORGANOIDS MARKET, BY TYPE, 2018-2025 (USD MILLION)
           10.2.2 CANADA
                    10.2.2.1 Growing availability of human organoid products to support market growth in Canada
        TABLE 96 CANADA: HUMAN LIVER ORGANOIDS MARKET, BY TYPE, 2018-2025 (USD MILLION)
    10.3 EUROPE
  TABLE 97 EUROPE: HUMAN ORGANOIDS MARKET, BY COUNTRY, 2018-2025 (USD MILLION)
  TABLE 98 EUROPE: HUMAN LIVER ORGANOIDS MARKET, BY TYPE, 2018-2025 (USD MILLION)
  TABLE 99 EUROPE: HUMAN LIVER ORGANOIDS MARKET FOR 2D MODELS, BY TYPE, 2018-2025 (USD MILLION)
  TABLE 100 EUROPE: HUMAN LIVER ORGANOIDS MARKET FOR 3D MODELS, BY TYPE, 2018-2025 (USD MILLION)
  TABLE 101 EUROPE: HUMAN ORGANOIDS MARKET, BY APPLICATION, 2018-2025 (USD MILLION)
  TABLE 102 EUROPE: HUMAN ORGANOIDS MARKET, BY USABILITY, 2018-2025 (USD MILLION)
  TABLE 103 EUROPE: HUMAN ORGANOIDS MARKET, BY END USER, 2018-2025 (USD MILLION)
           10.3.1 GERMANY
                    10.3.1.1 Germany dominates the European human organoids market
        TABLE 104 GERMANY: HUMAN LIVER ORGANOIDS MARKET, BY TYPE, 2018-2025 (USD MILLION)
           10.3.2 UK
                    10.3.2.1 Rising number of transplantation procedures to drive market growth in the UK
        TABLE 105 UK: NUMBER OF TRANSPLANTATION PROCEDURES, BY ORGAN TYPE, 2018
        TABLE 106 UK: HUMAN LIVER ORGANOIDS MARKET, BY TYPE, 2018-2025 (USD MILLION)
           10.3.3 FRANCE
                    10.3.3.1 Adoption of molecular diagnostic techniques for donor-recipient compatibility testing is increasing in France
        TABLE 107 FRANCE: HUMAN LIVER ORGANOIDS MARKET, BY TYPE, 2018-2025 (USD MILLION)
           10.3.4 ITALY
                    10.3.4.1 Sluggish growth in the Italian healthcare sector to restrain the market growth
        TABLE 108 ITALY: HUMAN LIVER ORGANOIDS MARKET, BY TYPE, 2018-2025 (USD MILLION)
           10.3.5 SPAIN
                    10.3.5.1 Rising number of solid organ transplantation procedures to drive market growth in Spain
        TABLE 109 SPAIN: HUMAN LIVER ORGANOIDS MARKET, BY TYPE, 2018-2025 (USD MILLION)
           10.3.6 REST OF EUROPE
     TABLE 110 ROE: HUMAN LIVER ORGANOIDS MARKET, BY TYPE, 2018-2025 (USD MILLION)
    10.4 ASIA PACIFIC
  FIGURE 17 ASIA PACIFIC: HUMAN ORGANOIDS MARKET SNAPSHOT
  TABLE 111 ASIA PACIFIC: HUMAN ORGANOIDS MARKET, BY COUNTRY, 2018-2025 (USD MILLION)
  TABLE 112 ASIA PACIFIC: HUMAN LIVER ORGANOIDS MARKET, BY TYPE, 2018-2025 (USD MILLION)
  TABLE 113 ASIA PACIFIC: HUMAN LIVER ORGANOIDS MARKET FOR 2D MODELS, BY TYPE, 2018-2025 (USD MILLION)
  TABLE 114 ASIA PACIFIC: HUMAN LIVER ORGANOIDS MARKET FOR 3D MODELS, BY TYPE, 2018-2025 (USD MILLION)
  TABLE 115 ASIA PACIFIC: HUMAN ORGANOIDS MARKET, BY APPLICATION, 2018-2025 (USD MILLION)
  TABLE 116 ASIA PACIFIC: HUMAN ORGANOIDS MARKET, BY USABILITY, 2018-2025 (USD MILLION)
  TABLE 117 ASIA PACIFIC: HUMAN ORGANOIDS MARKET, BY END USER, 2018-2025 (USD MILLION)
           10.4.1 JAPAN
                    10.4.1.1 Growth in biomedical & medical research to support market growth
        TABLE 118 JAPAN: HUMAN LIVER ORGANOIDS MARKET, BY TYPE, 2018-2025 (USD MILLION)
           10.4.2 CHINA
                    10.4.2.1 Healthcare infrastructure improvements to support market growth in China
        TABLE 119 CHINA: NUMBER OF ORGAN TRANSPLANTATION PROCEDURES PERFORMED, 2018
        TABLE 120 CHINA: HUMAN LIVER ORGANOIDS MARKET, BY TYPE, 2018-2025 (USD MILLION)
           10.4.3 INDIA
                    10.4.3.1 Increasing number of transplantation procedures to drive market growth in India
        TABLE 121 INDIA: HUMAN LIVER ORGANOIDS MARKET, BY TYPE, 2018-2025 (USD MILLION)
           10.4.4 AUSTRALIA
                    10.4.4.1 Rising number of solid organ transplantation procedures to support market growth in Australia
        TABLE 122 AUSTRALIA: HUMAN LIVER ORGANOIDS MARKET, BY TYPE, 2018-2025 (USD MILLION)
           10.4.5 SOUTH KOREA
                    10.4.5.1 Government initiatives to introduce medical coverage for transplantation to support market growth in South Korea
        TABLE 123 SOUTH KOREA: HUMAN LIVER ORGANOIDS MARKET, BY TYPE, 2018-2025 (USD MILLION)
           10.4.6 REST OF ASIA PACIFIC
    TABLE 124 ROAPAC: HUMAN LIVER ORGANOIDS MARKET, BY TYPE, 2018-2025 (USD MILLION)
    10.5 LATIN AMERICA
  TABLE 125 LATIN AMERICA: HUMAN ORGANOIDS MARKET, BY COUNTRY, 2018-2025 (USD MILLION)
  TABLE 126 LATIN AMERICA: HUMAN LIVER ORGANOIDS MARKET, BY TYPE, 2018-2025 (USD MILLION)
  TABLE 127 LATIN AMERICA: HUMAN LIVER ORGANOIDS MARKET FOR 2D MODELS, BY TYPE, 2018-2025 (USD MILLION)
  TABLE 128 LATIN AMERICA: HUMAN LIVER ORGANOIDS MARKET FOR 3D MODELS, BY TYPE, 2018-2025 (USD MILLION)
  TABLE 129 LATIN AMERICA: HUMAN ORGANOIDS MARKET, BY APPLICATION, 2018-2025 (USD MILLION)
  TABLE 130 LATIN AMERICA: HUMAN ORGANOIDS MARKET, BY USABILITY, 2018-2025 (USD MILLION)
  TABLE 131 LATIN AMERICA: HUMAN ORGANOIDS MARKET, BY END USER, 2018-2025 (USD MILLION)
           10.5.1 BRAZIL
                    10.5.1.1 Brazil is the largest market for human organoids in Latin America
        TABLE 132 BRAZIL: HUMAN LIVER ORGANOIDS MARKET, BY TYPE, 2018-2025 (USD MILLION)
           10.5.2 MEXICO
                    10.5.2.1 Rising medical tourism to support market growth in Mexico
        TABLE 133 MEXICO: HUMAN LIVER ORGANOIDS MARKET, BY TYPE, 2018-2025 (USD MILLION)
           10.5.3 REST OF LATIN AMERICA
     TABLE 134 ROLATAM: HUMAN LIVER ORGANOIDS MARKET, BY TYPE, 2018-2025 (USD MILLION)
    10.6 MIDDLE EAST & AFRICA
           10.6.1 DEVELOPING HEALTHCARE INFRASTRUCTURE TO PROPEL MARKET GROWTH
     TABLE 135 MIDDLE EAST & AFRICA: HUMAN LIVER ORGANOIDS MARKET, BY TYPE, 2018-2025 (USD MILLION)
     TABLE 136 MIDDLE EAST & AFRICA: HUMAN LIVER ORGANOIDS MARKET FOR 2D MODELS, BY TYPE, 2018-2025 (USD MILLION)
     TABLE 137 MIDDLE EAST & AFRICA: HUMAN LIVER ORGANOIDS MARKET FOR 3D MODELS, BY TYPE, 2018-2025 (USD MILLION)
     TABLE 138 MIDDLE EAST & AFRICA: HUMAN ORGANOIDS MARKET, BY APPLICATION, 2018-2025 (USD MILLION)
     TABLE 139 MIDDLE EAST & AFRICA: HUMAN ORGANOIDS MARKET, BY USABILITY, 2018-2025 (USD MILLION)
     TABLE 140 MIDDLE EAST & AFRICA: HUMAN ORGANOIDS MARKET, BY END USER, 2018-2025 (USD MILLION)

11 COMPETITIVE LANDSCAPE (Page No. - 137)
    11.1 OVERVIEW
  FIGURE 18 KEY DEVELOPMENTS IN THE HUMAN ORGANOIDS MARKET, 2017-2020
    11.2 MARKET SHARE ANALYSIS
  FIGURE 19 HUMAN ORGANOIDS MARKET SHARE, BY KEY PLAYER, 2019
    11.3 COMPETITIVE SCENARIO
           11.3.1 PRODUCT LAUNCHES
     TABLE 141 PRODUCT LAUNCH, 2017-2020
           11.3.2 AGREEMENTS, COLLABORATIONS, & PARTNERSHIPS
     TABLE 142 AGREEMENTS, COLLABORATIONS & PARTNERSHIP, 2017-2020
           11.3.3 MERGERS
     TABLE 143 MERGERS, 2018

12 COMPANY EVALUATION MATRIX AND COMPANY PROFILES (Page No. - 141)
    12.1 COMPANY EVALUATION MATRIX DEFINITION AND METHODOLOGY
           12.1.1 STARS
           12.1.2 EMERGING LEADERS
           12.1.3 PERVASIVE
           12.1.4 PARTICIPANTS
     FIGURE 20 HUMAN ORGANOIDS MARKET: COMPETITIVE LEADERSHIP MAPPING, 2019
    12.2 COMPANY PROFILES
  (Business overview, Products offered & Recent developments)*
           12.2.1 BIOIVT
           12.2.2 CELLINK
     FIGURE 21 CELLINK: COMPANY SNAPSHOT
           12.2.3 CORNING INCORPORATED
     FIGURE 22 CORNING INCORPORATED: COMPANY SNAPSHOT
           12.2.4 CYTES BIOTECHNOLOGIES, S.L.
           12.2.5 HµREL CORPORATION
           12.2.6 INSPHERO
           12.2.7 KALY-CELL
           12.2.8 KIRKSTALL LTD.
           12.2.9 MIMETAS B.V.
           12.2.10 NEUROMICS
           12.2.11 ORGANOVO
           12.2.12 PRIMACYT CELL CULTURE TECHNOLOGY GMBH
           12.2.13 STEMCELL TECHNOLOGIES INC.
           12.2.14 THERMO FISHER SCIENTIFIC
      FIGURE 23 THERMO FISHER SCIENTIFIC: COMPANY SNAPSHOT
           12.2.15 ZENBIO, INC.
      *Details on Business overview, Products offered & Recent developments might not be captured in case of unlisted companies.
    12.3 EMERGING COMPANIES
           12.3.1 BIOPREDIC INTERNATIONAL
           12.3.2 CN BIO INNOVATIONS
           12.3.3 CYPRIO
           12.3.4 EMULATE, INC.
           12.3.5 KERAFAST

13 APPENDIX (Page No. - 166)
    13.1 DISCUSSION GUIDE
    13.2 KNOWLEDGE STORE: MARKETSANDMARKETS' SUBSCRIPTION PORTAL
    13.3 AVAILABLE CUSTOMIZATIONS
    13.4 RELATED REPORTS
    13.5 AUTHOR DETAILS

The study involved four major activities to estimate the current size of the human organoids market. Exhaustive secondary research was carried out to collect information on the market and its different subsegments. The next step was to validate these findings, assumptions, and sizing with industry experts across the value chain through primary research. Top-down and bottom-up approaches were employed to estimate the complete market size. Thereafter, market breakdown and data triangulation procedures were used to estimate the size of segments and subsegments.

Secondary Research 

In the secondary research process, various secondary sources, such as annual reports, press releases & investor presentations of companies, white papers, certified publications, articles by recognized authors, gold-standard & silver-standard websites, regulatory bodies, and databases (such as D&B Hoovers, Bloomberg Business, and Factiva) were referred to in order to identify and collect information for the orthopedic braces and supports market study.

Primary Research 

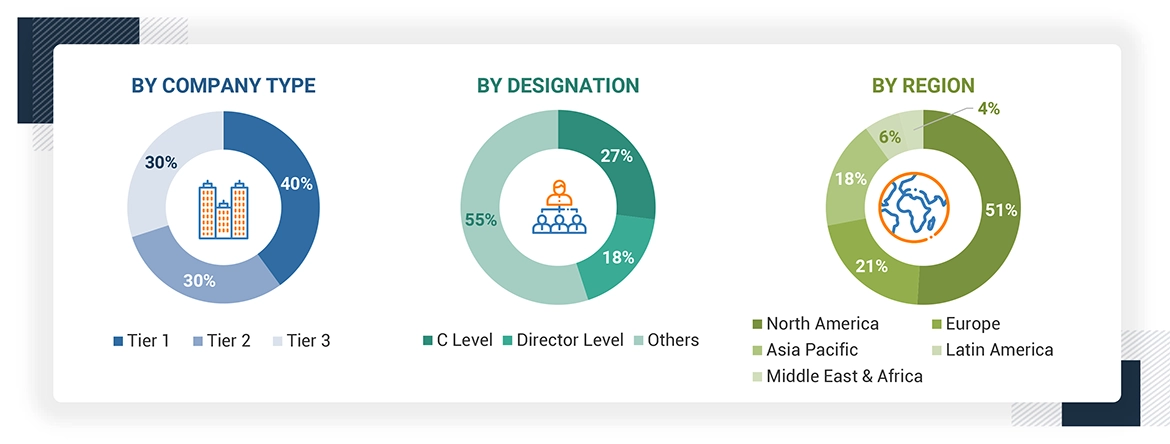
The human organoids market comprises several stakeholders such as  Manufacturers of human organoid products, Healthcare service providers, Manufacturers of pharmaceutical products, Pharmaceutical and biotechnology companies, Clinical research organizations (CROs), Clinical testing laboratories, Public and private research organizations, Research laboratories and academic institutes, Market research and consulting firms The demand side of this market is characterized by the increasing incidence of transplants and technological advancements, and increased funding and public-private investments. Various primary sources from both the supply and demand sides of the market were interviewed to obtain qualitative and quantitative information. The following is the breakdown of primary respondents: 

Human Organoids Market Size

To know about the assumptions considered for the study, download the pdf brochure

Market Size Estimation 

Both top-down and bottom-up approaches were used to estimate and validate the total size of the clinical microbiology market. These methods were also used extensively to estimate the size of various subsegments in the market. The research methodology used to estimate the market size includes the following:

  • The key players in the industry and markets have been identified through extensive secondary research
  • The industry’s supply chain and market size, in terms of value, have been determined through primary and secondary research
  • All percentage shares, splits, and breakdowns have been determined using secondary sources and verified through primary sources

Estimation Of The Human Organoids Market

To know about the assumptions considered for the study, Request for Free Sample Report

Data Triangulation 

After arriving at the overall market size—using the market size estimation processes as explained above—the human organoids market was split into several segments and subsegments. In order to complete the overall market engineering process and arrive at the exact statistics of each market segment and subsegment, data triangulation and market breakdown procedures were employed, wherever applicable. The data was triangulated by studying various factors and trends from both the demand and supply sides in the clinical microbiology industry.

Report Objectives 

  • To define, describe, and forecast the global human organoids market on the basis of product, usability, application, end user, and region
  • To provide detailed information regarding the major factors influencing the market growth (such as drivers, restraints, opportunities, and challenges)
  • To strategically analyze micromarkets1 with respect to individual growth trends, future prospects, and contributions to the overall market
  • To analyze the opportunities in the market for key stakeholders and provide details of the competitive landscape for major market leaders
  • To forecast the size of the market segments with respect to five main regions, namely, North America (the US and Canada), Europe (Germany, the UK, France, Italy, Spain, and Rest of Europe), Asia Pacific (Japan, China, India, Australia, South Korea, and Rest of Asia Pacific), Latin America (Brazil, Mexico, and Rest of Latin America), and the Middle East & Africa
  • To profile the key market players and comprehensively analyze their market shares and core competencies2
  • To track and analyze competitive developments such as mergers and acquisitions, new product developments, partnerships, agreements, collaborations, and expansions in the global human organoids market

Available Customizations 

With the given market data, MarketsandMarkets offers customizations as per the company’s specific needs. The following customization options are available for the human organoids market report:

PRODUCT ANALYSIS

  • Product Matrix, which gives a detailed comparison of the product portfolios of the top five global players

PRODUCT ANALYSIS

  • Further breakdown of the Rest of European market into Poland, Nederland and other European countries (aggregated)

COMPANY INFORMATION

  • Detailed analysis and profiling of additional market players (up to 5 OEMs)
Custom Market Research Services

We will customize the research for you, in case the report listed above does not meet with your exact requirements. Our custom research will comprehensively cover the business information you require to help you arrive at strategic and profitable business decisions.

Request Customization

Instant Answers with GPT - Ask Now!

Ask real questions. Get complete answers !
Report Code
BT 6218
Published ON
Dec, 2020
Choose License Type
BUY NOW
  • SHARE
X
Request Customization
Speak to Analyst
Speak to Analyst
OR FACE-TO-FACE MEETING
PERSONALIZE THIS RESEARCH
  • Triangulate with your Own Data
  • Get Data as per your Format and Definition
  • Gain a Deeper Dive on a Specific Application, Geography, Customer or Competitor
  • Any level of Personalization
REQUEST A FREE CUSTOMIZATION
LET US HELP YOU!
  • What are the Known and Unknown Adjacencies Impacting the Human Organoids Market
  • What will your New Revenue Sources be?
  • Who will be your Top Customer; what will make them switch?
  • Defend your Market Share or Win Competitors
  • Get a Scorecard for Target Partners
CUSTOMIZED WORKSHOP REQUEST
knowledgestore logo

Want to explore hidden markets that can drive new revenue in Human Organoids Market?

Find Hidden Markets
  • Call Us
  • +1-888-600-6441 (Corporate office hours)
  • +1-888-600-6441 (US/Can toll free)
  • +44-800-368-9399 (UK office hours)
CONNECT WITH US
ABOUT TRUST ONLINE
©2024 MarketsandMarkets Research Private Ltd. All rights reserved
DMCA.com Protection Status
Website Feedback