Graphite Market

Report Code CH 5285
Published in Dec, 2024, By MarketsandMarkets™
Download PDF

Choose License Type

Buy Report Now Inquire Before Buying

Graphite Market by Type (Natural, Synthetic), Application (Electrode, Refractory and Foundry, Battery, Friction Products, Lubricants), Purity (High, Low), and Region - Global Forecast to 2030

Updated on : December 17, 2024

Graphite Market Overview

The global graphite market was valued at USD 15.67 billion in 2024 and is projected to reach USD 36.40 billion by 2030, growing at 15.1% cagr from 2024 to 2030. The growth of the graphite market is fed by the increase in adoption rates of electric vehicles and energy storage systems for renewable energy storage throughout the world. Graphite, predominantly used in EV batteries as an anode material, plays a major role in the contribution to the high energy density and efficiency of these batteries. The expansion of renewable energy projects has increased demand and driven consumption for energy storage systems. Graphite is also used extensively in electrode and lining materials, in high-heat applications; thus, it forms a very significant basis of the global steel and aluminum industries. The refractory industry is another major consumer that employs graphite because it has the best resistance to extreme heat conditions among all these materials. Thus, graphite demand keeps surging with the growth witnessed in these various industries. Besides, the development of technologies for graphite extraction and processing improves its available qualities and supplements market growth. This is consecutively acting in combination to drive industrial and technological factors for the graphite market.

Graphite Market

Attractive Opportunities in the Graphite Market

Asia Pacific

Market growth in the Asia Pacific can be attributed to the strong presence of battery manufacturers, battery material producers, and cell fabricators. This robust supply chain, combined with increasing demand for EVs and metals like steel and aluminum, particularly in China, is driving the expansion of the graphite market in the region.

The market growth is due to the high production of HEVs, PHEVs, and EVs, increasing demand for energy storage devices and steel, and rising use of batteries in energy storage applications.

Expansions and product developments are expected to offer lucrative opportunities for market players during the next five years.

The global graphite market is projected to reach USD 36.40 billion by 2030, at a CAGR of 15.1% over the forecast period.

The global graphite market faces a competitive threat from high mining and R&D costs limiting new entrants and innovation.

Global Graphite Market Dynamics

DRIVER: Rising production of electric vehicles (EVs) and renewable energy storage systems

In the last decade, both increased stringency of CO2 emissions regulations and various governmental incentives for sustainability started shifting the focus towards electric vehicles in the automotive world. Driven by rapid sales growth, especially in key target markets of China, Europe, and the US, different forms of electric vehicles, such as BEVs, PHEVs, and HEVs, have become increasingly in vogue. EVs rely on lithium-ion batteries, with a single vehicle requiring approximately 80 kgs of graphite, making the material pivotal in the energy transition. As such, the expansion in battery manufacturing plants across different parts of the world continues to raise demand for flake graphite, one of the principal anode materials. By 2030, more than 215 million EVs will be on the world's highways, and that gives an inkling of how crucial graphite will be to the future of electric mobility and clean energy.

Furthermore, the growing production of energy storage systems promoted by the adoption of renewable energy and electric vehicles boosts the global graphite market depicted. Graphite accounts for an important range of applications in lithium-ion batteries that are made for energy storage purposes, and thus the demand for the mineral has also grown significantly in support of the market growth.

RESTRAINT: Ecological Considerations

As demand for the critical mineral rises across some of the most impacted industries, such as electric vehicle batteries and renewable energy storage devices, the environmental concerns with graphite production will only continue to increase. For example, natural graphite extraction embodies ecosystem destruction, water pollution, and soil contamination. Moreover, graphite mining, especially in the bigger producing countries like China, involves the moving of large amounts of rock, and this often results in the destruction of habitats, loss of biodiversity, and changes in the quality of the water. Chemical processing of natural graphite with reagents that could be linked to water pollution and community harm when not disposed of properly is required for high-purity applications.

In addition, the production of synthetic graphite also has more environmental problems, since it needs to be heated to an extremely high temperature in order for petroleum cokes to be reduced into graphite; this is a very energy-intensive operation emitting huge amounts of greenhouse gases. All these dependencies on fossil fuel-based feedstock and energy-intensive manufacturing go against the green goals of EVs and energy storage solutions. Besides, the waste residues generated during natural and synthetic graphite processing can also increase, further giving rise to disposal problems and degraded environments in the case of no responsible management. These resulting environmental concerns are raising interest in more sustainable practices, increased regulation, and graphite production innovation that will further meet the goals of a low-carbon economy.


OPPORTUNITY: Growth in Renewable Energy Storage

The growth in renewable energy storage technologies is creating significant opportunities for the graphite market, with graphite at the core of various energy storage systems using different chemistries of batteries. It is among the major components of the anode in LiCoO2 batteries, widely used in consumer electronic devices such as laptops and digital cameras. These batteries exhibit very high energy densities in the range of 150-200 Wh/kg, hence finding applications efficiently in portable applications where high specific energy is required. Hence, performance advantages are realized with LiCoO2 batteries, though at the expense of short cycle life and overheat risks-a sure indication that further improvement is in order as far as battery composition and safety are concerned. Graphite plays a role within these batteries underpinning its importance to the wider evolving energy storage landscape as demand rises for dependable, high-performance storage both in consumer electronics and larger systems.

Apart from LiCoO2, other emerging technologies in batteries involve graphite for better performance and capacity in renewable energy storage areas like aluminum-ion and vanadium-based batteries. With power density at 3000 W/kg and graphite on the cathode side, research is being carried out on aluminum-ion batteries with an energy density of 40 Wh/kg for their potential in fast charge/discharge cycling, especially in grid energy storage. Other promising technologies of large-scale grid storage employing graphite cathodes are vanadium-based batteries that offer comparable power densities, ensuring a safe and cost-effective option to stabilize renewable energy grids. The dependence of these advanced batteries on graphite cements its position as a critical material in the expansion of renewable energy infrastructure that enables the global transition to sustainable energy storage systems.

CHALLENGES: Carbon Nanomaterials as Potential Substitutes

The possible replacement of graphite with Carbon Nanotubes (CNT) is thus the threat to the graphite market, especially in those industries depending on value-added materials. Carbon nanotubes have immense strength, as strong as steel material, which formulation and usage are very essential for aerospace because of the demand for lightweight with strong material. Besides that, CNTs are highly electrically and thermally conductive, hence finding applications in the replacement of traditional conductive materials like copper and silver in electronics and electrical components. All this could very well replace graphite in various applications, particularly because of the demand for miniaturization and high-performance electronics.

Energy storage applications also have potential for CNTs, especially in supercapacitors where, in the near term, CNTs may carve out a niche market in competition with graphite-based technologies. Another aspect is that by acting as reinforcement, their capability to enhance mechanical properties in polymers and concrete may lead to a reduction of consumption in some construction and composite applications. Graphite, however, also stands to benefit from the trends mentioned above, especially in areas of energy applications. Besides, in most markets, CNTs are not considered to be a replacement for graphite. While CNTs do have some cost, scalability, and technological maturity issues, further research is still needed to fully establish it as a replacement for graphite in all applications.

Global Graphite Market Ecosystem Analysis

The graphite ecosystem consists of major extraction and processing companies are Northern Graphite, Panasonic, Tesla, SGL Carbon, AMG Graphite. The manufacturers of graphite like Tokai Carbon, SGL Carbon, Imerys, etc., collaborate with end-use industries, including BYD, Tesla, Panasonic, Samsung, Foxconn, to help the supply chain meet the growing demands of the automotive and electronics sectors.

Graphite Market
 

Natural graphite segment to record fastest growth during forecast period in terms of value

Natural graphite is dominating the global graphite market outright due to its wide availability and cost-effectiveness for a wide range of applications. Natural graphite, mined directly from mines, is barely processed in comparison with its synthetic counterparts, hence making the material economically feasible. Its high thermal conductivity and lubricating properties make the material ideal for use in a variety of applications, from refractory materials to batteries, and then to steel production. This is partly because the strongly growing demand for lithium-ion batteries, driven especially by the electric vehicle sector, still depends on natural graphite as one of the critical anode materials. Besides this, natural graphite has a smaller environmental footprint compared to synthetic graphite, which follows the trend of sustainability. Major producing countries, like China, have enormous resources and advanced mining capabilities to meet stable supply chains. Further, performance increases because of superior crystallinity by natural graphite for high-end applications. Its leading position is strongly consolidated, since the product can be able to meet both industrial and technological emerging demands. Further innovations in fields such as purification and material modification further expand its potential, reinforcing its market lead.

Electrode segment to record highest CAGR during forecast period

The segment of electrodes accounts for the dominance in global graphite market because of its fundamental importance in energy-intensive applications, particularly in the manufacture of steel through electric arc furnaces and in the production of non-ferrous metals. Because graphite electrodes are highly heat-conductive, they can carry high currents and operate under thermal shock without breaking down; therefore, they are vital in sustaining the high-temperature operations of EAFs. The growing demand for the recycling of steel and decarbonization of metals further accelerates the adoption rate of graphite electrodes. Also, the fast-track industrialization going on in developing countries has given birth to EAF-based plants, purveying more and more consumption to graphite electrodes. The growing battery sector has synthetic graphite electrodes in its production processes and hence has increased demand. Graphite, on account of its longer life along with cost-effectiveness, widens its appeal in many fields dealing with electrodes. Its central position in the graphite market is underlined in light of increasing global consumption of electricity and new technological developments in electrodes.

High Purity graphite segment to hold largest share during the forecast period

High-purity graphite takes the leading share in the global market of graphite due to its advanced features and application in major industries. Superconductive, heat-stable, and chemical-resistant, it turns out to be irreplaceable in such revolutionary technologies as Li-ion batteries, fuel cells, and atomic reactors. The recent boom in the EV sector has further accelerated demand as high-purity graphite has become highly crucial for anodes in electric vehicle batteries. With applications in high-performance coatings, high-performance lubricants, and aerospace materials, it also contributes to its significant market standing. Severe quality standards in electronics and energy storage systems also make the demand for ultra-pure forms comparatively high. Significantly, new green energy technologies fall into a range of highly efficient and reliable materials that add to the most vital market position it has. In addition, progress in manufacturing synthetic graphite provides more available amounts and tailored properties. All these factors together have endowed high-purity graphite with the leading market position.

Asia Pacific to dominate graphite market during forecast period

The Asia-Pacific holds the largest share in the global graphite market due to its strong industrial base and an increase in demand from emerging economies such as China, India, and South Korea. The region is a global battery manufacturing hub, driven by the fast-tracking expansion of electric car production that drives demand for graphite in lithium-ion batteries.

For example, China, being the largest graphite producer and consumer in the world, possesses a strategic position due to large reserves combined with advanced capacity for processing. Fast electronic growth in the Asia-Pacific region drives demand for synthetic graphite in semiconductors and other high-tech applications. Apart from that, graphite is used as electrodes in electric arc furnaces for the steel sector.

The favorable government regulations, huge investments in renewable energy, and emphasis on green technologies contribute towards the surge in graphite demand. Moreover, the rise in urbanization and industrialization in developing countries leads to surging demand for construction materials and lubricants. Due to its low production cost and firmly established supply chains, Asia-Pacific is the leading region in both production and consumption.

HIGHEST CAGR MARKET IN 2023
CHINA FASTEST GROWING MARKET IN THE REGION
Graphite Market

Recent Developments of Graphite Market

  • In July 2024, the AMG subsidiary Graphit Kropfmühl and BASF signed a ground-breaking agreement on product carbon footprint reduction. Under the agreement, BASF will provide renewable energy certificates for Graphit Kropfmühl's production site based in Hauzenberg, Germany. BASF will use the reduced PCF graphite to manufacture Neopor with a reduced product carbon footprint.
  • In March 2023, SGL Carbon signed a cooperation agreement to Supply Key Graphite Components for Wolfspeed Silicon Carbide Production Facilities. It is a supply agreement. SGL Carbon will be supplying graphite components to the global leader in Silicon Carbide technology, Wolfspeed, for its US production facilities.
  • In October 2022, SGL Carbon will significantly expand capacities for producing graphite products for the semiconductor industry at the sites Shanghai (China), St. Marys (USA), and Meitingen (Germany). In the North American site in St. Marys and the Chinese site in Shanghai, capacities for purification and for high-precision, computer-controlled processing of graphite components and felts are being extended. At Meitingen, Germany, a new plant for producing carbonized and graphitized soft felt is currently under construction.
  • In May 2022, Resonac Holdings Co., Ltd. agreed on an absorption-type company split with its wholly owned subsidiary, Shinshu Showa K.K., over the graphite electrode business. The content of the company split and utilization for the common ground of global operation is globalization of the controlling company by Shinshu Showa. It will accelerate decision-making and further stabilize, optimize, and strengthen our graphite electrode business.

Key Market Players

Want to explore hidden markets that can drive new revenue in Graphite Market?

Scope of the Report

Report Metric Details
Market size available for years 2020-2030
Base Year Considered 2023
Forecast period 2024-2030
Forecast units Value (USD Billion and USD Million) and Volume (Kiloton)
Segments covered Graphite Type, Graphite Purity, Application, End Use Industry and Region
Geographies covered Asia Pacific, North America, Europe, Middle East & Africa and South America


Key Questions Addressed by the Report

What is graphite?
Graphite is an allotrope of carbon and is a semimetal. Graphite has properties such as flexibility; it is highly refractory and a good conductor of thermal and electrical energy. Graphite, at ordinary conditions, is said to be the most stable form of carbon. Some uses of graphite in industries involve steelmaking, refractory, foundry operations, lubricants, and brake linings.
What are the different types of graphite?
Graphite is mainly classified in two types: Natural Graphite, Synthetic Graphite. Natural Graphite: A native form of carbon which is available in flake, amorphous, and vein forms since it is found in mines. It finds applications in batteries, refractories, and lubricants. Synthetic Graphite: The artificial graphite that is made from petroleum by-products at very high temperatures has its application in electrodes, batteries, and other specialized uses in industry.
Who are the key players in the global graphite market?
AMG (Germany), Asbury Carbons (US), Grafitbergbau Kaisersberg GmbH (Austria), BTR New Material Group Co.,Ltd. (China), Imerys (France), Nacional de Grafite (Brazil), SGL Carbon (Germany), Mineral Commodities Ltd. (Australia), Tirupathi Carbons & Chemicals Pvt Ltd (India), Resonac Holdings Corporation(Japan), Toyo Tanso Co.,Ltd. (Japan), Mersen Property (France), Northern Graphite(Canada), Novonix Limited (Australia), Shanshan Co (China), Hebei Kuntian New Energy Co. Ltd.(China), Syrah Resources Limited(Australia), Talga Group (Australia), Graphite India Limited (India), and others are the key players.
What do market players adopt the growth strategies?
The market leaders adopt various strategies such as new collaborations, expansions, and partnerships to increase their competitiveness. This helps them stay firm and increase their influence in the fluctuating graphite market.
What is the key driver of the graphite market?
The primary driver of the graphite market is the increasing number of electric vehicles.
Which region is projected to exhibit the highest CAGR in the graphite market during the forecast period?
Asia Pacific is expected to exhibit the highest CAGR during the forecast period.


Personalize This Research

  • Triangulate with your Own Data
  • Get Data as per your Format and Definition
  • Gain a Deeper Dive on a Specific Application, Geography, Customer or Competitor
  • Any level of Personalization
Request A Free Customisation

Let Us Help You

  • What are the Known and Unknown Adjacencies Impacting the Graphite Market
  • What will your New Revenue Sources be?
  • Who will be your Top Customer; what will make them switch?
  • Defend your Market Share or Win Competitors
  • Get a Scorecard for Target Partners
Customized Workshop Request

Table of Contents

Exclusive indicates content/data unique to MarketsandMarkets and not available with any competitors.

TITLE
PAGE NO
INTRODUCTION
27
RESEARCH METHODOLOGY
32
EXECUTIVE SUMMARY
41
PREMIUM INSIGHTS
45
MARKET OVERVIEW
47
  • 5.1 MARKET DYNAMICS
    DRIVERS
    - Growing electric vehicle sales
    - Booming steel and aluminum industries
    - Decarbonization of economy
    RESTRAINTS
    - Supply chain volatility and resource constraints
    - Environmental concerns about graphite production
    - High production cost of synthetic graphite
    OPPORTUNITIES
    - Expansion of renewable energy storage technologies
    - Emergence of graphene-based applications
    CHALLENGES
    - Rapid adoption of silicon-based anodes in battery technology
    - Potential substitution of graphite by carbon nanomaterials
  • 5.2 PORTER’S FIVE FORCES ANALYSIS
    THREAT OF SUBSTITUTES
    THREAT OF NEW ENTRANTS
    BARGAINING POWER OF BUYERS
    BARGAINING POWER OF SUPPLIERS
    INTENSITY OF COMPETITIVE RIVALRY
  • 5.3 VALUE CHAIN ANALYSIS
  • 5.4 ECOSYSTEM ANALYSIS
  • 5.5 TRENDS AND DISRUPTIONS IMPACTING CUSTOMER BUSINESS
  • 5.6 CASE STUDY ANALYSIS
    TIRUPATI GRAPHITE DIGITIZES FLAKE GRAPHITE VALUE CHAIN FOR IMPROVED DECISION-MAKING ACROSS OPERATIONS
    SYRAH RESOURCES PROVIDES MINING COMPANY WITH INSIGHTS ON ACHIEVING GROWTH THROUGH SUSTAINABLE INITIATIVES
    DEPLOYMENT OF SPICER GRAPH LITE DRIVESHAFT TO SIMPLIFY ASSEMBLY IN AUTOMOTIVE AND AEROSPACE INDUSTRIES
  • 5.7 PATENT ANALYSIS
  • 5.8 REGULATORY LANDSCAPE
    REGULATORY BODIES, GOVERNMENT AGENCIES, AND OTHER ORGANIZATIONS
    REGULATIONS ON ELECTRIC VEHICLE BATTERIES
    EUROPE AND US REGULATIONS ON LITHIUM-ION BATTERY PRODUCTION
    REGULATIONS ON BATTERIES AND ACCUMULATORS
    REGULATIONS ON TRANSPORT OF LITHIUM-ION BATTERIES
  • 5.9 TECHNOLOGY ANALYSIS
    KEY TECHNOLOGIES
    - Electrothermal treatment and purification
    - Graphitization and heat treatment
    COMPLEMENTARY TECHNOLOGIES
    - Spheroidization of graphite
    - Air classification
    ADJACENT TECHNOLOGIES
    - Chemical vapor deposition
    - Bioleaching
  • 5.10 TRADE ANALYSIS
    IMPORT DATA (HS CODE 2504)
    EXPORT DATA (HS CODE 2504)
  • 5.11 KEY CONFERENCES AND EVENTS, 2024–2025
  • 5.12 PRICING ANALYSIS
  • 5.13 GLOBAL MACROECONOMIC OUTLOOK
    GDP
    FOREIGN DIRECT INVESTMENT
  • 5.14 INVESTMENT AND FUNDING SCENARIO
  • 5.15 KEY STAKEHOLDERS AND BUYING CRITERIA
    KEY STAKEHOLDERS IN BUYING PROCESS
    BUYING CRITERIA
GRAPHITE MARKET, BY APPLICATION
87
  • 6.1 INTRODUCTION
  • 6.2 ELECTRODE
    INCREASED ADOPTION OF GRAPHITE ELECTRODES IN PRODUCTION OF ELECTRIC ARC FURNACES TO DRIVE MARKET
  • 6.3 REFRACTORY & FOUNDRY
    STEELMAKING AND OTHER HIGH-TEMPERATURE INDUSTRIAL PROCESSES TO DRIVE ADOPTION OF GRAPHITE
  • 6.4 BATTERY
    SURGE IN DEMAND FOR ELECTRIC VEHICLES AND ADVANCEMENTS IN RECYCLING TECHNOLOGY TO PROPEL GROWTH
  • 6.5 FRICTION PRODUCT
    FOCUS OF AUTOMOTIVE INDUSTRY ON SAFETY AND PERFORMANCE TO PROPEL GROWTH
  • 6.6 LUBRICANT
    NEED FOR ADVANCED LUBRICANTS IN HIGH-TEMPERATURE, HIGH-PRESSURE ENVIRONMENTS TO DRIVE MARKET
  • 6.7 OTHER APPLICATIONS
GRAPHITE MARKET, BY PURITY
100
  • 7.1 INTRODUCTION
  • 7.2 HIGH PURITY
    DEMAND FOR PRECISION AND PERFORMANCE ACROSS INDUSTRIES TO BOOST GROWTH
  • 7.3 LOW PURITY
    NEED TO POWER COST-EFFECTIVE INDUSTRIAL SOLUTIONS TO DRIVE MARKET
GRAPHITE MARKET, BY TYPE
103
  • 8.1 INTRODUCTION
  • 8.2 NATURAL GRAPHITE
    VERSATILE APPLICATIONS OF NATURAL GRAPHITE TO DRIVE ITS DEMAND IN BATTERIES
    FLAKE
    AMORPHOUS
    VEIN
  • 8.3 SYNTHETIC GRAPHITE
    EXTENSIVE USE OF LITHIUM BATTERIES IN ELECTRIC VEHICLES TO DRIVE MARKET
    GRAPHITE ELECTRODE
    CARBON FIBER
    GRAPHITE BLOCK
    GRAPHITE POWDER
    OTHERS
GRAPHITE MARKET, BY END-USE INDUSTRY
117
  • 9.1 INTRODUCTION
  • 9.2 METALLURGY
  • 9.3 AUTOMOTIVE
  • 9.4 ELECTRONICS
  • 9.5 OTHER END-USE INDUSTRIES
GRAPHITE MARKET, BY REGION
119
  • 10.1 INTRODUCTION
  • 10.2 ASIA PACIFIC
    CHINA
    - Expansion of EV battery production to boost growth
    INDIA
    - Rising demand for graphite from infrastructure, energy, and manufacturing sectors to drive market
    JAPAN
    - Government policies promoting green technologies to propel demand
    SOUTH KOREA
    - Strategic focus on EV battery production and technological innovation to boost growth
    AUSTRALIA & NEW ZEALAND
    - Emphasis on sustainable mining to drive growth
    REST OF ASIA PACIFIC
  • 10.3 NORTH AMERICA
    US
    - Booming automotive industry to drive market
    CANADA
    - Strategic government initiatives to propel market
    MEXICO
    - Shift toward electromobility to drive market
  • 10.4 EUROPE
    GERMANY
    - Presence of key battery and EV manufacturers to propel market
    UK
    - Transition to renewable energy and green transportation to drive market
    FRANCE
    - Adoption of environment-friendly vehicles to boost market
    ITALY
    - Domestic focus on grid stabilization through energy storage projects to propel market
    SPAIN
    - Government’s strong commitment to green energy to drive growth
    REST OF EUROPE
  • 10.5 SOUTH AMERICA
    BRAZIL
    - Strategic investments and growing demand from EVs to boost growth
    CHILE
    - Country’s role in lithium-ion battery supply chain to boost market
    ARGENTINA
    - Abundant mineral resources, government-backed initiatives, and international partnerships to propel growth
    REST OF SOUTH AMERICA
  • 10.6 MIDDLE EAST & AFRICA
    GCC COUNTRIES
    - SAUDI ARABIA
    - UAE
    - Rest of GCC Countries
    - SOUTH AFRICA
    REST OF MIDDLE EAST & AFRICA
COMPETITIVE LANDSCAPE
208
  • 11.1 INTRODUCTION
  • 11.2 KEY PLAYER STRATEGIES/RIGHT TO WIN, 2020–2024
  • 11.3 REVENUE ANALYSIS, 2019–2023
  • 11.4 MARKET SHARE ANALYSIS, 2023
  • 11.5 COMPANY EVALUATION MATRIX: KEY PLAYERS, 2023
    STARS
    EMERGING LEADERS
    PERVASIVE PLAYERS
    PARTICIPANTS
    COMPANY FOOTPRINT
    - Company footprint
    - Type footprint
    - Purity footprint
    - Application footprint
    - End-use industry footprint
    - Region footprint
  • 11.6 COMPANY EVALUATION MATRIX: START-UPS/SMES, 2023
    PROGRESSIVE COMPANIES
    RESPONSIVE COMPANIES
    DYNAMIC COMPANIES
    STARTING BLOCKS
    COMPETITIVE BENCHMARKING
    - List of start-ups/SMEs
    - Competitive benchmarking of start-ups/SMEs
  • 11.7 BRAND/PRODUCT COMPARISON
  • 11.8 COMPANY VALUATION AND FINANCIAL METRICS
  • 11.9 COMPETITIVE SCENARIO
    DEALS
    EXPANSIONS
COMPANY PROFILES
228
  • 12.1 KEY PLAYERS
    SHANSHAN CO
    - Business overview
    - Products offered
    - MnM view
    SGL CARBON
    - Business overview
    - Products offered
    - Recent developments
    - MnM view
    RESONAC HOLDINGS CORPORATION
    - Business overview
    - Products offered
    - Recent developments
    - MnM view
    GRAFTECH INTERNATIONAL
    - Business overview
    - Products offered
    - Recent developments
    - MnM view
    IMERYS
    - Business overview
    - Products offered
    - MnM view
    AMG
    - Business overview
    - Products offered
    - Recent developments
    ASBURY CARBONS
    - Business overview
    - Products offered
    - Recent developments
    GRAFITBERGBAU KAISERSBERG GMBH
    - Business overview
    - Products offered
    BTR NEW MATERIAL GROUP CO., LTD.
    - Business overview
    - Products offered
    - Recent developments
    NACIONAL DE GRAFITE
    - Business overview
    - Products offered
    MINERAL COMMODITIES LTD.
    - Business overview
    - Products offered
    - Recent developments
    TOKAI CARBON CO., LTD
    - Business overview
    - Products offered
    - Recent developments
    TOYO TANSO CO., LTD.
    - Business overview
    - Products offered
    MERSEN PROPERTY
    - Business overview
    - Products offered
    GRAPHITE INDIA LIMITED
    - Business overview
    - Products offered
    SYRAH RESOURCES LIMITED
    - Business overview
    - Products offered
    ECOGRAF
    - Business overview
    - Products offered
  • 12.2 OTHER PLAYERS
    TIRUPATI CARBONS & CHEMICALS PVT LTD
    NORTHERN GRAPHITE
    NOVONIX LIMITED
    TALGA GROUP
    HEBEI KUNTIAN NEW ENERGY CO. LTD.
    ZENTEK LTD.
    NIPPON CARBON CO., LTD.
    POCO
    HEG LIMITED
    PINGDINGSHAN ORIENTAL CARBON CO., LTD.
ADJACENT AND RELATED MARKETS
280
  • 13.1 INTRODUCTION
  • 13.2 LIMITATIONS
  • 13.3 INTERCONNECTED MARKETS
  • 13.4 LITHIUM-ION BATTERY MARKET
    MARKET DEFINITION
    MARKET OVERVIEW
    LITHIUM-ION BATTERY MARKET, BY VOLTAGE
  • 13.5 LOW
    ONGOING RESEARCH AND DEVELOPMENT TO IMPROVE BATTERY PERFORMANCE TO DRIVE MARKET
  • 13.6 MEDIUM
    RISING ADOPTION OF SOLAR ENERGY SYSTEMS TO DRIVE MARKET
  • 13.7 HIGH
    INCREASING DEMAND FROM MARINE AND MILITARY SECTORS TO DRIVE MARKET
APPENDIX
283
  • 14.1 DISCUSSION GUIDE
  • 14.2 KNOWLEDGESTORE: MARKETSANDMARKETS’ SUBSCRIPTION PORTAL
  • 14.3 CUSTOMIZATION OPTIONS
  • 14.4 RELATED REPORTS
  • 14.5 AUTHOR DETAILS
LIST OF TABLES
 
  • TABLE 1 GRAPHITE MARKET OVERVIEW
  • TABLE 2 IMPACT OF PORTER’S FIVE FORCES
  • TABLE 3 ROLE OF COMPANIES IN ECOSYSTEM
  • TABLE 4 PATENT ANALYSIS
  • TABLE 5 NORTH AMERICA: REGULATORY BODIES, GOVERNMENT AGENCIES, AND OTHER ORGANIZATIONS
  • TABLE 6 EUROPE: REGULATORY BODIES, GOVERNMENT AGENCIES, AND OTHER ORGANIZATIONS
  • TABLE 7 ASIA PACIFIC: REGULATORY BODIES, GOVERNMENT AGENCIES, AND OTHER ORGANIZATIONS
  • TABLE 8 REGULATIONS/VOLUNTARY PROCEDURES FOR EV BATTERY PERFORMANCE
  • TABLE 9 REGULATIONS/VOLUNTARY PROCEDURES FOR EV BATTERY DURABILITY
  • TABLE 10 REGULATIONS/VOLUNTARY PROCEDURES FOR EV BATTERY SAFETY
  • TABLE 11 REGULATIONS/VOLUNTARY PROCEDURES FOR EV BATTERY RECYCLING
  • TABLE 12 IMPORT DATA FOR HS CODE 2504, BY COUNTRY, 2019–2023 (USD THOUSAND)
  • TABLE 13 EXPORT DATA FOR HS CODE 2504, BY COUNTRY, 2019–2023 (USD THOUSAND)
  • TABLE 14 KEY CONFERENCES AND EVENTS, 2024–2025
  • TABLE 15 AVERAGE SELLING PRICE OF GRAPHITE, BY TYPE, 2020–2023 (USD/TON)
  • TABLE 16 AVERAGE SELLING PRICE OF NATURAL GRAPHITE, BY FORM, 2020–2023 (USD/TON)
  • TABLE 17 AVERAGE SELLING PRICE OF GRAPHITE OFFERED BY KEY PLAYERS, 2023 (USD/TON)
  • TABLE 18 AVERAGE SELLING PRICE OF GRAPHITE, BY REGION, 2020–2023 (USD/TON)
  • TABLE 19 REAL GDP GROWTH, BY COUNTRY
  • TABLE 20 UNEMPLOYMENT RATE, BY COUNTRY
  • TABLE 21 INFLATION RATE, BY COUNTRY
  • TABLE 22 FOREIGN DIRECT INVESTMENT
  • TABLE 23 INFLUENCE OF STAKEHOLDERS ON BUYING PROCESS FOR TOP THREE APPLICATIONS (%)
  • TABLE 24 KEY BUYING CRITERIA FOR TOP THREE APPLICATIONS
  • TABLE 25 GRAPHITE MARKET, BY APPLICATION, 2020–2023 (USD MILLION)
  • TABLE 26 GRAPHITE MARKET, BY APPLICATION, 2024–2030 (USD MILLION)
  • TABLE 27 GRAPHITE MARKET, BY APPLICATION, 2020–2023 (KILOTON)
  • TABLE 28 GRAPHITE MARKET, BY APPLICATION, 2024–2030 (KILOTON)
  • TABLE 29 ELECTRODE: GRAPHITE MARKET, BY REGION, 2020–2023 (USD MILLION)
  • TABLE 30 ELECTRODE: GRAPHITE MARKET, BY REGION, 2024–2030 (USD MILLION)
  • TABLE 31 ELECTRODE: GRAPHITE MARKET, BY REGION, 2020–2023 (KILOTON)
  • TABLE 32 ELECTRODE: GRAPHITE MARKET, BY REGION, 2024–2030 (KILOTON)
  • TABLE 33 REFRACTORY & FOUNDRY: GRAPHITE MARKET, BY REGION, 2020–2023 (USD MILLION)
  • TABLE 34 REFRACTORY & FOUNDRY: GRAPHITE MARKET, BY REGION, 2024–2030 (USD MILLION)
  • TABLE 35 REFRACTORY & FOUNDRY: GRAPHITE MARKET, BY REGION, 2020–2023 (KILOTON)
  • TABLE 36 REFRACTORY & FOUNDRY: GRAPHITE MARKET, BY REGION, 2024–2030 (KILOTON)
  • TABLE 37 BATTERY: GRAPHITE MARKET, BY REGION, 2020–2023 (USD MILLION)
  • TABLE 38 BATTERY: GRAPHITE MARKET, BY REGION, 2024–2030 (USD MILLION)
  • TABLE 39 BATTERY: GRAPHITE MARKET, BY REGION, 2020–2023 (KILOTON)
  • TABLE 40 BATTERY: GRAPHITE MARKET, BY REGION, 2024–2030 (KILOTON)
  • TABLE 41 FRICTION PRODUCT: GRAPHITE MARKET, BY REGION, 2020–2023 (USD MILLION)
  • TABLE 42 FRICTION PRODUCT: GRAPHITE MARKET, BY REGION, 2024–2030 (USD MILLION)
  • TABLE 43 FRICTION PRODUCT: GRAPHITE MARKET, BY REGION, 2020–2023 (KILOTON)
  • TABLE 44 FRICTION PRODUCT: GRAPHITE MARKET, BY REGION, 2024–2030 (KILOTON)
  • TABLE 45 LUBRICANT: GRAPHITE MARKET, BY REGION, 2020–2023 (USD MILLION)
  • TABLE 46 LUBRICANT: GRAPHITE MARKET, BY REGION, 2024–2030 (USD MILLION)
  • TABLE 47 LUBRICANT: GRAPHITE MARKET, BY REGION, 2020–2023 (KILOTON)
  • TABLE 48 LUBRICANT: GRAPHITE MARKET, BY REGION, 2024–2030 (KILOTON)
  • TABLE 49 OTHER APPLICATIONS: GRAPHITE MARKET, BY REGION, 2020–2023 (USD MILLION)
  • TABLE 50 OTHER APPLICATIONS: GRAPHITE MARKET, BY REGION, 2024–2030 (USD MILLION)
  • TABLE 51 OTHER APPLICATIONS: GRAPHITE MARKET, BY REGION, 2020–2023 (KILOTON)
  • TABLE 52 OTHER APPLICATIONS: GRAPHITE MARKET, BY REGION, 2024–2030 (KILOTON)
  • TABLE 53 GRAPHITE MARKET, BY PURITY, 2020–2023 (KILOTON)
  • TABLE 54 GRAPHITE MARKET, BY PURITY, 2024–2030 (KILOTON)
  • TABLE 55 GRAPHITE MARKET, BY TYPE, 2020–2023 (USD MILLION)
  • TABLE 56 GRAPHITE MARKET, BY TYPE, 2024–2030 (USD MILLION)
  • TABLE 57 GRAPHITE MARKET, BY TYPE, 2020–2023 (KILOTON)
  • TABLE 58 GRAPHITE MARKET, BY TYPE, 2024–2030 (KILOTON)
  • TABLE 59 NATURAL GRAPHITE MARKET, BY REGION, 2020–2023 (USD MILLION)
  • TABLE 60 NATURAL GRAPHITE MARKET, BY REGION, 2024–2030 (USD MILLION)
  • TABLE 61 NATURAL GRAPHITE MARKET, BY REGION, 2020–2023 (KILOTON)
  • TABLE 62 NATURAL GRAPHITE MARKET, BY REGION, 2024–2030 (KILOTON)
  • TABLE 63 NATURAL GRAPHITE MARKET, BY FORM, 2020–2023 (USD MILLION)
  • TABLE 64 NATURAL GRAPHITE MARKET, BY FORM, 2024–2030 (USD MILLION)
  • TABLE 65 NATURAL GRAPHITE MARKET, BY FORM, 2020–2023 (KILOTON)
  • TABLE 66 NATURAL GRAPHITE MARKET, BY FORM, 2024–2030 (KILOTON)
  • TABLE 67 FLAKE: GRAPHITE MARKET, BY REGION, 2020–2023 (USD MILLION)
  • TABLE 68 FLAKE: GRAPHITE MARKET, BY REGION, 2024–2030 (USD MILLION)
  • TABLE 69 FLAKE: GRAPHITE MARKET, BY REGION, 2020–2023 (KILOTON)
  • TABLE 70 FLAKE: GRAPHITE MARKET, BY REGION, 2024–2030 (KILOTON)
  • TABLE 71 AMORPHOUS: GRAPHITE MARKET, BY REGION, 2020–2023 (USD MILLION)
  • TABLE 72 AMORPHOUS: GRAPHITE MARKET, BY REGION, 2024–2030 (USD MILLION)
  • TABLE 73 AMORPHOUS: GRAPHITE MARKET, BY REGION, 2020–2023 (KILOTON)
  • TABLE 74 AMORPHOUS: GRAPHITE MARKET, BY REGION, 2024–2030 (KILOTON)
  • TABLE 75 VEIN: GRAPHITE MARKET, BY REGION, 2020–2023 (USD MILLION)
  • TABLE 76 VEIN: GRAPHITE MARKET, BY REGION, 2024–2030 (USD MILLION)
  • TABLE 77 VEIN: GRAPHITE MARKET, BY REGION, 2020–2023 (KILOTON)
  • TABLE 78 VEIN: GRAPHITE MARKET, BY REGION, 2024–2030 (KILOTON)
  • TABLE 79 SYNTHETIC GRAPHITE MARKET, BY REGION, 2020–2023 (USD MILLION)
  • TABLE 80 SYNTHETIC GRAPHITE MARKET, BY REGION, 2024–2030 (USD MILLION)
  • TABLE 81 SYNTHETIC GRAPHITE MARKET, BY REGION, 2020–2023 (KILOTON)
  • TABLE 82 SYNTHETIC GRAPHITE MARKET, BY REGION, 2024–2030 (KILOTON)
  • TABLE 83 GRAPHITE MARKET, BY REGION, 2020–2023 (USD MILLION)
  • TABLE 84 GRAPHITE MARKET, BY REGION, 2024–2030 (USD MILLION)
  • TABLE 85 GRAPHITE MARKET, BY REGION, 2020–2023 (KILOTON)
  • TABLE 86 GRAPHITE MARKET, BY REGION, 2024–2030 (KILOTON)
  • TABLE 87 ASIA PACIFIC: GRAPHITE MARKET, BY COUNTRY, 2020–2023 (USD MILLION)
  • TABLE 88 ASIA PACIFIC: GRAPHITE MARKET, BY COUNTRY, 2024–2030 (USD MILLION)
  • TABLE 89 ASIA PACIFIC: GRAPHITE MARKET, BY COUNTRY, 2020–2023 (KILOTON)
  • TABLE 90 ASIA PACIFIC: GRAPHITE MARKET, BY COUNTRY, 2024–2030 (KILOTON)
  • TABLE 91 ASIA PACIFIC: GRAPHITE MARKET, BY TYPE, 2020–2023 (USD MILLION)
  • TABLE 92 ASIA PACIFIC: GRAPHITE MARKET, BY TYPE, 2024–2030 (USD MILLION)
  • TABLE 93 ASIA PACIFIC: GRAPHITE MARKET, BY TYPE, 2020–2023 (KILOTON)
  • TABLE 94 ASIA PACIFIC: GRAPHITE MARKET, BY TYPE, 2024–2030 (KILOTON)
  • TABLE 95 ASIA PACIFIC: NATURAL GRAPHITE MARKET, BY FORM, 2020–2023 (USD MILLION)
  • TABLE 96 ASIA PACIFIC: NATURAL GRAPHITE MARKET, BY FORM, 2024–2030 (USD MILLION)
  • TABLE 97 ASIA PACIFIC: NATURAL GRAPHITE MARKET, BY FORM, 2020–2023 (KILOTON)
  • TABLE 98 ASIA PACIFIC: NATURAL GRAPHITE MARKET, BY FORM, 2024–2030 (KILOTON)
  • TABLE 99 ASIA PACIFIC: GRAPHITE MARKET, BY APPLICATION, 2020–2023 (USD MILLION)
  • TABLE 100 ASIA PACIFIC: GRAPHITE MARKET, BY APPLICATION, 2024–2030 (USD MILLION)
  • TABLE 101 ASIA PACIFIC: GRAPHITE MARKET, BY APPLICATION, 2020–2023 (KILOTON)
  • TABLE 102 ASIA PACIFIC: GRAPHITE MARKET, BY APPLICATION, 2024–2030 (KILOTON)
  • TABLE 103 CHINA: GRAPHITE MARKET, BY TYPE, 2020–2023 (USD MILLION)
  • TABLE 104 CHINA: GRAPHITE MARKET, BY TYPE, 2024–2030 (USD MILLION)
  • TABLE 105 CHINA: GRAPHITE MARKET, BY TYPE, 2020–2023 (KILOTON)
  • TABLE 106 CHINA: GRAPHITE MARKET, BY TYPE, 2024–2030 (KILOTON)
  • TABLE 107 CHINA: NATURAL GRAPHITE MARKET, BY FORM, 2020–2023 (USD MILLION)
  • TABLE 108 CHINA: NATURAL GRAPHITE MARKET, BY FORM, 2024–2030 (USD MILLION)
  • TABLE 109 CHINA: NATURAL GRAPHITE MARKET, BY FORM, 2020–2023 (KILOTON)
  • TABLE 110 CHINA: NATURAL GRAPHITE MARKET, BY FORM, 2024–2030 (KILOTON)
  • TABLE 111 INDIA: GRAPHITE MARKET, BY TYPE, 2020–2023 (USD MILLION)
  • TABLE 112 INDIA: GRAPHITE MARKET, BY TYPE, 2024–2030 (USD MILLION)
  • TABLE 113 INDIA: GRAPHITE MARKET, BY TYPE, 2020–2023 (KILOTON)
  • TABLE 114 INDIA: GRAPHITE MARKET, BY TYPE, 2024–2030 (KILOTON)
  • TABLE 115 INDIA: NATURAL GRAPHITE MARKET, BY FORM, 2020–2023 (USD MILLION)
  • TABLE 116 INDIA: NATURAL GRAPHITE MARKET, BY FORM, 2024–2030 (USD MILLION)
  • TABLE 117 INDIA: NATURAL GRAPHITE MARKET, BY FORM, 2020–2023 (KILOTON)
  • TABLE 118 INDIA: NATURAL GRAPHITE MARKET, BY FORM, 2024–2030 (KILOTON)
  • TABLE 119 JAPAN: GRAPHITE MARKET, BY TYPE, 2020–2023 (USD MILLION)
  • TABLE 120 JAPAN: GRAPHITE MARKET, BY TYPE, 2024–2030 (USD MILLION)
  • TABLE 121 JAPAN: GRAPHITE MARKET, BY TYPE, 2020–2023 (KILOTON)
  • TABLE 122 JAPAN: GRAPHITE MARKET, BY TYPE, 2024–2030 (KILOTON)
  • TABLE 123 JAPAN: NATURAL GRAPHITE MARKET, BY FORM, 2020–2023 (USD MILLION)
  • TABLE 124 JAPAN: NATURAL GRAPHITE MARKET, BY FORM, 2024–2030 (USD MILLION)
  • TABLE 125 JAPAN: NATURAL GRAPHITE MARKET, BY FORM, 2020–2023 (KILOTON)
  • TABLE 126 JAPAN: NATURAL GRAPHITE MARKET, BY FORM, 2024–2030 (KILOTON)
  • TABLE 127 SOUTH KOREA: GRAPHITE MARKET, BY TYPE, 2020–2023 (USD MILLION)
  • TABLE 128 SOUTH KOREA: GRAPHITE MARKET, BY TYPE, 2024–2030 (USD MILLION)
  • TABLE 129 SOUTH KOREA: GRAPHITE MARKET, BY TYPE, 2020–2023 (KILOTON)
  • TABLE 130 SOUTH KOREA: GRAPHITE MARKET, BY TYPE, 2024–2030 (KILOTON)
  • TABLE 131 SOUTH KOREA: NATURAL GRAPHITE MARKET, BY FORM, 2020–2023 (USD MILLION)
  • TABLE 132 SOUTH KOREA: NATURAL GRAPHITE MARKET, BY FORM, 2024–2030 (USD MILLION)
  • TABLE 133 SOUTH KOREA: NATURAL GRAPHITE MARKET, BY FORM, 2020–2023 (KILOTON)
  • TABLE 134 SOUTH KOREA: NATURAL GRAPHITE MARKET, BY FORM, 2024–2030 (KILOTON)
  • TABLE 135 AUSTRALIA & NEW ZEALAND: GRAPHITE MARKET, BY TYPE, 2020–2023 (USD MILLION)
  • TABLE 136 AUSTRALIA & NEW ZEALAND: GRAPHITE MARKET, BY TYPE, 2024–2030 (USD MILLION)
  • TABLE 137 AUSTRALIA & NEW ZEALAND: GRAPHITE MARKET, BY TYPE, 2020–2023 (KILOTON)
  • TABLE 138 AUSTRALIA & NEW ZEALAND: GRAPHITE MARKET, BY TYPE, 2024–2030 (KILOTON)
  • TABLE 139 AUSTRALIA & NEW ZEALAND: NATURAL GRAPHITE MARKET, BY FORM, 2020–2023 (USD MILLION)
  • TABLE 140 AUSTRALIA & NEW ZEALAND: NATURAL GRAPHITE MARKET, BY FORM, 2024–2030 (USD MILLION)
  • TABLE 141 AUSTRALIA & NEW ZEALAND: NATURAL GRAPHITE MARKET, BY FORM, 2020–2023 (KILOTON)
  • TABLE 142 AUSTRALIA & NEW ZEALAND: NATURAL GRAPHITE MARKET, BY FORM, 2024–2030 (KILOTON)
  • TABLE 143 REST OF ASIA PACIFIC: GRAPHITE MARKET, BY TYPE, 2020–2023 (USD MILLION)
  • TABLE 144 REST OF ASIA PACIFIC: GRAPHITE MARKET, BY TYPE, 2024–2030 (USD MILLION)
  • TABLE 145 REST OF ASIA PACIFIC: GRAPHITE MARKET, BY TYPE, 2020–2023 (KILOTON)
  • TABLE 146 REST OF ASIA PACIFIC: GRAPHITE MARKET, BY TYPE, 2024–2030 (KILOTON)
  • TABLE 147 REST OF ASIA PACIFIC: NATURAL GRAPHITE MARKET, BY FORM, 2020–2023 (USD MILLION)
  • TABLE 148 REST OF ASIA PACIFIC: NATURAL GRAPHITE MARKET, BY FORM, 2024–2030 (USD MILLION)
  • TABLE 149 REST OF ASIA PACIFIC: NATURAL GRAPHITE MARKET, BY FORM, 2020–2023 (KILOTON)
  • TABLE 150 REST OF ASIA PACIFIC: NATURAL GRAPHITE MARKET, BY FORM, 2024–2030 (KILOTON)
  • TABLE 151 NORTH AMERICA: GRAPHITE MARKET, BY COUNTRY, 2020–2023 (USD MILLION)
  • TABLE 152 NORTH AMERICA: GRAPHITE MARKET, BY COUNTRY, 2024–2030 (USD MILLION)
  • TABLE 153 NORTH AMERICA: GRAPHITE MARKET, BY COUNTRY, 2020–2023 (KILOTON)
  • TABLE 154 NORTH AMERICA: GRAPHITE MARKET, BY COUNTRY, 2024–2030 (KILOTON)
  • TABLE 155 NORTH AMERICA: GRAPHITE MARKET, BY TYPE, 2020–2023 (USD MILLION)
  • TABLE 156 NORTH AMERICA: GRAPHITE MARKET, BY TYPE, 2024–2030 (USD MILLION)
  • TABLE 157 NORTH AMERICA: GRAPHITE MARKET, BY TYPE, 2020–2023 (KILOTON)
  • TABLE 158 NORTH AMERICA: GRAPHITE MARKET, BY TYPE, 2024–2030 (KILOTON)
  • TABLE 159 NORTH AMERICA: NATURAL GRAPHITE MARKET, BY FORM, 2020–2023 (USD MILLION)
  • TABLE 160 NORTH AMERICA: NATURAL GRAPHITE MARKET, BY FORM, 2024–2030 (USD MILLION)
  • TABLE 161 NORTH AMERICA: NATURAL GRAPHITE MARKET, BY FORM, 2020–2023 (KILOTON)
  • TABLE 162 NORTH AMERICA: NATURAL GRAPHITE MARKET, BY FORM, 2024–2030 (KILOTON)
  • TABLE 163 NORTH AMERICA: GRAPHITE MARKET, BY APPLICATION, 2020–2023 (USD MILLION)
  • TABLE 164 NORTH AMERICA: GRAPHITE MARKET, BY APPLICATION, 2024–2030 (USD MILLION)
  • TABLE 165 NORTH AMERICA: GRAPHITE MARKET, BY APPLICATION, 2020–2023 (KILOTON)
  • TABLE 166 NORTH AMERICA: GRAPHITE MARKET, BY APPLICATION, 2024–2030 (KILOTON)
  • TABLE 167 US: GRAPHITE MARKET, BY TYPE, 2020–2023 (USD MILLION)
  • TABLE 168 US: GRAPHITE MARKET, BY TYPE, 2024–2030 (USD MILLION)
  • TABLE 169 US: GRAPHITE MARKET, BY TYPE, 2020–2023 (KILOTON)
  • TABLE 170 US: GRAPHITE MARKET, BY TYPE, 2024–2030 (KILOTON)
  • TABLE 171 US: NATURAL GRAPHITE MARKET, BY FORM, 2020–2023 (USD MILLION)
  • TABLE 172 US: NATURAL GRAPHITE MARKET, BY FORM, 2024–2030 (USD MILLION)
  • TABLE 173 US: NATURAL GRAPHITE MARKET, BY FORM, 2020–2023 (KILOTON)
  • TABLE 174 US: NATURAL GRAPHITE MARKET, BY FORM, 2024–2030 (KILOTON)
  • TABLE 175 CANADA: GRAPHITE MARKET, BY TYPE, 2020–2023 (USD MILLION)
  • TABLE 176 CANADA: GRAPHITE MARKET, BY TYPE, 2024–2030 (USD MILLION)
  • TABLE 177 CANADA: GRAPHITE MARKET, BY TYPE, 2020–2023 (KILOTON)
  • TABLE 178 CANADA: GRAPHITE MARKET, BY TYPE, 2024–2030 (KILOTON)
  • TABLE 179 CANADA: NATURAL GRAPHITE MARKET, BY FORM, 2020–2023 (USD MILLION)
  • TABLE 180 CANADA: NATURAL GRAPHITE MARKET, BY FORM, 2024–2030 (USD MILLION)
  • TABLE 181 CANADA: NATURAL GRAPHITE MARKET, BY FORM, 2020–2023 (KILOTON)
  • TABLE 182 CANADA: NATURAL GRAPHITE MARKET, BY FORM, 2024–2030 (KILOTON)
  • TABLE 183 MEXICO: GRAPHITE MARKET, BY TYPE, 2020–2023 (USD MILLION)
  • TABLE 184 MEXICO: GRAPHITE MARKET, BY TYPE, 2024–2030 (USD MILLION)
  • TABLE 185 MEXICO: GRAPHITE MARKET, BY TYPE, 2020–2023 (KILOTON)
  • TABLE 186 MEXICO: GRAPHITE MARKET, BY TYPE, 2024–2030 (KILOTON)
  • TABLE 187 MEXICO: NATURAL GRAPHITE MARKET, BY FORM, 2020–2023 (USD MILLION)
  • TABLE 188 MEXICO: NATURAL GRAPHITE MARKET, BY FORM, 2024–2030 (USD MILLION)
  • TABLE 189 MEXICO: NATURAL GRAPHITE MARKET, BY FORM, 2020–2023 (KILOTON)
  • TABLE 190 MEXICO: NATURAL GRAPHITE MARKET, BY FORM, 2024–2030 (KILOTON)
  • TABLE 191 EUROPE: GRAPHITE MARKET, BY COUNTRY, 2020–2023 (USD MILLION)
  • TABLE 192 EUROPE: GRAPHITE MARKET, BY COUNTRY, 2024–2030 (USD MILLION)
  • TABLE 193 EUROPE: GRAPHITE MARKET, BY COUNTRY, 2020–2023 (KILOTON)
  • TABLE 194 EUROPE: GRAPHITE MARKET, BY COUNTRY, 2024–2030 (KILOTON)
  • TABLE 195 EUROPE: GRAPHITE MARKET, BY TYPE, 2020–2023 (USD MILLION)
  • TABLE 196 EUROPE: GRAPHITE MARKET, BY TYPE, 2024–2030 (USD MILLION)
  • TABLE 197 EUROPE: GRAPHITE MARKET, BY TYPE, 2020–2023 (KILOTON)
  • TABLE 198 EUROPE: GRAPHITE MARKET, BY TYPE, 2024–2030 (KILOTON)
  • TABLE 199 EUROPE: NATURAL GRAPHITE MARKET, BY FORM, 2020–2023 (USD MILLION)
  • TABLE 200 EUROPE: NATURAL GRAPHITE MARKET, BY FORM, 2024–2030 (USD MILLION)
  • TABLE 201 EUROPE: NATURAL GRAPHITE MARKET, BY FORM, 2020–2023 (KILOTON)
  • TABLE 202 EUROPE: NATURAL GRAPHITE MARKET, BY FORM, 2024–2030 (KILOTON)
  • TABLE 203 EUROPE: GRAPHITE MARKET, BY APPLICATION, 2020–2023 (USD MILLION)
  • TABLE 204 EUROPE: GRAPHITE MARKET, BY APPLICATION, 2024–2030 (USD MILLION)
  • TABLE 205 EUROPE: GRAPHITE MARKET, BY APPLICATION, 2020–2023 (KILOTON)
  • TABLE 206 EUROPE: GRAPHITE MARKET, BY APPLICATION, 2024–2030 (KILOTON)
  • TABLE 207 GERMANY: GRAPHITE MARKET, BY TYPE, 2020–2023 (USD MILLION)
  • TABLE 208 GERMANY: GRAPHITE MARKET, BY TYPE, 2024–2030 (USD MILLION)
  • TABLE 209 GERMANY: GRAPHITE MARKET, BY TYPE, 2020–2023 (KILOTON)
  • TABLE 210 GERMANY: GRAPHITE MARKET, BY TYPE, 2024–2030 (KILOTON)
  • TABLE 211 GERMANY: NATURAL GRAPHITE MARKET, BY FORM, 2020–2023 (USD MILLION)
  • TABLE 212 GERMANY: NATURAL GRAPHITE MARKET, BY FORM, 2024–2030 (USD MILLION)
  • TABLE 213 GERMANY: NATURAL GRAPHITE MARKET, BY FORM, 2020–2023 (KILOTON)
  • TABLE 214 GERMANY: NATURAL GRAPHITE MARKET, BY FORM, 2024–2030 (KILOTON)
  • TABLE 215 UK: GRAPHITE MARKET, BY TYPE, 2020–2023 (USD MILLION)
  • TABLE 216 UK: GRAPHITE MARKET, BY TYPE, 2024–2030 (USD MILLION)
  • TABLE 217 UK: GRAPHITE MARKET, BY TYPE, 2020–2023 (KILOTON)
  • TABLE 218 UK: GRAPHITE MARKET, BY TYPE, 2024–2030 (KILOTON)
  • TABLE 219 UK: NATURAL GRAPHITE MARKET, BY FORM, 2020–2023 (USD MILLION)
  • TABLE 220 UK: NATURAL GRAPHITE MARKET, BY FORM, 2024–2030 (USD MILLION)
  • TABLE 221 UK: NATURAL GRAPHITE MARKET, BY FORM, 2020–2023 (KILOTON)
  • TABLE 222 UK: NATURAL GRAPHITE MARKET, BY FORM, 2024–2030 (KILOTON)
  • TABLE 223 FRANCE: GRAPHITE MARKET, BY TYPE, 2020–2023 (USD MILLION)
  • TABLE 224 FRANCE: GRAPHITE MARKET, BY TYPE, 2024–2030 (USD MILLION)
  • TABLE 225 FRANCE: GRAPHITE MARKET, BY TYPE, 2020–2023 (KILOTON)
  • TABLE 226 FRANCE: GRAPHITE MARKET, BY TYPE, 2024–2030 (KILOTON)
  • TABLE 227 FRANCE: NATURAL GRAPHITE MARKET, BY FORM, 2020–2023 (USD MILLION)
  • TABLE 228 FRANCE: NATURAL GRAPHITE MARKET, BY FORM, 2024–2030 (USD MILLION)
  • TABLE 229 FRANCE: NATURAL GRAPHITE MARKET, BY FORM, 2020–2023 (KILOTON)
  • TABLE 230 FRANCE: NATURAL GRAPHITE MARKET, BY FORM, 2024–2030 (KILOTON)
  • TABLE 231 ITALY: GRAPHITE MARKET, BY TYPE, 2020–2023 (USD MILLION)
  • TABLE 232 ITALY: GRAPHITE MARKET, BY TYPE, 2024–2030 (USD MILLION)
  • TABLE 233 ITALY: GRAPHITE MARKET, BY TYPE, 2020–2023 (KILOTON)
  • TABLE 234 ITALY: GRAPHITE MARKET, BY TYPE, 2024–2030 (KILOTON)
  • TABLE 235 ITALY: NATURAL GRAPHITE MARKET, BY FORM, 2020–2023 (USD MILLION)
  • TABLE 236 ITALY: NATURAL GRAPHITE MARKET, BY FORM, 2024–2030 (USD MILLION)
  • TABLE 237 ITALY: NATURAL GRAPHITE MARKET, BY FORM, 2020–2023 (KILOTON)
  • TABLE 238 ITALY: NATURAL GRAPHITE MARKET, BY FORM, 2024–2030 (KILOTON)
  • TABLE 239 SPAIN: GRAPHITE MARKET, BY TYPE, 2020–2023 (USD MILLION)
  • TABLE 240 SPAIN: GRAPHITE MARKET, BY TYPE, 2024–2030 (USD MILLION)
  • TABLE 241 SPAIN: GRAPHITE MARKET, BY TYPE, 2020–2023 (KILOTON)
  • TABLE 242 SPAIN: GRAPHITE MARKET, BY TYPE, 2024–2030 (KILOTON)
  • TABLE 243 SPAIN: NATURAL GRAPHITE MARKET, BY FORM, 2020–2023 (USD MILLION)
  • TABLE 244 SPAIN: NATURAL GRAPHITE MARKET, BY FORM, 2024–2030 (USD MILLION)
  • TABLE 245 SPAIN: NATURAL GRAPHITE MARKET, BY FORM, 2020–2023 (KILOTON)
  • TABLE 246 SPAIN: NATURAL GRAPHITE MARKET, BY FORM, 2024–2030 (KILOTON)
  • TABLE 247 REST OF EUROPE: GRAPHITE MARKET, BY TYPE, 2020–2023 (USD MILLION)
  • TABLE 248 REST OF EUROPE: GRAPHITE MARKET, BY TYPE, 2024–2030 (USD MILLION)
  • TABLE 249 REST OF EUROPE: GRAPHITE MARKET, BY TYPE, 2020–2023 (KILOTON)
  • TABLE 250 REST OF EUROPE: GRAPHITE MARKET, BY TYPE, 2024–2030 (KILOTON)
  • TABLE 251 REST OF EUROPE: NATURAL GRAPHITE MARKET, BY FORM, 2020–2023 (USD MILLION)
  • TABLE 252 REST OF EUROPE: NATURAL GRAPHITE MARKET, BY FORM, 2024–2030 (USD MILLION)
  • TABLE 253 REST OF EUROPE: NATURAL GRAPHITE MARKET, BY FORM, 2020–2023 (KILOTON)
  • TABLE 254 REST OF EUROPE: NATURAL GRAPHITE MARKET, BY FORM, 2024–2030 (KILOTON)
  • TABLE 255 SOUTH AMERICA: GRAPHITE MARKET, BY COUNTRY, 2020–2023 (USD MILLION)
  • TABLE 256 SOUTH AMERICA: GRAPHITE MARKET, BY COUNTRY, 2024–2030 (USD MILLION)
  • TABLE 257 SOUTH AMERICA: GRAPHITE MARKET, BY COUNTRY, 2020–2023 (KILOTON)
  • TABLE 258 SOUTH AMERICA: GRAPHITE MARKET, BY COUNTRY, 2024–2030 (KILOTON)
  • TABLE 259 SOUTH AMERICA: GRAPHITE MARKET, BY TYPE, 2020–2023 (USD MILLION)
  • TABLE 260 SOUTH AMERICA: GRAPHITE MARKET, BY TYPE, 2024–2030 (USD MILLION)
  • TABLE 261 SOUTH AMERICA: GRAPHITE MARKET, BY TYPE, 2020–2023 (KILOTON)
  • TABLE 262 SOUTH AMERICA: GRAPHITE MARKET, BY TYPE, 2024–2030 (KILOTON)
  • TABLE 263 SOUTH AMERICA: NATURAL GRAPHITE MARKET, BY FORM, 2020–2023 (USD MILLION)
  • TABLE 264 SOUTH AMERICA: NATURAL GRAPHITE MARKET, BY FORM, 2024–2030 (USD MILLION)
  • TABLE 265 SOUTH AMERICA: NATURAL GRAPHITE MARKET, BY FORM, 2020–2023 (KILOTON)
  • TABLE 266 SOUTH AMERICA: NATURAL GRAPHITE MARKET, BY FORM, 2024–2030 (KILOTON)
  • TABLE 267 SOUTH AMERICA: GRAPHITE MARKET, BY APPLICATION, 2020–2023 (USD MILLION)
  • TABLE 268 SOUTH AMERICA: GRAPHITE MARKET, BY APPLICATION, 2024–2030 (USD MILLION)
  • TABLE 269 SOUTH AMERICA: GRAPHITE MARKET, BY APPLICATION, 2020–2023 (KILOTON)
  • TABLE 270 SOUTH AMERICA: GRAPHITE MARKET, BY APPLICATION, 2024–2030 (KILOTON)
  • TABLE 271 BRAZIL: GRAPHITE MARKET, BY TYPE, 2020–2023 (USD MILLION)
  • TABLE 272 BRAZIL: GRAPHITE MARKET, BY TYPE, 2024–2030 (USD MILLION)
  • TABLE 273 BRAZIL: GRAPHITE MARKET, BY TYPE, 2020–2023 (KILOTON)
  • TABLE 274 BRAZIL: GRAPHITE MARKET, BY TYPE, 2024–2030 (KILOTON)
  • TABLE 275 BRAZIL: NATURAL GRAPHITE MARKET, BY FORM, 2020–2023 (USD MILLION)
  • TABLE 276 BRAZIL: NATURAL GRAPHITE MARKET, BY FORM, 2024–2030 (USD MILLION)
  • TABLE 277 BRAZIL: NATURAL GRAPHITE MARKET, BY FORM, 2020–2023 (KILOTON)
  • TABLE 278 BRAZIL: NATURAL GRAPHITE MARKET, BY FORM, 2024–2030 (KILOTON)
  • TABLE 279 CHILE: GRAPHITE MARKET, BY TYPE, 2020–2023 (USD MILLION)
  • TABLE 280 CHILE: GRAPHITE MARKET, BY TYPE, 2024–2030 (USD MILLION)
  • TABLE 281 CHILE: GRAPHITE MARKET, BY TYPE, 2020–2023 (KILOTON)
  • TABLE 282 CHILE: GRAPHITE MARKET, BY TYPE, 2024–2030 (KILOTON)
  • TABLE 283 CHILE: NATURAL GRAPHITE MARKET, BY FORM, 2020–2023 (USD MILLION)
  • TABLE 284 CHILE: NATURAL GRAPHITE MARKET, BY FORM, 2024–2030 (USD MILLION)
  • TABLE 285 CHILE: NATURAL GRAPHITE MARKET, BY FORM, 2020–2023 (KILOTON)
  • TABLE 286 CHILE: NATURAL GRAPHITE MARKET, BY FORM, 2024–2030 (KILOTON)
  • TABLE 287 ARGENTINA: GRAPHITE MARKET, BY TYPE, 2020–2023 (USD MILLION)
  • TABLE 288 ARGENTINA: GRAPHITE MARKET, BY TYPE, 2024–2030 (USD MILLION)
  • TABLE 289 ARGENTINA: GRAPHITE MARKET, BY TYPE, 2020–2023 (KILOTON)
  • TABLE 290 ARGENTINA: GRAPHITE MARKET, BY TYPE, 2024–2030 (KILOTON)
  • TABLE 291 ARGENTINA: NATURAL GRAPHITE MARKET, BY FORM, 2020–2023 (USD MILLION)
  • TABLE 292 ARGENTINA: NATURAL GRAPHITE MARKET, BY FORM, 2024–2030 (USD MILLION)
  • TABLE 293 ARGENTINA: NATURAL GRAPHITE MARKET, BY FORM, 2020–2023 (KILOTON)
  • TABLE 294 ARGENTINA: NATURAL GRAPHITE MARKET, BY FORM, 2024–2030 (KILOTON)
  • TABLE 295 REST OF SOUTH AMERICA: GRAPHITE MARKET, BY TYPE, 2020–2023 (USD MILLION)
  • TABLE 296 REST OF SOUTH AMERICA: GRAPHITE MARKET, BY TYPE, 2024–2030 (USD MILLION)
  • TABLE 297 REST OF SOUTH AMERICA: GRAPHITE MARKET, BY TYPE, 2020–2023 (KILOTON)
  • TABLE 298 REST OF SOUTH AMERICA: GRAPHITE MARKET, BY TYPE, 2024–2030 (KILOTON)
  • TABLE 299 REST OF SOUTH AMERICA: NATURAL GRAPHITE MARKET, BY FORM, 2020–2023 (USD MILLION)
  • TABLE 300 REST OF SOUTH AMERICA: NATURAL GRAPHITE MARKET, BY FORM, 2024–2030 (USD MILLION)
  • TABLE 301 REST OF SOUTH AMERICA: NATURAL GRAPHITE MARKET, BY FORM, 2020–2023 (KILOTON)
  • TABLE 302 REST OF SOUTH AMERICA: NATURAL GRAPHITE MARKET, BY FORM, 2024–2030 (KILOTON)
  • TABLE 303 MIDDLE EAST & AFRICA: GRAPHITE MARKET, BY COUNTRY, 2020–2023 (USD MILLION)
  • TABLE 304 MIDDLE EAST & AFRICA: GRAPHITE MARKET, BY COUNTRY, 2024–2030 (USD MILLION)
  • TABLE 305 MIDDLE EAST & AFRICA: GRAPHITE MARKET, BY COUNTRY, 2020–2023 (KILOTON)
  • TABLE 306 MIDDLE EAST & AFRICA: GRAPHITE MARKET, BY COUNTRY, 2024–2030 (KILOTON)
  • TABLE 307 MIDDLE EAST & AFRICA: GRAPHITE MARKET, BY TYPE, 2020–2023 (USD MILLION)
  • TABLE 308 MIDDLE EAST & AFRICA: GRAPHITE MARKET, BY TYPE, 2024–2030 (USD MILLION)
  • TABLE 309 MIDDLE EAST & AFRICA: GRAPHITE MARKET, BY TYPE, 2020–2023 (KILOTON)
  • TABLE 310 MIDDLE EAST & AFRICA: GRAPHITE MARKET, BY TYPE, 2024–2030 (KILOTON)
  • TABLE 311 MIDDLE EAST & AFRICA: NATURAL GRAPHITE MARKET, BY FORM, 2020–2023 (USD MILLION)
  • TABLE 312 MIDDLE EAST & AFRICA: NATURAL GRAPHITE MARKET, BY FORM, 2024–2030 (USD MILLION)
  • TABLE 313 MIDDLE EAST & AFRICA: NATURAL GRAPHITE MARKET, BY FORM, 2020–2023 (KILOTON)
  • TABLE 314 MIDDLE EAST & AFRICA: NATURAL GRAPHITE MARKET, BY FORM, 2024–2030 (KILOTON)
  • TABLE 315 MIDDLE EAST & AFRICA: GRAPHITE MARKET, BY APPLICATION, 2020–2023 (USD MILLION)
  • TABLE 316 MIDDLE EAST & AFRICA: GRAPHITE MARKET, BY APPLICATION, 2024–2030 (USD MILLION)
  • TABLE 317 MIDDLE EAST & AFRICA: GRAPHITE MARKET, BY APPLICATION, 2020–2023 (KILOTON)
  • TABLE 318 MIDDLE EAST & AFRICA: GRAPHITE MARKET, BY APPLICATION, 2024–2030 (KILOTON)
  • TABLE 319 SAUDI ARABIA: GRAPHITE MARKET, BY TYPE, 2020–2023 (USD MILLION)
  • TABLE 320 SAUDI ARABIA: GRAPHITE MARKET, BY TYPE, 2024–2030 (USD MILLION)
  • TABLE 321 SAUDI ARABIA: GRAPHITE MARKET, BY TYPE, 2020–2023 (KILOTON)
  • TABLE 322 SAUDI ARABIA: GRAPHITE MARKET, BY TYPE, 2024–2030 (KILOTON)
  • TABLE 323 SAUDI ARABIA: NATURAL GRAPHITE MARKET, BY FORM, 2020–2023 (USD MILLION)
  • TABLE 324 SAUDI ARABIA: NATURAL GRAPHITE MARKET, BY FORM, 2024–2030 (USD MILLION)
  • TABLE 325 SAUDI ARABIA: NATURAL GRAPHITE MARKET, BY FORM, 2020–2023 (KILOTON)
  • TABLE 326 SAUDI ARABIA: NATURAL GRAPHITE MARKET, BY FORM, 2024–2030 (KILOTON)
  • TABLE 327 UAE: GRAPHITE MARKET, BY TYPE, 2020–2023 (USD MILLION)
  • TABLE 328 UAE: GRAPHITE MARKET, BY TYPE, 2024–2030 (USD MILLION)
  • TABLE 329 UAE: GRAPHITE MARKET, BY TYPE, 2020–2023 (KILOTON)
  • TABLE 330 UAE: GRAPHITE MARKET, BY TYPE, 2024–2030 (KILOTON)
  • TABLE 331 UAE: NATURAL GRAPHITE MARKET, BY FORM, 2020–2023 (USD MILLION)
  • TABLE 332 UAE: NATURAL GRAPHITE MARKET, BY FORM, 2024–2030 (USD MILLION)
  • TABLE 333 UAE: NATURAL GRAPHITE MARKET, BY FORM, 2020–2023 (KILOTON)
  • TABLE 334 UAE: NATURAL GRAPHITE MARKET, BY FORM, 2024–2030 (KILOTON)
  • TABLE 335 REST OF GCC COUNTRIES: GRAPHITE MARKET, BY TYPE, 2020–2023 (USD MILLION)
  • TABLE 336 REST OF GCC COUNTRIES: GRAPHITE MARKET, BY TYPE, 2024–2030 (USD MILLION)
  • TABLE 337 REST OF GCC COUNTRIES: GRAPHITE MARKET, BY TYPE, 2020–2023 (KILOTON)
  • TABLE 338 REST OF GCC COUNTRIES: GRAPHITE MARKET, BY TYPE, 2024–2030 (KILOTON)
  • TABLE 339 REST OF GCC COUNTRIES: NATURAL GRAPHITE MARKET, BY FORM, 2020–2023 (USD MILLION)
  • TABLE 340 REST OF GCC COUNTRIES: NATURAL GRAPHITE MARKET, BY FORM, 2024–2030 (USD MILLION)
  • TABLE 341 REST OF GCC COUNTRIES: NATURAL GRAPHITE MARKET, BY FORM, 2020–2023 (KILOTON)
  • TABLE 342 REST OF GCC COUNTRIES: NATURAL GRAPHITE MARKET, BY FORM, 2024–2030 (KILOTON)
  • TABLE 343 SOUTH AFRICA: GRAPHITE MARKET, BY TYPE, 2020–2023 (USD MILLION)
  • TABLE 344 SOUTH AFRICA: GRAPHITE MARKET, BY TYPE, 2024–2030 (USD MILLION)
  • TABLE 345 SOUTH AFRICA: GRAPHITE MARKET, BY TYPE, 2020–2023 (KILOTON)
  • TABLE 346 SOUTH AFRICA: GRAPHITE MARKET, BY TYPE, 2024–2030 (KILOTON)
  • TABLE 347 SOUTH AFRICA: NATURAL GRAPHITE MARKET, BY FORM, 2020–2023 (USD MILLION)
  • TABLE 348 SOUTH AFRICA: NATURAL GRAPHITE MARKET, BY FORM, 2024–2030 (USD MILLION)
  • TABLE 349 SOUTH AFRICA: NATURAL GRAPHITE MARKET, BY FORM, 2020–2023 (KILOTON)
  • TABLE 350 SOUTH AFRICA: NATURAL GRAPHITE MARKET, BY FORM, 2024–2030 (KILOTON)
  • TABLE 351 REST OF MIDDLE EAST & AFRICA: GRAPHITE MARKET, BY TYPE, 2020–2023 (USD MILLION)
  • TABLE 352 REST OF MIDDLE EAST & AFRICA: GRAPHITE MARKET, BY TYPE, 2024–2030 (USD MILLION)
  • TABLE 353 REST OF MIDDLE EAST & AFRICA: GRAPHITE MARKET, BY TYPE, 2020–2023 (KILOTON)
  • TABLE 354 REST OF MIDDLE EAST & AFRICA: GRAPHITE MARKET, BY TYPE, 2024–2030 (KILOTON)
  • TABLE 355 REST OF MIDDLE EAST & AFRICA: NATURAL GRAPHITE MARKET, BY FORM, 2020–2023 (USD MILLION)
  • TABLE 356 REST OF MIDDLE EAST & AFRICA: NATURAL GRAPHITE MARKET, BY FORM, 2024–2030 (USD MILLION)
  • TABLE 357 REST OF MIDDLE EAST & AFRICA: NATURAL GRAPHITE MARKET, BY FORM, 2020–2023 (KILOTON)
  • TABLE 358 REST OF MIDDLE EAST & AFRICA: NATURAL GRAPHITE MARKET, BY FORM, 2024–2030 (KILOTON)
  • TABLE 359 KEY PLAYER STRATEGIES/RIGHT TO WIN, 2020–2024
  • TABLE 360 TYPE FOOTPRINT
  • TABLE 361 PURITY FOOTPRINT
  • TABLE 362 APPLICATION FOOTPRINT
  • TABLE 363 END-USE INDUSTRY FOOTPRINT
  • TABLE 364 REGION FOOTPRINT
  • TABLE 365 LIST OF START-UPS/SMES
  • TABLE 366 COMPETITIVE BENCHMARKING OF START-UPS/SMES
  • TABLE 367 GRAPHITE MARKET: DEALS, 2020–2024
  • TABLE 368 GRAPHITE MARKET: EXPANSIONS, 2020–2024
  • TABLE 369 SHANSHAN CO: COMPANY OVERVIEW
  • TABLE 370 SHANSHAN CO: PRODUCTS OFFERED
  • TABLE 371 SGL CARBON: COMPANY OVERVIEW
  • TABLE 372 SGL CARBON: PRODUCTS OFFERED
  • TABLE 373 SGL CARBON: DEALS
  • TABLE 374 SGL CARBON: EXPANSIONS
  • TABLE 375 RESONAC HOLDINGS CORPORATION: COMPANY OVERVIEW
  • TABLE 376 RESONAC HOLDINGS CORPORATION: PRODUCTS OFFERED
  • TABLE 377 RESONAC HOLDINGS CORPORATION: DEALS
  • TABLE 378 GRAFTECH INTERNATIONAL: COMPANY OVERVIEW
  • TABLE 379 GRAFTECH INTERNATIONAL: PRODUCTS OFFERED
  • TABLE 380 GRAFTECH INTERNATIONAL: EXPANSIONS
  • TABLE 381 IMERYS: COMPANY OVERVIEW
  • TABLE 382 IMERYS: PRODUCTS OFFERED
  • TABLE 383 AMG: COMPANY OVERVIEW
  • TABLE 384 AMG: PRODUCTS OFFERED
  • TABLE 385 AMG: DEALS
  • TABLE 386 ASBURY CARBONS: COMPANY OVERVIEW
  • TABLE 387 ASBURY CARBONS: PRODUCTS OFFERED
  • TABLE 388 ASBURY CARBONS: DEALS
  • TABLE 389 GRAFITBERGBAU KAISERSBERG GMBH: COMPANY OVERVIEW
  • TABLE 390 GRAFITBERGBAU KAISERSBERG GMBH: PRODUCTS OFFERED
  • TABLE 391 BTR NEW MATERIAL GROUP CO., LTD.: COMPANY OVERVIEW
  • TABLE 392 BTR NEW MATERIAL GROUP CO., LTD.: PRODUCTS OFFERED
  • TABLE 393 BTR NEW MATERIAL GROUP CO., LTD.: DEALS
  • TABLE 394 NACIONAL DE GRAFITE: COMPANY OVERVIEW
  • TABLE 395 NACIONAL DE GRAFITE: PRODUCTS OFFERED
  • TABLE 396 MINERAL COMMODITIES LTD.: COMPANY OVERVIEW
  • TABLE 397 MINERAL COMMODITIES LTD.: PRODUCTS OFFERED
  • TABLE 398 MINERAL COMMODITIES LTD.: DEALS
  • TABLE 399 TOKAI CARBON CO., LTD.: COMPANY OVERVIEW
  • TABLE 400 TOKAI CARBON CO., LTD.: PRODUCTS OFFERED
  • TABLE 401 TOKAI CARBON CO., LTD.: DEALS
  • TABLE 402 TOYO TANSO CO., LTD.: COMPANY OVERVIEW
  • TABLE 403 TOYO TANSO CO., LTD.: PRODUCTS OFFERED
  • TABLE 404 MERSEN PROPERTY: COMPANY OVERVIEW
  • TABLE 405 MERSEN PROPERTY: PRODUCTS OFFERED
  • TABLE 406 GRAPHITE INDIA LIMITED: COMPANY OVERVIEW
  • TABLE 407 GRAPHITE INDIA LIMITED: PRODUCTS OFFERED
  • TABLE 408 SYRAH RESOURCES LIMITED: COMPANY OVERVIEW
  • TABLE 409 SYRAH RESOURCES LIMITED: PRODUCTS OFFERED
  • TABLE 410 ECOGRAF: COMPANY OVERVIEW
  • TABLE 411 ECOGRAF: PRODUCTS OFFERED
  • TABLE 412 TIRUPATI CARBONS & CHEMICALS PVT LTD: COMPANY OVERVIEW
  • TABLE 413 NORTHERN GRAPHITE: COMPANY OVERVIEW
  • TABLE 414 NOVONIX LIMITED: COMPANY OVERVIEW
  • TABLE 415 TALGA GROUP: COMPANY OVERVIEW
  • TABLE 416 HEBEI KUNTIAN NEW ENERGY CO., LTD.: COMPANY OVERVIEW
  • TABLE 417 ZENTEK LTD.: COMPANY OVERVIEW
  • TABLE 418 NIPPON CARBON CO., LTD: COMPANY OVERVIEW
  • TABLE 419 POCO: COMPANY OVERVIEW
  • TABLE 420 HEG LIMITED: COMPANY OVERVIEW
  • TABLE 421 PINGDINGSHAN ORIENTAL CARBON CO., LTD.: COMPANY OVERVIEW
  • TABLE 422 LITHIUM-ION BATTERY MARKET, BY VOLTAGE, 2019–2022 (USD BILLION)
  • TABLE 423 LITHIUM-ION BATTERY MARKET, BY VOLTAGE, 2023–2032 (USD BILLION)
LIST OF FIGURES
 
  • FIGURE 1 GRAPHITE MARKET SEGMENTATION
  • FIGURE 2 RESEARCH DESIGN
  • FIGURE 3 METHODOLOGY FOR SUPPLY-SIDE SIZING OF GRAPHITE MARKET
  • FIGURE 4 METHODOLOGY FOR DEMAND-SIDE SIZING OF GRAPHITE MARKET
  • FIGURE 5 BOTTOM-UP APPROACH
  • FIGURE 6 TOP-DOWN APPROACH
  • FIGURE 7 DATA TRIANGULATION
  • FIGURE 8 SYNTHETIC GRAPHITE SEGMENT TO LEAD MARKET IN 2024
  • FIGURE 9 ELECTRODE SEGMENT TO LEAD MARKET IN 2024
  • FIGURE 10 ASIA PACIFIC TO LEAD MARKET DURING FORECAST PERIOD
  • FIGURE 11 GROWING DEMAND FOR ELECTRIC VEHICLES TO DRIVE MARKET DURING FORECAST PERIOD
  • FIGURE 12 SYNTHETIC GRAPHITE SEGMENT TO BE LARGER THAN NATURAL GRAPHITE SEGMENT DURING FORECAST PERIOD
  • FIGURE 13 ELECTRODE AND CHINA TO BE MAJOR SEGMENTS DURING FORECAST PERIOD
  • FIGURE 14 CHINA TO BE FASTEST-GROWING MARKET FOR GRAPHITE DURING FORECAST PERIOD
  • FIGURE 15 GRAPHITE MARKET DYNAMICS
  • FIGURE 16 GLOBAL ELECTRIC VEHICLE SALES, 2011–2023
  • FIGURE 17 ELECTRIC VEHICLE BATTERY DEMAND, BY REGION, 2016–2023
  • FIGURE 18 PORTER’S FIVE FORCES ANALYSIS
  • FIGURE 19 VALUE CHAIN ANALYSIS
  • FIGURE 20 ECOSYSTEM ANALYSIS
  • FIGURE 21 TRENDS AND DISRUPTIONS IMPACTING CUSTOMER BUSINESS
  • FIGURE 22 PATENT ANALYSIS
  • FIGURE 23 IMPORT DATA FOR HS CODE 2504, BY COUNTRY, 2019–2023 (USD THOUSAND)
  • FIGURE 24 EXPORT DATA FOR HS CODE 2504, BY COUNTRY, 2019–2023 (USD THOUSAND)
  • FIGURE 25 AVERAGE SELLING PRICE OF GRAPHITE, BY TYPE, 2020–2023 (USD/TON)
  • FIGURE 26 AVERAGE SELLING PRICE OF NATURAL GRAPHITE, BY FORM, 2020–2023 (USD/TON)
  • FIGURE 27 AVERAGE SELLING PRICE OF GRAPHITE OFFERED BY KEY PLAYERS, 2023 (USD/TON)
  • FIGURE 28 AVERAGE SELLING PRICE OF GRAPHITE, BY REGION, 2020–2023 (USD/TON)
  • FIGURE 29 INVESTMENT AND FUNDING SCENARIO, 2019–2024
  • FIGURE 30 INFLUENCE OF STAKEHOLDERS ON BUYING PROCESS FOR TOP THREE APPLICATIONS
  • FIGURE 31 KEY BUYING CRITERIA FOR TOP THREE APPLICATIONS
  • FIGURE 32 GRAPHITE MARKET, BY APPLICATION, 2024 VS. 2030 (USD MILLION)
  • FIGURE 33 GRAPHITE MARKET, BY PURITY, 2024 VS. 2030 (KILOTON)
  • FIGURE 34 GRAPHITE MARKET, BY TYPE, 2024 VS. 2030 (USD MILLION)
  • FIGURE 35 CHINA TO WITNESS HIGHEST GROWTH DURING FORECAST PERIOD
  • FIGURE 36 ASIA PACIFIC: GRAPHITE MARKET SNAPSHOT
  • FIGURE 37 NORTH AMERICA: GRAPHITE MARKET SNAPSHOT
  • FIGURE 38 EUROPE: GRAPHITE MARKET SNAPSHOT
  • FIGURE 39 REVENUE ANALYSIS OF TOP FIVE PLAYERS, 2019–2023
  • FIGURE 40 MARKET SHARE ANALYSIS OF KEY PLAYERS, 2023
  • FIGURE 41 COMPANY EVALUATION MATRIX (KEY PLAYERS), 2023
  • FIGURE 42 COMPANY FOOTPRINT
  • FIGURE 43 COMPANY EVALUATION MATRIX (START-UPS/SMES), 2023
  • FIGURE 44 BRAND/PRODUCT COMPARISON
  • FIGURE 45 COMPANY VALUATION OF KEY PLAYERS
  • FIGURE 46 EV/EBITDA OF KEY PLAYERS
  • FIGURE 47 YEAR-TO-DATE (YTD) PRICE TOTAL RETURN AND FIVE-YEAR STOCK BETA OF KEY PLAYERS
  • FIGURE 48 SHANSHAN CO: COMPANY SNAPSHOT
  • FIGURE 49 SGL CARBON: COMPANY SNAPSHOT
  • FIGURE 50 RESONAC HOLDINGS CORPORATION: COMPANY SNAPSHOT
  • FIGURE 51 GRAFTECH INTERNATIONAL: COMPANY SNAPSHOT
  • FIGURE 52 IMERYS: COMPANY SNAPSHOT
  • FIGURE 53 AMG: COMPANY SNAPSHOT
  • FIGURE 54 MINERAL COMMODITIES LTD.: COMPANY SNAPSHOT
  • FIGURE 55 TOKAI CARBON CO., LTD.: COMPANY SNAPSHOT
  • FIGURE 56 TOYO TANSO CO., LTD.: COMPANY SNAPSHOT
  • FIGURE 57 MERSEN PROPERTY: COMPANY SNAPSHOT
  • FIGURE 58 GRAPHITE INDIA LIMITED: COMPANY SNAPSHOT
  • FIGURE 59 SYRAH RESOURCES LIMITED: COMPANY SNAPSHOT
  • FIGURE 60 ECOGRAF: COMPANY SNAPSHOT

The estimation of the current size of the graphite market involved a four-step methodology. Initially, secondary research included all pertinent information about the market itself, as well as related and parent markets. These results, along with assumptions and metrics, were validated with primary research that involved experts from both the supply and demand sides of the graphite value chain. Total market size was determined through a top-down and bottom-up approach. Finally, the market sizes for various segments and subsegments were found using comprehensive market segmentation and data triangulation techniques.

Secondary Research

The research methodology followed in estimating the current graphite market size consisted of four significant activities. Extensive secondary research was conducted to provide information on the market, peer markets, and parent markets. These findings, assumptions, and metrics were validated through primary research undertaken with experts from the demand side of the graphite value chain. Both top-down as well as bottom-up approaches were followed for the estimation of the total market size. The complete market segmentation and data triangulation techniques had been applied for the final estimation of various segments and subsegments.

Primary Research

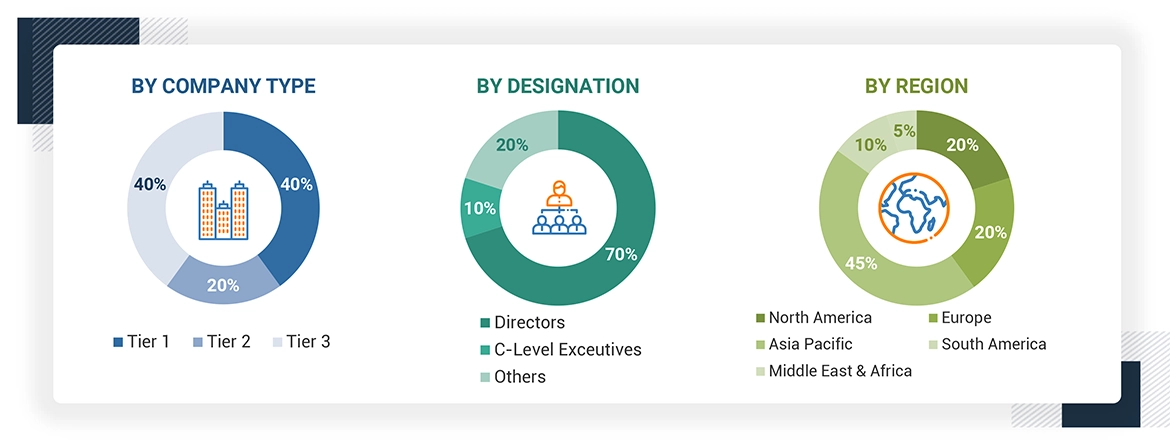
The graphite market comprises several stakeholders in the supply chain, such as graphite producers and Miners, graphite processing and refining companies, manufacturers, distributors and traders, government and regulatory bodies, and end users. The development of EV, metallurgy, electronics, textile and construction defines the demand side of this market. Interviews were conducted with various primary sources on both the supply and demand sides of the market to gather qualitative and quantitative data. Following is the breakdown of the primary respondents:

The following is a breakdown of the primary respondents:
Graphite Market

To know about the assumptions considered for the study, download the pdf brochure

Market Size Estimation

Top-down and bottom-up approaches were used to estimate and validate the size of the graphite market. These methods were used to determine the market size of various segments. The research methodology used for the market size estimation is as follows:

  • Extensive primary and secondary research was done to identify the key players.
  • The value chain and market size of the graphite market, in terms of value, were determined through primary and secondary research.
  • All percentage shares, splits, and breakdowns were collected through secondary sources and verified through primary sources.
  • All possible parameters that affect the market were covered in this research study and are viewed in extensive detail, verified through primary research, and analyzed to obtain the final quantitative and qualitative data.
  • This research includes the study of reports, reviews, and newsletters of top market players, along with extensive interviews for opinions from key leaders, such as CEOs, directors, and marketing executives.

Research Methodology

The research methodology used to estimate and forecast the global market size began by first aggregating data and information from the country and different levels. To estimate and validate the size of the graphite market, the top-down and bottom-up approaches have been used. Secondary research has been applied to identify the players involved in the market and, thereby, determine revenues generated by these players in the various regions. This procedure involves the study of annual and financial reports of key market players such as Shanshan Co (China), Resonac Holdings Corporation (Japan), SGL Carbon (Germany), GrafTech International (US), and Imerys (France). Interviews were also conducted with industry leaders, such as CEOs, directors, and marketing executives of leading companies, to gain insight into the graphite market

Graphite Market Size: Bottom-Up & Top-Down Approach

Graphite Market

Data Triangulation

After estimating the overall market size using the above estimation, the market was split into various segments and subsegments. Data triangulation, market breakup techniques, and the market engineering process were used to reach the exact market analysis data for each segment and subsegment. data triangulation and market breakdown procedures were used, wherever applicable. The data was triangulated by studying various factors and trends from the demand and supply sides. The market size was also validated using the top-down and bottom-up approaches.

Market Definition

Graphite is a semimetal and possesses good electrical conducting properties. It is a form of crystalline carbon, in which carbon atoms are densely arranged in parallel-stacked, planar honeycomb lattice sheets. The demand for graphite is directly dependent on the growth of its application industries, including, electric vehicles, energy storage devices, refractory, foundry, battery, friction product, and lubricants Graphite is used across various end-use industries, such as aerospace & defense, steel, and automotive since it is lightweight and has excellent strength. Graphite-based composites are used in the manufacturing of automotive parts, such as exterior body parts, hoods, bonnets, test plates, suspension struts, and chassis, among others. There has been a growing demand for graphite particularly in battery technologies in electric vehicles

Stakeholders

  • Graphite producers and Miners
  • Graphite processing and refining companies
  • Electric Vehicle (EV) Manufacturers
  • Distributors and Traders
  • Research and Development Institutions
  • Regulatory Bodies
  • NGOs, Governments, Investment Banks, Venture Capitalists, and Private Equity Firms
  • Consumers ans End users

Report Objectives

  • To define, describe, and forecast the size of the global graphite market in terms of value and volume.
  • To provide detailed information regarding the key factors, such as drivers, restraints, opportunities, and industry-specific challenges, influencing the growth of the graphite market
  • To analyze and forecast the size of various segments (type, purity, application and end use industry) of the graphite market based on five major regions—North America, Europe, Asia Pacific, Middle East & Africa and South America—along with key countries in each region.
  • To analyze recent developments and competitive strategies, such as expansions, new product developments, partnerships, and acquisitions, to draw the market's competitive landscape.
  • To strategically profile the key players in the market and comprehensively analyze their core competencies.

Previous Versions of this Report

Graphite Market by Type (Natural, Synthetic), Application (Electrode, Refractory and Foundry, Battery, Friction Products, Lubricants), Purity (High, Low), and Region - Global Forecast to 2030

Report Code CH 5285
Published in May, 2017, By MarketsandMarkets™
"Our USP is "providing game-changing business opportunities reports with free customization" - so please feel free to provide us with your specific areas of interest / business challenges in much greater detail !!"

We appreciate your interest in this report. Once you fill out the form, you'll be immediately directed to an exclusive solution tailored to your needs. This high-value offering can help boost your revenue by 30% - a must-see opportunity for anyone looking to maximize growth.


By clicking the "Submit" button, you are agreeing to the Terms of Use and Privacy Policy.

Custom Market Research Services

We Will Customise The Research For You, In Case The Report Listed Above Does Not Meet With Your Requirements

Get 10% Free Customisation

Growth opportunities and latent adjacency in Graphite Market

DMCA.com Protection Status