Fluorescent Pigment Market

Fluorescent Pigment Market by Formulation (Organic, Inorganic), Characteristic Type, Type, Intensity (High Intensity, Medium Intensity, Low Intensity), Application (Paints & Coatings, Printing Inks), End-Use Industry, & Region - Global Forecast to 2028

Report Code: CH 8932 Feb, 2024, by marketsandmarkets.com

The fluorescent pigment market is projected to reach USD 498 million by 2028, at a CAGR of 5.7 % from USD 377 million in 2023. The fluorescent pigment market is characterized by its dynamic and diverse landscape, driven by increasing demand across various industries. These pigments, known for their ability to emit visible light when exposed to ultraviolet (UV) light, find extensive applications in sectors such as security and currency, packaging, automotive and transportation, building and construction, textiles, and cosmetics. In the realm of security, fluorescent pigments play a crucial role in anti-counterfeiting measures, adding authenticity to currency and important documents. The packaging industry values these pigments for their attention-grabbing properties, enhancing the visual appeal of labels and packaging materials. Automotive and transportation sectors utilize fluorescent pigments in high-visibility coatings for safety and aesthetic purposes, while building and construction applications include safety markings and decorative elements. The textile industry benefits from the vibrancy these pigments add to fabrics, meeting the demand for trendy and fashionable products. Additionally, fluorescent pigments are widely incorporated in the cosmetics industry to create bold and vibrant color formulations. With their versatile applications and ability to meet diverse aesthetic and functional needs, the fluorescent pigment market continues to play a pivotal role in shaping the visual landscape across various industries.

Attractive Opportunities in the Fluorescent Pigment Market

Fluorescent Pigment  Market

To know about the assumptions considered for the study, Request for Free Sample Report

Fluorescent Pigment  Market

Fluorescent Pigment Market Dynamics

Driver: Growth in emerging markets

The growth in the emerging markets such as India, China, Indonesia, Vietnam, and Brazil are the significant propelling factor for fluorescent pigment market.  As these markets undergo rapid economic expansion, characterized by increased industrialization and infrastructure development, there is a notable surge in the consumption of products that prominently feature fluorescent pigments. This demand is particularly pronounced in the construction and architectural sectors, where vibrant and durable finishes, achieved through the use of fluorescent pigments in paints and coatings, are increasingly sought after. The rising affluence of the middle class in emerging markets significantly contributes to the burgeoning demand for goods that incorporate fluorescent pigments. This demographic, with its heightened purchasing power, actively seeks visually appealing products, thus influencing the adoption of these pigments in textiles, cosmetics, and various consumer goods. Furthermore, the ongoing urbanization in these markets leads to a higher demand for architectural coatings and paints, further fueling the integration of fluorescent pigments into these products.

Globalization and increased international trade have also played a crucial role in propelling the market for fluorescent pigments in emerging markets. The exchange of ideas, technologies, and products across borders has facilitated the integration of advanced pigment technologies, making fluorescent pigments more accessible and desirable. Additionally, emerging markets are becoming integral players in global supply chains, influencing the manufacturing landscape and contributing to the increased utilization of fluorescent pigments in various industries.

Restraint: Elevated cost of fluorescent pigment

The substantial cost of fluorescent pigments is a critical factor influencing their widespread adoption, particularly in industries where cost-effectiveness is paramount. One primary determinant is the complexity inherent in the manufacturing processes of fluorescent pigments. The synthesis and formulation of these pigments necessitate precision and specialization, demanding advanced equipment and intricate technologies. This complexity not only increases production time but also requires a higher level of expertise, consequently driving up manufacturing costs. Raw material costs constitute another pivotal component of the overall expense associated with fluorescent pigments. Certain formulations incorporate unique or specialized compounds, contributing to the comparatively high cost of these raw materials.

The process of developing innovative fluorescent pigments with enhanced properties further escalates costs through substantial investments in research and development (R&D). The continuous pursuit of improved performance characteristics, color stability, and adherence to stringent regulatory standards necessitates ongoing R&D efforts. These endeavors, while critical for maintaining a competitive edge, contribute significantly to the overall cost structure of fluorescent pigments.

Furthermore, the specialized nature of fluorescent pigments, designed for applications demanding unique properties such as fluorescence under UV light, presents challenges in achieving economies of scale. The limited scope of these applications results in lower demand and production volumes, which, in turn, can increase the per-unit production costs. This niche characteristic makes it challenging for fluorescent pigments to attain the cost competitiveness enjoyed by more widely adopted pigments.

Opportunity: Expanding use in 3D printing

The burgeoning landscape of 3D printing technology unfurls a compelling frontier of opportunity for the fluorescent pigment market. Positioned at the confluence of innovation and aesthetics, fluorescent pigments emerge as pivotal components poised for integration into 3D printing materials. This strategic assimilation facilitates the production of visually striking and dynamically colored 3D-printed objects, resonating across diverse industries, including art, design, and manufacturing.

Within the artistic domain, fluorescent pigments unlock a myriad of possibilities, empowering artists and designers to infuse their creations with intense and vibrant hues. The unique capacity of these pigments to emit fluorescence under specific lighting conditions adds a layer of complexity and allure to 3D-printed artistic expressions. This artistic fusion of technology and color not only captivates creative sensibilities but also positions fluorescent pigments as catalysts for pushing the envelope of design boundaries. From a commercial standpoint, enterprises entrenched in the 3D printing sector can strategically leverage the distinctive features of fluorescent pigments to carve out a competitive edge. In alignment with prevailing customization trends observed in industries such as consumer goods and promotional products, the integration of fluorescent pigments facilitates the production of bespoke and visually striking 3D-printed items. This strategic alignment with customization trends positions businesses for differentiation and heightened consumer appeal. Moreover, the utility of fluorescent pigments extends beyond artistic and commercial realms. In sectors such as healthcare, the integration of fluorescent pigments in 3D printing can play a pivotal role in the creation of anatomical models for surgical planning and medical education. The ability to incorporate vivid colors into these models enhances their accuracy and utility, offering surgeons and medical professionals a comprehensive visualization tool.

Challenge: Complex manufacturing process

The production of fluorescent pigments involves highly complex manufacturing processes, presenting challenges that extend across scalability, efficiency, and cost-effectiveness.  The intricate manufacturing processes involved in producing fluorescent pigments encompass several key stages, each demanding precision and specialized techniques. The formulation phase is critical, requiring the careful blending of specific chemical compounds to achieve the desired fluorescent properties. This formulation is followed by the synthesis process, where the compounds undergo reactions under controlled conditions to produce the fluorescent pigments. Businesses in this sector face challenges related to scalability, particularly when aiming to expand production volumes. The complexity of these processes may present hurdles in seamlessly increasing output while maintaining the necessary precision and quality. Ensuring efficiency throughout these manufacturing stages is imperative. From raw material handling to synthesis and finishing, optimizing workflows and minimizing waste become focal points for enhancing efficiency.

Cost-effectiveness emerges as a central concern due to the specialized nature of the materials involved and the need for advanced equipment. The raw materials involved, often consisting of unique and specialized compounds, contribute significantly to the overall production expenses. As these materials may be sourced from limited suppliers or involve intricate extraction processes, businesses face challenges related to supply chain dynamics and cost fluctuations.

Fluorescent Pigment Market: Ecosystem

Fluorescent Pigment  Market Ecosystem

Source: Secondary Research, Interviews with Experts, and MarketsandMarkets Analysis

Security and currency type Segment type was the largest segment for fluorescent pigment market in 2022, in terms of value."

The security and currency segment constitutes a critical and specialized niche within the fluorescent pigment market. Fluorescent pigments play an integral role in this sector, primarily focusing on anti-counterfeiting measures and enhancing the security features of currency and important documents. The unique properties of fluorescent pigments, which emit visible light when exposed to ultraviolet (UV) light, provide a distinct advantage in creating intricate and tamper-evident security features.

In currency applications, fluorescent pigments are often incorporated into the printing process to produce elements such as threads, inks, and security strips. These pigments contribute to the development of complex and visually striking designs that are not easily replicable, thus safeguarding against counterfeit currency production. The ability of fluorescent pigments to emit specific and identifiable colors under UV light adds an additional layer of authenticity verification.

"Asia Pacific was the fastest growing market for fluorescent pigment in 2022, in terms of value.

Asia Pacific was the fastest growing market for global fluorescent pigment market, in terms of value, in 2022. considered an optimal market for fluorescent pigments owing to several compelling factors. First and foremost, the region's robust industrialization and economic growth have spurred significant demand across diverse industries, establishing a substantial market for specialty products such as fluorescent pigments. Rapid urbanization and ongoing infrastructure development, particularly in countries such as China and India, contribute to an increased application of these pigments in construction, safety markings, and architectural coatings.

Fluorescent Pigment  Market by Region

To know about the assumptions considered for the study, download the pdf brochure

Key Market Players

The key players in this market Radiant Color NV (Belgium), Luminochem (Hungary), Wanlong Chemical Co., Ltd. (China), Sinloihi Co., Ltd. (Japan), Wuxi Minghui International Trading Co., Ltd. (China), DayGlo Color Corp. (US), Aron Universal Limited (India), Vicome Corp. (China), Hangzhou Aibai Chemical Co., Ltd. (China), Brilliant Group Inc. (US).

Read More: Fluorescent Pigments Companies

Want to explore hidden markets that can drive new revenue in Fluorescent Pigment Market?

Scope of the Report

Report Metric

Details

Years considered for the study

2019-2028

Base Year

2022

Forecast period

2023–2028

Units considered

Kiloton; Value (USD Million/Billion)

Segments

Formulation, Characteristic type, Type, Intensity, End-use Industry Application, and Region

Regions

Asia Pacific, North America, Europe, Middle East & Africa, and South America

Companies

Radiant Color NV (Belgium), Luminochem (Hungary), Wanlong Chemical Co., Ltd. (China), Sinloihi Co., Ltd. (Japan), Wuxi Minghui International Trading Co., Ltd. (China), DayGlo Color Corp. (US), Aron Universal Limited (India), Vicome Corp. (China), Hangzhou Aibai Chemical Co., Ltd. (China), Brilliant Group Inc. (US).

This report categorizes the global fluorescent pigment market based on formulation, characteristic type, type, intensity, end-use industry, application, and region.

Based on the formulation:
  • Organic Fluorescent Pigment
  • Inorganic Fluorescent Pigment
Based on the characteristic type:
  • Thermoplastic
  • Thermoset
Based on the type:
  • Dayglow Pigments
  • Phosphorescent Pigments
  • Other Types
Based on the intensity:
  • High Intensity
  • Medium Intensity
  • Low Intensity
Based on the application:
  • Printing Inks / Graphic Arts
  • Paints & Coatings
  • Plastics
  • Other Applications
Based on the end-use industry:
  • Security & Currency
  • Packaging
  • Automotive & Transportation
  • Building & Construction
  • Textile
  • Cosmetics
  • Other End-Use Industries
Based on the region:
  • Asia Pacific
  • Europe
  • North America
  • South America
  • Middle East & Africa

Recent Developments

  • In April 2019, DayGlo Introduced the second generation of legal fluorescent colorants for cosmetics. It can be used in oil-based, and solvent or water born formulations.

Frequently Asked Questions (FAQ):

To speak to our analyst for a discussion on the above findings, click Speak to Analyst

Exclusive indicates content/data unique to MarketsandMarkets and not available with any competitors.

INTRODUCTION
29
RESEARCH METHODOLOGY
33
EXECUTIVE SUMMARY
42
PREMIUM INSIGHTS
47
MARKET OVERVIEW
51
  • 5.1 INTRODUCTION
  • 5.2 MARKET DYNAMICS
    DRIVERS
    - Growing consumer goods and construction industries in emerging economies
    - Increasing use in security & currency and packaging industries
    - Consumer preference for vibrant colors
    RESTRAINTS
    - High cost of fluorescent pigments
    OPPORTUNITIES
    - Expanding use in 3D printing
    - Trend toward customization
    CHALLENGES
    - Complex manufacturing processes
    - Alternative coloration technologies and pigments
  • 5.3 VALUE CHAIN ANALYSIS
    RAW MATERIAL SUPPLIERS
    MANUFACTURERS
    DISTRIBUTORS
    END CONSUMERS
  • 5.4 PORTER’S FIVE FORCES ANALYSIS
    THREAT OF NEW ENTRANTS
    THREAT OF SUBSTITUTES
    BARGAINING POWER OF SUPPLIERS
    BARGAINING POWER OF BUYERS
    INTENSITY OF COMPETITIVE RIVALRY
  • 5.5 PATENT ANALYSIS
    METHODOLOGY
    DOCUMENT TYPES
    PATENT PUBLICATION TRENDS IN LAST 10 YEARS
    INSIGHTS
    JURISDICTION ANALYSIS
    TOP 10 PATENT APPLICANTS
    TOP 10 PATENT OWNERS IN LAST 10 YEARS
  • 5.6 PRICING ANALYSIS
    AVERAGE SELLING PRICE TREND, BY REGION
    AVERAGE SELLING PRICE TREND OF KEY PLAYERS, BY END-USE INDUSTRY
    AVERAGE SELLING PRICE TREND, BY FORMULATION (USD/KG)
  • 5.7 ECOSYSTEM MAPPING
  • 5.8 TECHNOLOGY ANALYSIS
    NANOTECHNOLOGY
    BIOFLUORESCENCE
    SMART PIGMENTS
  • 5.9 TRADE ANALYSIS
    IMPORT SCENARIO OF SYNTHETIC ORGANIC PIGMENTS
    EXPORT SCENARIO OF SYNTHETIC ORGANIC PIGMENTS
  • 5.10 MACROECONOMIC OVERVIEW AND KEY TRENDS
    PLASTIC PRODUCTION
  • 5.11 REGULATORY LANDSCAPE
    NORTH AMERICA
    EUROPEAN UNION
    ASIA PACIFIC
    MIDDLE EAST & AFRICA AND SOUTH AMERICA
    REGULATORY BODIES, GOVERNMENT AGENCIES, AND OTHER ORGANIZATIONS
  • 5.12 TRENDS AND DISRUPTIONS IMPACTING CUSTOMERS’ BUSINESSES
  • 5.13 KEY CONFERENCES AND EVENTS
  • 5.14 KEY STAKEHOLDERS AND BUYING CRITERIA
    INFLUENCE OF STAKEHOLDERS IN BUYING PROCESS
    BUYING CRITERIA
    - Quality
    - Service
  • 5.15 CASE STUDY ANALYSIS
    XAVIER UNIVERSITY
    FORENSIC SCIENCE
  • 5.16 INVESTMENT AND FUNDING SCENARIO
  • 5.17 FUNDING, BY USE CASE/APPLICATION
FLUORESCENT PIGMENTS MARKET, BY FORMULATION
77
  • 6.1 INTRODUCTION
  • 6.2 ORGANIC
    ECO-FRIENDLY OPTION TO CREATE VIBRANT COLORS
  • 6.3 INORGANIC
    IDEAL FOR APPLICATIONS REQUIRING COLOR FASTNESS
FLUORESCENT PIGMENTS MARKET, BY CHARACTERISTIC TYPE
80
  • 7.1 INTRODUCTION
  • 7.2 THERMOPLASTIC
    STRAIGHTFORWARD INTEGRATION INTO MANUFACTURING PROCESSES
    - Benzothiazole derivatives
    - Anthracene derivatives
    - Coumarins pigments
  • 7.3 THERMOSET
    IDEAL FOR USE IN APPLICATIONS DEMANDING THERMAL STABILITY
    - Azo pigments
    - Phthalocyanine pigments
    - Triarylamine pigments
    - Benzimidazolone pigments
    - Benzoguanamine-based pigments
FLUORESCENT PIGMENTS MARKET, BY TYPE
85
  • 8.1 INTRODUCTION
  • 8.2 DAYLIGHT FLUORESCENT
    AVAILABILITY IN VARIOUS COLORS LEADS TO CUSTOMIZED FORMULATIONS
    - Zinc sulfide
    - Aromatic derivatives
  • 8.3 PHOSPHORESCENT
    REQUIRES EXPOSURE TO LIGHT TO CHARGE UP
    - Zinc sulfide
    - Strontium aluminate
  • 8.4 OTHER TYPES
FLUORESCENT PIGMENTS MARKET, BY INTENSITY
90
  • 9.1 INTRODUCTION
  • 9.2 HIGH
    USED IN APPLICATIONS REQUIRING MAXIMUM BRIGHTNESS AND VISIBILITY
  • 9.3 MEDIUM
    USED IN APPLICATIONS WHERE EXTREMELY HIGH BRIGHTNESS IS NOT NECESSARY
  • 9.4 LOW
    SUITABLE FOR ART AND CRAFT PROJECTS REQUIRING LOW LEVEL OF FLUORESCENCE
FLUORESCENT PIGMENTS MARKET, BY APPLICATION
94
  • 10.1 INTRODUCTION
  • 10.2 PRINTING INKS/GRAPHIC ARTS
    LARGEST APPLICATION OF FLUORESCENT PIGMENTS
  • 10.3 PAINTS & COATINGS
    SECOND-LARGEST APPLICATION OF FLUORESCENT PIGMENTS
  • 10.4 PLASTICS
    FLUORESCENT PIGMENTS WIDELY USED IN PROMOTIONAL ACTIVITIES
  • 10.5 OTHER APPLICATIONS
FLUORESCENT PIGMENTS MARKET, BY END-USE INDUSTRY
98
  • 11.1 INTRODUCTION
  • 11.2 SECURITY & CURRENCY
    LARGEST END-USE INDUSTRY OF FLUORESCENT PIGMENTS
  • 11.3 PACKAGING
    WIDE USE OF FLUORESCENT PIGMENTS FOR BRAND DIFFERENTIATION
  • 11.4 AUTOMOTIVE & TRANSPORTATION
    USE OF FLUORESCENT PIGMENTS IN VEHICLE DESIGNS CONTRIBUTE TO VEHICLE SAFETY AND BRAND RECOGNITION
  • 11.5 BUILDING & CONSTRUCTION
    RESISTANCE TO FADING OF FLUORESCENT PIGMENTS HELPS IN WITHSTANDING ENVIRONMENTAL STRESSORS
  • 11.6 TEXTILES
    WIDESPREAD USE OF FLUORESCENT PIGMENTS IN VARIOUS PRINTING TECHNIQUES
  • 11.7 COSMETICS
    EXTENSIVE USE OF FLUORESCENT PIGMENTS IN VARIOUS COSMETIC FORMULATIONS
  • 11.8 OTHER END-USE INDUSTRIES
FLUORESCENT PIGMENTS MARKET, BY REGION
104
  • 12.1 INTRODUCTION
  • 12.2 NORTH AMERICA
    RECESSION IMPACT ANALYSIS
    US
    - Booming packaging industry to drive market
    CANADA
    - Diversified construction industry to drive market
    MEXICO
    - Need for cost-effective and efficient manufacturing of packaging solutions to drive market
  • 12.3 ASIA PACIFIC
    RECESSION IMPACT ANALYSIS
    CHINA
    - Rising infrastructure development projects to drive market
    INDIA
    - Expanding e-commerce sector to drive market
    SOUTH KOREA
    - Extensive use in automotive industry to drive market
    JAPAN
    - Growing demand for safe and innovative packaging solutions to drive market
    AUSTRALIA
    - Emerging trend of interactive packaging to drive market
    REST OF ASIA PACIFIC
  • 12.4 EUROPE
    RECESSION IMPACT ANALYSIS
    GERMANY
    - Growth of automotive coating industry to drive market
    FRANCE
    - Ongoing construction projects to drive market
    UK
    - Rising use of fluorescent pigments by automotive manufacturers to drive market
    ITALY
    - Increasing demand for plastic packaging from retail, food, and healthcare industries to drive market
    SPAIN
    - Surging demand for innovative packaging to drive market
    REST OF EUROPE
  • 12.5 MIDDLE EAST & AFRICA
    RECESSION IMPACT ANALYSIS
    GCC COUNTRIES
    - Saudi Arabia
    - UAE
    - Other GCC Countries
    SOUTH AFRICA
    - Government initiatives to promote construction industry growth to drive market
    REST OF MIDDLE EAST & AFRICA
  • 12.6 SOUTH AMERICA
    RECESSION IMPACT ANALYSIS
    BRAZIL
    - Rise in construction projects to drive market
    ARGENTINA
    - Focus on economic development to drive market
    REST OF SOUTH AMERICA
COMPETITIVE LANDSCAPE
193
  • 13.1 INTRODUCTION
  • 13.2 STRATEGIES ADOPTED BY KEY PLAYERS
  • 13.3 REVENUE ANALYSIS, 2022
  • 13.4 MARKET SHARE ANALYSIS, 2022
  • 13.5 COMPANY EVALUATION MATRIX, 2022
    STARS
    EMERGING LEADERS
    PERVASIVE PLAYERS
    PARTICIPANTS
    COMPANY FOOTPRINT
  • 13.6 START-UP/SME EVALUATION MATRIX, 2022
    PROGRESSIVE COMPANIES
    RESPONSIVE COMPANIES
    DYNAMIC COMPANIES
    STARTING BLOCKS
    COMPETITIVE BENCHMARKING
  • 13.7 COMPANY VALUATION
  • 13.8 BRAND/PRODUCT COMPARISON
  • 13.9 COMPETITIVE SCENARIO
    PRODUCT LAUNCHES
    DEALS
    EXPANSIONS
COMPANY PROFILES
210
  • 14.1 KEY PLAYERS
    RADIANT COLOR NV
    - Business overview
    - Products offered
    - MnM view
    LUMINOCHEM
    - Business overview
    - Products offered
    - Recent developments
    - MnM view
    SINLOIHI CO., LTD.
    - Business overview
    - Products offered
    - MnM view
    WUXI MINGHUI INTERNATIONAL TRADING CO., LTD.
    - Business overview
    - Products offered
    - MnM view
    DAYGLO COLOR CORP.
    - Business overview
    - Products offered
    - Recent developments
    - MnM view
    WANLONG CHEMICAL CO., LTD.
    - Business overview
    - Products offered
    - MnM view
    ARON UNIVERSAL LIMITED
    - Business overview
    - Products offered
    - MnM view
    VICOME CORP.
    - Business overview
    - Products offered
    - Recent developments
    - MnM view
    HANGZHOU AIBAI CHEMICAL CO., LTD.
    - Business overview
    - Products offered
    - MnM view
    BRILLIANT GROUP, INC.
    - Business overview
    - Products offered
    - Recent developments
    - MnM view
  • 14.2 OTHER PLAYERS
    HUANGSHAN JIAJIA FLUORESCENT MATERIAL CO., LTD.
    - Business overview
    - Products offered
    JIANGSU LIWANG TECHNOLOGY CO., LTD.
    - Business overview
    - Products offered
    JIAOLING BAILIN BIOTECHNOLOGY CO., LTD.
    - Business overview
    - Products offered
    ARALON
    - Business overview
    - Products offered
    NEMOTO & CO., LTD.
    - Business overview
    - Products offered
    FLUORCOLORS
    - Business overview
    - Products offered
    SPECTRA COLORS CO., LTD.
    - Business overview
    - Products offered
    UKSEUNG CHEMICAL CO., LTD.
    - Business overview
    - Products offered
    J-COLOR
    - Business overview
    - Products offered
    NANOCHEMITEK (YANGZHOU)
    - Business overview
    - Products offered
    QUINGDAO TOPWELL CHEMICALS MATERIALS CO., LTD.
    - Business overview
    - Products offered
    ORGANIC DYES AND PIGMENTS
    - Business overview
    - Products offered
    S D INTERNATIONAL
    - Business overview
    - Products offered
    VIBFAST PIGMENTS PVT. LTD.
    - Business overview
    - Products offered
    NEOVCHEM
    - Business overview
    - Products offered
APPENDIX
249
  • 15.1 DISCUSSION GUIDE
  • 15.2 KNOWLEDGESTORE: MARKETSANDMARKETS’ SUBSCRIPTION PORTAL
  • 15.3 CUSTOMIZATION OPTIONS
  • 15.4 RELATED REPORTS
  • 15.5 AUTHOR DETAILS
LIST OF TABLES
 
  • TABLE 1 MAJOR DEVELOPMENTS IN CONSTRUCTION INDUSTRY
  • TABLE 2 ALTERNATIVE COLORATION TECHNOLOGIES AND PIGMENTS
  • TABLE 3 IMPACT OF PORTER’S FIVE FORCES
  • TABLE 4 AVERAGE SELLING PRICE TREND OF KEY PLAYERS FOR TOP THREE END-USE INDUSTRIES (USD/KG)
  • TABLE 5 ROLE OF COMPANIES IN ECOSYSTEM
  • TABLE 6 PLASTIC PRODUCTION (MILLION TON)
  • TABLE 7 REGULATORY BODIES, GOVERNMENT AGENCIES, AND OTHER ORGANIZATIONS
  • TABLE 8 KEY CONFERENCES AND EVENTS, 2024–2025
  • TABLE 9 INFLUENCE OF STAKEHOLDERS ON BUYING PROCESS FOR TOP THREE END-USE INDUSTRIES
  • TABLE 10 KEY BUYING CRITERIA FOR TOP THREE END-USE INDUSTRIES
  • TABLE 11 FLUORESCENT PIGMENTS MARKET, BY FORMULATION, 2019–2022 (TON)
  • TABLE 12 FLUORESCENT PIGMENTS MARKET, BY FORMULATION, 2023–2028 (TON)
  • TABLE 13 FLUORESCENT PIGMENTS MARKET, BY FORMULATION, 2019–2022 (USD THOUSAND)
  • TABLE 14 FLUORESCENT PIGMENTS MARKET, BY FORMULATION, 2023–2028 (USD THOUSAND)
  • TABLE 15 FLUORESCENT PIGMENTS MARKET, BY CHARACTERISTIC TYPE, 2019–2022 (TON)
  • TABLE 16 FLUORESCENT PIGMENTS MARKET, BY CHARACTERISTIC TYPE, 2023–2028 (TON)
  • TABLE 17 FLUORESCENT PIGMENTS MARKET, BY CHARACTERISTIC TYPE, 2019–2022 (USD THOUSAND)
  • TABLE 18 FLUORESCENT PIGMENTS MARKET, BY CHARACTERISTIC TYPE, 2023–2028 (USD THOUSAND)
  • TABLE 19 FLUORESCENT PIGMENTS MARKET, BY TYPE, 2019–2022 (TON)
  • TABLE 20 FLUORESCENT PIGMENTS MARKET, BY TYPE, 2023–2028 (TON)
  • TABLE 21 FLUORESCENT PIGMENTS MARKET, BY TYPE, 2019–2022 (USD THOUSAND)
  • TABLE 22 FLUORESCENT PIGMENTS MARKET, BY TYPE, 2023–2028 (USD THOUSAND)
  • TABLE 23 FLUORESCENT PIGMENTS MARKET, BY INTENSITY, 2019–2022 (TON)
  • TABLE 24 FLUORESCENT PIGMENTS MARKET, BY INTENSITY, 2023–2028 (TON)
  • TABLE 25 FLUORESCENT PIGMENTS MARKET, BY INTENSITY, 2019–2022 (USD THOUSAND)
  • TABLE 26 FLUORESCENT PIGMENTS MARKET, BY INTENSITY, 2023–2028 (USD THOUSAND)
  • TABLE 27 FLUORESCENT PIGMENTS MARKET, BY APPLICATION, 2019–2022 (TON)
  • TABLE 28 FLUORESCENT PIGMENTS MARKET, BY APPLICATION, 2023–2028 (TON)
  • TABLE 29 FLUORESCENT PIGMENTS MARKET, BY APPLICATION, 2019–2022 (USD THOUSAND)
  • TABLE 30 FLUORESCENT PIGMENTS MARKET, BY APPLICATION, 2023–2028 (USD THOUSAND)
  • TABLE 31 FLUORESCENT PIGMENTS MARKET, BY END-USE INDUSTRY, 2019–2022 (TON)
  • TABLE 32 FLUORESCENT PIGMENTS MARKET, BY END-USE INDUSTRY, 2023–2028 (TON)
  • TABLE 33 FLUORESCENT PIGMENTS MARKET, BY END-USE INDUSTRY, 2019–2022 (USD THOUSAND)
  • TABLE 34 FLUORESCENT PIGMENTS MARKET, BY END-USE INDUSTRY, 2023–2028 (USD THOUSAND)
  • TABLE 35 FLUORESCENT PIGMENTS MARKET, BY REGION, 2019–2022 (TON)
  • TABLE 36 FLUORESCENT PIGMENTS MARKET, BY REGION, 2023–2028 (TON)
  • TABLE 37 FLUORESCENT PIGMENTS MARKET, BY REGION, 2019–2022 (USD THOUSAND)
  • TABLE 38 FLUORESCENT PIGMENTS MARKET, BY REGION, 2023–2028 (USD THOUSAND)
  • TABLE 39 NORTH AMERICA: FLUORESCENT PIGMENTS MARKET, BY COUNTRY, 2019–2022 (TON)
  • TABLE 40 NORTH AMERICA: FLUORESCENT PIGMENTS MARKET, BY COUNTRY, 2023–2028 (TON)
  • TABLE 41 NORTH AMERICA: FLUORESCENT PIGMENTS MARKET, BY COUNTRY, 2019–2022 (USD THOUSAND)
  • TABLE 42 NORTH AMERICA: FLUORESCENT PIGMENTS MARKET, BY COUNTRY, 2023–2028 (USD THOUSAND)
  • TABLE 43 NORTH AMERICA: FLUORESCENT PIGMENTS MARKET, BY FORMULATION, 2019–2022 (TON)
  • TABLE 44 NORTH AMERICA: FLUORESCENT PIGMENTS MARKET, BY FORMULATION, 2023–2028 (TON)
  • TABLE 45 NORTH AMERICA: FLUORESCENT PIGMENTS MARKET, BY FORMULATION, 2019–2022 (USD THOUSAND)
  • TABLE 46 NORTH AMERICA: FLUORESCENT PIGMENTS MARKET, BY FORMULATION, 2023–2028 (USD THOUSAND)
  • TABLE 47 NORTH AMERICA: FLUORESCENT PIGMENTS MARKET, BY CHARACTERISTIC TYPE, 2019–2022 (TON)
  • TABLE 48 NORTH AMERICA: FLUORESCENT PIGMENTS MARKET, BY CHARACTERISTIC TYPE, 2023–2028 (TON)
  • TABLE 49 NORTH AMERICA: FLUORESCENT PIGMENTS MARKET, BY CHARACTERISTIC TYPE, 2019–2022 (USD THOUSAND)
  • TABLE 50 NORTH AMERICA: FLUORESCENT PIGMENTS MARKET, BY CHARACTERISTIC TYPE, 2023–2028 (USD THOUSAND)
  • TABLE 51 NORTH AMERICA: FLUORESCENT PIGMENTS MARKET, BY TYPE, 2019–2022 (TON)
  • TABLE 52 NORTH AMERICA: FLUORESCENT PIGMENTS MARKET, BY TYPE, 2023–2028 (TON)
  • TABLE 53 NORTH AMERICA: FLUORESCENT PIGMENTS MARKET, BY TYPE, 2019–2022 (USD THOUSAND)
  • TABLE 54 NORTH AMERICA: FLUORESCENT PIGMENTS MARKET, BY TYPE, 2023–2028 (USD THOUSAND)
  • TABLE 55 NORTH AMERICA: FLUORESCENT PIGMENTS MARKET, BY INTENSITY, 2019–2022 (TON)
  • TABLE 56 NORTH AMERICA: FLUORESCENT PIGMENTS MARKET, BY INTENSITY, 2023–2028 (TON)
  • TABLE 57 NORTH AMERICA: FLUORESCENT PIGMENTS MARKET, BY INTENSITY, 2019–2022 (USD THOUSAND)
  • TABLE 58 NORTH AMERICA: FLUORESCENT PIGMENTS MARKET, BY INTENSITY, 2023–2028 (USD THOUSAND)
  • TABLE 59 NORTH AMERICA: FLUORESCENT PIGMENTS MARKET, BY APPLICATION, 2019–2022 (TON)
  • TABLE 60 NORTH AMERICA: FLUORESCENT PIGMENTS MARKET, BY APPLICATION, 2023–2028 (TON)
  • TABLE 61 NORTH AMERICA: FLUORESCENT PIGMENTS MARKET, BY APPLICATION, 2019–2022 (USD THOUSAND)
  • TABLE 62 NORTH AMERICA: FLUORESCENT PIGMENTS MARKET, BY APPLICATION, 2023–2028 (USD THOUSAND)
  • TABLE 63 NORTH AMERICA: FLUORESCENT PIGMENTS MARKET, BY END-USE INDUSTRY, 2019–2022 (TON)
  • TABLE 64 NORTH AMERICA: FLUORESCENT PIGMENTS MARKET, BY END-USE INDUSTRY, 2023–2028 (TON)
  • TABLE 65 NORTH AMERICA: FLUORESCENT PIGMENTS MARKET, BY END-USE INDUSTRY, 2019–2022 (USD THOUSAND)
  • TABLE 66 NORTH AMERICA: FLUORESCENT PIGMENTS MARKET, BY END-USE INDUSTRY, 2023–2028 (USD THOUSAND)
  • TABLE 67 US: FLUORESCENT PIGMENTS MARKET, BY END-USE INDUSTRY, 2019–2022 (TON)
  • TABLE 68 US: FLUORESCENT PIGMENTS MARKET, BY END-USE INDUSTRY, 2023–2028 (TON)
  • TABLE 69 US: FLUORESCENT PIGMENTS MARKET, BY END-USE INDUSTRY, 2019–2022 (USD THOUSAND)
  • TABLE 70 US: FLUORESCENT PIGMENTS MARKET, BY END-USE INDUSTRY, 2023–2028 (USD THOUSAND)
  • TABLE 71 CANADA: FLUORESCENT PIGMENTS MARKET, BY END-USE INDUSTRY, 2019–2022 (TON)
  • TABLE 72 CANADA: FLUORESCENT PIGMENTS MARKET, BY END-USE INDUSTRY, 2023–2028 (TON)
  • TABLE 73 CANADA: FLUORESCENT PIGMENTS MARKET, BY END-USE INDUSTRY, 2019–2022 (USD THOUSAND)
  • TABLE 74 CANADA: FLUORESCENT PIGMENTS MARKET, BY END-USE INDUSTRY, 2023–2028 (USD THOUSAND)
  • TABLE 75 MEXICO: FLUORESCENT PIGMENTS MARKET, BY END-USE INDUSTRY, 2019–2022 (TON)
  • TABLE 76 MEXICO: FLUORESCENT PIGMENTS MARKET, BY END-USE INDUSTRY, 2023–2028 (TON)
  • TABLE 77 MEXICO: FLUORESCENT PIGMENTS MARKET, BY END-USE INDUSTRY, 2019–2022 (USD THOUSAND)
  • TABLE 78 MEXICO: FLUORESCENT PIGMENTS MARKET, BY END-USE INDUSTRY, 2023–2028 (USD THOUSAND)
  • TABLE 79 ASIA PACIFIC: FLUORESCENT PIGMENTS MARKET, BY COUNTRY, 2019–2022 (TON)
  • TABLE 80 ASIA PACIFIC: FLUORESCENT PIGMENTS MARKET, BY COUNTRY, 2023–2028 (TON)
  • TABLE 81 ASIA PACIFIC: FLUORESCENT PIGMENTS MARKET, BY COUNTRY, 2019–2022 (USD THOUSAND)
  • TABLE 82 ASIA PACIFIC: FLUORESCENT PIGMENTS MARKET, BY COUNTRY, 2023–2028 (USD THOUSAND)
  • TABLE 83 ASIA PACIFIC: FLUORESCENT PIGMENTS MARKET, BY FORMULATION, 2019–2022 (TON)
  • TABLE 84 ASIA PACIFIC: FLUORESCENT PIGMENTS MARKET, BY FORMULATION, 2023–2028 (TON)
  • TABLE 85 ASIA PACIFIC: FLUORESCENT PIGMENTS MARKET, BY FORMULATION, 2019–2022 (USD THOUSAND)
  • TABLE 86 ASIA PACIFIC: FLUORESCENT PIGMENTS MARKET, BY FORMULATION, 2023–2028 (USD THOUSAND)
  • TABLE 87 ASIA PACIFIC: FLUORESCENT PIGMENTS MARKET, BY CHARACTERISTIC TYPE, 2019–2022 (TON)
  • TABLE 88 ASIA PACIFIC: FLUORESCENT PIGMENTS MARKET, BY CHARACTERISTIC TYPE, 2023–2028 (TON)
  • TABLE 89 ASIA PACIFIC: FLUORESCENT PIGMENTS MARKET, BY CHARACTERISTIC TYPE, 2019–2022 (USD THOUSAND)
  • TABLE 90 ASIA PACIFIC: FLUORESCENT PIGMENTS MARKET, BY CHARACTERISTIC TYPE, 2023–2028 (USD THOUSAND)
  • TABLE 91 ASIA PACIFIC: FLUORESCENT PIGMENTS MARKET, BY TYPE, 2019–2022 (TON)
  • TABLE 92 ASIA PACIFIC: FLUORESCENT PIGMENTS MARKET, BY TYPE, 2023–2028 (TON)
  • TABLE 93 ASIA PACIFIC: FLUORESCENT PIGMENTS MARKET, BY TYPE, 2019–2022 (USD THOUSAND)
  • TABLE 94 ASIA PACIFIC: FLUORESCENT PIGMENTS MARKET, BY TYPE, 2023–2028 (USD THOUSAND)
  • TABLE 95 ASIA PACIFIC: FLUORESCENT PIGMENTS MARKET, BY INTENSITY, 2019–2022 (TON)
  • TABLE 96 ASIA PACIFIC: FLUORESCENT PIGMENTS MARKET, BY INTENSITY, 2023–2028 (TON)
  • TABLE 97 ASIA PACIFIC: FLUORESCENT PIGMENTS MARKET, BY INTENSITY, 2019–2022 (USD THOUSAND)
  • TABLE 98 ASIA PACIFIC: FLUORESCENT PIGMENTS MARKET, BY INTENSITY, 2023–2028 (USD THOUSAND)
  • TABLE 99 ASIA PACIFIC: FLUORESCENT PIGMENTS MARKET, BY APPLICATION, 2019–2022 (TON)
  • TABLE 100 ASIA PACIFIC: FLUORESCENT PIGMENTS MARKET, BY APPLICATION, 2023–2028 (TON)
  • TABLE 101 ASIA PACIFIC: FLUORESCENT PIGMENTS MARKET, BY APPLICATION, 2019–2022 (USD THOUSAND)
  • TABLE 102 ASIA PACIFIC: FLUORESCENT PIGMENTS MARKET, BY APPLICATION, 2023–2028 (USD THOUSAND)
  • TABLE 103 ASIA PACIFIC: FLUORESCENT PIGMENTS MARKET, BY END-USE INDUSTRY, 2019–2022 (TON)
  • TABLE 104 ASIA PACIFIC: FLUORESCENT PIGMENTS MARKET, BY END-USE INDUSTRY, 2023–2028 (TON)
  • TABLE 105 ASIA PACIFIC: FLUORESCENT PIGMENTS MARKET, BY END-USE INDUSTRY, 2019–2022 (USD THOUSAND)
  • TABLE 106 ASIA PACIFIC: FLUORESCENT PIGMENTS MARKET, BY END-USE INDUSTRY, 2023–2028 (USD THOUSAND)
  • TABLE 107 CHINA: FLUORESCENT PIGMENTS MARKET, BY END-USE INDUSTRY, 2019–2022 (TON)
  • TABLE 108 CHINA: FLUORESCENT PIGMENTS MARKET, BY END-USE INDUSTRY, 2023–2028 (TON)
  • TABLE 109 CHINA: FLUORESCENT PIGMENTS MARKET, BY END-USE INDUSTRY, 2019–2022 (USD THOUSAND)
  • TABLE 110 CHINA: FLUORESCENT PIGMENTS MARKET, BY END-USE INDUSTRY, 2023–2028 (USD THOUSAND)
  • TABLE 111 INDIA: FLUORESCENT PIGMENTS MARKET, BY END-USE INDUSTRY, 2019–2022 (TON)
  • TABLE 112 INDIA: FLUORESCENT PIGMENTS MARKET, BY END-USE INDUSTRY, 2023–2028 (TON)
  • TABLE 113 INDIA: FLUORESCENT PIGMENTS MARKET, BY END-USE INDUSTRY, 2019–2022 (USD THOUSAND)
  • TABLE 114 INDIA: FLUORESCENT PIGMENTS MARKET, BY END-USE INDUSTRY, 2023–2028 (USD THOUSAND)
  • TABLE 115 SOUTH KOREA: FLUORESCENT PIGMENTS MARKET, BY END-USE INDUSTRY, 2019–2022 (TON)
  • TABLE 116 SOUTH KOREA: FLUORESCENT PIGMENTS MARKET, BY END-USE INDUSTRY, 2023–2028 (TON)
  • TABLE 117 SOUTH KOREA: FLUORESCENT PIGMENTS MARKET, BY END-USE INDUSTRY, 2019–2022 (USD THOUSAND)
  • TABLE 118 SOUTH KOREA: FLUORESCENT PIGMENTS MARKET, BY END-USE INDUSTRY, 2023–2028 (USD THOUSAND)
  • TABLE 119 JAPAN: FLUORESCENT PIGMENTS MARKET, BY END-USE INDUSTRY, 2019–2022 (TON)
  • TABLE 120 JAPAN: FLUORESCENT PIGMENTS MARKET, BY END-USE INDUSTRY, 2023–2028 (TON)
  • TABLE 121 JAPAN: FLUORESCENT PIGMENTS MARKET, BY END-USE INDUSTRY, 2019–2022 (USD THOUSAND)
  • TABLE 122 JAPAN: FLUORESCENT PIGMENTS MARKET, BY END-USE INDUSTRY, 2023–2028 (USD THOUSAND)
  • TABLE 123 AUSTRALIA: FLUORESCENT PIGMENTS MARKET, BY END-USE INDUSTRY, 2019–2022 (TON)
  • TABLE 124 AUSTRALIA: FLUORESCENT PIGMENTS MARKET, BY END-USE INDUSTRY, 2023–2028 (TON)
  • TABLE 125 AUSTRALIA: FLUORESCENT PIGMENTS MARKET, BY END-USE INDUSTRY, 2019–2022 (USD THOUSAND)
  • TABLE 126 AUSTRALIA: FLUORESCENT PIGMENTS MARKET, BY END-USE INDUSTRY, 2023–2028 (USD THOUSAND)
  • TABLE 127 REST OF ASIA PACIFIC: FLUORESCENT PIGMENTS MARKET, BY END-USE INDUSTRY, 2019–2022 (TON)
  • TABLE 128 REST OF ASIA PACIFIC: FLUORESCENT PIGMENTS MARKET, BY END-USE INDUSTRY, 2023–2028 (TON)
  • TABLE 129 REST OF ASIA PACIFIC: FLUORESCENT PIGMENTS MARKET, BY END-USE INDUSTRY, 2019–2022 (USD THOUSAND)
  • TABLE 130 REST OF ASIA PACIFIC: FLUORESCENT PIGMENTS MARKET, BY END-USE INDUSTRY, 2023–2028 (USD THOUSAND)
  • TABLE 131 EUROPE: FLUORESCENT PIGMENTS MARKET, BY COUNTRY, 2019–2022 (TON)
  • TABLE 132 EUROPE: FLUORESCENT PIGMENTS MARKET, BY COUNTRY, 2023–2028 (TON)
  • TABLE 133 EUROPE: FLUORESCENT PIGMENTS MARKET, BY COUNTRY, 2019–2022 (USD THOUSAND)
  • TABLE 134 EUROPE: FLUORESCENT PIGMENTS MARKET, BY COUNTRY, 2023–2028 (USD THOUSAND)
  • TABLE 135 EUROPE: FLUORESCENT PIGMENTS MARKET, BY FORMULATION, 2019–2022 (TON)
  • TABLE 136 EUROPE: FLUORESCENT PIGMENTS MARKET, BY FORMULATION, 2023–2028 (TON)
  • TABLE 137 EUROPE: FLUORESCENT PIGMENTS MARKET, BY FORMULATION, 2019–2022 (USD THOUSAND)
  • TABLE 138 EUROPE: FLUORESCENT PIGMENTS MARKET, BY FORMULATION, 2023–2028 (USD THOUSAND)
  • TABLE 139 EUROPE: FLUORESCENT PIGMENTS MARKET, BY CHARACTERISTIC TYPE, 2019–2022 (TON)
  • TABLE 140 EUROPE: FLUORESCENT PIGMENTS MARKET, BY CHARACTERISTIC TYPE, 2023–2028 (TON)
  • TABLE 141 EUROPE: FLUORESCENT PIGMENTS MARKET, BY CHARACTERISTIC TYPE, 2019–2022 (USD THOUSAND)
  • TABLE 142 EUROPE: FLUORESCENT PIGMENTS MARKET, BY CHARACTERISTIC TYPE, 2023–2028 (USD THOUSAND)
  • TABLE 143 EUROPE: FLUORESCENT PIGMENTS MARKET, BY TYPE, 2019–2022 (TON)
  • TABLE 144 EUROPE: FLUORESCENT PIGMENTS MARKET, BY TYPE, 2023–2028 (TON)
  • TABLE 145 EUROPE: FLUORESCENT PIGMENTS MARKET, BY TYPE, 2019–2022 (USD THOUSAND)
  • TABLE 146 EUROPE: FLUORESCENT PIGMENTS MARKET, BY TYPE, 2023–2028 (USD THOUSAND)
  • TABLE 147 EUROPE: FLUORESCENT PIGMENTS MARKET, BY INTENSITY, 2019–2022 (TON)
  • TABLE 148 EUROPE: FLUORESCENT PIGMENTS MARKET, BY INTENSITY, 2023–2028 (TON)
  • TABLE 149 EUROPE: FLUORESCENT PIGMENTS MARKET, BY INTENSITY, 2019–2022 (USD THOUSAND)
  • TABLE 150 EUROPE: FLUORESCENT PIGMENTS MARKET, BY INTENSITY, 2023–2028 (USD THOUSAND)
  • TABLE 151 EUROPE: FLUORESCENT PIGMENTS MARKET, BY APPLICATION, 2019–2022 (TON)
  • TABLE 152 EUROPE: FLUORESCENT PIGMENTS MARKET, BY APPLICATION, 2023–2028 (TON)
  • TABLE 153 EUROPE: FLUORESCENT PIGMENTS MARKET, BY APPLICATION, 2019–2022 (USD THOUSAND)
  • TABLE 154 EUROPE: FLUORESCENT PIGMENTS MARKET, BY APPLICATION, 2023–2028 (USD THOUSAND)
  • TABLE 155 EUROPE: FLUORESCENT PIGMENTS MARKET, BY END-USE INDUSTRY, 2019–2022 (TON)
  • TABLE 156 EUROPE: FLUORESCENT PIGMENTS MARKET, BY END-USE INDUSTRY, 2023–2028 (TON)
  • TABLE 157 EUROPE: FLUORESCENT PIGMENTS MARKET, BY END-USE INDUSTRY, 2019–2022 (USD THOUSAND)
  • TABLE 158 EUROPE: FLUORESCENT PIGMENTS MARKET, BY END-USE INDUSTRY, 2023–2028 (USD THOUSAND)
  • TABLE 159 GERMANY: FLUORESCENT PIGMENTS MARKET, BY END-USE INDUSTRY, 2019–2022 (TON)
  • TABLE 160 GERMANY: FLUORESCENT PIGMENTS MARKET, BY END-USE INDUSTRY, 2023–2028 (TON)
  • TABLE 161 GERMANY: FLUORESCENT PIGMENTS MARKET, BY END-USE INDUSTRY, 2019–2022 (USD THOUSAND)
  • TABLE 162 GERMANY: FLUORESCENT PIGMENTS MARKET, BY END-USE INDUSTRY, 2023–2028 (USD THOUSAND)
  • TABLE 163 FRANCE: FLUORESCENT PIGMENTS MARKET, BY END-USE INDUSTRY, 2019–2022 (TON)
  • TABLE 164 FRANCE: FLUORESCENT PIGMENTS MARKET, BY END-USE INDUSTRY, 2023–2028 (TON)
  • TABLE 165 FRANCE: FLUORESCENT PIGMENTS MARKET, BY END-USE INDUSTRY, 2019–2022 (USD THOUSAND)
  • TABLE 166 FRANCE: FLUORESCENT PIGMENTS MARKET, BY END-USE INDUSTRY, 2023–2028 (USD THOUSAND)
  • TABLE 167 UK: FLUORESCENT PIGMENTS MARKET, BY END-USE INDUSTRY, 2019–2022 (TON)
  • TABLE 168 UK: FLUORESCENT PIGMENTS MARKET, BY END-USE INDUSTRY, 2023–2028 (TON)
  • TABLE 169 UK: FLUORESCENT PIGMENTS MARKET, BY END-USE INDUSTRY, 2019–2022 (USD THOUSAND)
  • TABLE 170 UK: FLUORESCENT PIGMENTS MARKET, BY END-USE INDUSTRY, 2023–2028 (USD THOUSAND)
  • TABLE 171 ITALY: FLUORESCENT PIGMENTS MARKET, BY END-USE INDUSTRY, 2019–2022 (TON)
  • TABLE 172 ITALY: FLUORESCENT PIGMENTS MARKET, BY END-USE INDUSTRY, 2023–2028 (TON)
  • TABLE 173 ITALY: FLUORESCENT PIGMENTS MARKET, BY END-USE INDUSTRY, 2019–2022 (USD THOUSAND)
  • TABLE 174 ITALY: FLUORESCENT PIGMENTS MARKET, BY END-USE INDUSTRY, 2023–2028 (USD THOUSAND)
  • TABLE 175 SPAIN: FLUORESCENT PIGMENTS MARKET, BY END-USE INDUSTRY, 2019–2022 (TON)
  • TABLE 176 SPAIN: FLUORESCENT PIGMENTS MARKET, BY END-USE INDUSTRY, 2023–2028 (TON)
  • TABLE 177 SPAIN: FLUORESCENT PIGMENTS MARKET, BY END-USE INDUSTRY, 2019–2022 (USD THOUSAND)
  • TABLE 178 SPAIN: FLUORESCENT PIGMENTS MARKET, BY END-USE INDUSTRY, 2023–2028 (USD THOUSAND)
  • TABLE 179 REST OF EUROPE: FLUORESCENT PIGMENTS MARKET, BY END-USE INDUSTRY, 2019–2022 (TON)
  • TABLE 180 REST OF EUROPE: FLUORESCENT PIGMENTS MARKET, BY END-USE INDUSTRY, 2023–2028 (TON)
  • TABLE 181 REST OF EUROPE: FLUORESCENT PIGMENTS MARKET, BY END-USE INDUSTRY, 2019–2022 (USD THOUSAND)
  • TABLE 182 REST OF EUROPE: FLUORESCENT PIGMENTS MARKET, BY END-USE INDUSTRY, 2023–2028 (USD THOUSAND)
  • TABLE 183 MIDDLE EAST & AFRICA: FLUORESCENT PIGMENTS MARKET, BY COUNTRY, 2019–2022 (TON)
  • TABLE 184 MIDDLE EAST & AFRICA: FLUORESCENT PIGMENTS MARKET, BY COUNTRY, 2023–2028 (TON)
  • TABLE 185 MIDDLE EAST & AFRICA: FLUORESCENT PIGMENTS MARKET, BY COUNTRY, 2019–2022 (USD THOUSAND)
  • TABLE 186 MIDDLE EAST & AFRICA: FLUORESCENT PIGMENTS MARKET, BY COUNTRY, 2023–2028 (USD THOUSAND)
  • TABLE 187 MIDDLE EAST & AFRICA: FLUORESCENT PIGMENTS MARKET, BY FORMULATION, 2019–2022 (TON)
  • TABLE 188 MIDDLE EAST & AFRICA: FLUORESCENT PIGMENTS MARKET, BY FORMULATION, 2023–2028 (TON)
  • TABLE 189 MIDDLE EAST & AFRICA: FLUORESCENT PIGMENTS MARKET, BY FORMULATION, 2019–2022 (USD THOUSAND)
  • TABLE 190 MIDDLE EAST & AFRICA: FLUORESCENT PIGMENTS MARKET, BY FORMULATION, 2023–2028 (USD THOUSAND)
  • TABLE 191 MIDDLE EAST & AFRICA: FLUORESCENT PIGMENTS MARKET, BY CHARACTERISTIC TYPE, 2019–2022 (TON)
  • TABLE 192 MIDDLE EAST & AFRICA: FLUORESCENT PIGMENTS MARKET, BY CHARACTERISTIC TYPE, 2023–2028 (TON)
  • TABLE 193 MIDDLE EAST & AFRICA: FLUORESCENT PIGMENTS MARKET, BY CHARACTERISTIC TYPE, 2019–2022 (USD THOUSAND)
  • TABLE 194 MIDDLE EAST & AFRICA: FLUORESCENT PIGMENTS MARKET, BY CHARACTERISTIC TYPE, 2023–2028 (USD THOUSAND)
  • TABLE 195 MIDDLE EAST & AFRICA: FLUORESCENT PIGMENTS MARKET, BY TYPE, 2019–2022 (TON)
  • TABLE 196 MIDDLE EAST & AFRICA: FLUORESCENT PIGMENTS MARKET, BY TYPE, 2023–2028 (TON)
  • TABLE 197 MIDDLE EAST & AFRICA: FLUORESCENT PIGMENTS MARKET, BY TYPE, 2019–2022 (USD THOUSAND)
  • TABLE 198 MIDDLE EAST & AFRICA: FLUORESCENT PIGMENTS MARKET, BY TYPE, 2023–2028 (USD THOUSAND)
  • TABLE 199 MIDDLE EAST & AFRICA: FLUORESCENT PIGMENTS MARKET, BY INTENSITY, 2019–2022 (TON)
  • TABLE 200 MIDDLE EAST & AFRICA: FLUORESCENT PIGMENTS MARKET, BY INTENSITY, 2023–2028 (TON)
  • TABLE 201 MIDDLE EAST & AFRICA: FLUORESCENT PIGMENTS MARKET, BY INTENSITY, 2019–2022 (USD THOUSAND)
  • TABLE 202 MIDDLE EAST & AFRICA: FLUORESCENT PIGMENTS MARKET, BY INTENSITY, 2023–2028 (USD THOUSAND)
  • TABLE 203 MIDDLE EAST & AFRICA: FLUORESCENT PIGMENTS MARKET, BY APPLICATION, 2019–2022 (TON)
  • TABLE 204 MIDDLE EAST & AFRICA: FLUORESCENT PIGMENTS MARKET, BY APPLICATION, 2023–2028 (TON)
  • TABLE 205 MIDDLE EAST & AFRICA: FLUORESCENT PIGMENTS MARKET, BY APPLICATION, 2019–2022 (USD THOUSAND)
  • TABLE 206 MIDDLE EAST & AFRICA: FLUORESCENT PIGMENTS MARKET, BY APPLICATION, 2023–2028 (USD THOUSAND)
  • TABLE 207 MIDDLE EAST & AFRICA: FLUORESCENT PIGMENTS MARKET, BY END-USE INDUSTRY, 2019–2022 (TON)
  • TABLE 208 MIDDLE EAST & AFRICA: FLUORESCENT PIGMENTS MARKET, BY END-USE INDUSTRY, 2023–2028 (TON)
  • TABLE 209 MIDDLE EAST & AFRICA: FLUORESCENT PIGMENTS MARKET, BY END-USE INDUSTRY, 2019–2022 (USD THOUSAND)
  • TABLE 210 MIDDLE EAST & AFRICA: FLUORESCENT PIGMENTS MARKET, BY END-USE INDUSTRY, 2023–2028 (USD THOUSAND)
  • TABLE 211 SAUDI ARABIA: FLUORESCENT PIGMENTS MARKET, BY END-USE INDUSTRY, 2019–2022 (TON)
  • TABLE 212 SAUDI ARABIA: FLUORESCENT PIGMENTS MARKET, BY END-USE INDUSTRY, 2023–2028 (TON)
  • TABLE 213 SAUDI ARABIA: FLUORESCENT PIGMENTS MARKET, BY END-USE INDUSTRY, 2019–2022 (USD THOUSAND)
  • TABLE 214 SAUDI ARABIA: FLUORESCENT PIGMENTS MARKET, BY END-USE INDUSTRY, 2023–2028 (USD THOUSAND)
  • TABLE 215 UAE: FLUORESCENT PIGMENTS MARKET, BY END-USE INDUSTRY, 2019–2022 (TON)
  • TABLE 216 UAE: FLUORESCENT PIGMENTS MARKET, BY END-USE INDUSTRY, 2023–2028 (TON)
  • TABLE 217 UAE: FLUORESCENT PIGMENTS MARKET, BY END-USE INDUSTRY, 2019–2022 (USD THOUSAND)
  • TABLE 218 UAE: FLUORESCENT PIGMENTS MARKET, BY END-USE INDUSTRY, 2023–2028 (USD THOUSAND)
  • TABLE 219 OTHER GCC COUNTRIES: FLUORESCENT PIGMENTS MARKET, BY END-USE INDUSTRY, 2019–2022 (TON)
  • TABLE 220 OTHER GCC COUNTRIES: FLUORESCENT PIGMENTS MARKET, BY END-USE INDUSTRY, 2023–2028 (TON)
  • TABLE 221 OTHER GCC COUNTRIES: FLUORESCENT PIGMENTS MARKET, BY END-USE INDUSTRY, 2019–2022 (USD THOUSAND)
  • TABLE 222 OTHER GCC COUNTRIES: FLUORESCENT PIGMENTS MARKET, BY END-USE INDUSTRY, 2023–2028 (USD THOUSAND)
  • TABLE 223 SOUTH AFRICA: FLUORESCENT PIGMENTS MARKET, BY END-USE INDUSTRY, 2019–2022 (TON)
  • TABLE 224 SOUTH AFRICA: FLUORESCENT PIGMENTS MARKET, BY END-USE INDUSTRY, 2023–2028 (TON)
  • TABLE 225 SOUTH AFRICA: FLUORESCENT PIGMENTS MARKET, BY END-USE INDUSTRY, 2019–2022 (USD THOUSAND)
  • TABLE 226 SOUTH AFRICA: FLUORESCENT PIGMENTS MARKET, BY END-USE INDUSTRY, 2023–2028 (USD THOUSAND)
  • TABLE 227 REST OF MIDDLE EAST & AFRICA: FLUORESCENT PIGMENTS MARKET, BY END-USE INDUSTRY, 2019–2022 (TON)
  • TABLE 228 REST OF MIDDLE EAST & AFRICA: FLUORESCENT PIGMENTS MARKET, BY END-USE INDUSTRY, 2023–2028 (TON)
  • TABLE 229 REST OF MIDDLE EAST & AFRICA: FLUORESCENT PIGMENTS MARKET, BY END-USE INDUSTRY, 2019–2022 (USD THOUSAND)
  • TABLE 230 REST OF MIDDLE EAST & AFRICA: FLUORESCENT PIGMENTS MARKET, BY END-USE INDUSTRY, 2023–2028 (USD THOUSAND)
  • TABLE 231 SOUTH AMERICA: FLUORESCENT PIGMENTS MARKET, BY COUNTRY, 2019–2022 (TON)
  • TABLE 232 SOUTH AMERICA: FLUORESCENT PIGMENTS MARKET, BY COUNTRY, 2023–2028 (TON)
  • TABLE 233 SOUTH AMERICA: FLUORESCENT PIGMENTS MARKET, BY COUNTRY, 2019–2022 (USD THOUSAND)
  • TABLE 234 SOUTH AMERICA: FLUORESCENT PIGMENTS MARKET, BY COUNTRY, 2023–2028 (USD THOUSAND)
  • TABLE 235 SOUTH AMERICA: FLUORESCENT PIGMENTS MARKET, BY FORMULATION, 2019–2022 (TON)
  • TABLE 236 SOUTH AMERICA: FLUORESCENT PIGMENTS MARKET, BY FORMULATION, 2023–2028 (TON)
  • TABLE 237 SOUTH AMERICA: FLUORESCENT PIGMENTS MARKET, BY FORMULATION, 2019–2022 (USD THOUSAND)
  • TABLE 238 SOUTH AMERICA: FLUORESCENT PIGMENTS MARKET, BY FORMULATION, 2023–2028 (USD THOUSAND)
  • TABLE 239 SOUTH AMERICA: FLUORESCENT PIGMENTS MARKET, BY CHARACTERISTIC TYPE, 2019–2022 (TON)
  • TABLE 240 SOUTH AMERICA: FLUORESCENT PIGMENTS MARKET, BY CHARACTERISTIC TYPE, 2023–2028 (TON)
  • TABLE 241 SOUTH AMERICA: FLUORESCENT PIGMENTS MARKET, BY CHARACTERISTIC TYPE, 2019–2022 (USD THOUSAND)
  • TABLE 242 SOUTH AMERICA: FLUORESCENT PIGMENTS MARKET, BY CHARACTERISTIC TYPE, 2023–2028 (USD THOUSAND)
  • TABLE 243 SOUTH AMERICA: FLUORESCENT PIGMENTS MARKET, BY TYPE, 2019–2022 (TON)
  • TABLE 244 SOUTH AMERICA: FLUORESCENT PIGMENTS MARKET, BY TYPE, 2023–2028 (TON)
  • TABLE 245 SOUTH AMERICA: FLUORESCENT PIGMENTS MARKET, BY TYPE, 2019–2022 (USD THOUSAND)
  • TABLE 246 SOUTH AMERICA: FLUORESCENT PIGMENTS MARKET, BY TYPE, 2023–2028 (USD THOUSAND)
  • TABLE 247 SOUTH AMERICA: FLUORESCENT PIGMENTS MARKET, BY INTENSITY, 2019–2022 (TON)
  • TABLE 248 SOUTH AMERICA: FLUORESCENT PIGMENTS MARKET, BY INTENSITY, 2023–2028 (TON)
  • TABLE 249 SOUTH AMERICA: FLUORESCENT PIGMENTS MARKET, BY INTENSITY, 2019–2022 (USD THOUSAND)
  • TABLE 250 SOUTH AMERICA: FLUORESCENT PIGMENTS MARKET, BY INTENSITY, 2023–2028 (USD THOUSAND)
  • TABLE 251 SOUTH AMERICA: FLUORESCENT PIGMENTS MARKET, BY APPLICATION, 2019–2022 (TON)
  • TABLE 252 SOUTH AMERICA: FLUORESCENT PIGMENTS MARKET, BY APPLICATION, 2023–2028 (TON)
  • TABLE 253 SOUTH AMERICA: FLUORESCENT PIGMENTS MARKET, BY APPLICATION, 2019–2022 (USD THOUSAND)
  • TABLE 254 SOUTH AMERICA: FLUORESCENT PIGMENTS MARKET, BY APPLICATION, 2023–2028 (USD THOUSAND)
  • TABLE 255 SOUTH AMERICA: FLUORESCENT PIGMENTS MARKET, BY END-USE INDUSTRY, 2019–2022 (TON)
  • TABLE 256 SOUTH AMERICA: FLUORESCENT PIGMENTS MARKET, BY END-USE INDUSTRY, 2023–2028 (TON)
  • TABLE 257 SOUTH AMERICA: FLUORESCENT PIGMENTS MARKET, BY END-USE INDUSTRY, 2019–2022 (USD THOUSAND)
  • TABLE 258 SOUTH AMERICA: FLUORESCENT PIGMENTS MARKET, BY END-USE INDUSTRY, 2023–2028 (USD THOUSAND)
  • TABLE 259 BRAZIL: FLUORESCENT PIGMENTS MARKET, BY END-USE INDUSTRY, 2019–2022 (TON)
  • TABLE 260 BRAZIL: FLUORESCENT PIGMENTS MARKET, BY END-USE INDUSTRY, 2023–2028 (TON)
  • TABLE 261 BRAZIL: FLUORESCENT PIGMENTS MARKET, BY END-USE INDUSTRY, 2019–2022 (USD THOUSAND)
  • TABLE 262 BRAZIL: FLUORESCENT PIGMENTS MARKET, BY END-USE INDUSTRY, 2023–2028 (USD THOUSAND)
  • TABLE 263 ARGENTINA: FLUORESCENT PIGMENTS MARKET, BY END-USE INDUSTRY, 2019–2022 (TON)
  • TABLE 264 ARGENTINA: FLUORESCENT PIGMENTS MARKET, BY END-USE INDUSTRY, 2023–2028 (TON)
  • TABLE 265 ARGENTINA: FLUORESCENT PIGMENTS MARKET, BY END-USE INDUSTRY, 2019–2022 (USD THOUSAND)
  • TABLE 266 ARGENTINA: FLUORESCENT PIGMENTS MARKET, BY END-USE INDUSTRY, 2023–2028 (USD THOUSAND)
  • TABLE 267 REST OF SOUTH AMERICA: FLUORESCENT PIGMENTS MARKET, BY END-USE INDUSTRY, 2019–2022 (TON)
  • TABLE 268 REST OF SOUTH AMERICA: FLUORESCENT PIGMENTS MARKET, BY END-USE INDUSTRY, 2023–2028 (TON)
  • TABLE 269 REST OF SOUTH AMERICA: FLUORESCENT PIGMENTS MARKET, BY END-USE INDUSTRY, 2019–2022 (USD THOUSAND)
  • TABLE 270 REST OF SOUTH AMERICA: FLUORESCENT PIGMENTS MARKET, BY END-USE INDUSTRY, 2023–2028 (USD THOUSAND)
  • TABLE 271 FLUORESCENT PIGMENTS MARKET: DEGREE OF COMPETITION
  • TABLE 272 END-USE INDUSTRY FOOTPRINT
  • TABLE 273 REGION FOOTPRINT
  • TABLE 274 COMPANY FOOTPRINT
  • TABLE 275 KEY START-UPS/SMES
  • TABLE 276 COMPETITIVE BENCHMARKING OF KEY START-UPS/SMES
  • TABLE 277 PRODUCT LAUNCHES, 2018–2023
  • TABLE 278 DEALS, 2018–2023
  • TABLE 279 EXPANSIONS, 2018–2023
  • TABLE 280 RADIANT COLOR NV: COMPANY OVERVIEW
  • TABLE 281 RADIANT COLOR NV: PRODUCTS OFFERED
  • TABLE 282 LUMINOCHEM: COMPANY OVERVIEW
  • TABLE 283 LUMINOCHEM: PRODUCTS OFFERED
  • TABLE 284 LUMINOCHEM: PRODUCT LAUNCHES
  • TABLE 285 SINLOIHI CO., LTD.: COMPANY OVERVIEW
  • TABLE 286 SINLOIHI CO., LTD.: PRODUCTS OFFERED
  • TABLE 287 WUXI MINGHUI INTERNATIONAL TRADING CO., LTD.: COMPANY OVERVIEW
  • TABLE 288 WUXI MINGHUI INTERNATIONAL TRADING CO., LTD.: PRODUCTS OFFERED
  • TABLE 289 DAYGLO COLOR CORP.: COMPANY OVERVIEW
  • TABLE 290 DAYGLO COLOR CORP.: PRODUCTS OFFERED
  • TABLE 291 DAYGLO COLOR CORP.: PRODUCT LAUNCHES
  • TABLE 292 DAYGLO COLOR CORP.: DEALS
  • TABLE 293 DAYGLO COLOR CORP.: EXPANSIONS
  • TABLE 294 WANLONG CHEMICAL CO., LTD.: COMPANY OVERVIEW
  • TABLE 295 WANLONG CHEMICAL CO., LTD.: PRODUCTS OFFERED
  • TABLE 296 ARON UNIVERSAL LIMITED: COMPANY OVERVIEW
  • TABLE 297 ARON UNIVERSAL LIMITED: PRODUCTS OFFERED
  • TABLE 298 VICOME CORP.: COMPANY OVERVIEW
  • TABLE 299 VICOME CORP.: PRODUCTS OFFERED
  • TABLE 300 VICOME CORP.: EXPANSIONS
  • TABLE 301 HANGZHOU AIBAI CHEMICAL CO., LTD.: COMPANY OVERVIEW
  • TABLE 302 HANGZHOU AIBAI CHEMICAL CO., LTD.: PRODUCTS OFFERED
  • TABLE 303 BRILLIANT GROUP, INC.: COMPANY OVERVIEW
  • TABLE 304 BRILLIANT GROUP, INC.: PRODUCTS OFFERED
  • TABLE 305 BRILLIANT GROUP, INC.: DEALS
  • TABLE 306 HUANGSHAN JIAJIA FLUORESCENT MATERIAL CO., LTD.: COMPANY OVERVIEW
  • TABLE 307 HUANGSHAN JIAJIA FLUORESCENT MATERIAL CO., LTD.: PRODUCTS OFFERED
  • TABLE 308 JIANGSU LIWANG TECHNOLOGY CO., LTD.: COMPANY OVERVIEW
  • TABLE 309 JIANGSU LIWANG TECHNOLOGY CO., LTD.: PRODUCTS OFFERED
  • TABLE 310 JIAOLING BAILIN BIOTECHNOLOGY CO., LTD.: COMPANY OVERVIEW
  • TABLE 311 JIAOLING BAILIN BIOTECHNOLOGY CO., LTD.: PRODUCTS OFFERED
  • TABLE 312 ARALON: COMPANY OVERVIEW
  • TABLE 313 ARALON: PRODUCTS OFFERED
  • TABLE 314 NEMOTO & CO., LTD.: COMPANY OVERVIEW
  • TABLE 315 NEMOTO & CO., LTD.: PRODUCTS OFFERED
  • TABLE 316 FLUORCOLORS: COMPANY OVERVIEW
  • TABLE 317 FLUORCOLORS: PRODUCTS OFFERED
  • TABLE 318 SPECTRA COLORS CO., LTD.: COMPANY OVERVIEW
  • TABLE 319 SPECTRA COLORS CO., LTD.: PRODUCTS OFFERED
  • TABLE 320 UKSEUNG CHEMICAL CO., LTD.: COMPANY OVERVIEW
  • TABLE 321 UKSEUNG CHEMICAL CO., LTD.: PRODUCTS OFFERED
  • TABLE 322 J-COLOR: COMPANY OVERVIEW
  • TABLE 323 J-COLOR: PRODUCTS OFFERED
  • TABLE 324 NANOCHEMITEK (YANGZHOU): COMPANY OVERVIEW
  • TABLE 325 NANOCHEMITEK (YANGZHOU): PRODUCTS OFFERED
  • TABLE 326 QUINGDAO TOPWELL CHEMICALS MATERIALS CO., LTD.: COMPANY OVERVIEW
  • TABLE 327 QUINGDAO TOPWELL CHEMICALS MATERIALS CO., LTD.: PRODUCTS OFFERED
  • TABLE 328 ORGANIC DYES AND PIGMENTS: COMPANY OVERVIEW
  • TABLE 329 ORGANIC DYES AND PIGMENTS: PRODUCTS OFFERED
  • TABLE 330 SD INTERNATIONAL: COMPANY OVERVIEW
  • TABLE 331 SD INTERNATIONAL: PRODUCTS OFFERED
  • TABLE 332 VIBFAST PIGMENTS PVT. LTD.: COMPANY OVERVIEW
  • TABLE 333 VIBFAST PIGMENTS PVT. LTD.: PRODUCTS OFFERED
  • TABLE 334 NEOVCHEM: COMPANY OVERVIEW
  • TABLE 335 NEOVCHEM: PRODUCTS OFFERED
LIST OF FIGURES
 
  • FIGURE 1 FLUORESCENT PIGMENTS MARKET: RESEARCH DESIGN
  • FIGURE 2 FLUORESCENT PIGMENTS MARKET: TOP-DOWN APPROACH
  • FIGURE 3 FLUORESCENT PIGMENTS MARKET SIZE ESTIMATION
  • FIGURE 4 FLUORESCENT PIGMENTS MARKET: DEMAND-SIDE FORECAST
  • FIGURE 5 FLUORESCENT PIGMENTS MARKET: DATA TRIANGULATION
  • FIGURE 6 ORGANIC FLUORESCENT PIGMENT TO BE DOMINANT FORMULATION DURING FORECAST PERIOD
  • FIGURE 7 THERMOPLASTIC TO BE DOMINANT CHARACTERISTIC TYPE OF FLUORESCENT PIGMENTS DURING FORECAST PERIOD
  • FIGURE 8 DAYLIGHT FLUORESCENT PIGMENTS TO CAPTURE LARGEST MARKET SHARE DURING FORECAST PERIOD
  • FIGURE 9 MEDIUM-INTENSITY FLUORESCENT PIGMENTS TO LEAD MARKET DURING FORECAST PERIOD
  • FIGURE 10 PRINTING INKS/GRAPHIC ARTS TO BE LARGEST APPLICATION DURING FORECAST PERIOD
  • FIGURE 11 SECURITY & CURRENCY END-USE INDUSTRY TO LEAD MARKET DURING FORECAST PERIOD
  • FIGURE 12 ASIA PACIFIC TO BE FASTEST-GROWING MARKET DURING FORECAST PERIOD
  • FIGURE 13 EMERGING ECONOMIES TO LEAD FLUORESCENT PIGMENTS MARKET DURING FORECAST PERIOD
  • FIGURE 14 ORGANIC TO BE LARGER FORMULATION SEGMENT DURING FORECAST PERIOD
  • FIGURE 15 THERMOPLASTIC TO BE LARGER CHARACTERISTIC TYPE DURING FORECAST PERIOD
  • FIGURE 16 DAYLIGHT FLUORESCENT PIGMENTS TO ACCOUNT FOR LARGEST SHARE DURING FORECAST PERIOD
  • FIGURE 17 MEDIUM INTENSITY SEGMENT TO LEAD MARKET DURING FORECAST PERIOD
  • FIGURE 18 PRINTING INKS/GRAPHIC ARTS TO BE LARGEST APPLICATION DURING FORECAST PERIOD
  • FIGURE 19 SECURITY & CURRENCY TO BE LEADING END-USE INDUSTRY SEGMENT DURING FORECAST PERIOD
  • FIGURE 20 CHINA TO REGISTER HIGHEST CAGR DURING FORECAST PERIOD
  • FIGURE 21 FLUORESCENT PIGMENTS MARKET DYNAMICS
  • FIGURE 22 VALUE CHAIN ANALYSIS
  • FIGURE 23 PORTER’S FIVE FORCES ANALYSIS
  • FIGURE 24 NUMBER OF GRANTED PATENTS, PATENT APPLICATIONS, AND LIMITED PATENTS
  • FIGURE 25 TOP 10 PATENT APPLICANTS
  • FIGURE 26 AVERAGE SELLING PRICE TREND, BY REGION (USD)/KG)
  • FIGURE 27 AVERAGE SELLING PRICE TREND OF KEY PLAYERS FOR TOP THREE END-USE INDUSTRIES (USD/KG)
  • FIGURE 28 ECOSYSTEM MAP
  • FIGURE 29 IMPORT DATA, BY COUNTRY, 2018–2022 (USD THOUSAND)
  • FIGURE 30 EXPORT DATA, BY COUNTRY, 2018–2022 (USD THOUSAND)
  • FIGURE 31 NEW REVENUE SOURCES IN FLUORESCENT PIGMENTS MARKET
  • FIGURE 32 INFLUENCE OF STAKEHOLDERS ON BUYING PROCESS FOR TOP THREE END-USE INDUSTRIES
  • FIGURE 33 KEY BUYING CRITERIA FOR TOP THREE END-USE INDUSTRIES
  • FIGURE 34 FUNDING, BY USE CASE/APPLICATION
  • FIGURE 35 FLUORESCENT PIGMENTS MARKET, BY FORMULATION, 2023–2028
  • FIGURE 36 FLUORESCENT PIGMENTS MARKET, BY CHARACTERISTIC TYPE, 2023–2028
  • FIGURE 37 FLUORESCENT PIGMENTS MARKET, BY TYPE, 2023–2028
  • FIGURE 38 FLUORESCENT PIGMENTS MARKET, BY INTENSITY, 2023–2028
  • FIGURE 39 FLUORESCENT PIGMENTS MARKET, BY APPLICATION, 2023–2028
  • FIGURE 40 FLUORESCENT PIGMENTS MARKET, BY END-USE INDUSTRY, 2023–2028
  • FIGURE 41 FLUORESCENT PIGMENTS MARKET, BY REGION, 2023–2028
  • FIGURE 42 NORTH AMERICA: FLUORESCENT PIGMENTS MARKET SNAPSHOT
  • FIGURE 43 ASIA PACIFIC: FLUORESCENT PIGMENTS MARKET SNAPSHOT
  • FIGURE 44 EUROPE: FLUORESCENT PIGMENTS MARKET SNAPSHOT
  • FIGURE 45 STRATEGIES ADOPTED BY KEY PLAYERS, 2018–2023
  • FIGURE 46 REVENUE ANALYSIS OF KEY PLAYERS, 2022
  • FIGURE 47 MARKET RANKING OF KEY PLAYERS, 2022
  • FIGURE 48 MARKET SHARE OF KEY PLAYERS, 2022
  • FIGURE 49 COMPANY EVALUATION MATRIX, 2022
  • FIGURE 50 PRODUCT FOOTPRINT
  • FIGURE 51 START-UP/SME EVALUATION MATRIX, 2022
  • FIGURE 52 COMPANY VALUATION
  • FIGURE 53 BRAND/PRODUCT COMPARISON

The study involved four major activities in estimating the market size of the fluorescent pigment market. Exhaustive secondary research was done to collect information on the market, the peer market, and the grandparent market. The next step was to validate these findings, assumptions, and sizing with industry experts across the value chain through primary research. Both top-down and bottom-up approaches were employed to estimate the complete market size. Thereafter, the market breakdown and data triangulation procedures were used to estimate the market size of the segments and subsegments.

Secondary Research

In the secondary research process, various secondary sources have been referred to for identifying and collecting information for this study. These secondary sources include annual reports, press releases, investor presentations of companies, white papers, certified publications, trade directories, articles from recognized authors, gold standard and silver standard websites, and databases. Secondary research has been used to obtain key information about the value chain of the industry, monetary chain of the market, the total pool of key players, market classification and segmentation according to industry trends to the bottom-most level, and regional markets. It was also used to obtain information about the key developments from a market-oriented perspective.

Primary Research

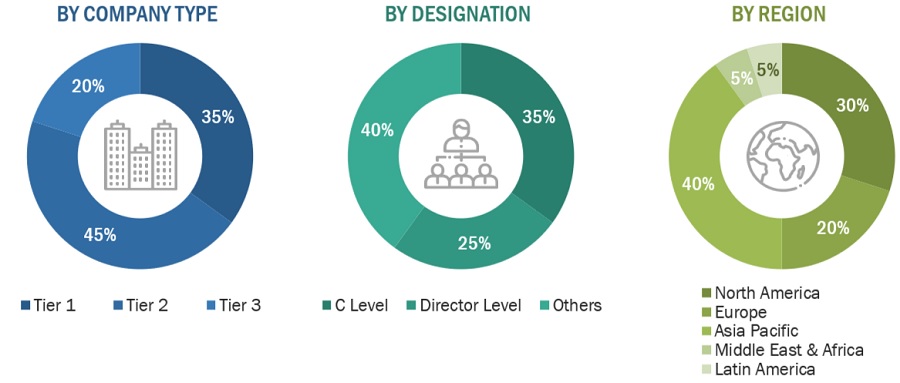
The fluorescent pigment market comprises several stakeholders in the value chain, which include manufacturers, and end users. Various primary sources from the supply and demand sides of the fluorescent pigment market have been interviewed to obtain qualitative and quantitative information. The primary interviewees from the demand side include key opinion leaders in promotional and security sector. The primary sources from the supply side include manufacturers, associations, and institutions involved in the fluorescent pigment industry. Primary interviews were conducted to gather insights such as market statistics, data of revenue collected from the products and services, market breakdowns, market size estimations, market forecasting, and data triangulation. Primary research also helped in understanding the various trends related to formulation, characteristic type, type, intensity, application, end-use industry, and region. Stakeholders from the demand side, such as CIOs, CTOs, and CSOs were interviewed to understand the buyer’s perspective on the suppliers, products, component providers, and their current usage of fluorescent pigment and outlook of their business, which will affect the overall market.

The breakdown of profiles of the primary interviewees is illustrated in the figure below:
Fluorescent Pigment  Market Size, and Share

Note: Tier 1, Tier 2, and Tier 3 companies are classified based on their market revenue in 2022 available in the public domain, product portfolios, and geographical presence.

Other designations include consultants and sales, marketing, and procurement managers.

To know about the assumptions considered for the study, download the pdf brochure

Market Size Estimation

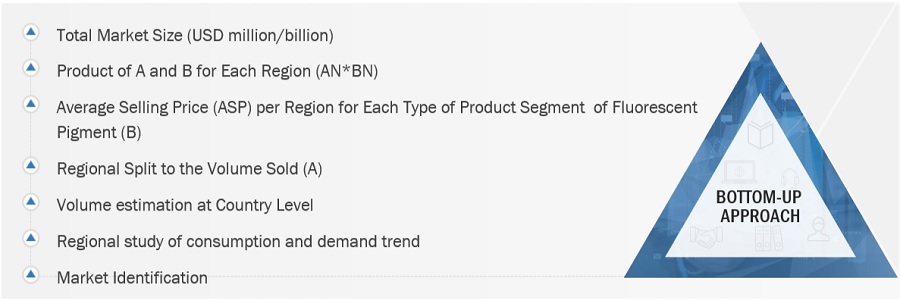
The top-down and bottom-up approaches have been used to estimate and validate the size of the fluorescent pigment market.

  • The key players in the industry have been identified through extensive secondary research.
  • The supply chain of the industry has been determined through primary and secondary research.
  • All percentage shares, splits, and breakdowns have been determined using secondary sources and verified through primary sources.
  • All possible parameters that affect the markets covered in this research study have been accounted for, viewed in extensive detail, verified through primary research, and analyzed to obtain the final quantitative and qualitative data.
  • The research includes the study of reports, reviews, and newsletters of the key market players, along with extensive interviews for opinions with leaders such as directors and marketing executives.

Top - Down Approach-
Fluorescent Pigment  Market Size, and Share

To know about the assumptions considered for the study, Request for Free Sample Report

Bottom - Up Approach-

Fluorescent Pigment  Market Size, and Share

Data Triangulation

After arriving at the total market size from the estimation process, the overall market has been split into several segments and sub-segments. To complete the overall market engineering process and arrive at the exact statistics for all the segments and sub-segments, the data triangulation and market breakdown procedures have been employed, wherever applicable. The data has been triangulated by studying various factors and trends from both the demand and supply sides. Along with this, the market size has been validated by using both the top-down and bottom-up approaches and primary interviews. Hence, for every data segment, there have been three sources—top-down approach, bottom-up approach, and expert interviews. The data was assumed correct when the values arrived from the three sources matched.

Market Definition

Fluorescent pigments are colorants that can be stimulated by light to give brighter and more brilliant colors than conventional pigments. They are luminescent materials that reflect colored light and give off fluorescent light without requiring artificially generated energy. Fluorescent pigments often produce colors that are more intense and vivid compared to conventional pigments. This makes them popular for applications where bright and eye-catching colors are desired. Fluorescent pigments are used in various industries, including textiles, printing inks, plastics, coatings, paints, and cosmetics.

Key Stakeholders

  • Senior Management
  • End User
  • Finance/Procurement Department
  • R&D Department
  • Manufacturers
  • Raw Material Suppliers

Report Objectives

  • To define, describe, and forecast the size of the fluorescent pigment market, in terms of value and volume.
  • To provide detailed information regarding the major factors (drivers, opportunities, restraints, and challenges) influencing the growth of the market
  • To estimate and forecast the market size based on formulation, characteristic type, intensity, type, end-use industry, application, and region.
  • To forecast the size of the market with respect to major regions, namely, Europe, North America, Asia Pacific, Middle East & Africa, and South America, along with their key countries
  • To strategically analyze micromarkets with respect to individual growth trends, prospects, and their contribution to the overall market
  • To analyze opportunities in the market for stakeholders and provide a competitive landscape of market leaders.
  • To track and analyze recent developments such as expansions, new product launches, partnerships & agreements, and acquisitions in the market.
  • To strategically profile key market players and comprehensively analyze their core competencies.

Available Customizations

Along with the given market data, MarketsandMarkets offers customizations according to the company’s specific needs. The following customization options are available for the report:

Regional Analysis

  • Further breakdown of a region with respect to a particular country or additional application

Company Information

  • Detailed analysis and profiles of additional market players

Tariff & Regulations

  • Regulations and Impact on fluorescent pigment market
Custom Market Research Services

We will customize the research for you, in case the report listed above does not meet with your exact requirements. Our custom research will comprehensively cover the business information you require to help you arrive at strategic and profitable business decisions.

Request Customization
Report Code
CH 8932
Published ON
Feb, 2024
Choose License Type
BUY NOW
  • SHARE
X
Request Customization
Speak to Analyst
Speak to Analyst
OR FACE-TO-FACE MEETING
PERSONALIZE THIS RESEARCH
  • Triangulate with your Own Data
  • Get Data as per your Format and Definition
  • Gain a Deeper Dive on a Specific Application, Geography, Customer or Competitor
  • Any level of Personalization
REQUEST A FREE CUSTOMIZATION
LET US HELP YOU!
  • What are the Known and Unknown Adjacencies Impacting the Fluorescent Pigment Market
  • What will your New Revenue Sources be?
  • Who will be your Top Customer; what will make them switch?
  • Defend your Market Share or Win Competitors
  • Get a Scorecard for Target Partners
CUSTOMIZED WORKSHOP REQUEST
knowledgestore logo

Want to explore hidden markets that can drive new revenue in Fluorescent Pigment Market?

Find Hidden Markets
  • Call Us
  • +1-888-600-6441 (Corporate office hours)
  • +1-888-600-6441 (US/Can toll free)
  • +44-800-368-9399 (UK office hours)
CONNECT WITH US
ABOUT TRUST ONLINE
©2024 MarketsandMarkets Research Private Ltd. All rights reserved
DMCA.com Protection Status
Website Feedback