Environment, Health, and Safety Market

Environment, Health, and Safety Market by Offering (Software and Services (Analytics, Project Deployment and Implementation, Audit, Assessment, and Regulatory Compliance, Certification)), Application, Vertical & Region - Global Forecast to 2029

Report Code: TC 6122 Apr, 2024, by marketsandmarkets.com

Environment, Health and Safety (EHS) Market Size & Share - Worldwide

[252 Pages Report] The global Environment, Health and Safety Market size was valued at $7.9 billion in 2024.  Over the course of projection period, the EHS Market is anticipated to increase at a CAGR of 7.6% in between 2024-2029 to reach over $11.5 billion by 2029. Governments around the world are enacting stricter environmental and safety regulations to protect workers and the environment. This necessitates compliance by businesses, leading them to invest in EHS solutions.

Environment, Health, and Safety Market

To know about the assumptions considered for the study, Request for Free Sample Report

Environment, Health, and Safety Market Opportunities

To know about the assumptions considered for the study, download the pdf brochure

Environment, Health and Safety Market Growth Dynamics

Driver: Digitally connected workforce with connected wearables for safe operations to improve EHS management

Every industry has its set of risks associated with its operations, and the management must take steps to address and mitigate them. Industries are empowering  miners with a new wearable device. Wearable technology adoption is poised to revolutionize productivity and occupational health and safety for workers. These devices, often integrated with advanced electrical components and IoT connectivity, come in various apparel and accessory forms. While initially popular for personal fitness, wearables are increasingly used to monitor health risks and enhance occupational safety.

In the past few years, there has been tremendous growth and rapid change in connected worker solution technologies and market adoption. Industries use digital technologies to increase data flow, information, insights, and actions throughout operations to make processes safer and more efficient. In 2020, workplace safety emerged at the forefront during the COVID-19 pandemic. EHS software is a form of data management built to help users avoid workplace incidents, maintain regulatory compliance, and track untoward incidents. It covers many functions that mostly center on compliance and security, such as safety data sheet management, health and safety management programs, EHS training, emissions tracking management, entry permits management for confined spaces, spill response management, and incident investigations management.

Restraint: Data silos and information gaps

Integrating EHS software with existing enterprise systems, such as ERP or legacy data management systems, presents significant challenges due to the complexity and disparate nature of these systems. Data integration can be complex and time-consuming, requiring coordination between various departments, IT teams, and software vendors. Integrating EHS software with existing systems may lead to the creation of data silos, where EHS data is segregated from other organizational data sources, hindering the flow of crucial information for comprehensive EHS management. Data silos can result in fragmented insights, duplication of efforts, and inconsistencies in reporting, undermining the organization's ability to make informed decisions and effectively manage EHS risks. Overcoming data integration challenges requires careful planning, collaboration between stakeholders, and leveraging integration tools and technologies to ensure seamless connectivity and data exchange between EHS software and other enterprise systems.

Opportunity: Modernization of industry infrastructure for low carbon emissions

Technology companies are exploring ways to reduce the energy consumption of their products. Companies focus on designing energy-efficient products, power supplies, and integrated circuits to be energy-efficient and creating cooperative solutions to help customers reduce their carbon emissions. Environment-friendly corporate practices minimize business risks, improve reputation, and generate enormous market opportunities in the EHS market. In the recent wireless era, numerous devices use wireless technology in their day-to-day activities; these devices consume an extensive amount of energy and emit considerable carbon during usage. Technological companies are presented with an opportunity to reduce the energy consumption of these wireless devices and minimize the amount of carbon they emit.

Challenge: Lack of skills and end-to-end solutions

Although there is an increase in the number of EHS software solution users, more technical expertise is needed to operate and maintain these solutions. Organizations need to recognize the importance of EHS software solutions proactively. This has led to inadequate professional knowledge in handling EHS software solutions, as technological skill sets are required to handle complex EHS software solutions. Due to insufficient end-to-end solutions, organizations use multiple software to generate the required output. Regarding software, an end-to-end solution describes a system that addresses all business needs and processes in one centralized hub. Hence, the concerns related to the availability of technical expertise and end-to-end solutions are restraining the adoption and growth of the global EHS market.

The construction and engineering vertical registered the highest CAGR in the environment, health, and safety market during the forecast period.

The construction and engineering sector of EHS focuses on ensuring safety in construction projects and engineering operations. This sector relies on five key solutions: incident management, audit and inspection, waste management, on-demand training, and compliance management. Demand for EHS services in this sector is driven by stringent regulations, public concern for safety and the environment, and technological advancements. EHS initiatives aim to prevent accidents, injuries, and environmental damage through safety protocols, risk assessments, and compliance with regulations. Technology like digital monitoring systems and wearable safety devices is revolutionizing safety practices in the industry.

Project deployment and implementation services are expected to hold the largest market size during the forecast.

Project deployment and implementation services in the EHS domain are crucial for integrating EHS software effectively within organizations. These services, which include project planning, system configuration, data migration, training, and support, are driven by the growing recognition of the importance of robust EHS management systems in enhancing workplace safety, environmental sustainability, and regulatory compliance. As companies prioritize risk mitigation, operational efficiency, and corporate responsibility, they seek expert assistance in deploying EHS software. Additionally, evolving regulatory requirements and the need to align with industry standards contribute to the demand for these services. With digital transformation initiatives on the rise, specialized expertise is increasingly sought to navigate the complexities of EHS software deployment and ensure seamless integration with existing IT infrastructure.

Based on region, North America is expected to hold the largest market size during the forecast.

North America, encompassing countries like the US and Canada, boasts well-developed infrastructures that fuel a significant demand for EHS solutions. Contributions from leading nations such as the US and Canada primarily drive the EHS market in North America. These countries' robust economies facilitate substantial investments in cutting-edge technologies, further enhancing their market dominance. The stringent regulatory frameworks upheld by the US and Canadian governments are a crucial catalyst for the EHS market's growth. The US's EHS department, for instance, oversees the development and enforcement of safety programs aimed at safeguarding the well-being of workers and the environment, covering areas like chemical safety, occupational safety, and hazardous waste management.

North American Environment, Health, and Safety Market Size, and Share

Market Players:

The major vendors in this market include VelocityEHS (US), Wolters Kluwer (Netherlands), Intelex Technologies (Canada), Benchmark ESG (US), Cority Software Inc. (Canada), Sphera (US), Intertek (UK), Quentic (Germany), UL Solutions (US), Ideagen (UK). These players have adopted various growth strategies, such as partnerships, agreements and collaborations, new product launches and product enhancements, and acquisitions to expand their footprint in the environment, health, and safety market.

Want to explore hidden markets that can drive new revenue in Environment, Health, and Safety Market?

Scope of the Report

Report Metrics

Details

Market size available for years

2018-2029

Base year considered

2023

Forecast period

2024–2029

Forecast units

Value (USD) Million/Billion

Segments Covered

By Offering (software and services), Application, Vertical and Region

Region covered

North America, Europe, Asia Pacific, Middle East & Africa, and Latin America

Companies covered

The major players in the environment, health, and safety market are VelocityEHS (US), Wolters Kluwer (Netherlands), Intelex Technologies (Canada), Benchmark ESG (US), Cority Software Inc. (Canada), Sphera (US), Intertek (UK), Quentic (Germany), UL Solutions (US), Ideagen (UK), SAP (Germany), IBM (US), Evotix (UK), EcoOnline (Norway), Diligent Corporation (US),  ETQ (US), 3E (US), Dakota Software Corporation (US), IsoMetrix (US), Enhesa (US), VisiumKMS (US),  SafetyCulture (Australia), TextContext (Canada), ComplianceQuest (US), Pro-Sapien (UK), SHEQX (Australia), CMO Software (UK), Indus Environmental Services (India), Inicia (Japan), ASK-EHS Engineering (India), SHE Group (South Africa), and EHS Brazil (Brazil).

This research report categorizes the environment, health, and safety market to forecast revenues and analyze trends in each of the following submarkets:

Based on Offering:
  • Software
  • Services
    • Analytics Services
    • Project Deployment and Implementation Services
    • Business Consulting and Advisory Services
    • Audit, Assessment, and Regulatory Compliance Services
    • Certification Services
    • Training and Support services
Based on Application:
  • Health Safety Management
  • Environmental & Sustainability Management
  • Waste Management
  • Energy & Water Management
  • Air Quality & Compliance Management
  • Incident & Risk Management
  • Other Applications
Based on Vertical:
  • Energy and Utilities
  • Chemicals and Materials 
  • Healthcare and Lifesciences
  • Construction and Engineering
  • Food and Beverage
  • Government and Defense
  • Other Vertical
By Region:
  • North America
    • United States (US)
    • Canada
  • Europe
    • United Kingdom (UK)
    • Germany
    • France
    • Italy
    • Spain
    • Nordic
    • Rest of Europe
  • Asia Pacific
    • China
    • Japan
    • India
    • Australia & New Zealand
    • South Korea
    • Southeast Asia
    • Rest of Asia Pacific
  • Middle East and Africa
    • GCC Countries
      • UAE
      • KSA
      • Rest of GCC Countries
    • South Africa
    • Rest of the Middle East & Africa
  • Latin America
    • Brazil
    • Mexico
    • Rest of Latin America

Recent Developments:

  • In February 2024, VelocityEHS acquired Contractor Compliance, a Canadian-based enterprise safety and risk management software solution provider. The deal adds innovative third-party contractor and vendor compliance capabilities to the award-winning VelocityEHS Accelerate Platform.
  • In August 2023, UL Solutions announced the acquisition of CERE, a privately owned, Madrid-based third-party testing, simulation, and certification company.
  • In May 2023, Cority announced the acquisition of Greenstone, a UK-headquartered software company with a suite of sustainability solutions for enterprises, supply chains, and asset managers. This marks the third sustainability-focused acquisition for Cority in the past two years, including WeSustain and Reporting 21.
  • In January 2023, Wolters Kluwer Legal & Regulatory announced it had acquired Della AI Ltd., a provider of leading AI technology based on advanced NLP. This technology was expected to allow legal professionals to review contracts in multiple languages by simply asking questions.

Frequently Asked Questions (FAQ):

To speak to our analyst for a discussion on the above findings, click Speak to Analyst

Exclusive indicates content/data unique to MarketsandMarkets and not available with any competitors.

INTRODUCTION
28
RESEARCH METHODOLOGY
33
EXECUTIVE SUMMARY
44
PREMIUM INSIGHTS
47
MARKET OVERVIEW AND INDUSTRY TRENDS
50
  • 5.1 INTRODUCTION
  • 5.2 MARKET DYNAMICS
    DRIVERS
    - Increase in government initiatives to follow workforce safety and environmental regulations and standards
    - Digitally connected workforce with connected wearables for safe operations to improve EHS management
    - Need to improve risk visibility by identifying hidden risks within organizations and increasing transparency of workflow
    - Proliferation of software-as-a-service deployment model
    - Growing recognition of EHS as strategic business imperative
    RESTRAINTS
    - High costs associated with EHS software solutions
    - Lack of qualified EHS professionals
    - Data silos and information gaps
    OPPORTUNITIES
    - Increase in government initiatives for low carbon emission policies
    - Technological innovations to help various industries achieve worker engagement and adopt quality programs
    - Modernization of industry infrastructure for low carbon emissions
    CHALLENGES
    - Technological integration and data management
    - Poor regulatory frameworks in emerging economies
    - Lack of skilled workforce and end-to-end solutions
  • 5.3 ENVIRONMENT, HEALTH, AND SAFETY MARKET: BRIEF HISTORY
  • 5.4 VALUE CHAIN ANALYSIS
  • 5.5 ECOSYSTEM
  • 5.6 CASE STUDIES
    BRUCE POWER OPTIMIZED NUCLEAR POWER GENERATION WITH IBM MAXIMO
    HARLEY DAVIDSON USED PROCESSMAP’S EHS SOLUTION TO IMPROVE WORKER SAFETY
    AGNICO EAGLE MINES ADOPTED INTELEX’S HEALTH & SAFETY MANAGEMENT SUITE FOR RISK ASSESSMENT
    OWENS GROUP USED EVOTIX’S SOLUTION TO MANAGE EMPLOYEE HEALTH AND SAFETY INFORMATION
    FRAZER USED VELOCITYEHS’ SOLUTION TO MANAGE SAFETY PROGRAM-RELATED INFORMATION
  • 5.7 PORTER’S FIVE FORCES MODEL
    THREAT OF NEW ENTRANTS
    THREAT OF SUBSTITUTES
    BARGAINING POWER OF BUYERS
    BARGAINING POWER OF SUPPLIERS
    INTENSITY OF COMPETITIVE RIVALRY
  • 5.8 PATENT ANALYSIS
    METHODOLOGY
  • 5.9 DISRUPTIONS IMPACTING BUYERS/CLIENTS IN ENVIRONMENT, HEALTH, AND SAFETY MARKET
  • 5.10 PRICING ANALYSIS
    AVERAGE SELLING PRICE TREND OF KEY PLAYERS, BY SOLUTION
    INDICATIVE PRICING ANALYSIS OF KEY PLAYERS, BY SOLUTION & SERVICE
  • 5.11 KEY STAKEHOLDERS AND BUYING CRITERIA
    KEY STAKEHOLDERS IN BUYING PROCESS
    BUYING CRITERIA
  • 5.12 TECHNOLOGY ANALYSIS
    KEY TECHNOLOGIES
    - Artificial Intelligence
    - Industrial Internet of Things and Big Data
    - Data Analytics and Visualization
    ADJACENT TECHNOLOGIES
    - Sustainability management software and environmental management systems
    - Industrial automation and control systems
    - Geospatial technologies
    COMPLEMENTARY TECHNOLOGIES
    - Virtual reality (VR) and augmented reality (AR)
    - Robotics and automation
    - Blockchain
  • 5.13 TARIFF AND REGULATORY LANDSCAPE
    TARIFF RELATED TO ENVIRONMENT, HEALTH, AND SAFETY DEVICES
  • 5.14 REGULATORY LANDSCAPE
    NORTH AMERICA
    EUROPE
    - France
    - UK
    ASIA PACIFIC
    - China
    - South Korea
    - Japan
    MIDDLE EAST & AFRICA
    - UAE
    - Saudi Arabia
    LATIN AMERICA
    - Brazil
    - Mexico
  • 5.15 KEY CONFERENCES & EVENTS
  • 5.16 TECHNOLOGY ROADMAP FOR ENVIRONMENT, HEALTH, AND SAFETY MARKET
    SHORT-TERM ROADMAP (2023–2025):
    MID-TERM ROADMAP (2026–2028):
    LONG-TERM ROADMAP (2029–2030):
  • 5.17 BEST PRACTICES IN ENVIRONMENT, HEALTH, AND SAFETY MARKET
  • 5.18 CURRENT AND EMERGING BUSINESS MODELS
  • 5.19 TOOLS, FRAMEWORKS, AND TECHNIQUES USED IN ENVIRONMENT, HEALTH, AND SAFETY MARKET
  • 5.20 HS CODES: ELECTRICAL APPARATUS FOR SWITCHING OR PROTECTING ELECTRICAL CIRCUITS OR FOR MAKING CONNECTIONS TO OR IN ELECTRICAL CIRCUITS (8535)
    EXPORT SCENARIO FOR HS CODE: 8535
    IMPORT SCENARIO FOR HS CODE: 8535
  • 5.21 INVESTMENT AND FUNDING SCENARIO
ENVIRONMENT, HEALTH, AND SAFETY MARKET, BY OFFERING
89
  • 6.1 INTRODUCTION
    OFFERING: ENVIRONMENT, HEALTH, AND SAFETY MARKET DRIVERS
  • 6.2 SOFTWARE
    EHS SOFTWARE ENSURES COMPLIANCE AND MINIMIZES RISK OF HEFTY FINES OR OPERATIONAL SHUTDOWN
  • 6.3 SERVICES
    ANALYTICS SERVICES
    - Need for aggregation and analysis of data from multiple resources to drive growth
    PROJECT DEPLOYMENT & IMPLEMENTATION SERVICES
    - Project deployment services to assist in smooth transitioning of organizations’ historical EHS data and speedy integration
    BUSINESS CONSULTING & ADVISORY SERVICES
    - Business consulting services to assist in digital transformation and evolution of business processes through EHS
    AUDIT, ASSESSMENT, AND REGULATORY COMPLIANCE SERVICES
    - Focus on identifying waste minimization and recycling to spur demand
    CERTIFICATION SERVICES
    - Certification services to offer competitive advantage and enhanced processes
    TRAINING & SUPPORT SERVICES
    - Training & support services address and analyze data retrieved from EHS solutions
ENVIRONMENT, HEALTH, AND SAFETY MARKET, BY APPLICATION
102
  • 7.1 INTRODUCTION
    APPLICATION: ENVIRONMENT, HEALTH, AND SAFETY MARKET DRIVERS
  • 7.2 HEALTH & SAFETY MANAGEMENT
    HEALTH & SAFETY MANAGEMENT TO REDUCE COSTS AND PROMOTE SAFE WORK CULTURE
  • 7.3 ENVIRONMENTAL & SUSTAINABILITY MANAGEMENT
    EMPHASIS ON AIR EMISSIONS MANAGEMENT, WATER QUALITY METRICS, AND HAZARDOUS WASTE TRACKING TO PROPEL GROWTH
  • 7.4 WASTE MANAGEMENT
    WASTE REDUCTION STRATEGIES TO ENSURE REGULATORY COMPLIANCE AND IMPROVE ENVIRONMENTAL PERFORMANCE
  • 7.5 ENERGY & WATER MANAGEMENT
    ENERGY & WATER MANAGEMENT SYSTEM TO HELP ORGANIZATIONS CONSERVE OPPORTUNITIES AND TRACK SUSTAINABILITY FOOTPRINT
  • 7.6 AIR QUALITY & COMPLIANCE MANAGEMENT
    AIR QUALITY & COMPLIANCE MANAGEMENT FEATURE TO ASSIST IN COMPLETE EMISSIONS MANAGEMENT
  • 7.7 INCIDENT & RISK MANAGEMENT
    INCIDENT & RISK MANAGEMENT SOLUTION TO FACILITATE IDENTIFICATION, ANALYSIS, MONITORING, AND TREATMENT OF HAZARDS
  • 7.8 OTHER APPLICATIONS
ENVIRONMENT, HEALTH, AND SAFETY MARKET, BY VERTICAL
106
  • 8.1 INTRODUCTION
    VERTICAL: ENVIRONMENT, HEALTH, AND SAFETY MARKET DRIVERS
  • 8.2 ENERGY & UTILITIES
    INHERENT RISKS ASSOCIATED WITH ENERGY PRODUCTION, TRANSMISSION, AND DISTRIBUTION TO DRIVE MARKET
    ENERGY & UTILITIES: ENVIRONMENT, HEALTH, AND SAFETY USE CASES
    - Workplace safety in power plants
    - Environmental compliance in oil and gas operations
    - Workers’ health in utility maintenance
  • 8.3 CHEMICALS & MATERIALS
    EHS SOLUTIONS TO HELP MANAGE WORKFORCE AND ENSURE WORKPLACE SAFETY
    CHEMICALS & MATERIALS: ENVIRONMENT, HEALTH, AND SAFETY USE CASES
    - Hazardous chemical management
    - Process safety management
    - Occupational health and safety
    - Environmental compliance
  • 8.4 HEALTHCARE & LIFE SCIENCES
    EHS SOLUTIONS TO ENABLE ORGANIZATIONS STREAMLINE PROCESSES, REDUCE COSTS, AND IMPROVE PERFORMANCE
    HEALTHCARE & LIFE SCIENCES: ENVIRONMENT, HEALTH, AND SAFETY USE CASES
    - Pharmaceutical manufacturing
    - Laboratory safety
    - Medical device safety
    - Healthcare waste management
  • 8.5 CONSTRUCTION & ENGINEERING
    EHS SOFTWARE TO STREAMLINE ESSENTIAL SAFETY PROCESSES AND ENSURE COMPLIANCE WITH REGULATIONS
    CONSTRUCTION & ENGINEERING: ENVIRONMENT, HEALTH, AND SAFETY USE CASES
    - Site safety management
    - Noise and air quality monitoring
    - Emergency preparedness and response
    - Environmental compliance
  • 8.6 FOOD & BEVERAGE
    ADOPTION OF EHS SOFTWARE TO TAKE CARE OF ENVIRONMENTAL MANAGEMENT
    FOOD & BEVERAGE: ENVIRONMENT, HEALTH, AND SAFETY USE CASES
    - Food safety compliance
    - Supply chain safety
    - Product labeling and packaging compliance
  • 8.7 GOVERNMENT & DEFENSE
    EHS SOLUTIONS TO ASSIST GOVERNMENT AND DEFENSE ORGANIZATIONS
    GOVERNMENT & DEFENSE: ENVIRONMENT, HEALTH, AND SAFETY USE CASES
    - Military base safety
    - Environmental protection
    - Emergency preparedness and response
  • 8.8 OTHER VERTICALS
ENVIRONMENT, HEALTH, AND SAFETY MARKET, BY REGION
120
  • 9.1 INTRODUCTION
  • 9.2 NORTH AMERICA
    NORTH AMERICA: ENVIRONMENT, HEALTH, AND SAFETY MARKET DRIVERS
    NORTH AMERICA: RECESSION IMPACT
    US
    - Government initiatives and plans to drive demand for EHS solutions
    CANADA
    - Increasing efforts for workplace safety with regulations to drive market
  • 9.3 EUROPE
    EUROPE: ENVIRONMENT, HEALTH, AND SAFETY MARKET DRIVERS
    EUROPE: RECESSION IMPACT
    UK
    - Focus on waste management, emissions reduction strategies, and clean energy adoption to propel market growth
    GERMANY
    - Government initiatives and large-scale investments in sustainable production processes to create demand for EHS solutions
    FRANCE
    - Increasing emphasis on environmental sustainability and employee well-being to accelerate market growth
    ITALY
    - Environmental protection regulations to foster market growth
    SPAIN
    - Increasing investments toward renewable energy and sustainable technologies to boost market
    NORDICS
    - Health and safety initiatives to boost adoption of EHS solutions
    REST OF EUROPE
  • 9.4 ASIA PACIFIC
    ASIA PACIFIC: ENVIRONMENT, HEALTH, AND SAFETY MARKET DRIVERS
    ASIA PACIFIC: RECESSION IMPACT
    CHINA
    - Increasing adoption of IoT and AI technologies to bolster market growth
    INDIA
    - EHS regulatory and policy trends to drive market
    JAPAN
    - Stringent laws and regulations to fuel market growth
    AUSTRALIA AND NEW ZEALAND
    - Stringent regulations to promote secure environment for workers to accelerate growth
    SOUTH KOREA
    - New amendments in law and strict legislation to boost market
    SOUTHEAST ASIA
    - ASEAN-OSHNET functions to help member countries achieve better occupational safety and health performance
    REST OF ASIA PACIFIC
  • 9.5 MIDDLE EAST & AFRICA
    MIDDLE EAST & AFRICA: ENVIRONMENT, HEALTH, AND SAFETY MARKET DRIVERS
    MIDDLE EAST & AFRICA: RECESSION IMPACT
    GCC COUNTRIES
    - Government initiatives, economic diversification efforts, and adoption of emerging technologies to drive market
    - KSA
    - UAE
    - REST OF GCC COUNTRIES
    SOUTH AFRICA
    - Customized EHS solutions and need for cost optimization to accelerate market growth
    REST OF MIDDLE EAST & AFRICA
  • 9.6 LATIN AMERICA
    LATIN AMERICA: ENVIRONMENT, HEALTH, AND SAFETY MARKET DRIVERS
    LATIN AMERICA: RECESSION IMPACT
    BRAZIL
    - Regulatory reforms and technological advancements to open new avenues for market growth
    MEXICO
    - Digitalization and country’s focus on deploying renewable energy sources to propel growth
    REST OF LATIN AMERICA
COMPETITIVE LANDSCAPE
170
  • 10.1 OVERVIEW
  • 10.2 KEY PLAYER STRATEGIES/RIGHT TO WIN
  • 10.3 REVENUE ANALYSIS
  • 10.4 MARKET SHARE ANALYSIS
  • 10.5 COMPANY EVALUATION MATRIX: KEY PLAYERS, 2023
    STARS
    EMERGING LEADERS
    PERVASIVE PLAYERS
    PARTICIPANTS
    COMPANY FOOTPRINT
  • 10.6 COMPANY EVALUATION MATRIX: STARTUPS/SMES, 2023
    PROGRESSIVE COMPANIES
    RESPONSIVE COMPANIES
    DYNAMIC COMPANIES
    STARTING BLOCKS
    COMPETITIVE BENCHMARKING
  • 10.7 COMPETITIVE SCENARIO
    PRODUCT LAUNCHES
    DEALS
  • 10.8 BRAND/PRODUCT COMPARISON
  • 10.9 COMPANY VALUATION AND FINANCIAL METRICS
COMPANY PROFILES
191
  • 11.1 MAJOR PLAYERS
    WOLTERS KLUWER
    - Business overview
    - Products/Solutions/Services offered
    - Recent developments
    - MnM view
    VELOCITYEHS
    - Business overview
    - Products/Solutions/Services offered
    - Recent developments
    - MnM view
    INTELEX
    - Business overview
    - Products/Solutions/Services offered
    - Recent developments
    - MnM view
    BENCHMARK ESG
    - Business overview
    - Products/Solutions/Services offered
    - Recent developments
    - MnM view
    CORITY
    - Business overview
    - Products/Solutions/Services offered
    - Recent developments
    - MnM view
    INTERTEK
    - Business overview
    - Products/Solutions/Services offered
    - Recent developments
    SPHERA (BLACKSTONE)
    - Business overview
    - Products/Solutions/Services offered
    - Recent developments
    QUENTIC (AMCS)
    - Business overview
    - Products/Solutions/Services offered
    - Recent developments
    UL SOLUTIONS
    - Business overview
    - Products/Solutions/Services offered
    - Recent developments
    IDEAGEN
    - Business overview
    - Products/Solutions/Services offered
    - Recent developments
    SAP
    IBM
    EVOTIX
    ECOONLINE
    DILIGENT CORPORATION
    ETQ
    3E
    DAKOTA SOFTWARE
    ISOMETRIX
    ENHESA
  • 11.2 STARTUPS/SMES
    VISIUMKMS
    SAFETYCULTURE
    TRUECONTEXT
    COMPLIANCEQUEST
    PRO-SAPIEN
    SHEQX
    CMO SOFTWARE
    INDUS ENVIRONMENTAL SERVICES
    INICIA
    ASK-EHS
    SHE GROUP
    EHS BRASIL
ADJACENT/RELATED MARKETS
235
  • 12.1 INTRODUCTION
    LIMITATIONS
  • 12.2 GREEN TECHNOLOGY AND SUSTAINABILITY MARKET
    MARKET DEFINITION
    GREEN TECHNOLOGY AND SUSTAINABILITY MARKET, BY OFFERING
    GREEN TECHNOLOGY AND SUSTAINABILITY MARKET, BY TECHNOLOGY
    GREEN TECHNOLOGY AND SUSTAINABILITY MARKET, BY VERTICAL
  • 12.3 CARBON FOOTPRINT MANAGEMENT MARKET
    MARKET DEFINITION
    CARBON FOOTPRINT MANAGEMENT MARKET, BY COMPONENT
    CARBON FOOTPRINT MANAGEMENT MARKET, BY DEPLOYMENT MODE
    CARBON FOOTPRINT MANAGEMENT MARKET, BY ORGANIZATION SIZE
    CARBON FOOTPRINT MANAGEMENT MARKET, BY VERTICAL
APPENDIX
247
  • 13.1 DISCUSSION GUIDE
  • 13.2 KNOWLEDGESTORE: MARKETSANDMARKETS’ SUBSCRIPTION PORTAL
  • 13.3 CUSTOMIZATION OPTIONS
  • 13.4 RELATED REPORTS
  • 13.5 AUTHOR DETAILS
LIST OF TABLES
 
  • TABLE 1 USD EXCHANGE RATES, 2021–2023
  • TABLE 2 RISK ASSESSMENT
  • TABLE 3 RESEARCH ASSUMPTIONS
  • TABLE 4 ENVIRONMENTAL REGULATIONS, ACTS, AND LAWS
  • TABLE 5 ENVIRONMENT, HEALTH, AND SAFETY MARKET: ECOSYSTEM
  • TABLE 6 IMPACT OF PORTER’S FORCES ON ENVIRONMENT, HEALTH, AND SAFETY MARKET
  • TABLE 7 AVERAGE SELLING PRICE TREND OF KEY PLAYERS
  • TABLE 8 INDICATIVE PRICING ANALYSIS OF KEY ENVIRONMENT, HEALTH, AND SAFETY SOLUTION & SERVICE VENDORS
  • TABLE 9 INFLUENCE OF STAKEHOLDERS ON BUYING PROCESS FOR KEY VERTICALS
  • TABLE 10 KEY BUYING CRITERIA FOR TOP THREE VERTICALS
  • TABLE 11 TARIFF RELATED TO ELECTRICAL APPARATUS FOR SWITCHING OR PROTECTING ELECTRICAL CIRCUITS OR FOR MAKING CONNECTIONS TO OR IN ELECTRICAL CIRCUITS
  • TABLE 12 NORTH AMERICA: LIST OF REGULATORY BODIES, GOVERNMENT AGENCIES, AND OTHER ORGANIZATIONS
  • TABLE 13 EUROPE: LIST OF REGULATORY BODIES, GOVERNMENT AGENCIES, AND OTHER ORGANIZATIONS
  • TABLE 14 ASIA PACIFIC: LIST OF REGULATORY BODIES, GOVERNMENT AGENCIES, AND OTHER ORGANIZATIONS
  • TABLE 15 REST OF THE WORLD: LIST OF REGULATORY BODIES, GOVERNMENT AGENCIES, AND OTHER ORGANIZATIONS
  • TABLE 16 ENVIRONMENT, HEALTH, AND SAFETY MARKET: LIST OF CONFERENCES & EVENTS, 2024–2025
  • TABLE 17 ENVIRONMENT, HEALTH, AND SAFETY MARKET, BY OFFERING, 2018–2023 (USD MILLION)
  • TABLE 18 ENVIRONMENT, HEALTH, AND SAFETY MARKET, BY OFFERING, 2024–2029 (USD MILLION)
  • TABLE 19 SOFTWARE: ENVIRONMENT, HEALTH, AND SAFETY MARKET, BY REGION, 2018–2023 (USD MILLION)
  • TABLE 20 SOFTWARE: ENVIRONMENT, HEALTH, AND SAFETY MARKET, BY REGION, 2024–2029 (USD MILLION)
  • TABLE 21 SERVICES: ENVIRONMENT, HEALTH, AND SAFETY MARKET, BY REGION, 2018–2023 (USD MILLION)
  • TABLE 22 SERVICES: ENVIRONMENT, HEALTH, AND SAFETY MARKET, BY REGION, 2024–2029 (USD MILLION)
  • TABLE 23 SERVICES: ENVIRONMENT, HEALTH, AND SAFETY MARKET, BY TYPE, 2018–2023 (USD MILLION)
  • TABLE 24 SERVICES: ENVIRONMENT, HEALTH, AND SAFETY MARKET, BY TYPE, 2024–2029 (USD MILLION)
  • TABLE 25 ANALYTICS SERVICES: ENVIRONMENT, HEALTH, AND SAFETY MARKET, BY REGION, 2018–2023 (USD MILLION)
  • TABLE 26 ANALYTICS SERVICES: ENVIRONMENT, HEALTH, AND SAFETY MARKET, BY REGION, 2024–2029 (USD MILLION)
  • TABLE 27 PROJECT DEPLOYMENT & IMPLEMENTATION SERVICES: ENVIRONMENT, HEALTH, AND SAFETY MARKET, BY REGION, 2018–2023 (USD MILLION)
  • TABLE 28 PROJECT DEPLOYMENT & IMPLEMENTATION SERVICES: ENVIRONMENT, HEALTH, AND SAFETY MARKET, BY REGION, 2024–2029 (USD MILLION)
  • TABLE 29 BUSINESS CONSULTING & ADVISORY SERVICES: ENVIRONMENT, HEALTH, AND SAFETY MARKET, BY REGION, 2018–2023 (USD MILLION)
  • TABLE 30 BUSINESS CONSULTING & ADVISORY SERVICES: ENVIRONMENT, HEALTH, AND SAFETY MARKET, BY REGION, 2024–2029 (USD MILLION)
  • TABLE 31 AUDIT, ASSESSMENT, AND REGULATORY COMPLIANCE SERVICES: ENVIRONMENT, HEALTH, AND SAFETY MARKET, BY REGION, 2018–2023 (USD MILLION)
  • TABLE 32 AUDIT, ASSESSMENT, AND REGULATORY COMPLIANCE SERVICES: ENVIRONMENT, HEALTH, AND SAFETY MARKET, BY REGION, 2024–2029 (USD MILLION)
  • TABLE 33 CERTIFICATION SERVICES: ENVIRONMENT, HEALTH, AND SAFETY MARKET, BY REGION, 2018–2023 (USD MILLION)
  • TABLE 34 CERTIFICATION SERVICES: ENVIRONMENT, HEALTH, AND SAFETY MARKET, BY REGION, 2024–2029 (USD MILLION)
  • TABLE 35 TRAINING & SUPPORT SERVICES: ENVIRONMENT, HEALTH, AND SAFETY MARKET, BY REGION, 2018–2023 (USD MILLION)
  • TABLE 36 TRAINING & SUPPORT SERVICES: ENVIRONMENT, HEALTH, AND SAFETY MARKET, BY REGION, 2024–2029 (USD MILLION)
  • TABLE 37 ENVIRONMENT, HEALTH, AND SAFETY MARKET, BY VERTICAL, 2018–2023 (USD MILLION)
  • TABLE 38 ENVIRONMENT, HEALTH, AND SAFETY MARKET, BY VERTICAL, 2024–2029 (USD MILLION)
  • TABLE 39 ENERGY & UTILITIES: ENVIRONMENT, HEALTH, AND SAFETY MARKET, BY REGION, 2018–2023 (USD MILLION)
  • TABLE 40 ENERGY & UTILITIES: ENVIRONMENT, HEALTH, AND SAFETY MARKET, BY REGION, 2024–2029 (USD MILLION)
  • TABLE 41 CHEMICALS & MATERIALS: ENVIRONMENT, HEALTH, AND SAFETY MARKET, BY REGION, 2018–2023 (USD MILLION)
  • TABLE 42 CHEMICALS & MATERIALS: ENVIRONMENT, HEALTH, AND SAFETY MARKET, BY REGION, 2024–2029 (USD MILLION)
  • TABLE 43 HEALTHCARE & LIFE SCIENCES: ENVIRONMENT, HEALTH, AND SAFETY MARKET, BY REGION, 2018–2023 (USD MILLION)
  • TABLE 44 HEALTHCARE & LIFE SCIENCES: ENVIRONMENT, HEALTH, AND SAFETY MARKET, BY REGION, 2024–2029 (USD MILLION)
  • TABLE 45 CONSTRUCTION & ENGINEERING: ENVIRONMENT, HEALTH, AND SAFETY MARKET, BY REGION, 2018–2023 (USD MILLION)
  • TABLE 46 CONSTRUCTION & ENGINEERING: ENVIRONMENT, HEALTH, AND SAFETY MARKET, BY REGION, 2024–2029 (USD MILLION)
  • TABLE 47 FOOD & BEVERAGE: ENVIRONMENT, HEALTH, AND SAFETY MARKET, BY REGION, 2018–2023 (USD MILLION)
  • TABLE 48 FOOD & BEVERAGE: ENVIRONMENT, HEALTH, AND SAFETY MARKET, BY REGION, 2024–2029 (USD MILLION)
  • TABLE 49 GOVERNMENT & DEFENSE: ENVIRONMENT, HEALTH, AND SAFETY MARKET, BY REGION, 2018–2023 (USD MILLION)
  • TABLE 50 GOVERNMENT & DEFENSE: ENVIRONMENT, HEALTH, AND SAFETY MARKET, BY REGION, 2024–2029 (USD MILLION)
  • TABLE 51 OTHER VERTICALS: ENVIRONMENT, HEALTH, AND SAFETY MARKET, BY REGION, 2018–2023 (USD MILLION)
  • TABLE 52 OTHER VERTICALS: ENVIRONMENT, HEALTH, AND SAFETY MARKET, BY REGION, 2024–2029 (USD MILLION)
  • TABLE 53 ENVIRONMENT, HEALTH, AND SAFETY MARKET, BY REGION, 2018–2023 (USD MILLION)
  • TABLE 54 ENVIRONMENT, HEALTH, AND SAFETY MARKET, BY REGION, 2024–2029 (USD MILLION)
  • TABLE 55 NORTH AMERICA: ENVIRONMENT, HEALTH, AND SAFETY MARKET, BY OFFERING, 2018–2023 (USD MILLION)
  • TABLE 56 NORTH AMERICA: ENVIRONMENT, HEALTH, AND SAFETY MARKET, BY OFFERING, 2024–2029 (USD MILLION)
  • TABLE 57 NORTH AMERICA: ENVIRONMENT, HEALTH, AND SAFETY MARKET, BY SERVICE, 2018–2023 (USD MILLION)
  • TABLE 58 NORTH AMERICA: ENVIRONMENT, HEALTH, AND SAFETY MARKET, BY SERVICE, 2024–2029 (USD MILLION)
  • TABLE 59 NORTH AMERICA: ENVIRONMENT, HEALTH, AND SAFETY MARKET, BY VERTICAL, 2018–2023 (USD MILLION)
  • TABLE 60 NORTH AMERICA: ENVIRONMENT, HEALTH, AND SAFETY MARKET, BY VERTICAL, 2024–2029 (USD MILLION)
  • TABLE 61 NORTH AMERICA: ENVIRONMENT, HEALTH, AND SAFETY MARKET, BY COUNTRY, 2018–2023 (USD MILLION)
  • TABLE 62 NORTH AMERICA: ENVIRONMENT, HEALTH, AND SAFETY MARKET, BY COUNTRY, 2024–2029 (USD MILLION)
  • TABLE 63 US: ENVIRONMENT, HEALTH, AND SAFETY MARKET, BY OFFERING, 2018–2023 (USD MILLION)
  • TABLE 64 US: ENVIRONMENT, HEALTH, AND SAFETY MARKET, BY OFFERING, 2024–2029 (USD MILLION)
  • TABLE 65 US: ENVIRONMENT, HEALTH, AND SAFETY MARKET, BY SERVICE, 2018–2023 (USD MILLION)
  • TABLE 66 US: ENVIRONMENT, HEALTH, AND SAFETY MARKET, BY SERVICE, 2024–2029 (USD MILLION)
  • TABLE 67 US: ENVIRONMENT, HEALTH, AND SAFETY MARKET, BY VERTICAL, 2018–2023 (USD MILLION)
  • TABLE 68 US: ENVIRONMENT, HEALTH, AND SAFETY MARKET, BY VERTICAL, 2024–2029 (USD MILLION)
  • TABLE 69 CANADA: ENVIRONMENT, HEALTH, AND SAFETY MARKET, BY OFFERING, 2018–2023 (USD MILLION)
  • TABLE 70 CANADA: ENVIRONMENT, HEALTH, AND SAFETY MARKET, BY OFFERING, 2024–2029 (USD MILLION)
  • TABLE 71 CANADA: ENVIRONMENT, HEALTH, AND SAFETY MARKET, BY SERVICE, 2018–2023 (USD MILLION)
  • TABLE 72 CANADA: ENVIRONMENT, HEALTH, AND SAFETY MARKET, BY SERVICE, 2024–2029 (USD MILLION)
  • TABLE 73 CANADA: ENVIRONMENT, HEALTH, AND SAFETY MARKET, BY VERTICAL, 2018–2023 (USD MILLION)
  • TABLE 74 CANADA: ENVIRONMENT, HEALTH, AND SAFETY MARKET, BY VERTICAL, 2024–2029 (USD MILLION)
  • TABLE 75 EUROPE: ENVIRONMENT, HEALTH, AND SAFETY MARKET, BY OFFERING, 2018–2023 (USD MILLION)
  • TABLE 76 EUROPE: ENVIRONMENT, HEALTH, AND SAFETY MARKET, BY OFFERING, 2024–2029 (USD MILLION)
  • TABLE 77 EUROPE: ENVIRONMENT, HEALTH, AND SAFETY MARKET, BY SERVICE, 2018–2023 (USD MILLION)
  • TABLE 78 EUROPE: ENVIRONMENT, HEALTH, AND SAFETY MARKET, BY SERVICE, 2024–2029 (USD MILLION)
  • TABLE 79 EUROPE: ENVIRONMENT, HEALTH, AND SAFETY MARKET, BY VERTICAL, 2018–2023 (USD MILLION)
  • TABLE 80 EUROPE: ENVIRONMENT, HEALTH, AND SAFETY MARKET, BY VERTICAL, 2024–2029 (USD MILLION)
  • TABLE 81 EUROPE: ENVIRONMENT, HEALTH, AND SAFETY MARKET, BY COUNTRY, 2018–2023 (USD MILLION)
  • TABLE 82 EUROPE: ENVIRONMENT, HEALTH, AND SAFETY MARKET, BY COUNTRY, 2024–2029 (USD MILLION)
  • TABLE 83 UK: ENVIRONMENT, HEALTH, AND SAFETY MARKET, BY OFFERING, 2018–2023 (USD MILLION)
  • TABLE 84 UK: ENVIRONMENT, HEALTH, AND SAFETY MARKET, BY OFFERING, 2024–2029 (USD MILLION)
  • TABLE 85 UK: ENVIRONMENT, HEALTH, AND SAFETY MARKET, BY SERVICE, 2018–2023 (USD MILLION)
  • TABLE 86 UK: ENVIRONMENT, HEALTH, AND SAFETY MARKET, BY SERVICE, 2024–2029 (USD MILLION)
  • TABLE 87 UK: ENVIRONMENT, HEALTH, AND SAFETY MARKET, BY VERTICAL, 2018–2023 (USD MILLION)
  • TABLE 88 UK: ENVIRONMENT, HEALTH, AND SAFETY MARKET, BY VERTICAL, 2024–2029 (USD MILLION)
  • TABLE 89 GERMANY: ENVIRONMENT, HEALTH, AND SAFETY MARKET, BY OFFERING, 2018–2023 (USD MILLION)
  • TABLE 90 GERMANY: ENVIRONMENT, HEALTH, AND SAFETY MARKET, BY OFFERING, 2024–2029 (USD MILLION)
  • TABLE 91 GERMANY: ENVIRONMENT, HEALTH, AND SAFETY MARKET, BY SERVICE, 2018–2023 (USD MILLION)
  • TABLE 92 GERMANY: ENVIRONMENT, HEALTH, AND SAFETY MARKET, BY SERVICE, 2024–2029 (USD MILLION)
  • TABLE 93 GERMANY: ENVIRONMENT, HEALTH, AND SAFETY MARKET, BY VERTICAL, 2018–2023 (USD MILLION)
  • TABLE 94 GERMANY: ENVIRONMENT, HEALTH, AND SAFETY MARKET, BY VERTICAL, 2024–2029 (USD MILLION)
  • TABLE 95 ASIA PACIFIC: ENVIRONMENT, HEALTH, AND SAFETY MARKET, BY OFFERING, 2018–2023 (USD MILLION)
  • TABLE 96 ASIA PACIFIC: ENVIRONMENT, HEALTH, AND SAFETY MARKET, BY OFFERING, 2024–2029 (USD MILLION)
  • TABLE 97 ASIA PACIFIC: ENVIRONMENT, HEALTH, AND SAFETY MARKET, BY SERVICE, 2018–2023 (USD MILLION)
  • TABLE 98 ASIA PACIFIC: ENVIRONMENT, HEALTH, AND SAFETY MARKET, BY SERVICE, 2024–2029 (USD MILLION)
  • TABLE 99 ASIA PACIFIC: ENVIRONMENT, HEALTH, AND SAFETY MARKET, BY VERTICAL, 2018–2023 (USD MILLION)
  • TABLE 100 ASIA PACIFIC: ENVIRONMENT, HEALTH, AND SAFETY MARKET, BY VERTICAL, 2024–2029 (USD MILLION)
  • TABLE 101 ASIA PACIFIC: ENVIRONMENT, HEALTH, AND SAFETY MARKET, BY COUNTRY, 2018–2023 (USD MILLION)
  • TABLE 102 ASIA PACIFIC: ENVIRONMENT, HEALTH, AND SAFETY MARKET, BY COUNTRY, 2024–2029 (USD MILLION)
  • TABLE 103 CHINA: ENVIRONMENT, HEALTH, AND SAFETY MARKET, BY OFFERING, 2018–2023 (USD MILLION)
  • TABLE 104 CHINA: ENVIRONMENT, HEALTH, AND SAFETY MARKET, BY OFFERING, 2024–2029 (USD MILLION)
  • TABLE 105 CHINA: ENVIRONMENT, HEALTH, AND SAFETY MARKET, BY SERVICE, 2018–2023 (USD MILLION)
  • TABLE 106 CHINA: ENVIRONMENT, HEALTH, AND SAFETY MARKET, BY SERVICE, 2024–2029 (USD MILLION)
  • TABLE 107 CHINA: ENVIRONMENT, HEALTH, AND SAFETY MARKET, BY VERTICAL, 2018–2023 (USD MILLION)
  • TABLE 108 CHINA: ENVIRONMENT, HEALTH, AND SAFETY MARKET, BY VERTICAL, 2024–2029 (USD MILLION)
  • TABLE 109 INDIA: ENVIRONMENT, HEALTH, AND SAFETY MARKET, BY OFFERING, 2018–2023 (USD MILLION)
  • TABLE 110 INDIA: ENVIRONMENT, HEALTH, AND SAFETY MARKET, BY OFFERING, 2024–2029 (USD MILLION)
  • TABLE 111 INDIA: ENVIRONMENT, HEALTH, AND SAFETY MARKET, BY SERVICE, 2018–2023 (USD MILLION)
  • TABLE 112 INDIA: ENVIRONMENT, HEALTH, AND SAFETY MARKET, BY SERVICE, 2024–2029 (USD MILLION)
  • TABLE 113 INDIA: ENVIRONMENT, HEALTH, AND SAFETY MARKET, BY VERTICAL, 2018–2023 (USD MILLION)
  • TABLE 114 INDIA: ENVIRONMENT, HEALTH, AND SAFETY MARKET, BY VERTICAL, 2024–2029 (USD MILLION)
  • TABLE 115 MIDDLE EAST & AFRICA: ENVIRONMENT, HEALTH, AND SAFETY MARKET, BY OFFERING, 2018–2023 (USD MILLION)
  • TABLE 116 MIDDLE EAST & AFRICA: ENVIRONMENT, HEALTH, AND SAFETY MARKET, BY OFFERING, 2024–2029 (USD MILLION)
  • TABLE 117 MIDDLE EAST & AFRICA: ENVIRONMENT, HEALTH, AND SAFETY MARKET, BY SERVICE, 2018–2023 (USD MILLION)
  • TABLE 118 MIDDLE EAST & AFRICA: ENVIRONMENT, HEALTH, AND SAFETY MARKET, BY SERVICE, 2024–2029 (USD MILLION)
  • TABLE 119 MIDDLE EAST & AFRICA: ENVIRONMENT, HEALTH, AND SAFETY MARKET, BY VERTICAL, 2018–2023 (USD MILLION)
  • TABLE 120 MIDDLE EAST & AFRICA: ENVIRONMENT, HEALTH, AND SAFETY MARKET, BY VERTICAL, 2024–2029 (USD MILLION)
  • TABLE 121 MIDDLE EAST & AFRICA: ENVIRONMENT, HEALTH, AND SAFETY MARKET, BY COUNTRY, 2018–2023 (USD MILLION)
  • TABLE 122 MIDDLE EAST & AFRICA: ENVIRONMENT, HEALTH, AND SAFETY MARKET, BY COUNTRY, 2024–2029 (USD MILLION)
  • TABLE 123 MIDDLE EAST & AFRICA: ENVIRONMENT, HEALTH, AND SAFETY MARKET, BY GCC COUNTRY, 2018–2023 (USD MILLION)
  • TABLE 124 MIDDLE EAST & AFRICA: ENVIRONMENT, HEALTH, AND SAFETY MARKET, BY GCC COUNTRY, 2024–2029 (USD MILLION)
  • TABLE 125 KSA: ENVIRONMENT, HEALTH, AND SAFETY MARKET, BY OFFERING, 2018–2023 (USD MILLION)
  • TABLE 126 KSA: ENVIRONMENT, HEALTH, AND SAFETY MARKET, BY OFFERING, 2024–2029 (USD MILLION)
  • TABLE 127 KSA: ENVIRONMENT, HEALTH, AND SAFETY MARKET, BY SERVICE, 2018–2023 (USD MILLION)
  • TABLE 128 KSA: ENVIRONMENT, HEALTH, AND SAFETY MARKET, BY SERVICE, 2024–2029 (USD MILLION)
  • TABLE 129 KSA: ENVIRONMENT, HEALTH, AND SAFETY MARKET, BY VERTICAL, 2018–2023 (USD MILLION)
  • TABLE 130 KSA: ENVIRONMENT, HEALTH, AND SAFETY MARKET, BY VERTICAL, 2024–2029 (USD MILLION)
  • TABLE 131 LATIN AMERICA: ENVIRONMENT, HEALTH, AND SAFETY MARKET, BY OFFERING, 2018–2023 (USD MILLION)
  • TABLE 132 LATIN AMERICA: ENVIRONMENT, HEALTH, AND SAFETY MARKET, BY OFFERING, 2024–2029 (USD MILLION)
  • TABLE 133 LATIN AMERICA: ENVIRONMENT, HEALTH, AND SAFETY MARKET, BY SERVICE, 2018–2023 (USD MILLION)
  • TABLE 134 LATIN AMERICA: ENVIRONMENT, HEALTH, AND SAFETY MARKET, BY SERVICE, 2024–2029 (USD MILLION)
  • TABLE 135 LATIN AMERICA: ENVIRONMENT, HEALTH, AND SAFETY MARKET, BY VERTICAL, 2018–2023 (USD MILLION)
  • TABLE 136 LATIN AMERICA: ENVIRONMENT, HEALTH, AND SAFETY MARKET, BY VERTICAL, 2024–2029 (USD MILLION)
  • TABLE 137 LATIN AMERICA: ENVIRONMENT, HEALTH, AND SAFETY MARKET, BY COUNTRY, 2018–2023 (USD MILLION)
  • TABLE 138 LATIN AMERICA: ENVIRONMENT, HEALTH, AND SAFETY MARKET, BY COUNTRY, 2024–2029 (USD MILLION)
  • TABLE 139 BRAZIL: ENVIRONMENT, HEALTH, AND SAFETY MARKET, BY OFFERING, 2018–2023 (USD MILLION)
  • TABLE 140 BRAZIL: ENVIRONMENT, HEALTH, AND SAFETY MARKET, BY OFFERING, 2024–2029 (USD MILLION)
  • TABLE 141 BRAZIL: ENVIRONMENT, HEALTH, AND SAFETY MARKET, BY SERVICE, 2018–2023 (USD MILLION)
  • TABLE 142 BRAZIL: ENVIRONMENT, HEALTH, AND SAFETY MARKET, BY SERVICE, 2024–2029 (USD MILLION)
  • TABLE 143 BRAZIL: ENVIRONMENT, HEALTH, AND SAFETY MARKET, BY VERTICAL, 2018–2023 (USD MILLION)
  • TABLE 144 BRAZIL: ENVIRONMENT, HEALTH, AND SAFETY MARKET, BY VERTICAL, 2024–2029 (USD MILLION)
  • TABLE 145 OVERVIEW OF STRATEGIES ADOPTED BY KEY PLAYERS IN ENVIRONMENT, HEALTH, AND SAFETY MARKET
  • TABLE 146 ENVIRONMENT, HEALTH, AND SAFETY MARKET: DEGREE OF COMPETITION
  • TABLE 147 ENVIRONMENT, HEALTH, AND SAFETY MARKET: COMPANY OFFERING FOOTPRINT
  • TABLE 148 ENVIRONMENT, HEALTH, AND SAFETY MARKET: COMPANY REGIONAL FOOTPRINT
  • TABLE 149 ENVIRONMENT, HEALTH, AND SAFETY MARKET: COMPANY VERTICAL FOOTPRINT
  • TABLE 150 LIST OF KEY STARTUPS/SMES, 2023
  • TABLE 151 ENVIRONMENT, HEALTH, AND SAFETY MARKET: COMPETITIVE BENCHMARKING OF KEY STARTUPS/SMES
  • TABLE 152 ENVIRONMENT, HEALTH, AND SAFETY MARKET: PRODUCT LAUNCHES, JANUARY 2021–JANUARY 2024
  • TABLE 153 ENVIRONMENT, HEALTH, AND SAFETY MARKET: DEALS, JANUARY 2021–FEBRUARY 2024
  • TABLE 154 WOLTERS KLUWER: BUSINESS OVERVIEW
  • TABLE 155 WOLTERS KLUWER: PRODUCTS/SOLUTIONS/SERVICES OFFERED
  • TABLE 156 WOLTERS KLUWER: PRODUCT LAUNCHES
  • TABLE 157 WOLTERS KLUWER: DEALS
  • TABLE 158 VELOCITYEHS: BUSINESS OVERVIEW
  • TABLE 159 VELOCITYEHS: PRODUCTS/SOLUTIONS/SERVICES OFFERED
  • TABLE 160 VELOCITYEHS: PRODUCT LAUNCHES
  • TABLE 161 VELOCITYEHS: DEALS
  • TABLE 162 INTELEX: BUSINESS OVERVIEW
  • TABLE 163 INTELEX: PRODUCTS/SOLUTIONS/SERVICES OFFERED
  • TABLE 164 INTELEX: PRODUCT LAUNCHES
  • TABLE 165 INTELEX: DEALS
  • TABLE 166 BENCHMARK ESG: BUSINESS OVERVIEW
  • TABLE 167 BENCHMARK ESG: PRODUCTS/SOLUTIONS/SERVICES OFFERED
  • TABLE 168 BENCHMARK ESG: PRODUCT LAUNCHES
  • TABLE 169 CORITY: BUSINESS OVERVIEW
  • TABLE 170 CORITY: PRODUCTS/SOLUTIONS/SERVICES OFFERED
  • TABLE 171 CORITY: PRODUCT LAUNCHES
  • TABLE 172 CORITY: DEALS
  • TABLE 173 INTERTEK: BUSINESS OVERVIEW
  • TABLE 174 INTERTEK: PRODUCTS/SOLUTIONS/SERVICES OFFERED
  • TABLE 175 INTERTEK: PRODUCT LAUNCHES
  • TABLE 176 INTERTEK: DEALS
  • TABLE 177 SPHERA: BUSINESS OVERVIEW
  • TABLE 178 SPHERA: PRODUCTS/SOLUTIONS/SERVICES OFFERED
  • TABLE 179 SPHERA: PRODUCT LAUNCHES
  • TABLE 180 SPHERA: DEALS
  • TABLE 181 QUENTIC: BUSINESS OVERVIEW
  • TABLE 182 QUENTIC: PRODUCTS/SOLUTIONS/SERVICES OFFERED
  • TABLE 183 QUENTIC: PRODUCT LAUNCHES
  • TABLE 184 QUENTIC: DEALS
  • TABLE 185 UL SOLUTIONS: BUSINESS OVERVIEW
  • TABLE 186 UL SOLUTIONS: PRODUCTS/SOLUTIONS/SERVICES OFFERED
  • TABLE 187 UL SOLUTIONS: PRODUCT LAUNCHES
  • TABLE 188 UL SOLUTIONS: DEALS
  • TABLE 189 IDEAGEN: BUSINESS OVERVIEW
  • TABLE 190 IDEAGEN: PRODUCTS/SOLUTIONS/SERVICES OFFERED
  • TABLE 191 IDEAGEN: PRODUCT LAUNCHES
  • TABLE 192 IDEAGEN: DEALS
  • TABLE 193 GREEN TECHNOLOGY & SUSTAINABILITY MARKET, BY OFFERING, 2019–2023 (USD MILLION)
  • TABLE 194 GREEN TECHNOLOGY & SUSTAINABILITY MARKET, BY OFFERING, 2024–2030 (USD MILLION)
  • TABLE 195 SOLUTIONS: GREEN TECHNOLOGY & SUSTAINABILITY MARKET, BY REGION, 2019–2023 (USD MILLION)
  • TABLE 196 SOLUTIONS: GREEN TECHNOLOGY & SUSTAINABILITY MARKET, BY REGION, 2024–2030 (USD MILLION)
  • TABLE 197 GREEN TECHNOLOGY & SUSTAINABILITY MARKET, BY SERVICE, 2019–2023 (USD MILLION)
  • TABLE 198 GREEN TECHNOLOGY & SUSTAINABILITY MARKET, BY SERVICE, 2024–2030 (USD MILLION)
  • TABLE 199 SERVICES: GREEN TECHNOLOGY & SUSTAINABILITY MARKET, BY REGION, 2019–2023 (USD MILLION)
  • TABLE 200 SERVICES: GREEN TECHNOLOGY & SUSTAINABILITY MARKET, BY REGION, 2024–2030 (USD MILLION)
  • TABLE 201 GREEN TECHNOLOGY & SUSTAINABILITY MARKET, BY TECHNOLOGY, 2019–2023 (USD MILLION)
  • TABLE 202 GREEN TECHNOLOGY & SUSTAINABILITY MARKET, BY TECHNOLOGY, 2024–2030 (USD MILLION)
  • TABLE 203 GREEN TECHNOLOGY & SUSTAINABILITY MARKET, BY VERTICAL, 2019–2023 (USD MILLION)
  • TABLE 204 GREEN TECHNOLOGY & SUSTAINABILITY MARKET, BY VERTICAL, 2024–2030 (USD MILLION)
  • TABLE 205 CARBON FOOTPRINT MANAGEMENT MARKET, BY COMPONENT, 2017–2021 (USD MILLION)
  • TABLE 206 CARBON FOOTPRINT MANAGEMENT MARKET, BY COMPONENT, 2022–2028 (USD MILLION)
  • TABLE 207 SOLUTIONS: CARBON FOOTPRINT MANAGEMENT MARKET, BY REGION, 2017–2021 (USD MILLION)
  • TABLE 208 SOLUTIONS: CARBON FOOTPRINT MANAGEMENT MARKET, BY REGION, 2022–2028 (USD MILLION)
  • TABLE 209 SERVICES: CARBON FOOTPRINT MANAGEMENT MARKET, BY REGION, 2017–2021 (USD MILLION)
  • TABLE 210 SERVICES: CARBON FOOTPRINT MANAGEMENT MARKET, BY REGION, 2022–2028 (USD MILLION)
  • TABLE 211 CARBON FOOTPRINT MANAGEMENT MARKET, BY SERVICE, 2017–2021 (USD MILLION)
  • TABLE 212 CARBON FOOTPRINT MANAGEMENT MARKET, BY SERVICE, 2022–2028 (USD MILLION)
  • TABLE 213 CARBON FOOTPRINT MANAGEMENT MARKET, BY DEPLOYMENT MODE, 2017–2021 (USD MILLION)
  • TABLE 214 CARBON FOOTPRINT MANAGEMENT MARKET, BY DEPLOYMENT MODE, 2022–2028 (USD MILLION)
  • TABLE 215 CARBON FOOTPRINT MANAGEMENT MARKET, BY ORGANIZATION SIZE, 2017–2021 (USD MILLION)
  • TABLE 216 CARBON FOOTPRINT MANAGEMENT MARKET, BY ORGANIZATION SIZE, 2022–2028 (USD MILLION)
  • TABLE 217 CARBON FOOTPRINT MANAGEMENT MARKET, BY VERTICAL, 2017–2021 (USD MILLION)
  • TABLE 218 CARBON FOOTPRINT MANAGEMENT MARKET, BY VERTICAL, 2022–2028 (USD MILLION)
LIST OF FIGURES
 
  • FIGURE 1 MARKET SEGMENTATION
  • FIGURE 2 ENVIRONMENT, HEALTH, AND SAFETY MARKET: REGIONS COVERED
  • FIGURE 3 ENVIRONMENT, HEALTH, AND SAFETY MARKET: RESEARCH DESIGN
  • FIGURE 4 APPROACH 1 (SUPPLY SIDE): REVENUE OF SOLUTIONS/SERVICES OF ENVIRONMENT, HEALTH, AND SAFETY MARKET PLAYERS
  • FIGURE 5 MARKET SIZE ESTIMATION USING BOTTOM-UP APPROACH (SUPPLY-SIDE): COLLECTIVE REVENUE FROM ALL SOLUTIONS/SERVICES OFFERED BY MARKET VENDORS
  • FIGURE 6 DATA TRIANGULATION
  • FIGURE 7 ENVIRONMENT, HEALTH, AND SAFETY MARKET TO WITNESS SIGNIFICANT GROWTH DURING FORECAST PERIOD
  • FIGURE 8 ENVIRONMENT, HEALTH, AND SAFETY MARKET: HOLISTIC VIEW
  • FIGURE 9 CONFLUENCE OF ECONOMIC, ENVIRONMENTAL, SOCIAL, AND TECHNOLOGICAL FORCES TO FUEL MARKET GROWTH
  • FIGURE 10 SEGMENTS WITH HIGH PROJECTED GROWTH RATE IN 2024
  • FIGURE 11 PROJECT DEPLOYMENT & IMPLEMENTATION SERVICES SEGMENT TO LEAD MARKET IN 2024
  • FIGURE 12 ENERGY & UTILITIES SEGMENT TO LEAD MARKET DURING FORECAST PERIOD
  • FIGURE 13 SOFTWARE AND ENERGY & UTILITIES SEGMENTS ESTIMATED TO ACCOUNT FOR LARGEST MARKET SHARES IN 2024
  • FIGURE 14 ENVIRONMENT, HEALTH, AND SAFETY MARKET: DRIVERS, RESTRAINTS, OPPORTUNITIES, AND CHALLENGES
  • FIGURE 15 BRIEF HISTORY OF ENVIRONMENT, HEALTH, AND SAFETY MARKET
  • FIGURE 16 ENVIRONMENT, HEALTH, AND SAFETY MARKET: VALUE CHAIN ANALYSIS
  • FIGURE 17 KEY PLAYERS IN ENVIRONMENT, HEALTH, AND SAFETY MARKET ECOSYSTEM
  • FIGURE 18 PORTER’S FIVE FORCES ANALYSIS
  • FIGURE 19 MAJOR PATENTS GRANTED FOR ENVIRONMENT, HEALTH, AND SAFETY IN LAST TEN YEARS
  • FIGURE 20 ENVIRONMENT, HEALTH, AND SAFETY MARKET: DISRUPTIONS IMPACTING BUYERS/CLIENTS
  • FIGURE 21 AVERAGE SELLING PRICE TREND OF KEY PLAYERS, BY SOLUTION (USD PER YEAR)
  • FIGURE 22 INFLUENCE OF STAKEHOLDERS ON BUYING PROCESS FOR KEY VERTICALS
  • FIGURE 23 KEY BUYING CRITERIA FOR TOP THREE VERTICALS
  • FIGURE 24 TOOLS, FRAMEWORKS, AND TECHNIQUES USED IN ENVIRONMENT, HEALTH, AND SAFETY MARKET
  • FIGURE 25 ELECTRICAL APPARATUS FOR SWITCHING OR PROTECTING ELECTRICAL CIRCUITS OR FOR MAKING CONNECTIONS TO OR IN ELECTRICAL CIRCUITS, BY KEY COUNTRY, 2020–2022 (USD MILLION)
  • FIGURE 26 IMPORT VALUE OF ELECTRICAL APPARATUS FOR SWITCHING OR PROTECTING ELECTRICAL CIRCUITS OR FOR MAKING CONNECTIONS TO OR IN ELECTRICAL CIRCUITS, BY KEY COUNTRY, 2020–2022 (USD MILLION)
  • FIGURE 27 INVESTMENT AND FUNDING SCENARIO
  • FIGURE 28 SERVICES SEGMENT TO GROW AT HIGHER CAGR DURING FORECAST PERIOD
  • FIGURE 29 ANALYTICS SERVICES SEGMENT TO GROW AT HIGHES CAGR DURING FORECAST PERIOD
  • FIGURE 30 ENERGY & UTILITIES VERTICAL TO LEAD MARKET DURING FORECAST PERIOD
  • FIGURE 31 ENVIRONMENT, HEALTH, AND SAFETY MARKET: REGIONAL SNAPSHOT
  • FIGURE 32 NORTH AMERICA: MARKET SNAPSHOT
  • FIGURE 33 ASIA PACIFIC: MARKET SNAPSHOT
  • FIGURE 34 REVENUE ANALYSIS OF KEY PLAYERS, 2019–2023
  • FIGURE 35 SHARE OF LEADING COMPANIES IN ENVIRONMENT, HEALTH, AND SAFETY MARKET
  • FIGURE 36 ENVIRONMENT, HEALTH, AND SAFETY MARKET: COMPANY EVALUATION MATRIX (KEY PLAYERS), 2023
  • FIGURE 37 ENVIRONMENT, HEALTH, AND SAFETY MARKET: COMPANY FOOTPRINT
  • FIGURE 38 ENVIRONMENT, HEALTH, AND SAFETY MARKET: COMPANY EVALUATION MATRIX (STARTUPS/SMES), 2023
  • FIGURE 39 BRAND/PRODUCT COMPARISON
  • FIGURE 40 VALUATION AND FINANCIAL METRICS OF KEY ENVIRONMENT, HEALTH, AND SAFETY VENDORS
  • FIGURE 41 WOLTERS KLUWER: COMPANY SNAPSHOT
  • FIGURE 42 INTERTEK: COMPANY SNAPSHOT

The research study involved four major activities in estimating the environment, health, and safety market size. Exhaustive secondary research has been done to collect important information about the market and peer markets. The next step has been to validate these findings and assumptions and size them with the help of primary research with industry experts across the value chain. Both top-down and bottom-up approaches have been used to estimate the market size. Post which the market breakdown and data triangulation have been adopted to estimate the market sizes of segments and sub-segments.

Secondary Research

The market size of the companies offering environment, health, and safety to various end users was arrived at based on the secondary data available through paid and unpaid sources and by analyzing the product portfolios of major companies in the ecosystem and rating the companies based on their performance and quality. In the secondary research process, various sources were referred to identify and collect information for the study. The secondary sources included annual reports, best practices, international organization websites and resources (UN-Habitat, Zero Waste Europe, Global Carbon Project, Emissions Database for Global Atmospheric Research (EDGAR), International Energy Agency (IEA), United Nations Framework Convention on Climate Change (UNFCC), Union of Concerned Scientists, U.S. Green Building Council, and Environmental Protection Agency), press releases and investor presentations of companies, white papers, journals, and certified publications and articles from recognized authors, directories, and databases.

Secondary research was used to obtain critical information about the industry’s supply chain, the total pool of key players, market classification and segmentation according to the industry trends to the bottom-most level, regional markets, and key developments from market- and technology-oriented perspectives, all of which were further validated by primary sources.

Primary Research

In the primary research process, various sources from the supply and demand sides were interviewed to obtain qualitative and quantitative information for the report. The primary sources from the supply side included Chief Executive Officers (CEOs), Chief Technology Officers (CTOs), Chief Operating Officers (COOs), Vice Presidents (VPs), Managing Directors (MDs), technology and innovation directors, and related key executives from various key companies and organizations operating in the environment, health, and safety market.

Primary interviews were conducted to gather insights, such as market statistics, data on revenue collected from software and services, market breakups, market size estimations, market forecasts, and data triangulation. Stakeholders from the demand side, such as Chief Information Officers (CIOs), Chief Finance Officers (CFOs), Chief Strategy Officers (CSOs), and the installation team of end users who use environment, health, and safety, were interviewed to understand buyers’ perspectives on suppliers, products, service providers, and their current usage of environment, health, and safety solution and services, which is expected to affect the overall environment, health, and safety market growth.
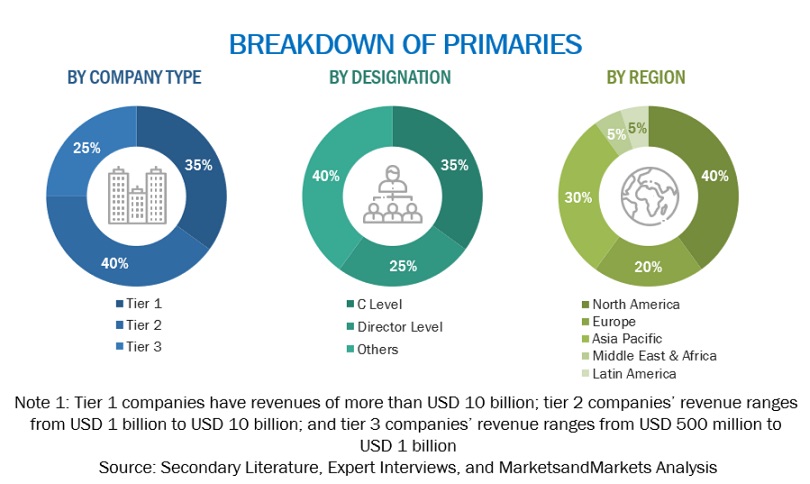
Environment, Health, and Safety  Market Size, and Share

To know about the assumptions considered for the study, download the pdf brochure

Market Size Estimation

In the market engineering process, the top-down and bottom-up approaches were used along with multiple data triangulation methods to estimate and validate the size of the environment, health, and safety market, as well as other dependent submarkets. The research methodology used to estimate the market sizes includes the following:

  • Initially, MarketsandMarkets focuses on top-line investments and spending in the ecosystems. Further, significant developments in the critical market area have been considered.
  • Tracking the recent and upcoming developments in the environment, health, and safety market that include investments, R&D activities, product launches, collaborations, mergers and acquisitions, and partnerships, as well as forecasting the market size based on these developments and other critical parameters.
  • Conduct multiple discussions with key opinion leaders to learn about the diverse types of authentications and brand protection offerings used and the applications for which they are used to analyze the breakdown of the scope of work carried out by major companies.
  • Segmenting the market based on technology types concerning applications wherein the types are to be used and deriving the size of the global application market.
  • Segmenting the overall market into various market segments
  • Validating the estimates at every level through discussions with key opinion leaders, such as chief executives (CXOs), directors, and operation managers, and finally with the domain experts at MarketsandMarkets

Market Size Estimation Methodology-Bottom-up approach
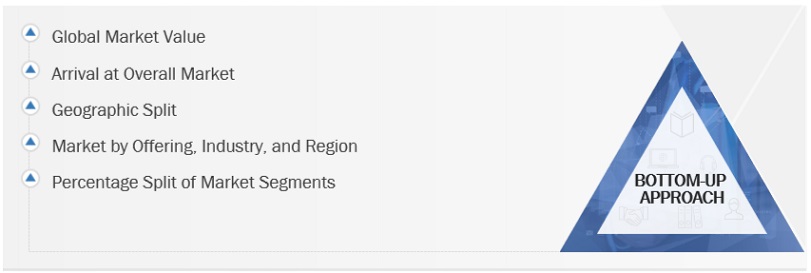
Environment, Health, and Safety  Market Bottom Up Approach

To know about the assumptions considered for the study, Request for Free Sample Report

Market Size Estimation Methodology-top-down approach

Environment, Health, and Safety  Market Top Down Approach

Data Triangulation

After arriving at the overall market size from the above estimation process, the environment, health, and safety market has been split into several segments and sub-segments. To complete the overall market engineering process and arrive at the exact statistics for all segments and sub-segments, data triangulation and market breakdown procedures have been used, wherever applicable. The data has been triangulated by studying various factors and trends from both the demand and supply sides.

The environment, health, and safety market size has been validated using top-down and bottom-up approaches.

Market Definition

An EHS system streamlines EHS management by automating safety program management and simplifying government regulatory compliance. It prioritizes greater user engagement and collaboration to reduce operational risks and improve health and safety performance while achieving corporate sustainability goals. The EHS market includes software and services that aim to reduce environmental pollution (including air, water, and soil) and protect workers' health, thereby improving ergonomics and confirming a risk-free workplace. This EHS software has various features, such as environment and sustainability management, waste management, health and safety management, industrial hygiene management, energy and water management, incident and risk management, and air quality and compliance management.

Stakeholders

  • EHS Software Providers
  • EHS Service Providers
  • System Integrators
  • Consultancy and Advisory Firms
  • Certification and Training Firms
  • Regulatory Agencies
  • Governments
  • Chief Technology And Data Officers
  • Workplace Safety Service Professionals
  • Business Analysts
  • Information Technology (IT) Professionals
  • Investors and Venture Capitalists
  • Third-party Providers
  • Managed And Professional Service Providers

Report Objectives

  • To determine and forecast the global environment, health, and safety market by offering (software and services), application, vertical, and region from 2024 to 2029, and analyze the various macroeconomic and microeconomic factors affecting market growth.
  • To forecast the size of the market segments concerning five central regions: North America, Europe, Asia Pacific (APAC), Middle East & Africa (MEA), and Latin America.
  • To provide detailed information about the major factors (drivers, restraints, opportunities, and challenges) influencing the growth of the market.
  • Analyze each submarket concerning individual growth trends, prospects, and contributions to the overall market.
  • To analyze the opportunities in the market for stakeholders by identifying the high-growth segments of the environment, health, and safety market.
  • To profile the key market players; provide a comparative analysis based on business overviews, regional presence, product offerings, business strategies, and key financials; and illustrate the market’s competitive landscape.
  • Track and analyze competitive developments in the market, such as mergers and acquisitions, product developments, partnerships and collaborations, and Research and Development (R&D) activities.

Available Customizations

With the given market data, MarketsandMarkets offers customizations per the company’s specific needs. The following customization options are available for the report:

Geographic Analysis

  • Further break-up of the Asia Pacific market into countries contributing 75% to the regional market size
  • Further break-up of the North American market into countries contributing 75% to the regional market size
  • Further break-up of the Latin American market into countries contributing 75% to the regional market size
  • Further break-up of the Middle East African market into countries contributing 75% to the regional market size
  • Further break-up of the European market into countries contributing 75% to the regional market size

Company Information

  • Detailed analysis and profiling of additional market players (up to 5)
Custom Market Research Services

We will customize the research for you, in case the report listed above does not meet with your exact requirements. Our custom research will comprehensively cover the business information you require to help you arrive at strategic and profitable business decisions.

Request Customization

Instant Answers with GPT - Ask Now!

Ask real questions. Get complete answers !
Report Code
TC 6122
Published ON
Apr, 2024
Choose License Type
BUY NOW
  • SHARE
X
Request Customization
Speak to Analyst
Speak to Analyst
OR FACE-TO-FACE MEETING
PERSONALIZE THIS RESEARCH
  • Triangulate with your Own Data
  • Get Data as per your Format and Definition
  • Gain a Deeper Dive on a Specific Application, Geography, Customer or Competitor
  • Any level of Personalization
REQUEST A FREE CUSTOMIZATION
LET US HELP YOU!
  • What are the Known and Unknown Adjacencies Impacting the Environment, Health, and Safety Market
  • What will your New Revenue Sources be?
  • Who will be your Top Customer; what will make them switch?
  • Defend your Market Share or Win Competitors
  • Get a Scorecard for Target Partners
CUSTOMIZED WORKSHOP REQUEST
knowledgestore logo

Want to explore hidden markets that can drive new revenue in Environment, Health, and Safety Market?

Find Hidden Markets
  • Call Us
  • +1-888-600-6441 (Corporate office hours)
  • +1-888-600-6441 (US/Can toll free)
  • +44-800-368-9399 (UK office hours)
CONNECT WITH US
ABOUT TRUST ONLINE
©2024 MarketsandMarkets Research Private Ltd. All rights reserved
DMCA.com Protection Status
Website Feedback