Electronic Waste Recycling Market

Report Code MM 9218
Published in Nov, 2024, By MarketsandMarkets™
Download PDF

Choose License Type

Buy Report Now Inquire Before Buying

Electronic Waste Recycling Market by Source (Household Appliances, Consumer Electronics, IT & Telecommunication, Mobile Computing Devices), Materials (Glass, Metal, Plastics), Technology, and Region - Global Forecast to 2029

Overview

The global electronic waste recycling market is valued at USD 48.41 billion in 2024 and is projected to reach USD 66.33 billion by 2029, growing at 6.5% cagr from 2024 to 2029. Electronic waste recycling refers to the process of collecting, sorting, grouping, shredding, and processing of older electronic components, devices, and scrapped components to recover valuable materials that can be reused in various other applications. With increasing penetration of electronics usage in day to day life of people, coupled with advancements in technology, it is expected to generate huge volume of electronic scrap. These electronic scraps are then recycled by the companies, driven by government regulations on environmental protection and landfill management. Companies are entering the recycling market for reaching their sustainability goals and incorporate circular economy for manufacturing their products.

Attractive Opportunities in the Electronic Waste Recycling Market

Asia Pacific

Growth in the Asia Pacific electronic waste recycling market can be attributed to the growth of the electronics usage in the region, the presence of key recyclers in the region, and regulatory compliance.

The increasing electronic waste generation and stringent regulations on environmental and landfill management.

Extended Producer Responsibility is enabling the manufacturers to achieve control over the electronic scraps, aiding in formalizing the channels for recycling.

The electronic waste recycling market is expected to be worth USD 66.33 billion by 2029, growing at CAGR of 6.5% during the forecast period.

Rising consumer demands for sustainable products and circular economy principles by recyclers are great opportunities for market growth.

Global Electronic Waste Recycling Market Dynamics

DRIVER: Growing production of consumer electronics

The rapid growth in the production of consumer electronics has increased electronic waste generation, which boosts the need for companies to recycle and recover materials from this e-waste. With the advancement of technology, the demand for consumer gadgets and computing devices increases, and the volume of discarded materials is expected to rise significantly in the future.

The companies are looking to start their own recycling plant or partnering with existing recyclers to recover the materials and use them in future product to reduce the cost of purchasing new materials. Recycling of electronic waste not only helps recover materials but also aids in avoiding environmental damage, if the electronic waste is dumped in a landfill. For example, the improper handling of e-waste can lead to the release of toxic chemicals and substances that can raise health risks to humans and the environment.

The government across the countries are promoting Extended Producer Responsibility to increase the participation of companies who manufacture electronic products and make them work toward responsible scrapping and recycling of scrapped electronic devices.

RESTRAINT: Economic viability and high establishment cost

The high cost of recycling of electronic waste is expected to restrain market growth during the forecast period. High initial setup cost, and economic viability of Return of Interest (ROI), acts as restraining factors for new companies in entering the recycling market. The substantial initial investments are required for building infrastructure, and setting up machinery and equipment, required for the processes to be undertaken. The increasing operating costs for skilled labor, energy, maintenance, and regulatory compliance, compound the financial burden on recycling companies.

The economic feasibility of e-waste recycling is heavily influenced by the volume and the type of material that is processed and extracted. Economies of scale is the only way to achieve profitability of recyclers. The overall throughput efficiency should be set very high for any given recycling facility to offset the high initial setup and operational costs.

Fluctuations in material prices in the commodity market, are heavily influencing the revenue of these recyclers, affecting them in attaining profitability.

In addition to these factors, the cost to comply with the regulations and policy frameworks, coupled with economically underdeveloped regions/countries increases the chances for economic risks for the recyclers.


OPPORTUNITY: Circular economy initiatives by recyclers

As the global economy is adopting sustainability, the recyclers are adopting circular economy principles that emphasize the continual use of resources through reuse and recycle, minimizing waste and reducing the environmental impact. This shift not only aligns with consumer preferences for sustainable products but also enhances the operations efficiency of recycling processes.

Recycler are incorporating strategies to create closed-loop systems on how electronic wastes are recycled and refurbished, and put back into production cycles. By focusing on resource recovery, recyclers extract valuable materials such as precious metals, including lithium, rare-earth, and gold, from discarded electronics. This approach aids in the conservation of natural resources eventually reducing the stress on gross imports of the country for precious metals.

The collaboration of recyclers and manufacturers is becoming increasingly prevalent. Many companies are now integrating recycled materials into their production processes, improving the implementation of circular economy principles.

CHALLENGES: Disproportionate handling capacity to actual waste generation

As global e-waste generation continues to rise, the existing infrastructure struggles to keep up the pace for waste generation. The existing recycling facilities are also not capable of handling the large capacities, increasing the bottleneck in processing and increasing inefficiencies in the market.

In certain regions, the gap between waste generation and recycling capacity is very high. Although, being a developed country, the recycling capacity of the US is comparatively low. The significant difference between the amount of electronics that are discarded and the amount that is recycled is concerning. Governments are taking action by implementing policies to encourage and require companies to incorporate recycling into their standard production processes. This will help extract materials and minimize the amount of e-waste that ends up in landfills.

For addressing these issues, the need for investments in technology, infrastructure, and creating public awareness are critical for enhancing the efficiency and effectiveness of e-waste management practices globally.

Global Electronic Waste Recycling Market Ecosystem Analysis

The ecosystem of the electronic waste recycling market involves identifying and analyzing interconnected relationships among various stakeholders, including raw material suppliers, recyclers, distributors, contractors, and end users. The raw material suppliers are the source point from where the electronic wastes are supplied to the recyclers. It can be individual/general consumers through an established collection center or an enterprise that puts its older hardware for recycling through partnered recyclers. The recyclers are responsible for collecting electronic waste, sorting, shredding, and recycling, and recovering the materials.. The distributors and contractors are the ones who establish the contact between the companies and these recyclers to concentrate the supply chain thereby increasing the operational efficiency and increasing profitability. These contractors are mostly the resellers, who take the older devices from consumers in exchange for money or discounts for upgrade to newer machinery. The end-use industries use the recovered materials from these older electronic devices and put them into the process of manufacturing newer products from these materials.


Based on materials, the metals segment is projected to register the highest CAGR during the forecast period.

Metals are the major source of revenue generation for the recycler despite the miniscule volume when compared with other materials. As the price of metals are controlled by commodity market, the market is very much dependent on the trends of prices of these metals. The recyclers are working on increasing their metal recovery rate to support their operational conditions. With an increase in costs of metals such as gold, palladium, lithium, and other rare-earth metals, the likeliness of companies to recover these high value materials is high, which is expected to increase the market for metals in the electronic waste market.

Based on source, the IT & Telecommunications segment is expected to register the highest CAGR during the forecast period.

IT & Telecommunications segment involves the devices used inside companies, where each device is tagged and audited properly during its lifetime and is tracked to ensure proper recycling and recovery of valuable materials. IT & Telecommunication companies are the primary sources for the recyclers to source high volumes of electronic scrap at a single source. These IT companies are also required to take measures to responsibly scrap their electronic wastes, promoting opportunities for the recyclers to gain an even higher volume of scrap from a single source thereby reducing the logistical challenges and increasing their profitability. This is expected to grow with stringent environmental regulations in place by allowing the IT & Telecommunications segment to grow at a higher CAGR during the forecast period.

Based on Technology, the Hydrometallurgy process segment is expected to register the highest CAGR during the forecast period.

The hydrometallurgy process involves subjecting the shredded electronic components to solvents and acids to dissolve the metals of choice from the complex mixture, allowing the separation of specific materials. Since the process involves the use of solvents and acids to recover the materials and once the materials are precipitated and extracted, these solvents and acids are easily recoverable that can be used again in the process. This brings down the operational cost, resulting in an increase in profitability for the recyclers. This drives the market to increasingly adopt this technological process for metal recovery, which is both profitable and causes less or no damage to the environment. This is expected to drive growth in this segment, with the highest CAGR during the forecast period.

Asia Pacific to be the fastest-growing region in the electronic waste recycling market during the forecast period.

Asia Pacific is projected to register the highest CAGR in the electronic waste recycling market during the forecast period. Factors such as rising urbanization and industrialization, coupled with significant expenditure in the electronics sector, are the primary drivers for market growth.

With several companies setting up their manufacturing facilities in China, India, Vietnam, and other countries in the region owing to the cheap labor, are now bound to comply with regulatory authorities for practicing Extended Producer Responsibility (EPR), increasing the involvement of manufacturers in the recycling of their products, thereby reducing the electronic wastes dumped in landfill.

The countries are also increasingly concerned about the environmental damage caused due to continuous metal extraction, which can be substituted by recycling. This helps to reduce the mining activities and also reduce the stress on gross imports of the country by promoting circular economic activities. These factors are expected to expected to allow the market in the Asia Pacific region to grow at a higher pace.

HIGHEST CAGR MARKET IN 2024-2029
CHINA FASTEST GROWING MARKET IN THE REGION

Recent Developments of Electronic Waste Recycling Market

  • In May 2024, Call2Recycle Inc., and Ascend Elements Inc., signed an agreement under which Call2Recycle will bring customized electric vehicle battery management, logistics, and recycling services, to automotive dealerships, recyclers, and repair facilities. This program aims at improving the knowledge and handling capacity of lithium batteries for Call2Recycle Inc.
  • In April 2024, ERI partnered with Staples, Inc. to broaden nationwide store-based recycling services, including rechargeable and single-use alkaline batteries.
  • In February 2024, Stena Metall AB and Morrow signed an agreement to recycle the battery production scrap from Morrow Cell Factory, located in Arendal, Norway, and safely recycle the scrap to reuse them in further battery cell production cycles.
  • In January 2024, Stena Metall AB and BASF entered into a partnership under which Stena will collect, assess, and pre-treat end-of-life batteries and battery production scrap to produce black mass in its battery recycling facility in Halmstad, Sweden.

Key Market Players

KEY PLAYERS IN THE TRANSFECTION TECHNOLOGIES MARKET INCLUDE

Want to explore hidden markets that can drive new revenue in Electronic Waste Recycling Market?

Scope of the Report

Report Metric Details
Market size available for years 2021-2029
Base Year Considered 2023
Forecast period 2024-2029
Forecast units Value (USD Million/Billion), Volume (Kiloton)
Segments covered By Material, By Source, By Technology, and By Region
Geographies covered Europe, North America, Asia Pacific, Latin America, Middle East, and Africa


Key Questions Addressed by the Report

Which are the major companies in the electronic waste recycling market? What are the key strategies adopted by market players to strengthen their market presence?
Some of the key players in the Electronic Waste Recycling Market are Dell Inc. (US), Umicore SA (Belgium), Quantum Lifecycle Partners (Canada), Enviro-Hub Holdings Ltd. (Singapore), Kuusakoski Oy (Finland), Stena Metall AB (Sweden), Call2Recycle Inc., (US), Aurubis AG (Germany), E-Parisara Pvt. Ltd. (India), ERI (US), Boliden Group (Sweden), Attero Recycling Pvt. Ltd. (India), Veolia (France), SIMS Ltd. (Australia), EERC (Egypt), African Trades Shading Company (South Africa), Ash Recyclers (India), Techwaste Recycling LLC (US), Tetronics Environmental Technology Company (UK), Ecoverva (India), Global EWaste Solutions (Canada), Greentek Solutions LLC (US), Great Lakes Electronic Corporation (US), and other companies. Contracts and deals were the key strategies adopted by these companies to strengthen their positions in the electronic waste recycling market.
What are the drivers and opportunities for the electronic waste recycling market?
Growing production of consumer electronics, and circular economy activities are driving the market.
Which region is expected to hold the largest market share?
North America is the largest market for electronic waste recycling. Asia Pacific is witnessing increased investments in infrastructural developments for recycling facilities, contributing to the increasing adoption of electronic waste recycling.
What is the projected growth rate of the electronic waste recycling market over the next five years?
The electronic waste recycling market is projected to grow at a CAGR of 6.5% during the next five years.
How is the electronic waste recycling market aligned for future growth?
The market is growing at a considerable pace. Electronic waste recycling is a competitive market, and many manufacturers are planning business strategies to expand their existing production capacities of high-purity gas.


Personalize This Research

  • Triangulate with your Own Data
  • Get Data as per your Format and Definition
  • Gain a Deeper Dive on a Specific Application, Geography, Customer or Competitor
  • Any level of Personalization
Request A Free Customisation

Let Us Help You

  • What are the Known and Unknown Adjacencies Impacting the Electronic Waste Recycling Market
  • What will your New Revenue Sources be?
  • Who will be your Top Customer; what will make them switch?
  • Defend your Market Share or Win Competitors
  • Get a Scorecard for Target Partners
Customized Workshop Request

Table of Contents

Exclusive indicates content/data unique to MarketsandMarkets and not available with any competitors.

TITLE
PAGE NO
INTRODUCTION
23
RESEARCH METHODOLOGY
27
EXECUTIVE SUMMARY
37
PREMIUM INSIGHTS
41
MARKET OVERVIEW
44
  • 5.1 INTRODUCTION
  • 5.2 MARKET DYNAMICS
    DRIVERS
    - Growing production of consumer electronics
    - Extended producer responsibility and regulatory compliance by manufacturers
    - Stringent government regulations on landfill management
    RESTRAINTS
    - Economic viability and high establishment costs
    - Logistical challenges
    - Lack of uniform policies and consumer participation
    OPPORTUNITIES
    - Rising consumer demand for sustainable products
    - Circular economy initiatives by recyclers
    CHALLENGES
    - Disproportionate handling capacity to actual waste generation
    - Market volatility and declining profit margins
  • 5.3 PORTER’S FIVE FORCES ANALYSIS
    THREAT OF NEW ENTRANTS
    THREAT OF SUBSTITUTES
    BARGAINING POWER OF SUPPLIERS
    BARGAINING POWER OF BUYERS
    INTENSITY OF COMPETITIVE RIVALRY
  • 5.4 KEY STAKEHOLDERS AND BUYING CRITERIA
    KEY STAKEHOLDERS IN BUYING PROCESS
    BUYING CRITERIA
  • 5.5 MACROECONOMICS INDICATORS
    INTRODUCTION
    GDP TRENDS AND FORECAST
    TRENDS IN GLOBAL ELECTRONICS INDUSTRY
    TRENDS IN GLOBAL RECYCLED METALS INDUSTRY
  • 5.6 SUPPLY CHAIN ANALYSIS
  • 5.7 VALUE CHAIN ANALYSIS
  • 5.8 ECOSYSTEM ANALYSIS
  • 5.9 PRICING ANALYSIS
    AVERAGE SELLING PRICE TREND, BY END-USE APPLICATION
    AVERAGE SELLING PRICE TREND, BY SOURCE
    AVERAGE SELLING PRICE TREND, BY MATERIAL
    AVERAGE SELLING PRICE TREND, BY TECHNOLOGY
    AVERAGE SELLING PRICE TREND, BY REGION
  • 5.10 IMPACT OF AI/GEN AI ON ELECTRONIC WASTE RECYCLING MARKET
    TOP USE CASES AND MARKET POTENTIAL
    BEST PRACTICES IN ELECTRONIC WASTE RECYCLING MARKET
    INTERCONNECTED ADJACENT ECOSYSTEM AND IMPACT ON MARKET PLAYERS
    CLIENTS’ READINESS TO ADOPT GENERATIVE AI IN ELECTRONIC WASTE RECYCLING MARKET
  • 5.11 TRADE ANALYSIS
    IMPORT SCENARIO (HS CODE 8549)
    EXPORT SCENARIO (HS CODE 8549)
  • 5.12 TECHNOLOGY ANALYSIS
    KEY TECHNOLOGIES
    - Electrostatic separation
    - Pyrometallurgical process
    COMPLEMENTARY TECHNOLOGIES
    - Lithium battery recycling
    ADJACENT TECHNOLOGIES
    - Chemical recovery
  • 5.13 PATENT ANALYSIS
    INTRODUCTION
    METHODOLOGY
    DOCUMENT TYPE
    INSIGHTS
    LEGAL STATUS OF PATENTS
    JURISDICTION ANALYSIS
    TOP APPLICANTS
    LIST OF PATENTS BY ECOATM LLC
    LIST OF PATENTS BY ENTEGRIS INC
    LIST OF PATENTS BY ECOATM INC
  • 5.14 REGULATORY LANDSCAPE
    REGULATORY BODIES, GOVERNMENT AGENCIES, AND OTHER ORGANIZATIONS
  • 5.15 KEY CONFERENCES AND EVENTS, 2024–2025
  • 5.16 CASE STUDY ANALYSIS
    VEOLIA LAUNCHED RECYCLEPAK TO TARGET HARD-TO-RECYCLE ITEMS SUCH AS SMALL E-WASTE
    UMICORE AND AUTOMOTIVE CELLS COMPANY (ACC) PARTNERED FOR BATTERY RECYCLING
    QUANTUM LIFECYCLE PARTNERS EXPANDED OPERATIONS IN NORTH AMERICA
  • 5.17 TRENDS/DISRUPTIONS IMPACTING CUSTOMER BUSINESS
  • 5.18 INVESTMENT AND FUNDING SCENARIO
ELECTRONIC WASTE RECYCLING MARKET, BY MATERIAL
83
  • 6.1 INTRODUCTION
  • 6.2 GLASS
    LOW-COST AND GROWING DEMAND FOR ECO-FRIENDLY MATERIALS TO DRIVE MARKET
  • 6.3 METALS
    HIGH VALUE AND RARITY OF PRECIOUS METALS TO PROPEL MARKET
    - Gold
    - Lithium
    - Silver
    - Copper
    - Aluminum
    - Rare-earth metals
    - Other metals
  • 6.4 PLASTICS
    STRINGENT ENVIRONMENTAL REGULATIONS TO DRIVE MARKET
  • 6.5 OTHER MATERIALS
ELECTRONIC WASTE RECYCLING MARKET, BY SOURCE
93
  • 7.1 INTRODUCTION
  • 7.2 HOUSEHOLD APPLIANCES
    INCREASING UPGRADES AND REDUCTION IN LONG-TERM USAGE TO DRIVE MARKET
  • 7.3 CONSUMER ELECTRONICS
    FREQUENT UPGRADES AND INCREASING AFFORDABILITY TO PROPEL MARKET
  • 7.4 IT & TELECOMMUNICATION
    UPGRADATION OF EQUIPMENT TO MEET NEWER PROCESSING DEMANDS TO DRIVE MARKET
  • 7.5 MOBILE COMPUTING DEVICES
    INCREASED USE OF ELECTRONICS TO DRIVE MARKET
  • 7.6 OTHER SOURCES
ELECTRONIC WASTE RECYCLING MARKET, BY TECHNOLOGY
102
  • 8.1 INTRODUCTION
  • 8.2 ELECTROSTATIC SEPARATION
    IMPROVED RECOVERY RATES CONTRIBUTING TO RESOURCE CONSERVATION TO PROPEL MARKET
  • 8.3 PYROMETALLURGICAL PROCESS
    HIGH VALUE AND RARITY OF PRECIOUS METALS TO PROPEL MARKET
  • 8.4 HYDROMETALLURGICAL PROCESS
    REGULATORY COMPLIANCE TO DRIVE MARKET
  • 8.5 LITHIUM BATTERY RECYCLING
    INCREASING REQUIREMENT FOR LITHIUM TO DRIVE MARKET
  • 8.6 OTHER TECHNOLOGIES
ELECTRONIC WASTE RECYCLING MARKET, BY REGION
112
  • 9.1 INTRODUCTION
  • 9.2 EUROPE
    GERMANY
    - Robust systems and regulations to manage e-waste effectively to propel market
    UK
    - Improved collection, treatment, and recycling of electrical and electronic equipment to support market growth
    FRANCE
    - Collaborations between small appliance manufacturers for circular economy initiatives to drive market
    ITALY
    - Stringent government regulations to minimize e-waste to drive market
    SPAIN
    - Growing environmental concerns to drive market
    REST OF EUROPE
  • 9.3 ASIA PACIFIC
    CHINA
    - Rapid technological advancements to drive market
    JAPAN
    - Rising environmental concerns to propel market
    INDIA
    - Electronic producer responsibility and other regulatory frameworks to drive market
    SOUTH KOREA
    - Stringent regulatory frameworks and technological advancements to propel market
    REST OF ASIA PACIFIC
  • 9.4 NORTH AMERICA
    US
    - Rapid consumption of electronic devices and advancements in technologies to drive market
    CANADA
    - Government initiatives and regulatory measures to enhance electronic waste management to fuel market growth
    MEXICO
    - Growing environmental concerns to fuel market growth
  • 9.5 MIDDLE EAST & AFRICA
    GCC COUNTRIES
    - Saudi Arabia
    - UAE
    - Rest of GCC countries
    SOUTH AFRICA
    - Increasing regulatory frameworks to drive market
    REST OF MIDDLE EAST & AFRICA
  • 9.6 SOUTH AMERICA
    BRAZIL
    - Enactment of stricter laws to drive market
    ARGENTINA
    - Rising environmental concerns to propel market
    REST OF SOUTH AMERICA
COMPETITIVE LANDSCAPE
164
  • 10.1 OVERVIEW
  • 10.2 KEY PLAYER STRATEGIES/RIGHT TO WIN
  • 10.3 REVENUE ANALYSIS
  • 10.4 MARKET SHARE ANALYSIS
  • 10.5 BRAND/PRODUCT COMPARISON
    DELL INC. (ELECTRONIC WASTE RECYCLING)
    UMICORE (ELECTRONIC WASTE RECYCLING)
    ENVIRO-HUB-HOLDINGS LTD. (ELECTRONIC WASTE RECYCLING)
    KUUSAKOSKI OY (ELECTRONIC WASTE RECYCLING)
  • 10.6 COMPANY EVALUATION MATRIX: KEY PLAYERS, 2023
    STARS
    EMERGING LEADERS
    PERVASIVE PLAYERS
    PARTICIPANTS
    COMPANY FOOTPRINT: KEY PLAYERS, 2023
    - Company footprint
    - Source footprint
    - Material footprint
    - Technology footprint
    - Region footprint
  • 10.7 COMPANY EVALUATION MATRIX: STARTUPS/SMES, 2023
    PROGRESSIVE COMPANIES
    RESPONSIVE COMPANIES
    DYNAMIC COMPANIES
    STARTING BLOCKS
    COMPETITIVE BENCHMARKING: STARTUPS/SMES, 2023
    - Detailed list of key startups/SMEs
    - Competitive benchmarking of key startups/SMEs
  • 10.8 COMPANY VALUATION AND FINANCIAL METRICS
  • 10.9 COMPETITIVE SCENARIO
    PRODUCT LAUNCHES
    DEALS
    EXPANSIONS
COMPANY PROFILES
190
  • 11.1 KEY PLAYERS
    DELL INC.
    - Business overview
    - Products/Solutions/Services offered
    - Recent developments
    - MnM view
    UMICORE
    - Business overview
    - Products/Solutions/Services offered
    - Recent developments
    - MnM view
    QUANTUM LIFECYCLE PARTNERS
    - Business overview
    - Products/Solutions/Services offered
    - Recent developments
    - MnM view
    ENVIRO HUB-HOLDINGS LTD.
    - Business overview
    - Products/Solutions/Services offered
    - MnM view
    KUUSAKOSKI OY
    - Business overview
    - Products/Solutions/Services offered
    - Recent developments
    - MnM view
    STENA METALL AB
    - Business overview
    - Products/Solutions/Services offered
    - Recent developments
    - MnM view
    CALL2RECYCLE, INC
    - Business overview
    - Products/Solutions/Services offered
    - Recent developments
    - MnM view
    AURUBIS AG
    - Business overview
    - Products/Solutions/Services offered
    - Recent developments
    - MnM view
    E-PARISARA PVT. LTD.
    - Business overview
    - Products/Solutions/Services offered
    - MnM view
    ERI
    - Business overview
    - Products/Solutions/Services offered
    - Recent developments
    - MnM view
    BOLIDEN GROUP
    - Business overview
    - Products/Solutions/Services offered
    - MnM view
    SIMS LIMITED
    - Business overview
    - Products/Solutions/Services offered
    - Recent developments
    - MnM view
    VEOLIA
    - Business overview
    - Products/Solutions/Services offered
    - Recent developments
    - MnM view
    ATTERO
    - Business overview
    - Products/Solutions/Services offered
    - MnM view
  • 11.2 OTHER PLAYERS
    AFRICAN TRADES SHADING PTY (LTD)
    ASH RECYCLERS
    TECHWASTE RECYCLING, LLC
    TETRONICS ENVIRONMENTAL TECHNOLOGY COMPANY
    ECOVERVA
    EERC
    GLOBAL EWASTE SOLUTIONS
    GREENTEK SOLUTIONS, LLC
    GREAT LAKES ELECTRONIC CORPORATION
APPENDIX
247
  • 12.1 DISCUSSION GUIDE
  • 12.2 KNOWLEDGESTORE: MARKETSANDMARKETS’ SUBSCRIPTION PORTAL
  • 12.3 CUSTOMIZATION OPTIONS
  • 12.4 RELATED REPORTS
  • 12.5 AUTHOR DETAILS
LIST OF TABLES
 
  • TABLE 1 ELECTRONIC WASTE RECYCLING MARKET: PORTER’S FIVE FORCES ANALYSIS
  • TABLE 2 INFLUENCE OF STAKEHOLDERS ON BUYING PROCESS, BY SOURCE
  • TABLE 3 KEY BUYING CRITERIA, BY SOURCE
  • TABLE 4 GDP PERCENTAGE CHANGE, BY KEY COUNTRY, 2021–2029
  • TABLE 5 ROLES OF COMPANIES IN ELECTRONIC WASTE RECYCLING ECOSYSTEM
  • TABLE 6 AVERAGE SELLING PRICE OF ELECTRONIC WASTE RECYCLING, BY REGION, 2021–2029 (USD/KG)
  • TABLE 7 TOP USE CASES AND MARKET POTENTIAL
  • TABLE 8 BEST PRACTICES: COMPANIES IMPLEMENTING USE CASES
  • TABLE 9 INTERCONNECTED ADJACENT ECOSYSTEM AND IMPACT ON MARKET PLAYERS
  • TABLE 10 LEADING IMPORTERS OF HS CODE 8549-COMPLIANT PRODUCTS (ELECTRICAL AND ELECTRONIC WASTE AND SCRAP), 2023 (USD MILLION)
  • TABLE 11 LEADING EXPORTERS OF HS CODE 8549-COMPLIANT PRODUCTS (ELECTRICAL AND ELECTRONIC WASTE AND SCRAP), 2023 (USD MILLION)
  • TABLE 12 ELECTRONIC WASTE RECYCLING MARKET: TOTAL NUMBER OF PATENTS, JANUARY 2014–OCTOBER 2024
  • TABLE 13 NORTH AMERICA: REGULATORY BODIES, GOVERNMENT AGENCIES, AND OTHER ORGANIZATIONS
  • TABLE 14 EUROPE: REGULATORY BODIES, GOVERNMENT AGENCIES, AND OTHER ORGANIZATIONS
  • TABLE 15 ASIA PACIFIC: REGULATORY BODIES, GOVERNMENT AGENCIES, AND OTHER ORGANIZATIONS
  • TABLE 16 ROW: REGULATORY BODIES, GOVERNMENT AGENCIES, AND OTHER ORGANIZATIONS
  • TABLE 17 ELECTRONIC WASTE RECYCLING MARKET: LIST OF KEY CONFERENCES AND EVENTS, 2024–2025
  • TABLE 18 ELECTRONIC WASTE RECYCLING MARKET, BY MATERIAL, 2021–2029 (USD MILLION)
  • TABLE 19 ELECTRONIC WASTE RECYCLING MARKET, BY MATERIAL, 2021–2029 (KILOTON)
  • TABLE 20 GLASS: ELECTRONIC WASTE RECYCLING MARKET, BY REGION, 2021–2029 (USD MILLION)
  • TABLE 21 GLASS: ELECTRONIC WASTE RECYCLING MARKET, BY REGION, 2021–2029 (KILOTON)
  • TABLE 22 METALS: ELECTRONIC WASTE RECYCLING MARKET, BY REGION, 2021–2029 (USD MILLION)
  • TABLE 23 METALS: ELECTRONIC WASTE RECYCLING MARKET, BY REGION, 2021–2029 (KILOTON)
  • TABLE 24 PLASTICS: ELECTRONIC WASTE RECYCLING MARKET, BY REGION, 2021–2029 (USD MILLION)
  • TABLE 25 PLASTICS: ELECTRONIC WASTE RECYCLING MARKET, BY REGION, 2021–2029 (KILOTON)
  • TABLE 26 OTHER MATERIALS: ELECTRONIC WASTE RECYCLING MARKET, BY REGION, 2021–2029 (USD MILLION)
  • TABLE 27 OTHER MATERIALS: ELECTRONIC WASTE RECYCLING MARKET, BY REGION, 2021–2029 (KILOTON)
  • TABLE 28 ELECTRONIC WASTE RECYCLING MARKET, BY SOURCE, 2021–2029 (USD MILLION)
  • TABLE 29 ELECTRONIC WASTE RECYCLING MARKET, BY SOURCE, 2021–2029 (KILOTON)
  • TABLE 30 HOUSEHOLD APPLIANCES: ELECTRONIC WASTE RECYCLING MARKET, BY REGION, 2021–2029 (USD MILLION)
  • TABLE 31 HOUSEHOLD APPLIANCES: ELECTRONIC WASTE RECYCLING MARKET, BY REGION, 2021–2029 (KILOTON)
  • TABLE 32 CONSUMER ELECTRONICS: ELECTRONIC WASTE RECYCLING MARKET, BY REGION, 2021–2029 (USD MILLION)
  • TABLE 33 CONSUMER ELECTRONICS: ELECTRONIC WASTE RECYCLING MARKET, BY REGION, 2021–2029 (KILOTON)
  • TABLE 34 IT & TELECOMMUNICATION: ELECTRONIC WASTE RECYCLING MARKET, BY REGION, 2021–2029 (USD MILLION)
  • TABLE 35 IT & TELECOMMUNICATION: ELECTRONIC WASTE RECYCLING MARKET, BY REGION, 2021–2029 (KILOTON)
  • TABLE 36 MOBILE COMPUTING DEVICES: ELECTRONIC WASTE RECYCLING MARKET, BY REGION, 2021–2029 (USD MILLION)
  • TABLE 37 MOBILE COMPUTING DEVICES: ELECTRONIC WASTE RECYCLING MARKET, BY REGION, 2021–2029 (KILOTON)
  • TABLE 38 OTHER SOURCES: ELECTRONIC WASTE RECYCLING MARKET, BY REGION, 2021–2029 (USD MILLION)
  • TABLE 39 OTHER SOURCES: ELECTRONIC WASTE RECYCLING MARKET, BY REGION, 2021–2029 (KILOTON)
  • TABLE 40 ELECTRONIC WASTE RECYCLING MARKET, BY TECHNOLOGY, 2021–2029 (USD MILLION)
  • TABLE 41 ELECTRONIC WASTE RECYCLING MARKET, BY TECHNOLOGY, 2021–2029 (KILOTON)
  • TABLE 42 ELECTROSTATIC SEPARATION: ELECTRONIC WASTE RECYCLING MARKET, BY REGION, 2021–2029 (USD MILLION)
  • TABLE 43 ELECTROSTATIC SEPARATION: ELECTRONIC WASTE RECYCLING MARKET, BY REGION, 2021–2029 (KILOTON)
  • TABLE 44 PYROMETALLURGICAL PROCESS: ELECTRONIC WASTE RECYCLING MARKET, BY REGION, 2021–2029 (USD MILLION)
  • TABLE 45 PYROMETALLURGICAL PROCESS: ELECTRONIC WASTE RECYCLING MARKET, BY REGION, 2021–2029 (KILOTON)
  • TABLE 46 HYDROMETALLURGICAL PROCESS: ELECTRONIC WASTE RECYCLING MARKET, BY REGION, 2021–2029 (USD MILLION)
  • TABLE 47 HYDROMETALLURGICAL PROCESS: ELECTRONIC WASTE RECYCLING MARKET, BY REGION, 2021–2029 (KILOTON)
  • TABLE 48 LITHIUM BATTERY RECYCLING: ELECTRONIC WASTE RECYCLING MARKET, BY REGION, 2021–2029 (USD MILLION)
  • TABLE 49 LITHIUM BATTERY RECYCLING: ELECTRONIC WASTE RECYCLING MARKET, BY REGION, 2021–2029 (KILOTON)
  • TABLE 50 OTHER TECHNOLOGIES: ELECTRONIC WASTE RECYCLING MARKET, BY REGION, 2021–2029 (USD MILLION)
  • TABLE 51 OTHER TECHNOLOGIES: ELECTRONIC WASTE RECYCLING MARKET, BY REGION, 2021–2029 (KILOTON)
  • TABLE 52 ELECTRONIC WASTE RECYCLING MARKET, BY REGION, 2021–2029 (USD MILLION)
  • TABLE 53 ELECTRONIC WASTE RECYCLING MARKET, BY REGION, 2021–2029 (KILOTON)
  • TABLE 54 EUROPE: ELECTRONIC WASTE RECYCLING MARKET, BY MATERIAL, 2021–2029 (USD MILLION)
  • TABLE 55 EUROPE: MARKET, BY MATERIAL, 2021–2029 (KILOTON)
  • TABLE 56 EUROPE: MARKET, BY SOURCE, 2021–2029 (USD MILLION)
  • TABLE 57 EUROPE: MARKET, BY SOURCE, 2021–2029 (KILOTON)
  • TABLE 58 EUROPE: MARKET, BY TECHNOLOGY 2021–2029 (USD MILLION)
  • TABLE 59 EUROPE: MARKET, BY TECHNOLOGY, 2021–2029 (KILOTON)
  • TABLE 60 EUROPE: MARKET, BY COUNTRY, 2021–2029 (USD MILLION)
  • TABLE 61 EUROPE: MARKET, BY COUNTRY, 2021–2029 (KILOTON)
  • TABLE 62 GERMANY: ELECTRONIC WASTE RECYCLING MARKET, BY SOURCE, 2021–2029 (USD MILLION)
  • TABLE 63 GERMANY: MARKET, BY SOURCE, 2021–2029 (KILOTON)
  • TABLE 64 UK: ELECTRONIC WASTE RECYCLING MARKET, BY SOURCE, 2021–2029 (USD MILLION)
  • TABLE 65 UK: MARKET, BY SOURCE, 2021–2029 (KILOTON)
  • TABLE 66 FRANCE: ELECTRONIC WASTE RECYCLING MARKET, BY SOURCE, 2021–2029 (USD MILLION)
  • TABLE 67 FRANCE: MARKET, BY SOURCE, 2021–2029 (KILOTON)
  • TABLE 68 ITALY: ELECTRONIC WASTE RECYCLING MARKET, BY SOURCE, 2021–2029 (USD MILLION)
  • TABLE 69 ITALY: MARKET, BY SOURCE, 2021–2029 (KILOTON)
  • TABLE 70 SPAIN: ELECTRONIC WASTE RECYCLING MARKET, BY SOURCE, 2021–2029 (USD MILLION)
  • TABLE 71 SPAIN: MARKET, BY SOURCE, 2021–2029 (KILOTON)
  • TABLE 72 REST OF EUROPE: ELECTRONIC WASTE RECYCLING MARKET, BY SOURCE, 2021–2029 (USD MILLION)
  • TABLE 73 REST OF EUROPE: MARKET, BY SOURCE, 2021–2029 (KILOTON)
  • TABLE 74 ASIA PACIFIC: ELECTRONIC WASTE RECYCLING MARKET, BY MATERIAL, 2021–2029 (USD MILLION)
  • TABLE 75 ASIA PACIFIC: MARKET, BY MATERIAL, 2021–2029 (KILOTON)
  • TABLE 76 ASIA PACIFIC: MARKET, BY SOURCE, 2021–2029 (USD MILLION)
  • TABLE 77 ASIA PACIFIC: MARKET, BY SOURCE, 2021–2029 (KILOTON)
  • TABLE 78 ASIA PACIFIC: MARKET, BY TECHNOLOGY 2021–2029 (USD MILLION)
  • TABLE 79 ASIA PACIFIC: MARKET, BY TECHNOLOGY, 2021–2029 (KILOTON)
  • TABLE 80 ASIA PACIFIC: MARKET, BY COUNTRY, 2021–2029 (USD MILLION)
  • TABLE 81 ASIA PACIFIC: MARKET, BY COUNTRY, 2021–2029 (KILOTON)
  • TABLE 82 CHINA: ELECTRONIC WASTE RECYCLING MARKET, BY SOURCE, 2021–2029 (USD MILLION)
  • TABLE 83 CHINA: MARKET, BY SOURCE, 2021–2029 (KILOTON)
  • TABLE 84 JAPAN: MARKET, BY SOURCE, 2021–2029 (USD MILLION)
  • TABLE 85 JAPAN: MARKET, BY SOURCE, 2021–2029 (KILOTON)
  • TABLE 86 INDIA: ELECTRONIC WASTE RECYCLING MARKET, BY SOURCE, 2021–2029 (USD MILLION)
  • TABLE 87 INDIA: MARKET, BY SOURCE, 2021–2029 (KILOTON)
  • TABLE 88 SOUTH KOREA: ELECTRONIC WASTE RECYCLING MARKET, BY SOURCE, 2021–2029 (USD MILLION)
  • TABLE 89 SOUTH KOREA: MARKET, BY SOURCE, 2021–2029 (KILOTON)
  • TABLE 90 REST OF ASIA PACIFIC: ELECTRONIC WASTE RECYCLING MARKET, BY SOURCE, 2021–2029 (USD MILLION)
  • TABLE 91 REST OF ASIA PACIFIC: MARKET, BY SOURCE, 2021–2029 (KILOTON)
  • TABLE 92 NORTH AMERICA: ELECTRONIC WASTE RECYCLING MARKET, BY MATERIAL, 2021–2029 (USD MILLION)
  • TABLE 93 NORTH AMERICA: MARKET, BY MATERIAL, 2021–2029 (KILOTON)
  • TABLE 94 NORTH AMERICA: MARKET, BY SOURCE, 2021–2029 (USD MILLION)
  • TABLE 95 NORTH AMERICA: MARKET, BY SOURCE, 2021–2029 (KILOTON)
  • TABLE 96 NORTH AMERICA: MARKET, BY TECHNOLOGY 2021–2029 (USD MILLION)
  • TABLE 97 NORTH AMERICA: MARKET, BY TECHNOLOGY, 2021–2029 (KILOTON)
  • TABLE 98 NORTH AMERICA: MARKET, BY COUNTRY, 2021–2029 (USD MILLION)
  • TABLE 99 NORTH AMERICA: MARKET, BY COUNTRY, 2021–2029 (KILOTON)
  • TABLE 100 US: ELECTRONIC WASTE RECYCLING MARKET, BY SOURCE, 2021–2029 (USD MILLION)
  • TABLE 101 US: MARKET, BY SOURCE, 2021–2029 (KILOTON)
  • TABLE 102 CANADA: ELECTRONIC WASTE RECYCLING MARKET, BY SOURCE, 2021–2029 (USD MILLION)
  • TABLE 103 CANADA: MARKET, BY SOURCE, 2021–2029 (KILOTON)
  • TABLE 104 MEXICO: ELECTRONIC WASTE RECYCLING MARKET, BY SOURCE, 2021–2029 (USD MILLION)
  • TABLE 105 MEXICO: MARKET, BY SOURCE, 2021–2029 (KILOTON)
  • TABLE 106 MIDDLE EAST & AFRICA: ELECTRONIC WASTE RECYCLING MARKET, BY MATERIAL, 2021–2029 (USD MILLION)
  • TABLE 107 MIDDLE EAST & AFRICA: MARKET, BY MATERIAL, 2021–2029 (KILOTON)
  • TABLE 108 MIDDLE EAST & AFRICA: MARKET, BY SOURCE, 2021–2029 (USD MILLION)
  • TABLE 109 MIDDLE EAST & AFRICA: MARKET, BY SOURCE, 2021–2029 (KILOTON)
  • TABLE 110 MIDDLE EAST & AFRICA: MARKET, BY TECHNOLOGY 2021–2029 (USD MILLION)
  • TABLE 111 MIDDLE EAST & AFRICA: MARKET, BY TECHNOLOGY, 2021–2029 (KILOTON)
  • TABLE 112 MIDDLE EAST & AFRICA: MARKET, BY COUNTRY, 2021–2029 (USD MILLION)
  • TABLE 113 MIDDLE EAST & AFRICA: MARKET, BY COUNTRY, 2021–2029 (KILOTON)
  • TABLE 114 SAUDI ARABIA: ELECTRONIC WASTE RECYCLING MARKET, BY SOURCE, 2021–2029 (USD MILLION)
  • TABLE 115 SAUDI ARABIA: MARKET, BY SOURCE, 2021–2029 (KILOTON)
  • TABLE 116 UAE: ELECTRONIC WASTE RECYCLING MARKET, BY SOURCE, 2021–2029 (USD MILLION)
  • TABLE 117 UAE: MARKET, BY SOURCE, 2021–2029 (KILOTON)
  • TABLE 118 REST OF GCC COUNTRIES: ELECTRONIC WASTE RECYCLING MARKET, BY SOURCE, 2021–2029 (USD MILLION)
  • TABLE 119 REST OF GCC COUNTRIES: MARKET, BY SOURCE, 2021–2029 (KILOTON)
  • TABLE 120 SOUTH AFRICA: ELECTRONIC WASTE RECYCLING MARKET, BY SOURCE, 2021–2029 (USD MILLION)
  • TABLE 121 SOUTH AFRICA: MARKET, BY SOURCE, 2021–2029 (KILOTON)
  • TABLE 122 REST OF MIDDLE EAST & AFRICA: ELECTRONIC WASTE RECYCLING MARKET, BY SOURCE, 2021–2029 (USD MILLION)
  • TABLE 123 REST OF MIDDLE EAST & AFRICA: MARKET, BY SOURCE, 2021–2029 (KILOTON)
  • TABLE 124 SOUTH AMERICA: ELECTRONIC WASTE RECYCLING MARKET, BY MATERIAL, 2021–2029 (USD MILLION)
  • TABLE 125 SOUTH AMERICA: MARKET, BY MATERIAL, 2021–2029 (KILOTON)
  • TABLE 126 SOUTH AMERICA: MARKET, BY SOURCE, 2021–2029 (USD MILLION)
  • TABLE 127 SOUTH AMERICA: MARKET, BY SOURCE, 2021–2029 (KILOTON)
  • TABLE 128 SOUTH AMERICA: MARKET, BY TECHNOLOGY 2021–2029 (USD MILLION)
  • TABLE 129 SOUTH AMERICA: MARKET, BY TECHNOLOGY, 2021–2029 (KILOTON)
  • TABLE 130 SOUTH AMERICA: MARKET, BY COUNTRY, 2021–2029 (USD MILLION)
  • TABLE 131 SOUTH AMERICA: MARKET, BY COUNTRY, 2021–2029 (KILOTON)
  • TABLE 132 BRAZIL: ELECTRONIC WASTE RECYCLING MARKET, BY SOURCE, 2021–2029 (USD MILLION)
  • TABLE 133 BRAZIL: MARKET, BY SOURCE, 2021–2029 (KILOTON)
  • TABLE 134 ARGENTINA: ELECTRONIC WASTE RECYCLING MARKET, BY SOURCE, 2021–2029 (USD MILLION)
  • TABLE 135 ARGENTINA: MARKET, BY SOURCE, 2021–2029 (KILOTON)
  • TABLE 136 REST OF SOUTH AMERICA: ELECTRONIC WASTE RECYCLING MARKET, BY SOURCE, 2021–2029 (USD MILLION)
  • TABLE 137 REST OF SOUTH AMERICA: MARKET, BY SOURCE, 2021–2029 (KILOTON)
  • TABLE 138 ELECTRONIC WASTE RECYCLING MARKET: KEY STRATEGIES ADOPTED BY MAJOR MANUFACTURERS
  • TABLE 139 ELECTRONIC WASTE RECYCLING MARKET: DEGREE OF COMPETITION, 2023
  • TABLE 140 ELECTRONIC WASTE RECYCLING MARKET: SOURCE FOOTPRINT
  • TABLE 141 ELECTRONIC WASTE RECYCLING MARKET: MATERIAL FOOTPRINT
  • TABLE 142 ELECTRONIC WASTE RECYCLING MARKET: TECHNOLOGY FOOTPRINT
  • TABLE 143 ELECTRONIC WASTE RECYCLING MARKET: REGION FOOTPRINT
  • TABLE 144 ELECTRONIC WASTE RECYCLING MARKET: DETAILED LIST OF KEY STARTUPS/SMES
  • TABLE 145 ELECTRONIC WASTE RECYCLING MARKET: COMPETITIVE BENCHMARKING OF KEY STARTUPS/SMES
  • TABLE 146 ELECTRONIC WASTE RECYCLING MARKET: PRODUCT LAUNCHES, JANUARY 2018–SEPTEMBER 2024
  • TABLE 147 ELECTRONIC WASTE RECYCLING MARKET: DEALS, JANUARY 2018–SEPTEMBER 2024
  • TABLE 148 ELECTRONIC WASTE RECYCLING MARKET: EXPANSIONS, JANUARY 2018–SEPTEMBER 2024
  • TABLE 149 DELL INC.: COMPANY OVERVIEW
  • TABLE 150 DELL INC.: PRODUCTS/SOLUTIONS/SERVICES OFFERED
  • TABLE 151 DELL INC.: DEALS, JANUARY 2018–SEPTEMBER 2024
  • TABLE 152 UMICORE: COMPANY OVERVIEW
  • TABLE 153 UMICORE: PRODUCTS/SOLUTIONS/SERVICES OFFERED
  • TABLE 154 UMICORE: DEALS, JANUARY 2018–SEPTEMBER 2024
  • TABLE 155 QUANTUM LIFECYCLE PARTNERS: COMPANY OVERVIEW
  • TABLE 156 QUANTUM LIFECYCLE PARTNERS: PRODUCTS/SOLUTIONS/SERVICES OFFERED
  • TABLE 157 QUANTUM LIFECYCLE PARTNERS: DEALS, JANUARY 2018–SEPTEMBER 2024
  • TABLE 158 QUANTUM LIFECYCLE PARTNERS: EXPANSIONS, JANUARY 2018–SEPTEMBER 2024
  • TABLE 159 ENVIRO HUB-HOLDINGS LTD.: COMPANY OVERVIEW
  • TABLE 160 ENVIRO HUB-HOLDINGS LTD.: PRODUCTS/SOLUTIONS/SERVICES OFFERED
  • TABLE 161 KUUSAKOSKI OY: COMPANY OVERVIEW
  • TABLE 162 KUUSAKOSKI OY: PRODUCTS/SOLUTIONS/SERVICES OFFERED
  • TABLE 163 KUUSAKOSKI OY: DEALS, JANUARY 2018–SEPTEMBER 2024
  • TABLE 164 KUUSAKOSKI OY: EXPANSIONS, JANUARY 2018–SEPTEMBER 2024
  • TABLE 165 STENA METALL AB: COMPANY OVERVIEW
  • TABLE 166 STENA METALL AB: PRODUCTS/SOLUTIONS/SERVICES OFFERED
  • TABLE 167 STENA METALL AB: DEALS, JANUARY 2018–SEPTEMBER 2024
  • TABLE 168 STENA METALL AB: EXPANSIONS, JANUARY 2018–SEPTEMBER 2024
  • TABLE 169 CALL2RECYCLE, INC: COMPANY OVERVIEW
  • TABLE 170 CALL2RECYCLE, INC: PRODUCTS/SOLUTIONS/SERVICES OFFERED
  • TABLE 171 CALL2RECYCLE, INC: DEALS, JANUARY 2018–SEPTEMBER 2024
  • TABLE 172 AURUBIS AG: COMPANY OVERVIEW
  • TABLE 173 AURUBIS AG: PRODUCTS/SOLUTIONS/SERVICES OFFERED
  • TABLE 174 AURUBIS AG: DEALS, JANUARY 2018–SEPTEMBER 2024
  • TABLE 175 AURUBIS AG: EXPANSIONS, JANUARY 2018–SEPTEMBER 2024
  • TABLE 176 E-PARISARA PVT. LTD.: COMPANY OVERVIEW
  • TABLE 177 E-PARISARA PVT. LTD.: PRODUCTS/SOLUTIONS/SERVICES OFFERED
  • TABLE 178 ERI: COMPANY OVERVIEW
  • TABLE 179 ERI: PRODUCTS/SOLUTIONS/SERVICES OFFERED
  • TABLE 180 ERI: DEALS, JANUARY 2018–SEPTEMBER 2024
  • TABLE 181 ERI: EXPANSIONS, JANUARY 2018–SEPTEMBER 2024
  • TABLE 182 BOLIDEN GROUP: COMPANY OVERVIEW
  • TABLE 183 BOLIDEN GROUP: PRODUCTS/SOLUTIONS/SERVICES OFFERED
  • TABLE 184 SIMS LIMITED: COMPANY OVERVIEW
  • TABLE 185 SIMS LIMITED: PRODUCTS/SOLUTIONS/SERVICES OFFERED
  • TABLE 186 SIMS LIMITED: DEALS, JANUARY 2018–SEPTEMBER 2024
  • TABLE 187 SIMS LIMITED: EXPANSIONS, JANUARY 2018–SEPTEMBER 2024
  • TABLE 188 VEOLIA: COMPANY OVERVIEW
  • TABLE 189 VEOLIA: PRODUCTS/SOLUTIONS/SERVICES OFFERED
  • TABLE 190 VEOLIA: PRODUCT LAUNCHES, JANUARY 2018–SEPTEMBER 2024
  • TABLE 191 ATTERO: COMPANY OVERVIEW
  • TABLE 192 ATTERO: PRODUCTS/SOLUTIONS/SERVICES OFFERED
  • TABLE 193 AFRICAN TRADES SHADING PTY (LTD): COMPANY OVERVIEW
  • TABLE 194 ASH RECYCLERS: COMPANY OVERVIEW
  • TABLE 195 TECHWASTE RECYCLING, LLC: COMPANY OVERVIEW
  • TABLE 196 TETRONICS ENVIRONMENTAL TECHNOLOGY COMPANY: COMPANY OVERVIEW
  • TABLE 197 ECOVERVA: COMPANY OVERVIEW
  • TABLE 198 EERC: COMPANY OVERVIEW
  • TABLE 199 GLOBAL EWASTE SOLUTIONS: COMPANY OVERVIEW
  • TABLE 200 GREENTEK SOLUTIONS, LLC: COMPANY OVERVIEW
  • TABLE 201 GREAT LAKES ELECTRONIC CORPORATION: COMPANY OVERVIEW
LIST OF FIGURES
 
  • FIGURE 1 ELECTRONIC WASTE RECYCLING MARKET SEGMENTATION AND REGIONAL SCOPE
  • FIGURE 2 ELECTRONIC WASTE RECYCLING MARKET: RESEARCH DESIGN
  • FIGURE 3 ELECTRONIC WASTE RECYCLING MARKET: BOTTOM-UP APPROACH
  • FIGURE 4 ELECTRONIC WASTE RECYCLING MARKET: TOP-DOWN APPROACH
  • FIGURE 5 ELECTRONIC WASTE RECYCLING MARKET: DATA TRIANGULATION
  • FIGURE 6 METALS SEGMENT ACCOUNTED FOR LARGEST MARKET SHARE IN 2023
  • FIGURE 7 IT & TELECOMMUNICATION SEGMENT ACCOUNTED FOR LARGEST MARKET SHARE IN 2023
  • FIGURE 8 LITHIUM BATTERY RECYCLING SEGMENT ACCOUNTED FOR LARGEST MARKET SHARE IN 2023
  • FIGURE 9 ASIA PACIFIC TO REGISTER HIGHEST GROWTH DURING FORECAST PERIOD
  • FIGURE 10 INCREASING CIRCULAR ECONOMY EFFORTS TO DRIVE MARKET BETWEEN 2024 AND 2029
  • FIGURE 11 PLASTICS SEGMENT AND NORTH AMERICA ACCOUNTED FOR LARGEST MARKET SHARES IN 2023
  • FIGURE 12 IT & TELECOMMUNICATION SEGMENT DOMINATED MARKET IN 2023
  • FIGURE 13 PYROMETALLURGICAL PROCESS TECHNOLOGY SEGMENT DOMINATED MARKET IN 2023
  • FIGURE 14 CHINA TO REGISTER HIGHEST GROWTH DURING FORECAST PERIOD
  • FIGURE 15 DRIVERS, RESTRAINTS, OPPORTUNITIES, AND CHALLENGES IN ELECTRONIC WASTE RECYCLING MARKET
  • FIGURE 16 ELECTRONIC WASTE RECYCLING MARKET: PORTER’S FIVE FORCES ANALYSIS
  • FIGURE 17 INFLUENCE OF STAKEHOLDERS ON BUYING PROCESS, BY SOURCE
  • FIGURE 18 KEY BUYING CRITERIA, BY SOURCE
  • FIGURE 19 ELECTRONIC WASTE RECYCLING MARKET: SUPPLY CHAIN ANALYSIS
  • FIGURE 20 ELECTRONIC WASTE RECYCLING MARKET: VALUE CHAIN ANALYSIS
  • FIGURE 21 ELECTRONIC WASTE RECYCLING MARKET: KEY PLAYERS IN ECOSYSTEM
  • FIGURE 22 ELECTRONIC WASTE RECYCLING MARKET: ECOSYSTEM ANALYSIS
  • FIGURE 23 AVERAGE SELLING PRICE TREND OF RECYCLED MATERIALS OFFERED BY KEY PLAYERS, BY END-USE APPLICATION, 2023 (USD/KG)
  • FIGURE 24 AVERAGE SELLING PRICE TREND OF ELECTRONIC WASTE RECYCLING, BY SOURCE, 2023 (USD/KG),
  • FIGURE 25 AVERAGE SELLING PRICE TREND OF ELECTRONIC WASTE RECYCLING, BY MATERIAL, 2023 (USD/KG)
  • FIGURE 26 AVERAGE SELLING PRICE TREND OF ELECTRONIC WASTE RECYCLING, BY TECHNOLOGY, 2023 (USD/KG)
  • FIGURE 27 IMPORT DATA RELATED TO HS CODE 8549-COMPLIANT PRODUCTS, BY KEY COUNTRY, 2022–2023 (USD MILLION)
  • FIGURE 28 EXPORT DATA RELATED TO HS CODE 8549-COMPLIANT PRODUCTS, BY KEY COUNTRY, 2022–2023 (USD MILLION)
  • FIGURE 29 PATENT ANALYSIS, BY DOCUMENT TYPE, JANUARY 2014–JULY 2024
  • FIGURE 30 PATENT PUBLICATION TRENDS, 2014−2024
  • FIGURE 31 ELECTRONIC WASTE RECYCLING MARKET: LEGAL STATUS OF PATENTS, JANUARY 2014–OCTOBER 2024
  • FIGURE 32 JURISDICTION OF CHINA REGISTERED HIGHEST NUMBER OF PATENTS, JANUARY 2014–JULY 2024
  • FIGURE 33 TOP PATENT APPLICANTS, JANUARY 2014–JULY 2024
  • FIGURE 34 TRENDS/DISRUPTIONS INFLUENCING CUSTOMER BUSINESS
  • FIGURE 35 ELECTRONIC WASTE RECYCLING MARKET: INVESTMENT AND FUNDING SCENARIO OF MAJOR PLAYERS, 2024 (USD BILLION)
  • FIGURE 36 METALS SEGMENT TO DOMINATE MARKET DURING FORECAST PERIOD
  • FIGURE 37 IT & TELECOMMUNICATION SEGMENT TO REGISTER HIGHEST CAGR DURING FORECAST PERIOD
  • FIGURE 38 LITHIUM BATTERY RECYCLING TECHNOLOGY SEGMENT TO LEAD MARKET DURING FORECAST PERIOD
  • FIGURE 39 CHINA TO REGISTER HIGHEST GROWTH RATE DURING FORECAST PERIOD
  • FIGURE 40 EUROPE: ELECTRONIC WASTE RECYCLING MARKET SNAPSHOT
  • FIGURE 41 ASIA PACIFIC: ELECTRONIC WASTE RECYCLING MARKET SNAPSHOT
  • FIGURE 42 NORTH AMERICA: ELECTRONIC WASTE RECYCLING MARKET SNAPSHOT
  • FIGURE 43 ELECTRONIC WASTE RECYCLING MARKET: REVENUE ANALYSIS OF FIVE KEY PLAYERS, 2019–2023 (USD MILLION)
  • FIGURE 44 ELECTRONIC WASTE RECYCLING MARKET SHARE ANALYSIS, 2023
  • FIGURE 45 ELECTRONIC WASTE RECYCLING MARKET: BRAND/PRODUCT COMPARISON
  • FIGURE 46 ELECTRONIC WASTE RECYCLING MARKET: COMPANY EVALUATION MATRIX (KEY PLAYERS), 2023
  • FIGURE 47 ELECTRONIC WASTE RECYCLING MARKET: COMPANY FOOTPRINT
  • FIGURE 48 ELECTRONIC WASTE RECYCLING MARKET: COMPANY EVALUATION MATRIX (STARTUPS/SMES), 2023
  • FIGURE 49 ELECTRONIC WASTE RECYCLING MARKET: EV/EBITDA OF KEY MANUFACTURERS
  • FIGURE 50 ELECTRONIC WASTE RECYCLING MARKET: YEAR-TO-DATE (YTD) PRICE TOTAL RETURN AND 5-YEAR STOCK BETA OF KEY MANUFACTURERS
  • FIGURE 51 DELL INC.: COMPANY SNAPSHOT
  • FIGURE 52 UMICORE: COMPANY SNAPSHOT
  • FIGURE 53 ENVIRO HUB-HOLDINGS LTD.: COMPANY SNAPSHOT
  • FIGURE 54 KUUSAKOSKI OY: COMPANY SNAPSHOT
  • FIGURE 55 STENA METALL AB: COMPANY SNAPSHOT
  • FIGURE 56 CALL2RECYCLE, INC: COMPANY SNAPSHOT
  • FIGURE 57 AURUBIS AG: COMPANY SNAPSHOT
  • FIGURE 58 BOLIDEN GROUP: COMPANY SNAPSHOT
  • FIGURE 59 SIMS LIMITED: COMPANY SNAPSHOT
  • FIGURE 60 VEOLIA: COMPANY SNAPSHOT


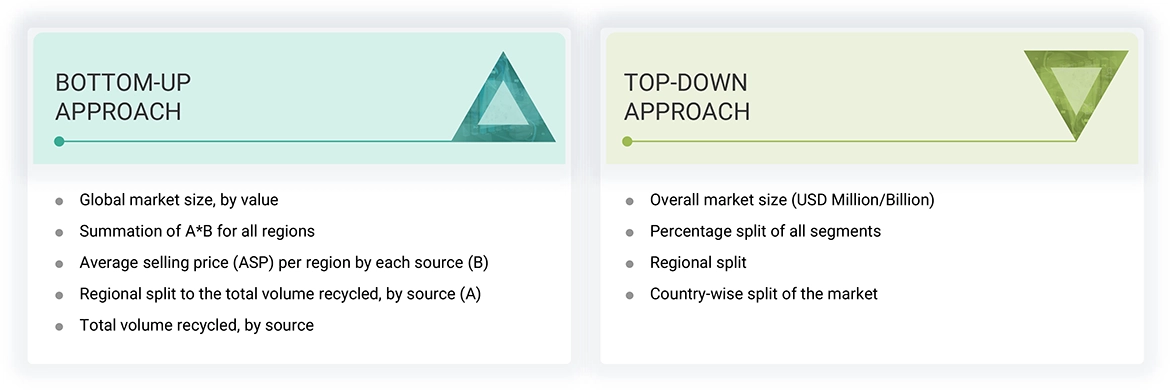
The study involves two major activities in estimating the current market size for the electronic waste recycling market. Exhaustive secondary research was done to collect information on the market, peer market, and parent market. The next step was to validate these findings, assumptions, and sizing with industry experts across the value chain through primary research. Both top-down and bottom-up approaches were employed to estimate the complete market size. After that, market breakdown and data triangulation were used to estimate the market size of segments and subsegments.

Secondary Research

Secondary sources referred to for this research study include financial statements of companies offering electronic waste recycling services and information from various trade, business, and professional associations. Secondary research has been used to obtain critical information about the industry’s value chain, the total pool of key players, market classification, and segmentation according to industry trends to the bottom-most level and regional markets. The secondary data was collected and analyzed to arrive at the overall size of the Electronic Waste Recycling market, which was validated by primary respondents.

Primary Research

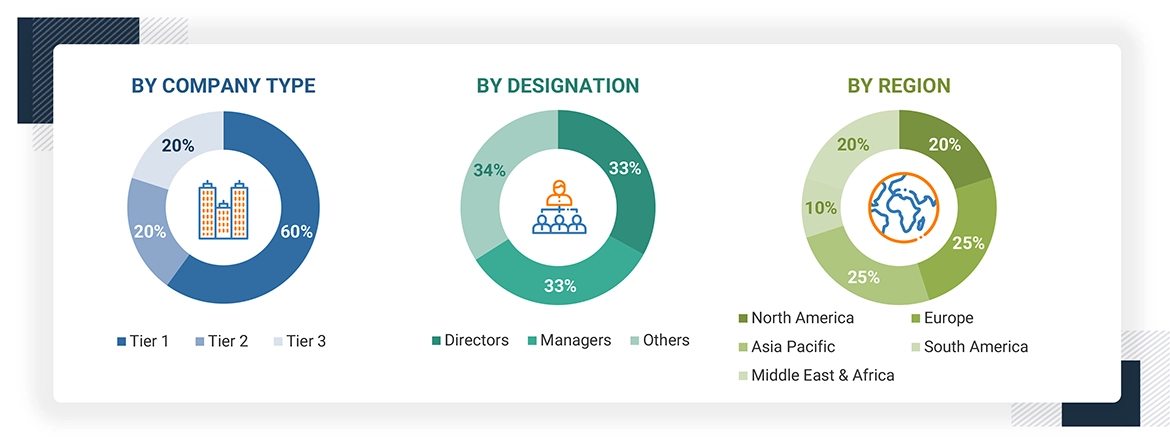
Extensive primary research was conducted after obtaining information regarding the electronic waste recycling market scenario through secondary research. Several primary interviews were conducted with market experts from both the demand and supply sides across major countries of North America, Europe, Asia Pacific, the Middle East & Africa, and Latin America. Primary data was collected through questionnaires, emails, and telephonic interviews. The primary sources from the supply side included various industry experts, such as Chief X Officers (CXOs), Vice Presidents (VPs), Directors from business development, marketing, product development/innovation teams, and related key executives from electronic waste recycling industry vendors; system integrators; component providers; distributors; and key opinion leaders. Primary interviews were conducted to gather insights such as market statistics, data on revenue collected from the products and services, market breakdowns, market size estimations, market forecasting, and data triangulation. Primary research also helped in understanding the various trends related to materials, source, technology, and region. Stakeholders from the demand side, such as CIOs, CTOs, CSOs, and installation teams of the customer/end users who are using electronic waste recycling technologies, were interviewed to understand the buyer’s perspective on the suppliers, products, component providers, and their current usage of recycled materials and future outlook of their business which will affect the overall market.

The Breakup of Primary Research
To know about the assumptions considered for the study, download the pdf brochure

Market Size Estimation

The research methodology used to estimate the size of the electronic waste recycling market includes the following details. The market sizing of the market was undertaken from the demand side. The market was upsized based on procurements and modernizations in electronic waste recycling in different industries at a regional level. Such procurements provide information on the demand aspects of the recycled materials for each application. For each material, all possible segments of the electronic waste recycling market were integrated and mapped.
Data Triangulation

After arriving at the overall size from the market size estimation process explained above, the total market was split into several segments and subsegments. The data triangulation and market breakdown procedures explained below were implemented, wherever applicable, to complete the overall market engineering process and arrive at the exact statistics for various market segments and subsegments. The data was triangulated by studying various factors and trends from the demand and supply sides. Along with this, the market size was validated using both the top-down and bottom-up approaches.

Market Definition

Electronic waste recycling, or e-waste recycling, refers to the process of collecting, disassembling, and processing discarded electronic devices to recover valuable materials while minimizing environmental impact. The recycling process begins with the collection of e-waste from various sources, followed by sorting and dismantling to extract metals (such as gold, silver, and copper), plastics, and glass. These materials are then processed for reuse in manufacturing new products, contributing to a circular economy. The e-waste recycling plays a crucial role in preventing hazardous substances present in e-waste from contaminating the environment, thereby promoting responsible disposal practices and resource recovery.

Stakeholders

  • Electronic Waste Recycling Companies
  • Government and Research Organizations
  • National and Local Government Organizations
  • Institutional Investors
  • Environment Regulators
  • Logistics Companies
  • Retailers

Report Objectives

  • To define, describe, and forecast the electronic waste recycling market size in terms of volume and value
  • To provide detailed information regarding the key factors, such as drivers, restraints, opportunities, and challenges influencing market growth
  • To analyze and project the global electronic waste recycling market by materials, source, technology, and region
  • To forecast the market size concerning five main regions (along with country-level data), namely, North America, Europe, Asia Pacific, Latin America, and the Middle East & Africa, and analyze the significant region-specific trends
  • To strategically analyze micro markets with respect to individual growth trends, prospects, and contributions of the submarkets to the overall market
  • To analyze the market opportunities and the competitive landscape for stakeholders and market leaders
  • To assess recent market developments and competitive strategies, such as agreements, contracts, acquisitions, and new product developments/new product launches, to draw the competitive landscape
  • To strategically profile the key market players and comprehensively analyze their core competencies

Previous Versions of this Report

Custom Market Research Services

We Will Customise The Research For You, In Case The Report Listed Above Does Not Meet With Your Requirements

Get 10% Free Customisation

Growth opportunities and latent adjacency in Electronic Waste Recycling Market

DMCA.com Protection Status