Electric Tractor Market

Report Code AT 8970
Published in Mar, 2024, By MarketsandMarkets™
Download PDF

Choose License Type

Buy Report Now Inquire Before Buying

Electric Tractor Market by Propulsion (Battery, Hybrid & Hydrogen), Capacity (<50, 51–100 & >100kWh), Chemistry (LFP & NMC), Hybrid Tractor (<50, 51–100 & >100HP), Function (Agriculture, Utility & Industrial) and Region - Global Forecast to 2030

Overview

The Electric Tractor market is projected to grow from USD 0.7 billion in 2024 to USD 3.4 billion by 2030, at a CAGR of 28.3%. The key factors driving the electric tractor market are advancement in battery technology, stringent emission norms, precision agriculture, and incentives on electric tractors are driving the electric tractor market.

Attractive Opportunities in the Electric Tractor Market

EUROPE

Europe region has the largest market share for electric tractor market Due to presence of major players, government support for the electrification for off-highway vehicles, and presence of leading battery manufacturers.

Europe is projected to be the largest market due to the advanced charging facility, increasing demand for mechanized equipments and precision farming

Solid state battery technology, hydrogen tractors and precision farming will drive the market for electric tractors market in next 4-5 years

Lithium iron phosphate battery holds the highest market share due to low cost, thermal stability, safety, and longevity.

51 – 100 KWh battery are used for small to medium sized farmland whereas, >100 KWh battery capacity is used in large farmlands

Global Electric Tractor Market Dynamics

DRIVER: Growing stringent emission regulations

The stringent emission norms and regulations have significantly increased the sales of electric tractors globally. Key countries like the US, Europe, Canada, India, China, and Japan have implemented emission regulations for tractors to address environmental concerns and reduce air pollution. Due to growing environmental concerns and excessive use of non-renewable resources, governing bodies globally have initiated many strict steps. For instance, critical countries like Europe have been following Stage V emission norms since January 2019, where the NOx limit is set to 2.0 g/kWh for engines > 56 kW and PM at 0.015 g/kWh. In comparison, the US follows EPA Tier 4 regulations in which the NOx limit is set to 2.4 g/kWh for engines > 80 kW and PM at 0.015 g/kWh. Hence, these strict emission norms have shifted the trend towards electric tractors and are slowly gaining momentum in sales globally.These regulations impose far harsher limits on pollutants like NOx, PM, and HC than previous standards. For example, Stage 5 in the EU reduces NOx by 56% and PM by 47% compared to Stage IV. Meeting these limits with conventional diesel engines becomes increasingly expensive and technically challenging, pushing manufacturers towards exploring cleaner alternatives like electric tractors. Also, the stringent emission control technologies needed for diesel tractors under new regulations will increase production and maintenance costs. This price hike makes electric tractors, with potentially lower operating costs due to cheaper electricity, a more attractive alternative. This aided the development of hybrid and electric tractors and equipment that are emission-free, noise-free, and more efficient than their IC engine counterparts. Hence, considering all the factors, such as emission norms and price hikes, will lead to a substantial shift towards electric tractors. While affordability remains a consideration, the combined pressure of rising diesel costs, environmental concerns, government support, and technology advancements are making electric tractors a more attractive and viable option for the future of agriculture.

RESTRAINT: Thermal Management and operational challenges

Thermal management is a critical aspect of electric tractor design, encompassing various challenges such as leaks, corrosion, clogging, climate sensitivity, and battery aging. Leaks and corrosion can occur within the battery system due to thermal stresses, leading to electrolyte leakage and degradation of battery components over time. Additionally, clogging may occur in cooling channels or passages, hindering the effective heat dissipation from the battery. Climate conditions also play a significant role, as extreme temperatures can exacerbate thermal stresses and accelerate battery degradation. Moreover, as batteries age, their thermal performance may deteriorate, further complicating the management of heat generation and dissipation within the electric tractor's battery system.In addition to thermal management concerns, the high prices are significant barriers to adopting electric tractors. Extended charging times can result in operational downtime, limiting the productivity and efficiency of farm electric tractors. Moreover, the high cost of electricity, especially during peak demand periods, can significantly increase the overall operating expenses associated with electric tractor usage. For instance, a farmer operating an electric tractor may find that the lengthy charging times required to replenish the battery limit the tractor's availability for essential farming tasks, leading to scheduling conflicts and reduced productivity.Additionally, the high cost of electricity for charging the tractor's battery may outweigh the potential savings in fuel expenses, especially in regions with relatively high electricity prices. These factors collectively contribute to farmers' hesitation to invest in electric tractors despite their potential long-term benefits in terms of reduced emissions and operating costs. Addressing these challenges requires innovative solutions in battery technology, charging infrastructure, and policy support to make electric tractors more accessible and economically viable for farmers worldwide.


OPPORTUNITY: Emergence of Hydrogen-powered electric tractors

Determining the optimal type of tractor depends on several factors, including environmental impact, operational efficiency, and cost-effectiveness. Diesel tractors, while reliable and widely used, emit pollutants and greenhouse gases, contributing to air pollution and climate change. Electric tractors offer zero tailpipe emissions and lower operating costs than diesel but suffer from limited driving ranges per charge and higher upfront costs. However, advancements in battery technology and charging infrastructure are improving their viability. Hydrogen tractors, leveraging fuel cell technology, promise zero emissions and fast refueling times compared to diesel engines but are yet facing challenges such as limited hydrogen infrastructure and higher upfront costs.Key players are investing heavily in R&D to develop alternating fuel technology for tractors. Several key players in the agricultural machinery industry have showcased their hydrogen tractors in exhibitions and trade shows. Indian tractor manufacturer TAFE showcased their first hydrogen-powered tractor at the Agritechnica trade fair held in Hannover, Germany. In June 2022, Kubota Corporation (Japan) announced the launch of its first hydrogen-powered fuel cell tractor in 2025. The commercialization timeline for H2ICE tractors will take over a decade. However, specific timelines for widespread commercialization may vary depending on factors such as hydrogen infrastructure's readiness, fuel cell technology advancements, and market acceptance.These are some key developments for hydrogen manufacturing, which is considered to have a promising future. In the future, the momentum in tractor technology will shift towards electric and Hydrogen engine alternatives as concerns over emissions and sustainability drive agricultural innovation. Concurrently, H2ICE tractors offer the promise of zero emissions, longer driving ranges, and faster refueling times, contingent upon advancements in hydrogen infrastructure and production. Despite challenges, electric and H2ICE tractors will play a pivotal role in sustainable agriculture, reshaping the landscape of farming towards greener and more efficient practices.

CHALLENGE: High cost of electric tractors

The higher cost of electric tractors compared to their diesel counterparts can be attributed to several factors inherent in electric vehicle technology. Firstly, the cost of manufacturing lithium-ion batteries, which are crucial components of electric tractors, remains relatively high despite advancements in battery technology. Additionally, electric tractors require specialized electric drive systems, such as motors and inverters, which can be more expensive to produce and integrate than conventional mechanical drivetrains in diesel tractors. Ongoing research and development efforts to optimize electric tractor performance and reliability also increase upfront costs.Considering the price comparison, electric tractors are 40 – 50% more expensive than diesel tractors. These are due to the battery pack, which is the most expensive component in an battery electric tractor. Advanced battery technologies like lithium-ion batteries, commonly used in electric vehicles, including tractors, can be costly to manufacture. Also, diesel tractors have been mass-produced for many years, leading to economies of scale that help drive down costs. In contrast, the Electric tractors, on the other hand, may not yet benefit from the same mass production level, leading to higher per-unit costs. Since electric tractors are still relatively new, manufacturers may price them higher initially due to factors such as perceived value, environmental benefits, and the willingness of early adopters to pay a premium.Lastly, electric tractor models' limited availability restricts consumer choice, potentially hindering adoption. The lack of widespread charging infrastructure further complicates matters, particularly in rural areas where agricultural operations are prevalent. Moreover, electric tractors require specialized technical expertise for maintenance and aftersales support, posing concerns for farmers who may need more training. Overcoming these challenges will require concerted efforts to reduce upfront costs, expand model options, invest in charging infrastructure and technical training programs, and ensure compliance with safety standards. As technology evolves and market dynamics shift, these obstacles are expected to become more manageable, paving the way for broader acceptance and adoption of electric tractors in the agriculture industry.

Global Electric Tractor Market Ecosystem Analysis

The major electric tractor market companies have the latest technologies, diversified portfolios, and global distribution networks. The major players in the electric tractors market include Kubota Corporation (Japan), Solectrac (US), AGCO Corporation (US), CNH Industries NV (Netherlands), and Escorts Kubota Limited (India).


The battery electric segment is estimated to be the largest market during the forecasted period.

The agricultural landscape is shifting gears, and battery electric tractors (BETs) are leading the charge. A critical factor fueling battery electric tractors is the continuous decline in lithium-ion battery costs. According to industrial experts, the battery price may be reduced by 30-45% by 2026, making battery electric tractors even more cost-competitive than their diesel counterparts. Key players are investing in R&D to reduce the cost of batteries, technological advancements in battery chemistry and design, and exploration of alternative materials like sodium-ion, solid-state batteries, and lithium-iron-phosphate batteries, offering potentially even more affordable solutions.The emission and noise control regulations for various vehicles and equipment have constantly been upgraded at regional levels. So, according to the EU emission regulations, on March 28, 2023, the European Union (EU) adopted an amendment to the CO2 standards for light-duty vehicles (LDV). The amendment includes the following targets: a 15% reduction by 2025, a 55% reduction by 2030, and a 100% reduction by 2035. Moreover, the Euro 7 regulations will be implemented from July 2025, which will have emission limits of 3mg/km for pure electric vehicles, 7mg/km for most internal combustion engine (ICE), hybrid electric and fuel cell vehicles, and 11mg/km for large ICE vans. China, Japan, South Korea, and India are also expected to follow the same norms in line with the EU and US standards. With the growing diesel prices, farmers in developing economies would eventually look up electric options for the same equipment for agricultural purposes. Hence, the demand for battery electric farm tractors will increase in the coming years.States like California have an ambitious climate goal in America that has propelled the adoption of the battery electric tractor (BET). The California government has offered a scrappage policy for their old vehicles to which they are giving the Core Voucher to buy the electric tractors with the amount of USD 16,147 for e25G Gear, USD 13,753 for e25H Hydrostatic, and finally, USD 28,000 for buying eUT+ Narrow. In Europe, the "Farm to Fork" strategy champions sustainable agriculture, fueling the demand for electric solutions. Significant players like AGCO Corporation, Fendt, and New Holland actively respond with new BET models. Meanwhile, Asia Pacific markets like China and India are catching the wave, driven by rising fuel costs and air quality concerns. Local players like Mahindra & Mahindra, Cellestial Emobility Pvt Ltd, AutoNXT Automation Pvt Ltd, HAV, TAFE, VTL, Sonalika, and Montra Tractors are joining the race, eager to capitalize on this growing opportunity.Additionally, government policies like stricter emission regulations and subsidies for battery electric tractors are further shaping regional trends. However, there is an increase in the adoption of battery electric tractors due to the easy availability and accessibility of charging infrastructure in developed countries. Additionally, farmers' education and awareness regarding the benefits of battery electric tractors are crucial for market expansion.Europe has significantly invested in electric vehicle infrastructure, including charging stations and renewable energy sources. This infrastructure supports the adoption of battery electric tractors by providing the necessary charging infrastructure for electric vehicles. According to Markets and Market Analysis, the global EV charging station is valued at USD 11.9 billion in 2022 and is projected to grow around USD 76.9 billion in 2027. Furthermore, the European region has key players such as Fendt (Germany), Case IH (US), Antonio Carraro (Italy), Rigitrac (Switzerland), Sabi Agri (France), Tadus (Germany), ZY Elektric (Turkey) and Valtra (Finland).

Lithium Nickel Magnesium Cobalt Oxide is the fastest-growing battery chemistry segment for the electric tractor market.

There is an increase in the adoption of lithium nickel manganese cobalt oxide (Li-NMC) batteries in electric tractors. This reflects a broader global trend towards electrification in agriculture, driven by the need to reduce emissions and increase efficiency. The Li-NMC batteries rapidly transform the agricultural landscape, powering the electric tractor revolution. Their high energy density, fast charging capability, and long lifespans offer significant advantages over traditional lead-acid batteries, translating to longer ranges, shorter turnaround times, and lower operating costs for farmers.The Li-NMC batteries are used in electric tractors due to their robust energy density and remarkable power output. These batteries enable extended operational periods for large field farms without frequent recharging. Their advantages lie in their ability to store ample energy within a compact structure and swiftly deliver substantial power, essential for operating high-power machinery like hydraulic pumps. Despite their remarkable performance, NMC batteries come with a few considerations. Their higher cost than alternative battery types, such as lead-acid batteries, remains a notable drawback. Safety concerns regarding thermal runaway, a potentially hazardous condition arising from overheating, underscore the need for careful assessment when deploying these batteries in construction equipment.The global market presents a nuanced landscape in battery preferences. While Europe and North America lean towards NMC batteries for their higher energy density and anticipation of consumer acceptance regarding added costs, China opts for LFP batteries, emphasizing affordability amid rapid vehicle electrification. This divergence stems from supply chain preferences, with over 75% of European and North American offerings favoring NMC, especially in heavy-duty vehicles. At the same time, China leans towards LFP due to its cost-effectiveness amidst the electrification surge. The Escorts Kubota (India) FT25G, Solectrac (US) e25G Gear, and Solectrac e25H are offered with lithium-ion NMC battery packs. These batteries promise superior energy density, compact design, and heightened durability.These batteries offer higher energy density than LFP, translating to a more extended range per charge. This is crucial for tractors operating on large farms with diverse needs. For instance, the Fendt (Germany) e100 Vario with Li-NMC batteries claims a range of up to 250 km (155 miles), while the New Holland (Italy) T6 Methane Power with LFP batteries offers a range of up to 130 km (81 miles). Adding further, the availability of battery pack suppliers such as Northvolt AB (Sweden), Forsee Power (France), and Volta Charging (US) has predominantly driven the adoption of NMC in electric tractors. More than 75% of offerings from European and North American pack manufacturers currently utilize NMC. Hence, as the Li-NMC battery technology matures and cost advantages become more evident, its market share is expected to grow.51 – 100 KWh to hold the largest market share in the battery capacity segment for the electric tractor marketThe 51 - 100 kWh battery capacity range has emerged as the most prevalent choice among farmers and manufacturers in the global electric tractor market. This preference stems from factors influencing performance, cost, and practicality across various regional landscapes. In the Americas, where agriculture often spans vast expanses of land, the need for tractors with sufficient range is paramount. The 51 - 100 kWh range strikes a balance, offering adequate power for extended operations without burdening farmers with excessive costs. In the Americas, where vast farmlands are commonplace, the success of models like the Case IH Magnum Electric showcases the practicality of the 51 - 100 kWh battery capacity range. With its ability to cover large areas on a single charge, this tractor has gained popularity among farmers looking to reduce operational costs and environmental impact.Moreover, initiatives such as the United States Department of Agriculture's Rural Energy for America Program (REAP) provide financial assistance to farmers adopting electric tractors, further driving demand for models within this battery capacity range. Similarly, in Europe, where environmental concerns and regulatory incentives drive electric vehicle adoption, this battery capacity range aligns well with subsidy schemes and emission reduction goals. Europe is the fastest growing market for 51-100 kWh battery capacity in the electric tractor market. The European Green Deal in 2020 has also made an ambitious plan for achieving climate neutrality by 2050, due to which it has propelled the use of electric tractors in sustainable agriculture, creating a solid market for clean technologies like 50-100 kWh electric tractors, offering significant emissions reduction compared to traditional models. Also, Europe has more medium-sized farms than other regions like North America, making 50-100 kWh tractors ideal for their power requirements and farm size. In developed countries like France, their governing body launched a USD 117.3 million investment plan in October 2023 to support purchasing electric and hybrid agricultural equipment, including 50-100 kWh tractors.Moving to the Asia-Pacific region, the diversity of agricultural practices necessitates a versatile solution. The 51 - 100 kWh range caters to small-scale farming and more extensive plantations, providing the necessary power without being overly bulky or expensive. Furthermore, this battery capacity range is an ideal entry point in emerging markets where electric tractor adoption is still nascent. Its combination of performance and affordability makes it an attractive option for farmers exploring sustainable alternatives to traditional diesel tractors.The dominance of the 51 - 100 kWh battery capacity range can meet the needs of farmers while navigating regional nuances. It strikes a delicate balance between power, cost-effectiveness, and practicality, making it the preferred choice over smaller (<50 kWh) and larger (>100 kWh) battery capacities. While smaller capacities may need more range and power for demanding agricultural tasks, larger capacities may be prohibitively expensive or impractical in charging infrastructure. Thus, the 51 - 100 kWh range emerges as the optimal solution, capturing the highest market share worldwide in the electric tractor industry.

EUROPE region holds the largest share of the Electric Tractor Market.

Europe holds the highest market share for electric tractors due to regulatory incentives, environmental consciousness, and technological advancements. The European Union's stringent emissions regulations and ambitious sustainability goals have propelled the adoption of electric vehicles, including tractors. In particular, the Farm to Fork Strategy (2020) forms a key part of the European Green Deal and sets ambitious targets for the agricultural sector, aiming to reduce greenhouse gas emissions from agriculture by 50% by 2030 compared to 2019 levels and increase the area under organic farming to 25% of total agricultural land by 2030 compared to 8.1% in 2020 commitment to reducing greenhouse gas emissions under initiatives like the European Green Deal has incentivized farmers to transition towards electric alternatives. Also, the governing body took significant measures in France to mitigate its emissions. In 2017, the French government instituted mandatory clean air windscreen stickers, necessary for entry into specific cities, forming what is known as ZFE zones (Zone à Faibles Émissions), which regulate the access of vehicles lacking environmental badges. Hence, these regulations have steadily attracted the OEMs to manufacture electric tractors to reduce emissions. Moreover, European governments offer substantial subsidies and incentives to promote the adoption of electric tractors. Programs such as the Common Agricultural Policy (CAP) and the European Union's Horizon Europe framework provide funding and support for farmers investing in sustainable agricultural practices, including electrification.


Recent Developments of Electric Tractor Market industry

  • In November 2023, The Fendt launched the e107 V Vario electric tractor, a fully battery-electric, narrow-track tractor designed for specialized applications in orchards, vineyards, greenhouses, and municipalities. The e107 V Vario has a maximum power output of 68 horsepower (50 kW) and a battery capacity of 100 kWh, which provides an estimated range of 4 to 7 hours for partial load applications such as cutting, mowing, or road maintenance. In September 2023, Kubota Corporation launched the "Future Cube" webpage, which showcases a fully autonomous electric tractor prototype, highlighting Kubota's research and development in advanced agricultural technologies. Unveiled at CES March 2023, this exhibition highlighted Kubota's vision for the future of farming, where sustainability, automation, and data-driven insights come together to revolutionize agricultural practices. In August 2023, Solectac launched the eUT+ Narrow electric tractor, a zero-emission electric tractor. This vehicle is designed to be comparable to diesel tractors, with a hitch that can lift 5,500 pounds. The eUT+ Narrow has 60 kWh / 560 amps at 106 volts, Lithium Iron phosphate (LFP), and a 70HP. This tractor is offered at USD 7499 for a 12-inch bucket attachment with a 19kW motor capacity.
  • In August 2023, Solectrac launched the e25H model, a compact and accessible electric tractor ideal for smaller farms, vineyards, and landscaping endeavors. It comes with 25HP power to tackle lighter tasks like mowing, tilling, and hauling with its electric motor's instant torque. This eco-friendly machine boasts a 5-hour range on a single charge, catering to most workday needs. Maneuvering tight spaces is a breeze thanks to its compact size and foldable ROPS, while features like LED headlights and a PTO enhance its versatility. The company also offers a 19kW motor with Li NMC battery with this tractor. In September 2022, The Kubota launched LXe-261, a 26-horsepower, four-wheel drive electric tractor currently available for lease in Europe (France, Germany, United Kingdom, Spain, etc.). It is the first electric tractor launched by Kubota. The LXe-261 has a lithium-ion battery that provides up to three to four hours of operating time on a single charge. The battery can be fast charged in one hour.

Key Market Players

KEY PLAYERS IN THE Electric Tractor Market INCLUDE

  • Kubota Corporation (Japan)
  • Solectrac (US)
  • AGCO Corporation (US)
  • CNH Industrial N.V. (Netherlands)
  • Escorts Kubota Limited (India)
  • Monarch Tractor (US)
  • Deere & Company (US)
  • Yanmar Holdings Co. Ltd. (Japan)
  • Cellestial Emobility Pvt Ltd (India)
  • International Tractors Limited (India)
  • Proxecto (India)
  • AutoNXT Automation Pvt. Ltd. (India)
  • Rigitrac Traktorenbau AG (Switzerland)
  • Sabi Agri (France)
  • Agro Tractors S.p.A. (Italy)
  • Foton Lovol (China)
  • Tractors And Farm Equipment Limited (India)
  • VST Tractors (India)
  • Motivo Engineering (US)
  • Tadus GMbH (Germany)
  • ZY Elektrikli Traktör (Turkey)
  • AUGA (Lithuania)
  • ZTractors (US)
  • Amos Power (US)

Want to explore hidden markets that can drive new revenue in Electric Tractor Market?

Scope of the Report

Report Attribute Details
Market size available for years 2021–2030
Base year considered 2023
Market Growth forecast  USD 3.43 Billion by 2030 from USD 0.77 Billion in 2024 at 28.3% CAGR
Forecast period 2024–2030
Forecast units Value (USD Million/Billion)
Segments Covered Propulsion, Battery Chemistry, Function, Hybrid Electric Tractor Market, by Power Output, and Battery Capacity
Geographies covered Asia Pacific, Americas, and Europe
Top Players Kubota Corporation (Japan), Solectrac (US), AGCO Corporation (US), CNH Industries NV (Netherlands), and Escorts Kubota Limited (India). A total of 24 other major players covered


Key Questions Addressed by the Report

What is the current market size of the electric tractor market?
The electric tractor market is estimated to be USD 0.7 billion in 2024 and is projected to reach USD 3.4 billion by 2030 at a CAGR of 28.3%.
What are the driving factors of the electric tractor market?
Stringent government emission norms and regulations, incentives on EV tractors, and finance credits drive the electric tractor market.
Who are the top key players in the electric tractor market?
Major manufacturers in the electric tractor market include Kubota Corporation (Japan), Solectrac (US), AGCO Corporation (US), CNH Industries NV (Netherlands), and Escorts Kubota Limited (India).
What are the market trends in the electric tractor market?
Hydrogen tractors, solid-state batteries, and increased charging infrastructure are expected to see growth opportunities in the electric tractor market ecosystem.
What are the challenges faced by electric tractor manufacturers globally?
The high cost of electric tractors is the biggest challenge for them.


Personalize This Research

  • Triangulate with your Own Data
  • Get Data as per your Format and Definition
  • Gain a Deeper Dive on a Specific Application, Geography, Customer or Competitor
  • Any level of Personalization
Request A Free Customisation

Let Us Help You

  • What are the Known and Unknown Adjacencies Impacting the Electric Tractor Market
  • What will your New Revenue Sources be?
  • Who will be your Top Customer; what will make them switch?
  • Defend your Market Share or Win Competitors
  • Get a Scorecard for Target Partners
Customized Workshop Request

Table of Contents

Exclusive indicates content/data unique to MarketsandMarkets and not available with any competitors.

TITLE
PAGE NO
INTRODUCTION
24
RESEARCH METHODOLOGY
28
EXECUTIVE SUMMARY
41
PREMIUM INSIGHTS
44
MARKET OVERVIEW
48
  • 5.1 INTRODUCTION
  • 5.2 MARKET DYNAMICS
    DRIVERS
    - Stringent emission norms and regulations
    - Incentives on electric tractors and finance credits
    RESTRAINTS
    - Technological and operational issues
    OPPORTUNITIES
    - Emergence of hydrogen fuel-powered electric tractors
    - Integration of OEMs with battery manufacturers
    - Use of electric tractors in greenhouse
    CHALLENGES
    - High cost of electric tractors
  • 5.3 TRENDS AND DISRUPTIONS IMPACTING CUSTOMER BUSINESS
  • 5.4 SUPPLY CHAIN ANALYSIS
  • 5.5 PRICING ANALYSIS
    BY BATTERY CHEMISTRY
    BY REGION
  • 5.6 CASE STUDY ANALYSIS
    SOLECTRAC’S SOLUTIONS FOR MUSHROOM FARMS
    ELECTRIC TRACTORS FOR SUSTAINABLE AGRICULTURAL PRACTICE BY AGRIMACS INC.
    CALIFORNIA GOVERNMENT FOCUSES ON FARMS TO GO GREEN WITH ZERO EMISSIONS
    MONARCH TRACTORS SAVES USD 2,600 PER YEAR FOR WENTE VINEYARDS
    PACIFIC NORTHWEST ELECTRIC TRACTOR BARRIERS STUDY
    CHALLENGES RELATED TO AUTOMATION AND ELECTRIFICATION OF TRACTORS ADDRESSED BY DR. JIANFENG ZHOU
  • 5.7 PATENT ANALYSIS
  • 5.8 TRADE ANALYSIS
    IMPORT DATA
    EXPORT DATA
  • 5.9 TECHNOLOGY ANALYSIS
    AUTONOMOUS AND SEMI-AUTONOMOUS DRIVING
    PRECISION AGRICULTURE
    TELEMATICS AND REMOTE MONITORING
    FUTURE BATTERY CHEMISTRY
    H2ICE AS FUEL
    BATTERY SWAPPING TECHNOLOGY
  • 5.10 ECOSYSTEM MAPPING
  • 5.11 REGULATORY LANDSCAPE
    REGULATORY BODIES, GOVERNMENT AGENCIES, AND OTHER ORGANIZATIONS
    - North America
    - Europe
    - Asia Pacific
  • 5.12 KEY STAKEHOLDERS AND BUYING CRITERIA
    BUYING CRITERIA
    KEY STAKEHOLDERS
  • 5.13 KEY CONFERENCES AND EVENTS
  • 5.14 BATTERY TECHNOLOGY
    BATTERY RANGE VS. UNLADEN MASS
    BATTERY RANGE VS. BATTERY TEMPERATURE
    BATTERY DENSITY VS. BATTERY CHEMISTRY
    BATTERY CHARGING POWER VS. BATTERY RANGE
  • 5.15 TOTAL COST OF OWNERSHIP
  • 5.16 INVESTMENT AND FUNDING SCENARIO
  • 5.17 POWER TAKE-OFF (PTO)
ELECTRIC TRACTOR MARKET, BY PROPULSION
98
  • 6.1 INTRODUCTION
  • 6.2 BATTERY ELECTRIC
    REDUCING BATTERY MANUFACTURING COSTS TO DRIVE MARKET
  • 6.3 HYBRID ELECTRIC
    HIGHER POWER OUTPUT THAN BATTERY ELECTRIC TRACTORS TO DRIVE MARKET
  • 6.4 HYDROGEN
    ADVANCEMENTS IN FUEL CELL TECHNOLOGY AND INFRASTRUCTURE TO DRIVE MARKET
  • 6.5 PRIMARY INSIGHTS
ELECTRIC TRACTOR MARKET, BY BATTERY CHEMISTRY
108
  • 7.1 INTRODUCTION
  • 7.2 LITHIUM IRON PHOSPHATE (LFP)
    INCREASING APPLICATION IN SMALL FARMLANDS TO DRIVE MARKET
  • 7.3 LITHIUM NICKEL MANGANESE COBALT OXIDE (LI-NMC)
    AFFORDABILITY, HIGH DENSITY, AND FAST CHARGING CAPABILITY TO DRIVE MARKET
  • 7.4 OTHERS
    SODIUM-ION BATTERIES
    SOLID-STATE BATTERIES
  • 7.5 PRIMARY INSIGHTS
ELECTRIC TRACTOR MARKET, BY BATTERY CAPACITY
118
  • 8.1 INTRODUCTION
  • 8.2 ELECTRIC TRACTOR MODELS AND BATTERY CAPACITIES
  • 8.3 <50 KWH
    MODERATE-DUTY APPLICATIONS AND SMALL FARMING NEEDS TO DRIVE MARKET
  • 8.4 51–100 KWH
    MEDIUM-SIZED AND MIXED FARMING OPERATIONS TO DRIVE MARKET
  • 8.5 >100 KWH
    HEAVY MACHINERY AND EQUIPMENT FOR MULTI-TASKING TO DRIVE MARKET
  • 8.6 PRIMARY INSIGHTS
HYBRID ELECTRIC TRACTOR MARKET, BY POWER OUTPUT
127
  • 9.1 INTRODUCTION
  • 9.2 <50 HP
    INCREASING DEMAND FOR COMPACT AND MANEUVERABLE TRACTORS TO DRIVE MARKET
  • 9.3 51–100 HP
    MIXED FARMING AND PRECISION FARMING TO DRIVE MARKET
  • 9.4 >100 HP
    STRINGENT EMISSION REGULATIONS AND GOVERNMENT INCENTIVES TO DRIVE MARKET
  • 9.5 PRIMARY INSIGHTS
ELECTRIC TRACTOR MARKET, BY FUNCTION
136
  • 10.1 INTRODUCTION
  • 10.2 AGRICULTURE & FORESTRY
    INCREASE IN FOOD PRODUCTION AND PRECISION AGRICULTURE TO DRIVE MARKET
  • 10.3 UTILITY
    GOVERNMENT REGULATIONS AND INCENTIVES TO DRIVE MARKET
  • 10.4 INDUSTRIAL
    ENVIRONMENTAL CONCERNS AND NEED FOR NOISE REDUCTION TO DRIVE MARKET
  • 10.5 PRIMARY INSIGHTS
ELECTRIC FARM EQUIPMENT MARKET, BY EQUIPMENT TYPE
142
  • 11.1 INTRODUCTION
  • 11.2 ELECTRIC SPRAYERS
  • 11.3 ELECTRIC WEEDERS
  • 11.4 PRIMARY INSIGHTS
ELECTRIC TRACTOR MARKET, BY REGION
144
  • 12.1 INTRODUCTION
  • 12.2 ASIA PACIFIC
    RECESSION IMPACT ANALYSIS
    CHINA
    - Leadership in EV technology to drive market
    INDIA
    - Increase in farm mechanization to drive market
    JAPAN
    - Aging farmer population and labor shortage to drive market
    SOUTH KOREA
    - Government incentives for farmers to drive market
    REST OF ASIA PACIFIC
  • 12.3 EUROPE
    RECESSION IMPACT ANALYSIS
    GERMANY
    - Increasing demand for high-power tractors to drive market
    UK
    - Precision agriculture and sustainable farming to drive market
    FRANCE
    - Government National Low Carbon Strategy to drive market
    SPAIN
    - Labor shortage and increasing focus on precision agriculture to drive market
    RUSSIA
    - Increasing adoption of farm mechanization to drive market
    ITALY
    - Presence of vineyards to drive market
    REST OF EUROPE
  • 12.4 AMERICAS
    RECESSION IMPACT ANALYSIS
    US
    - High presence of OEMs to drive market
    CANADA
    - Landscaping and ground maintenance to drive market
    MEXICO
    - Focus on addressing increasing greenhouse emissions to drive market
    BRAZIL
    - Increasing vineyards and coffee plantations to drive market
    ARGENTINA
    - Digital agriculture and 2030 Agenda for Sustainable Development to drive market
  • 12.5 PRIMARY INSIGHTS
COMPETITIVE LANDSCAPE
183
  • 13.1 OVERVIEW
  • 13.2 MARKET SHARE ANALYSIS
  • 13.3 REVENUE ANALYSIS
  • 13.4 COMPANY EVALUATION MATRIX
    STARS
    EMERGING LEADERS
    PERVASIVE PLAYERS
    PARTICIPANTS
    COMPANY FOOTPRINT
  • 13.5 KEY PLAYERS’ STRATEGIES/RIGHT TO WIN
  • 13.6 COMPETITIVE SCENARIOS AND TRENDS
    PRODUCT LAUNCHES/DEVELOPMENTS
    DEALS
    OTHER DEVELOPMENTS
    EXPANSIONS
  • 13.7 COMPANY VALUATION
  • 13.8 COMPANY FINANCIAL METRICS
  • 13.9 BRAND COMPARISON
COMPANY PROFILES
208
  • 14.1 KEY PLAYERS
    KUBOTA CORPORATION
    - Business overview
    - Products offered
    - Recent developments
    - MnM view
    SOLECTRAC
    - Business overview
    - Products offered
    - Recent developments
    - MnM view
    AGCO CORPORATION
    - Business overview
    - Products offered
    - Recent developments
    - MnM view
    CNH INDUSTRIAL N.V.
    - Business overview
    - Products offered
    - Recent developments
    - MnM view
    ESCORTS KUBOTA LIMITED
    - Business overview
    - Products offered
    - Recent developments
    - MnM view
    MONARCH TRACTOR
    - Business overview
    - Products offered
    - Recent developments
    DEERE & COMPANY
    - Business overview
    - Products offered
    - Recent developments
    YANMAR HOLDINGS CO., LTD.
    - Business overview
    - Products offered
    - Recent developments
    CELLESTIAL E-MOBILITY PVT LTD
    - Business overview
    - Products offered
    - Recent developments
    INTERNATIONAL TRACTORS LIMITED
    - Business overview
    - Products offered
    - Recent developments
    PROXECTO
    - Business overview
    - Products offered
    - Recent developments
  • 14.2 OTHER PLAYERS
    AUTONXT AUTOMATION PVT. LTD.
    RIGITRAC TRAKTORENBAU AG
    SABI AGRI
    ARGO TRACTORS S.P.A.
    FOTON LOVOL
    TRACTORS AND FARM EQUIPMENT LIMITED
    VST TRACTORS
    MOTIVO ENGINEERING
    TADUS GMBH
    ZY ELEKTRIK TRACTOR
    AUGA
    ZTRACTOR
    AMOS POWER
RECOMMENDATIONS
259
  • 15.1 EUROPE TO DOMINATE ELECTRIC TRACTOR MARKET
  • 15.2 EMPHASIS ON SOLID-STATE BATTERIES IN ELECTRIC TRACTORS FOR FUTURE APPLICATIONS
  • 15.3 HYDROGEN ELECTRIC TRACTORS TO BE KEY FOCUS AREA
  • 15.4 CONCLUSION
APPENDIX
261
  • 16.1 KEY INSIGHTS FROM INDUSTRY EXPERTS
  • 16.2 DISCUSSION GUIDE
  • 16.3 KNOWLEDGESTORE: MARKETSANDMARKETS’ SUBSCRIPTION PORTAL
  • 16.4 CUSTOMIZATION OPTIONS
    ELECTRIC TRACTOR MARKET, BY REGION
    - UAE
    - Saudi Arabia
    - Egypt
    ELECTRIC TRACTOR MARKET, BY BATTERY CAPACITY
    - Asia Pacific
    - Europe
    - North America
    DETAILED ANALYSIS AND PROFILING OF ADDITIONAL MARKET PLAYERS
  • 16.5 RELATED REPORTS
  • 16.6 AUTHOR DETAILS
LIST OF TABLES
 
  • TABLE 1 INCLUSIONS AND EXCLUSIONS
  • TABLE 2 CURRENCY EXCHANGE RATES
  • TABLE 3 RESEARCH ASSUMPTIONS AND RISK ASSESSMENT
  • TABLE 4 BHARAT STAGE IV VS. BHARAT STAGE V REGULATIONS FOR PM LIMITS
  • TABLE 5 BHARAT STAGE IV VS. BHARAT STAGE V REGULATIONS FOR PN LIMITS
  • TABLE 6 NOX AND PM SAVINGS IN INDIA, BY EQUIPMENT TYPE, 2020–2045 (KILOTON)
  • TABLE 7 EURO STAGE IV, V, AND VI REGULATIONS FOR HEAVY-DUTY DIESEL ENGINES (G/KWH)
  • TABLE 8 INCENTIVES AND SUBSIDIES BY KEY COUNTRIES
  • TABLE 9 COMPARISON BETWEEN DIESEL, ELECTRIC, AND FCE TRACTORS
  • TABLE 10 RECENT DEVELOPMENTS RELATED TO HYDROGEN MANUFACTURING
  • TABLE 11 TOP BATTERY MANUFACTURERS SUPPLYING BATTERIES TO OEMS
  • TABLE 12 GREENHOUSE EMISSION REGULATIONS
  • TABLE 13 COST COMPARISON OF DIESEL AND ELECTRIC TRACTORS OVER TCO OF 5 YEARS IN INDIA
  • TABLE 14 PRICE COMPARISON OF DIESEL AND ELECTRIC TRACTORS
  • TABLE 15 ROLE OF COMPANIES IN SUPPLY CHAIN
  • TABLE 16 AVERAGE SELLING PRICE TREND OF ELECTRIC TRACTORS, BY BATTERY CAPACITY, 2021–2023 (USD)
  • TABLE 17 AVERAGE SELLING PRICE TREND OF ELECTRIC TRACTORS, BY REGION, 2021–2023 (USD)
  • TABLE 18 INNOVATIONS AND PATENTS, 2021–2024
  • TABLE 19 US: IMPORT DATA, BY COUNTRY (%)
  • TABLE 20 FRANCE: IMPORT DATA, BY COUNTRY (%)
  • TABLE 21 GERMANY: IMPORT DATA, BY COUNTRY (%)
  • TABLE 22 CANADA: IMPORT DATA, BY COUNTRY (%)
  • TABLE 23 UK: IMPORT DATA, BY COUNTRY (%)
  • TABLE 24 POLAND: IMPORT DATA, BY COUNTRY (%)
  • TABLE 25 ITALY: EXPORT DATA, BY COUNTRY (%)
  • TABLE 26 FRANCE: EXPORT DATA, BY COUNTRY (%)
  • TABLE 27 NETHERLANDS: EXPORT DATA, BY COUNTRY (%)
  • TABLE 28 CANADA: EXPORT DATA, BY COUNTRY (%)
  • TABLE 29 CHINA: EXPORT DATA, BY COUNTRY (%)
  • TABLE 30 PRODUCTS LAUNCHED BY CRITICAL PLAYERS FOR AUTONOMOUS AND SEMI-AUTONOMOUS ELECTRIC TRACTORS
  • TABLE 31 REGULATION STANDARDS SET FOR ELECTRIC TRACTORS, BY REGION/COUNTRY
  • TABLE 32 NORTH AMERICA: REGULATORY BODIES, GOVERNMENT AGENCIES, AND OTHER ORGANIZATIONS
  • TABLE 33 EUROPE: REGULATORY BODIES, GOVERNMENT AGENCIES, AND OTHER ORGANIZATIONS
  • TABLE 34 ASIA PACIFIC: REGULATORY BODIES, GOVERNMENT AGENCIES, AND OTHER ORGANIZATIONS
  • TABLE 35 KEY BUYING CRITERIA FOR TRACTORS
  • TABLE 36 INFLUENCE OF STAKEHOLDERS ON BUYING PROCESS OF TRACTORS
  • TABLE 37 KEY CONFERENCES AND EVENTS, 2024–2025
  • TABLE 38 ELECTRIC TRACTOR MODEL WITH VEHICLE RANGE VS. UNLADEN MASS
  • TABLE 39 BATTERY CHEMISTRIES FOR HDV APPLICATIONS (TRACTORS)
  • TABLE 40 TRACTOR MODELS WITH THEIR BATTERY CHARGER CAPACITIES AND BATTERY RANGES
  • TABLE 41 LIST OF FUNDING IN 2021-2024
  • TABLE 42 ELECTRIC TRACTOR MODELS WITH PTO OFFERINGS
  • TABLE 43 ELECTRIC TRACTOR MARKET, BY PROPULSION, 2021–2023 (UNITS)
  • TABLE 44 MARKET, BY PROPULSION, 2024–2030 (UNITS)
  • TABLE 45 MARKET, BY PROPULSION, 2021–2023 (USD MILLION)
  • TABLE 46 MARKET, BY PROPULSION, 2024–2030 (USD MILLION)
  • TABLE 47 BATTERY ELECTRIC TRACTOR SPECIFICATION WITH MOTOR AND BATTERY CAPACITIES
  • TABLE 48 BATTERY MARKET, BY REGION, 2021–2023 (UNITS)
  • TABLE 49 BATTERY MARKET, BY REGION, 2024–2030 (UNITS)
  • TABLE 50 BATTERY MARKET, BY REGION, 2021–2023 (USD MILLION)
  • TABLE 51 BATTERY MARKET, BY REGION, 2024–2030 (USD MILLION)
  • TABLE 52 HYBRID ELECTRIC TRACTOR SPECIFICATIONS WITH THEIR MOTOR AND ENGINE CAPACITIES
  • TABLE 53 HYBRID MARKET, BY REGION, 2021–2023 (UNITS)
  • TABLE 54 HYBRID MARKET, BY REGION, 2024–2030 (UNITS)
  • TABLE 55 HYBRID MARKET, BY REGION, 2021–2023 (USD MILLION)
  • TABLE 56 HYBRID MARKET, BY REGION, 2024–2030 (USD MILLION)
  • TABLE 57 HYDROGEN MARKET, BY REGION, 2024–2030 (UNITS)
  • TABLE 58 HYDROGEN MARKET, BY REGION, 2024–2030 (USD MILLION)
  • TABLE 59 MARKET, BY BATTERY CHEMISTRY, 2021–2023 (UNITS)
  • TABLE 60 MARKET, BY BATTERY CHEMISTRY, 2024–2030 (UNITS)
  • TABLE 61 MARKET, BY BATTERY CHEMISTRY, 2021–2023 (USD MILLION)
  • TABLE 62 MARKET, BY BATTERY CHEMISTRY, 2024–2030 (USD MILLION)
  • TABLE 63 LITHIUM IRON PHOSPHATE: MARKET, BY REGION, 2021–2023 (UNITS)
  • TABLE 64 LITHIUM IRON PHOSPHATE: MARKET, BY REGION, 2024–2030 (UNITS)
  • TABLE 65 LITHIUM IRON PHOSPHATE: MARKET, BY REGION, 2021–2023 (USD MILLION)
  • TABLE 66 LITHIUM IRON PHOSPHATE: MARKET, BY REGION, 2024–2030 (USD MILLION)
  • TABLE 67 LITHIUM NICKEL MANGANESE COBALT OXIDE: MARKET, BY REGION, 2021–2023 (UNITS)
  • TABLE 68 LITHIUM NICKEL MANGANESE COBALT OXIDE: MARKET, BY REGION, 2024–2030 (UNITS)
  • TABLE 69 LITHIUM NICKEL MANGANESE COBALT OXIDE: MARKET, BY REGION, 2021–2023 (USD MILLION)
  • TABLE 70 LITHIUM NICKEL MANGANESE COBALT OXIDE: MARKET, BY REGION, 2024–2030 (USD MILLION)
  • TABLE 71 SODIUM-ION BATTERY VS. LITHIUM IRON PHOSPHATE BATTERY
  • TABLE 72 OTHERS: MARKET, BY REGION, 2024–2030 (UNITS)
  • TABLE 73 OTHERS: ELECTRIC TRACTOR MARKET, BY REGION, 2024–2030 (USD MILLION)
  • TABLE 74 ELECTRIC TRACTOR MODELS AND BATTERY CAPACITIES, BY OEM
  • TABLE 75 ELECTRIC TRACTOR MARKET, BY BATTERY CAPACITY, 2021–2023 (UNITS)
  • TABLE 76 MARKET, BY BATTERY CAPACITY, 2024–2030 (UNITS)
  • TABLE 77 MARKET, BY BATTERY CAPACITY, 2021–2023 (USD MILLION)
  • TABLE 78 MARKET, BY BATTERY CAPACITY, 2024–2030 (USD MILLION)
  • TABLE 79 <50 KWH BATTERY CAPACITY: MARKET, BY REGION, 2021–2023 (UNITS)
  • TABLE 80 <50 KWH BATTERY CAPACITY: MARKET, BY REGION, 2024–2030 (UNITS)
  • TABLE 81 <50 KWH BATTERY CAPACITY: MARKET, BY REGION, 2021–2023 (USD MILLION)
  • TABLE 82 <50 KWH BATTERY CAPACITY: MARKET, BY REGION, 2024–2030 (USD MILLION)
  • TABLE 83 51–100 KWH BATTERY CAPACITY: MARKET, BY REGION, 2021–2023 (UNITS)
  • TABLE 84 51–100 KWH BATTERY CAPACITY: MARKET, BY REGION, 2024–2030 (UNITS)
  • TABLE 85 51–100 KWH BATTERY CAPACITY: MARKET, BY REGION, 2021–2023 (USD MILLION)
  • TABLE 86 51–100 KWH BATTERY CAPACITY: MARKET, BY REGION, 2024–2030 (USD MILLION)
  • TABLE 87 >100 KWH BATTERY CAPACITY: MARKET, BY REGION, 2024–2030 (UNITS)
  • TABLE 88 >100 KWH BATTERY CAPACITY: MARKET, BY REGION, 2024–2030 (USD MILLION)
  • TABLE 89 HYBRID MARKET, BY POWER OUTPUT, 2021–2023 (UNITS)
  • TABLE 90 HYBRID MARKET, BY POWER OUTPUT, 2024–2030 (UNITS)
  • TABLE 91 HYBRID MARKET, BY POWER OUTPUT, 2021–2023 (USD MILLION)
  • TABLE 92 HYBRID MARKET, BY POWER OUTPUT, 2024–2030 (USD MILLION)
  • TABLE 93 SPECIFICATIONS OF HYBRID TRACTORS AVAILABLE IN MARKET
  • TABLE 94 <50HP: HYBRID MARKET, BY REGION, 2021–2023 (UNITS)
  • TABLE 95 <50HP: HYBRID MARKET, BY REGION, 2024–2030 (UNITS)
  • TABLE 96 <50HP: HYBRID MARKET, BY REGION, 2021–2023 (USD MILLION)
  • TABLE 97 <50HP: HYBRID MARKET, BY REGION, 2024–2030 (USD MILLION)
  • TABLE 98 51–100 HP: HYBRID MARKET, BY REGION, 2021–2023 (UNITS)
  • TABLE 99 51–100 HP: HYBRID MARKET, BY REGION, 2024–2030 (UNITS)
  • TABLE 100 51–100 HP: HYBRID MARKET, BY REGION, 2021–2023 (USD MILLION)
  • TABLE 101 51–100 HP: HYBRID MARKET, BY REGION, 2024–2030 (USD MILLION)
  • TABLE 102 >100 HP: HYBRID MARKET, BY REGION, 2021–2023 (UNITS)
  • TABLE 103 >100 HP: HYBRID MARKET, BY REGION, 2024–2030 (UNITS)
  • TABLE 104 >100 HP: HYBRID MARKET, BY REGION, 2021–2023 (USD MILLION)
  • TABLE 105 >100 HP: HYBRID MARKET, BY REGION, 2024–2030 (USD MILLION)
  • TABLE 106 MARKET, BY FUNCTION, 2021–2023 (USD MILLION)
  • TABLE 107 MARKET, BY FUNCTION, 2024–2030 (USD MILLION)
  • TABLE 108 AGRICULTURE & FORESTRY: ELECTRIC TRACTOR MARKET, BY REGION, 2021–2023 (USD MILLION)
  • TABLE 109 AGRICULTURE & FORESTRY: MARKET, BY REGION, 2024–2030 (USD MILLION)
  • TABLE 110 UTILITY: MARKET, BY REGION, 2021–2023 (USD MILLION)
  • TABLE 111 UTILITY: MARKET, BY REGION, 2024–2030 (USD MILLION)
  • TABLE 112 INDUSTRIAL: MARKET, BY REGION, 2021–2023 (USD MILLION)
  • TABLE 113 INDUSTRIAL: MARKET, BY REGION, 2024–2030 (USD MILLION)
  • TABLE 114 MARKET, BY REGION, 2021–2023 (UNITS)
  • TABLE 115 ELECTRIC TRACTOR MARKET, BY REGION, 2024–2030 (UNITS)
  • TABLE 116 MARKET, BY REGION, 2021–2023 (USD MILLION)
  • TABLE 117 MARKET, BY REGION, 2024–2030 (USD MILLION)
  • TABLE 118 ASIA PACIFIC: MARKET, BY COUNTRY, 2021–2023 (UNITS)
  • TABLE 119 ASIA PACIFIC: MARKET, BY COUNTRY, 2024–2030 (UNITS)
  • TABLE 120 ASIA PACIFIC: MARKET, BY COUNTRY, 2021–2023 (USD MILLION)
  • TABLE 121 ASIA PACIFIC: MARKET, BY COUNTRY, 2024–2030 (USD MILLION)
  • TABLE 122 CHINA: MARKET, BY PROPULSION, 2021–2023 (UNITS)
  • TABLE 123 CHINA: MARKET, BY PROPULSION, 2024–2030 (UNITS)
  • TABLE 124 CHINA: MARKET, BY PROPULSION, 2021–2023 (USD MILLION)
  • TABLE 125 CHINA: MARKET, BY PROPULSION, 2024–2030 (USD MILLION)
  • TABLE 126 INDIA: MARKET, BY PROPULSION, 2021–2023 (UNITS)
  • TABLE 127 INDIA: MARKET, BY PROPULSION, 2024–2030 (UNITS)
  • TABLE 128 INDIA: MARKET, BY PROPULSION, 2021–2023 (USD MILLION)
  • TABLE 129 INDIA: MARKET, BY PROPULSION, 2024–2030 (USD MILLION)
  • TABLE 130 JAPAN: MARKET, BY PROPULSION, 2021–2023 (UNITS)
  • TABLE 131 JAPAN: MARKET, BY PROPULSION, 2024–2030 (UNITS)
  • TABLE 132 JAPAN: MARKET, BY PROPULSION, 2021–2023 (USD MILLION)
  • TABLE 133 JAPAN: MARKET, BY PROPULSION, 2024–2030 (USD MILLION)
  • TABLE 134 SOUTH KOREA: MARKET, BY PROPULSION, 2021–2023 (UNITS)
  • TABLE 135 SOUTH KOREA: MARKET, BY PROPULSION, 2024–2030 (UNITS)
  • TABLE 136 SOUTH KOREA: MARKET, BY PROPULSION, 2021–2023 (USD MILLION)
  • TABLE 137 SOUTH KOREA: MARKET, BY PROPULSION, 2024–2030 (USD MILLION)
  • TABLE 138 REST OF ASIA PACIFIC: MARKET, BY PROPULSION, 2021–2023 (UNITS)
  • TABLE 139 REST OF ASIA PACIFIC: MARKET, BY PROPULSION, 2024–2030 (UNITS)
  • TABLE 140 REST OF ASIA PACIFIC: MARKET, BY PROPULSION, 2021–2023 (USD MILLION)
  • TABLE 141 REST OF ASIA PACIFIC: MARKET, BY PROPULSION, 2024–2030 (USD MILLION)
  • TABLE 142 EUROPE: MARKET, BY COUNTRY, 2021–2023 (UNITS)
  • TABLE 143 EUROPE: MARKET, BY COUNTRY, 2024–2030 (UNITS)
  • TABLE 144 EUROPE: MARKET, BY COUNTRY, 2021–2023 (USD MILLION)
  • TABLE 145 EUROPE: MARKET, BY COUNTRY, 2024–2030 (USD MILLION)
  • TABLE 146 GERMANY: MARKET, BY PROPULSION, 2021–2023 (UNITS)
  • TABLE 147 GERMANY: MARKET, BY PROPULSION, 2024–2030 (UNITS)
  • TABLE 148 GERMANY: MARKET, BY PROPULSION, 2021–2023 (USD MILLION)
  • TABLE 149 GERMANY: MARKET, BY PROPULSION, 2024–2030 (USD MILLION)
  • TABLE 150 UK: MARKET, BY PROPULSION, 2021–2023 (UNITS)
  • TABLE 151 UK: MARKET, BY PROPULSION, 2024–2030 (UNITS)
  • TABLE 152 UK: MARKET, BY PROPULSION, 2021–2023 (USD MILLION)
  • TABLE 153 UK: MARKET, BY PROPULSION, 2024–2030 (USD MILLION)
  • TABLE 154 FRANCE: MARKET, BY PROPULSION, 2021–2023 (UNITS)
  • TABLE 155 FRANCE: MARKET, BY PROPULSION, 2024–2030 (UNITS)
  • TABLE 156 FRANCE: MARKET, BY PROPULSION, 2021–2023 (USD MILLION)
  • TABLE 157 FRANCE: MARKET, BY PROPULSION, 2024–2030 (USD MILLION)
  • TABLE 158 SPAIN: MARKET, BY PROPULSION, 2021–2023 (UNITS)
  • TABLE 159 SPAIN: MARKET, BY PROPULSION, 2024–2030 (UNITS)
  • TABLE 160 SPAIN: MARKET, BY PROPULSION, 2021–2023 (USD MILLION)
  • TABLE 161 SPAIN: MARKET, BY PROPULSION, 2024–2030 (USD MILLION)
  • TABLE 162 RUSSIA: MARKET, BY PROPULSION, 2021–2023 (UNITS)
  • TABLE 163 RUSSIA: MARKET, BY PROPULSION, 2024–2030 (UNITS)
  • TABLE 164 RUSSIA: MARKET, BY PROPULSION, 2021–2023 (USD MILLION)
  • TABLE 165 RUSSIA: MARKET, BY PROPULSION, 2024–2030 (USD MILLION)
  • TABLE 166 ITALY: MARKET, BY PROPULSION, 2021–2023 (UNITS)
  • TABLE 167 ITALY: MARKET, BY PROPULSION, 2024–2030 (UNITS)
  • TABLE 168 ITALY: MARKET, BY PROPULSION, 2021–2023 (USD MILLION)
  • TABLE 169 ITALY: MARKET, BY PROPULSION, 2024–2030 (USD MILLION)
  • TABLE 170 REST OF EUROPE: MARKET, BY PROPULSION, 2021–2023 (UNITS)
  • TABLE 171 REST OF EUROPE: MARKET, BY PROPULSION, 2024–2030 (UNITS)
  • TABLE 172 REST OF EUROPE: MARKET, BY PROPULSION, 2021–2023 (USD MILLION)
  • TABLE 173 REST OF EUROPE: MARKET, BY PROPULSION, 2024–2030 (USD MILLION)
  • TABLE 174 AMERICAS: MARKET, BY COUNTRY, 2021–2023 (UNITS)
  • TABLE 175 AMERICAS: MARKET, BY COUNTRY, 2024–2030 (UNITS)
  • TABLE 176 AMERICAS: MARKET, BY COUNTRY, 2021–2023 (USD MILLION)
  • TABLE 177 AMERICAS: MARKET, BY COUNTRY, 2024–2030 (USD MILLION)
  • TABLE 178 US: MARKET, BY PROPULSION, 2021–2023 (UNITS)
  • TABLE 179 US: MARKET, BY PROPULSION, 2024–2030 (UNITS)
  • TABLE 180 US: MARKET, BY PROPULSION, 2021–2023 (USD MILLION)
  • TABLE 181 US: MARKET, BY PROPULSION, 2024–2030 (USD MILLION)
  • TABLE 182 CANADA: MARKET, BY PROPULSION, 2021–2023 (UNITS)
  • TABLE 183 CANADA: MARKET, BY PROPULSION, 2024–2030 (UNITS)
  • TABLE 184 CANADA: MARKET, BY PROPULSION, 2021–2023 (USD MILLION)
  • TABLE 185 CANADA: MARKET, BY PROPULSION, 2024–2030 (USD MILLION)
  • TABLE 186 MEXICO: MARKET, BY PROPULSION, 2021–2023 (UNITS)
  • TABLE 187 MEXICO: MARKET, BY PROPULSION, 2024–2030 (UNITS)
  • TABLE 188 MEXICO: MARKET, BY PROPULSION, 2021–2023 (USD MILLION)
  • TABLE 189 MEXICO: MARKET, BY PROPULSION, 2024–2030 (USD MILLION)
  • TABLE 190 BRAZIL: MARKET, BY PROPULSION, 2021–2023 (UNITS)
  • TABLE 191 BRAZIL: MARKET, BY PROPULSION, 2024–2030 (UNITS)
  • TABLE 192 BRAZIL: MARKET, BY PROPULSION, 2021–2023 (USD MILLION)
  • TABLE 193 BRAZIL: MARKET, BY PROPULSION, 2024–2030 (USD MILLION)
  • TABLE 194 ARGENTINA: MARKET, BY PROPULSION, 2021–2023 (UNITS)
  • TABLE 195 ARGENTINA: MARKET, BY PROPULSION, 2024–2030 (UNITS)
  • TABLE 196 ARGENTINA: MARKET, BY PROPULSION, 2021–2023 (USD MILLION)
  • TABLE 197 ARGENTINA: MARKET, BY PROPULSION, 2024–2030 (USD MILLION)
  • TABLE 198 DEGREE OF COMPETITION, 2023
  • TABLE 199 MARKET: PROPULSION FOOTPRINT, 2023
  • TABLE 200 ELECTRIC TRACTOR MARKET: REGION FOOTPRINT, 2023
  • TABLE 201 COMPANIES ADOPTED PRODUCT DEVELOPMENTS, PARTNERSHIPS, AND CONTRACTS AS CRUCIAL GROWTH STRATEGIES FROM JANUARY 2020 TO JANUARY 2024
  • TABLE 202 ELECTRIC TRACTOR MARKET: PRODUCT LAUNCHES/DEVELOPMENTS, JANUARY 2021–JANUARY 2024
  • TABLE 203 ELECTRIC TRACTOR MARKET: DEALS, JANUARY 2020–JANUARY 2024
  • TABLE 204 MARKET: OTHER DEVELOPMENTS, JANUARY 2020–JANUARY 2024
  • TABLE 205 MARKET: EXPANSIONS, JANUARY 2020–JANUARY 2024
  • TABLE 206 KUBOTA CORPORATION: COMPANY OVERVIEW
  • TABLE 207 KUBOTA CORPORATION: PRODUCTS OFFERED
  • TABLE 208 KUBOTA CORPORATION: PRODUCT LAUNCHES
  • TABLE 209 KUBOTA CORPORATION: DEALS
  • TABLE 210 KUBOTA CORPORATION: OTHER DEVELOPMENTS
  • TABLE 211 SOLECTRAC: COMPANY OVERVIEW
  • TABLE 212 SOLECTRAC: PRODUCTS OFFERED
  • TABLE 213 SOLECTRAC: PRODUCT LAUNCHES
  • TABLE 214 SOLECTRAC: DEALS
  • TABLE 215 SOLECTRAC: OTHER DEVELOPMENTS
  • TABLE 216 AGCO CORPORATION: COMPANY OVERVIEW
  • TABLE 217 AGCO CORPORATION: PRODUCTS OFFERED
  • TABLE 218 AGCO CORPORATION: PRODUCT LAUNCHES
  • TABLE 219 AGCO CORPORATION: DEALS
  • TABLE 220 AGCO CORPORATION: EXPANSIONS
  • TABLE 221 CNH INDUSTRIAL N.V.: COMPANY OVERVIEW
  • TABLE 222 CNH INDUSTRIAL N.V.: PRODUCTS OFFERED
  • TABLE 223 CNH INDUSTRIAL N.V.: PRODUCT LAUNCHES
  • TABLE 224 CNH INDUSTRIAL N.V.: DEALS
  • TABLE 225 CNH INDUSTRIAL N.V.: EXPANSIONS
  • TABLE 226 ESCORTS KUBOTA LIMITED: COMPANY OVERVIEW
  • TABLE 227 ESCORTS KUBOTA LIMITED: PRODUCTS OFFERED
  • TABLE 228 ESCORTS KUBOTA LIMITED: PRODUCT DEVELOPMENTS
  • TABLE 229 ESCORTS KUBOTA LIMITED: DEALS
  • TABLE 230 MONARCH TRACTOR: COMPANY OVERVIEW
  • TABLE 231 MONARCH TRACTOR: PRODUCTS OFFERED
  • TABLE 232 MONARCH TRACTOR: PRODUCT DEVELOPMENTS
  • TABLE 233 MONARCH TRACTOR: DEALS
  • TABLE 234 MONARCH TRACTOR: OTHER DEVELOPMENTS
  • TABLE 235 DEERE & COMPANY: COMPANY OVERVIEW
  • TABLE 236 DEERE & COMPANY: PRODUCTS OFFERED
  • TABLE 237 DEERE & COMPANY: PRODUCT DEVELOPMENTS
  • TABLE 238 DEERE & COMPANY: DEALS
  • TABLE 239 DEERE & COMPANY: EXPANSIONS
  • TABLE 240 YANMAR HOLDINGS CO., LTD.: COMPANY OVERVIEW
  • TABLE 241 YANMAR HOLDINGS CO., LTD.: PRODUCTS OFFERED
  • TABLE 242 YANMAR HOLDINGS CO., LTD.: PRODUCT DEVELOPMENTS
  • TABLE 243 YANMAR HOLDINGS CO., LTD.: DEALS
  • TABLE 244 YANMAR HOLDINGS CO., LTD.: OTHER DEVELOPMENTS
  • TABLE 245 CELLESTIAL E-MOBILITY PVT LTD: COMPANY OVERVIEW
  • TABLE 246 CELLESTIAL E-MOBILITY PVT LTD: PRODUCTS OFFERED
  • TABLE 247 CELLESTIAL E-MOBILITY PVT LTD: PRODUCT DEVELOPMENTS
  • TABLE 248 CELLESTIAL E-MOBILITY PVT LTD: DEALS
  • TABLE 249 INTERNATIONAL TRACTORS LIMITED: COMPANY OVERVIEW
  • TABLE 250 INTERNATIONAL TRACTORS LIMITED: PRODUCTS OFFERED
  • TABLE 251 INTERNATIONAL TRACTORS LIMITED: PRODUCT LAUNCHES
  • TABLE 252 INTERNATIONAL TRACTORS LIMITED: OTHER DEVELOPMENTS
  • TABLE 253 PROXECTO: COMPANY OVERVIEW
  • TABLE 254 PROXECTO: PRODUCTS OFFERED
  • TABLE 255 PROXECTO: PRODUCT DEVELOPMENTS
  • TABLE 256 AUTONXT AUTOMATION PVT. LTD.: COMPANY OVERVIEW
  • TABLE 257 RIGITRAC TRAKTORENBAU AG: COMPANY OVERVIEW
  • TABLE 258 SABI AGRI: COMPANY OVERVIEW
  • TABLE 259 ARGO TRACTORS S.P.A: COMPANY OVERVIEW
  • TABLE 260 FOTON LOVOL: COMPANY OVERVIEW
  • TABLE 261 TRACTORS AND FARM EQUIPMENT LIMITED: COMPANY OVERVIEW
  • TABLE 262 VST TRACTORS: COMPANY OVERVIEW
  • TABLE 263 MOTIVO ENGINEERING: COMPANY OVERVIEW
  • TABLE 264 TADUS GMBH: COMPANY OVERVIEW
  • TABLE 265 ZY ELEKTRIK TRACTOR: COMPANY OVERVIEW
  • TABLE 266 AUGA: COMPANY OVERVIEW
  • TABLE 267 ZTRACTOR: COMPANY OVERVIEW
  • TABLE 268 AMOS POWER: COMPANY OVERVIEW
LIST OF FIGURES
 
  • FIGURE 1 MARKET SEGMENTATION
  • FIGURE 2 RESEARCH DESIGN
  • FIGURE 3 RESEARCH PROCESS FLOW
  • FIGURE 4 BREAKDOWN OF PRIMARY INTERVIEWS
  • FIGURE 5 HYPOTHESIS BUILDING
  • FIGURE 6 BOTTOM-UP APPROACH
  • FIGURE 7 TOP-DOWN APPROACH
  • FIGURE 8 DATA TRIANGULATION
  • FIGURE 9 EUROPE TO HOLD LARGEST MARKET SHARE FOR ELECTRIC TRACTORS DURING FORECAST PERIOD
  • FIGURE 10 ADVANCEMENTS IN BATTERY TECHNOLOGY TO DRIVE MARKET
  • FIGURE 11 BATTERY ELECTRIC SEGMENT TO ACQUIRE MAXIMUM MARKET SHARE IN 2030
  • FIGURE 12 51–100 KWH TO BE LARGEST SEGMENT DURING FORECAST PERIOD
  • FIGURE 13 LITHIUM IRON PHOSPHATE TO SURPASS OTHER SEGMENTS DURING FORECAST PERIOD
  • FIGURE 14 AGRICULTURE & FORESTRY TO SECURE LEADING MARKET POSITION DURING FORECAST PERIOD
  • FIGURE 15 51–100 HP TO HOLD LARGEST MARKET SHARE IN 2030
  • FIGURE 16 EUROPE TO BE LARGEST MARKET FOR ELECTRIC TRACTORS DURING FORECAST PERIOD
  • FIGURE 17 DRIVERS, RESTRAINTS, OPPORTUNITIES, AND CHALLENGES
  • FIGURE 18 NON-ROAD MOBILE MACHINERY (NRMM) EMISSION REGULATION OUTLOOK, 2019–2030
  • FIGURE 19 GOVERNMENT INCENTIVES AND POLICIES CLOSING PRICE GAP BETWEEN ELECTRIC AND DIESEL TRACTORS
  • FIGURE 20 TRENDS AND DISRUPTIONS IMPACTING CUSTOMER BUSINESS
  • FIGURE 21 SUPPLY CHAIN ANALYSIS
  • FIGURE 22 PRECISION FARMING ADOPTION DATA OF US FARMERS WITH INCREASING YIELD, 1996–2019
  • FIGURE 23 COMPARISON OF SOLID-STATE VS. LITHIUM-IRON BATTERIES
  • FIGURE 24 OFF-HIGHWAY VEHICLE MARKET: ECOSYSTEM MAPPING
  • FIGURE 25 KEY PLAYERS IN ECOSYSTEM
  • FIGURE 26 KEY BUYING CRITERIA FOR ELECTRIC TRACTORS
  • FIGURE 27 BATTERY DISCHARGE TEMPERATURE
  • FIGURE 28 TOTAL COST OF OWNERSHIP: ELECTRIC AND DIESEL TRACTORS
  • FIGURE 29 INVESTMENT SCENARIO, 2020–2024
  • FIGURE 30 MARKET, BY PROPULSION, 2024 VS. 2030 (USD MILLION)
  • FIGURE 31 AVERAGE GLOBAL PACK AND CELL PRICE, PER KWH, 2013–2023
  • FIGURE 32 MARKET, BY BATTERY CHEMISTRY, 2024 VS. 2030 (USD MILLION)
  • FIGURE 33 CHARACTERISTICS OF LI-NMC BATTERIES
  • FIGURE 34 MARKET, BY BATTERY CAPACITY, 2024 VS. 2030 (USD MILLION)
  • FIGURE 35 HYBRID MARKET, 2024 VS. 2030 (USD MILLION)
  • FIGURE 36 MARKET, BY FUNCTION, 2024 VS. 2030 (USD MILLION)
  • FIGURE 37 MARKET, BY REGION, 2024 VS. 2030 (USD MILLION)
  • FIGURE 38 ASIA PACIFIC: MARKET SNAPSHOT
  • FIGURE 39 ASIA PACIFIC: MARKET, BY COUNTRY, 2024 VS. 2030 (USD MILLION)
  • FIGURE 40 EUROPE: MARKET SNAPSHOT
  • FIGURE 41 MARKET SHARE ANALYSIS, 2023
  • FIGURE 42 REVENUE ANALYSIS OF TOP 5 PLAYERS, 2020–2022
  • FIGURE 43 ELECTRIC TRACTOR MARKET: COMPANY FOOTPRINT, 2023
  • FIGURE 44 COMPANY EVALUATION MATRIX, 2023
  • FIGURE 45 COMPANY VALUATION, 2023 (USD BILLION)
  • FIGURE 46 COMPANY FINANCIAL METRICS, 2023 (USD BILLION)
  • FIGURE 47 KUBOTA CORPORATION: COMPANY SNAPSHOT
  • FIGURE 48 SOLECTRAC: COMPANY SNAPSHOT
  • FIGURE 49 AGCO CORPORATION: COMPANY SNAPSHOT
  • FIGURE 50 CNH INDUSTRIAL N.V.: COMPANY SNAPSHOT
  • FIGURE 51 ESCORTS KUBOTA LIMITED: COMPANY SNAPSHOT
  • FIGURE 52 DEERE & COMPANY: COMPANY SNAPSHOT
  • FIGURE 53 YANMAR HOLDINGS CO., LTD.: COMPANY SNAPSHOT
  • FIGURE 54 CELLESTIAL E-MOBILITY PVT LTD: COMPANY SNAPSHOT


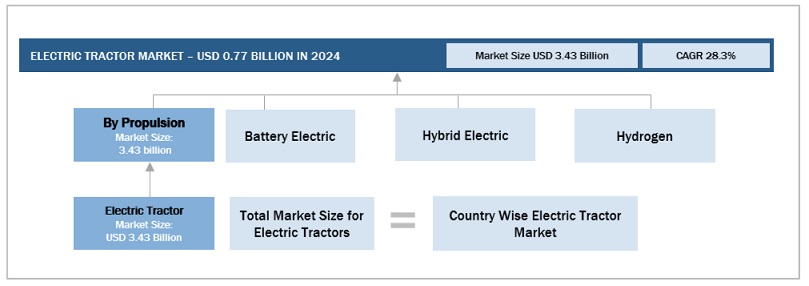
Various secondary sources, directories, and databases have been used to identify and collect information for an extensive electric tractor market study. The study involved four main activities in estimating the current size of the electric tractor market: secondary research, validation through primary research, assumptions, and market analysis. Exhaustive secondary research was carried out to collect information on the market, such as different propulsion types and the upcoming technologies and trends. The next step was to validate these findings, assumptions, and market analysis with industry experts across the value chain through primary research. The top-down approach was employed to estimate the complete market size for different segments considered in this study.

Secondary Research

In the secondary research process, various secondary sources have been used to identify and collect information useful for an extensive commercial study of the electric tractor market. Secondary sources include company annual reports/presentations, press releases, industry association publications [such as publications on Committee for European Electric Off-highway Vehicle (CECE), Environmental Protection Agency (EPA), Agriculture Equipment Manufacturers Union (AXEMA), Association of Equipment Manufacturers (AEM), Italian Agricultural Machinery Manufacturers Federation (FEDERUNACOMA), Japan Agricultural Machinery Manufacturers Association (JAMMA), China Agricultural Machinery Distribution Association (CAMDA), VDMA (Verband Deutscher Maschinen- und Anlagenbau), Russian Association of Specialized Machinery and Equipment Manufacturers (ROSSPETSMASH), Brazilian Association of Industrial Machinery and Equipment (ABIMAQ), Agricultural Engineers Association (AEA). The electric tractor-related magazine articles, directories, technical handbooks, World Economic Outlook, trade websites, and technical articles. Additionally, secondary research has been carried out to understand the average cost of electric tractors, which come with different battery capacities, and the historical sales of vehicles.

Primary Research

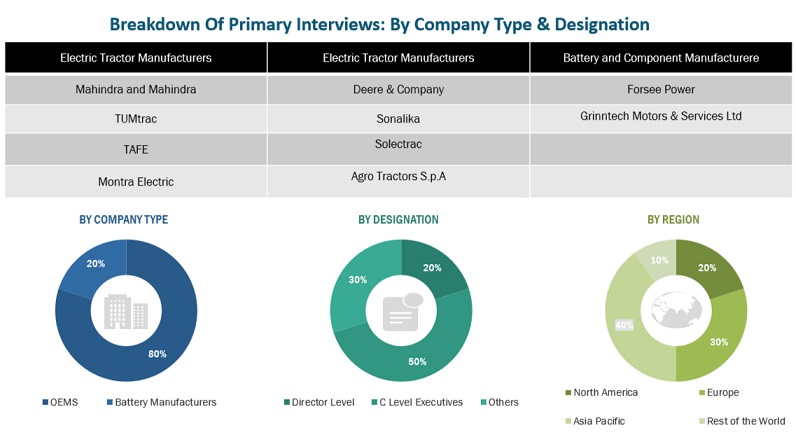
In the primary research process, various primary sources from both the supply and demand sides were interviewed to obtain qualitative and quantitative information on the market. The primary sources from the supply side included industry experts such as CXOs, vice presidents, directors from business development, marketing, product development/innovation teams, and related key executives from various key companies. Various system integrators, industry associations, independent consultants/industry veterans, and key opinion leaders were also interviewed.

In the primary research process, various sources from both the supply and demand sides have been interviewed to obtain qualitative and quantitative information for this report. The primary sources from the supply side include industry experts such as research and development experts, CEOs, CTOs, COOS, vice presidents, marketing directors, technology and innovation directors, and related key executives from different key companies operating in the electric tractor market.

After the complete market engineering, which includes calculations for market statistics, market breakdown, market size estimations, market forecasting, and data triangulation, extensive primary research has been conducted to gather information and verify and validate the critical numbers arrived at. Primary research has also been undertaken to identify and validate the segmentation, industry trends, key players, competitive landscape, and market dynamics, such as drivers, restraints, opportunities, challenges, industry trends, and key strategies. Extensive qualitative and quantitative analysis has been performed on the complete market engineering process to list key information/insights throughout the report.

After interacting with industry experts, we have also conducted brief sessions with highly experienced independent consultants to reinforce the findings from our primaries. This and the in-house subject matter expert’s opinions have led us to the conclusions described in this report's remainder.
Electric Tractor  Market Size, and Share

To know about the assumptions considered for the study, download the pdf brochure

Market Size Estimation

A detailed market estimation approach was followed to estimate and validate the value of the electric tractor market and other dependent submarkets, as mentioned below:

  • Key players in the electric tractor market were identified through secondary research, and their global market shares were determined through primary and secondary research.
  • The research methodology included studying annual and quarterly financial reports, regulatory filings of major market players (public), and interviews with industry experts for detailed market insights.
  • All industry-level penetration rates, percentage shares, splits, and breakdowns for the electric tractor market were determined using secondary sources and verified through primary sources.
  • All key macro indicators affecting the revenue growth of the market segments and sub-segments have been accounted for, viewed in extensive detail, verified through primary research, and analyzed to get the validated and verified quantitative and qualitative data.
  • The gathered market data was consolidated and added with detailed inputs, analyzed, and presented in this report.

Electric Tractor Market: Bottom-Up Approach
Electric Tractor  Market Bottom Up Approach

To know about the assumptions considered for the study, Request for Free Sample Report

Electric Tractor Market: Top-Down Approach

Extensive secondary and primary research was conducted to understand the global market scenario and penetration for hybrid tractors per region. While estimating the regional market for hybrid electric tractors by power output, the regional shares of <50HP, 51 – 100HP, and >100HP power output were identified and multiplied by the regional market size in terms of the volume, of hybrid electric tractors. In terms of volume, the regional-level market size was then multiplied by the regional-level average selling price of the hybrid electric tractor mentioned above and the power output of the tractor. This resulted in regional-level market size, by powerout put, in terms of value. This information was validated through primary interviews with OEMs and Tier I suppliers.

Electric Tractor  Market Top Down Approach

Electric Tractor  Market Bottom Up Approach Regional Level

Data Triangulation

After arriving at the overall market size, the market was split into several segments and sub-segments—using the market size estimation processes as explained above. Where applicable, data triangulation and market breakdown procedures were employed to complete the overall market engineering process and determine each market segment's and sub-segments exact statistics. The data was triangulated by studying various factors and trends.

Market Definition

Electric tractors include both battery-electric and hybrid-electric tractors. The hybrid electric tractor is powered by an internal combustion engine (ICE) combined with one or more electric motors that use energy stored in batteries to meet the additional auxiliary power needs of the equipment, electronic devices, and power tools. The battery-electric tractor is fully electric, and the combustion engine is replaced with batteries and an electric motor that powers the movement of the machine and its attachments.

These tractors provide zero emissions, reduce carbon footprint, and contribute to sustainability goals. They also operate silently, improving the work environment and potentially complying with noise regulations. Functionally, electric tractors perform the same tasks as their diesel counterparts, including soil preparation, seeding, harvesting, and transporting materials. However, they come with distinct features such as regenerative braking that feeds energy back to the battery, multiple power levels catering to various needs, and connected data monitoring and optimization technologies.

Stakeholders

  • Electric Tractor Component Manufacturing Associations
  • Electric tractor Component Suppliers
  • Farm Tractor Dealers and Distributors
  • Government and Regulatory Authorities
  • Research Professionals
  • Farm Tractor Importers, Retailers, and Dealers
  • Tier 1 System Suppliers
  • Raw Material Suppliers for Electric Farm Tractor
  • Battery and Drivetrain Suppliers
  • Electric Tractor Manufacturers
  • Electric tractor Manufacturers
  • Traders, Distributors, and Suppliers of Electric tractor Systems/Components
  • Automotive Industry Associations, Government Authorities, and Research Organizations

Report Objectives

  • To define, describe, and forecast the electric tractor market in terms of value
    (USD million), based on the following segments:
  • Propulsion (Battery Electric, Hybrid Electric, and Hydrogen)
  • Battery Chemistry (Lithium Iron Phosphate (LFP), Lithium nickel manganese cobalt oxides (LI-NMC), and Others)
  • Hybrid Electric Tractor Market, by Power Output (<50 HP, 51-100 HP, and >100 HP)
  • Battery capacity (<50 KWH, 51-100 KWH, and >100 KWH)
  • Function (Agriculture & Forestry, Utility, and Industrial)
  • Region (Asia Pacific, Europe, and Americas)
  • To understand the market dynamics (Drivers, Restraints, Opportunities, and Challenges) and conduct Patent Analysis, Pricing Analysis, Recession Impact, Key Buying Criteria, Trade Analysis, Technology Analysis, ASP Analysis, Trades and Conferences, Case Study Analysis, Supply Chain Analysis, Regulatory Analysis, Key Conference and Events, Bill of Material, Total Cost of Ownership, Investment & Funding Scenario, Funding by Use Case Scenario, Battery Technology, and Ecosystem Mapping
  • To understand the dynamics of the market players and distinguish them into stars, emerging leaders, pervasive players, and participants according to their product portfolio strength and business strategies.
  • To strategically analyze markets concerning individual growth trends, prospects, and contributions to the total market
  • To analyze recent developments, such as partnerships, supply agreements, joint ventures/mergers and acquisitions, geographic expansions, and product developments of key players in the market

Available Customizations

Along with the market data, MarketsandMarkets offers customizations based on company-specific needs.

The following customization options are available for the report:

Electric Tractor Market By Region

  • UAE
  • Saudi Arabia
  • Egypt

Electric Tractor Market, By Battery Capacity

  • Asia Pacific (China, India, Japan, South Korea, Rest of Asia Pacific)
  • Europe (Germany, France, UK, Spain, Russia, Italy, Turkey, and Rest of Europe)
  • Americas (US, Canada, Mexico, Brazil, and Argentina)
  • Detailed Analysis And Profiling Of Additional Market Players (Up To 3)

Previous Versions of this Report

"Our USP is "providing game-changing business opportunities reports with free customization" - so please feel free to provide us with your specific areas of interest / business challenges in much greater detail !!"

We appreciate your interest in this report. Once you fill out the form, you'll be immediately directed to an exclusive solution tailored to your needs. This high-value offering can help boost your revenue by 30% - a must-see opportunity for anyone looking to maximize growth.


By clicking the "Submit" button, you are agreeing to the Terms of Use and Privacy Policy.

Custom Market Research Services

We Will Customise The Research For You, In Case The Report Listed Above Does Not Meet With Your Requirements

Get 10% Free Customisation

Growth opportunities and latent adjacency in Electric Tractor Market

DMCA.com Protection Status