7500+ companies worldwide approach us every year for their revenue growth initiatives
2
80% of Fortune 2000 companies rely on our research to identify new revenue sources
3
Top 2000 strategists around the world rely on us for their growth roadmap/initiatives
Doors & Windows Market by product ( Doors, Windows), Construction type (Swinging, Sliding, Folding, Revolving), Material (Wood, Metal, Plastic), End-use industries (Residential, Commercial, Industrial), and Region - Global Forecast to 2029
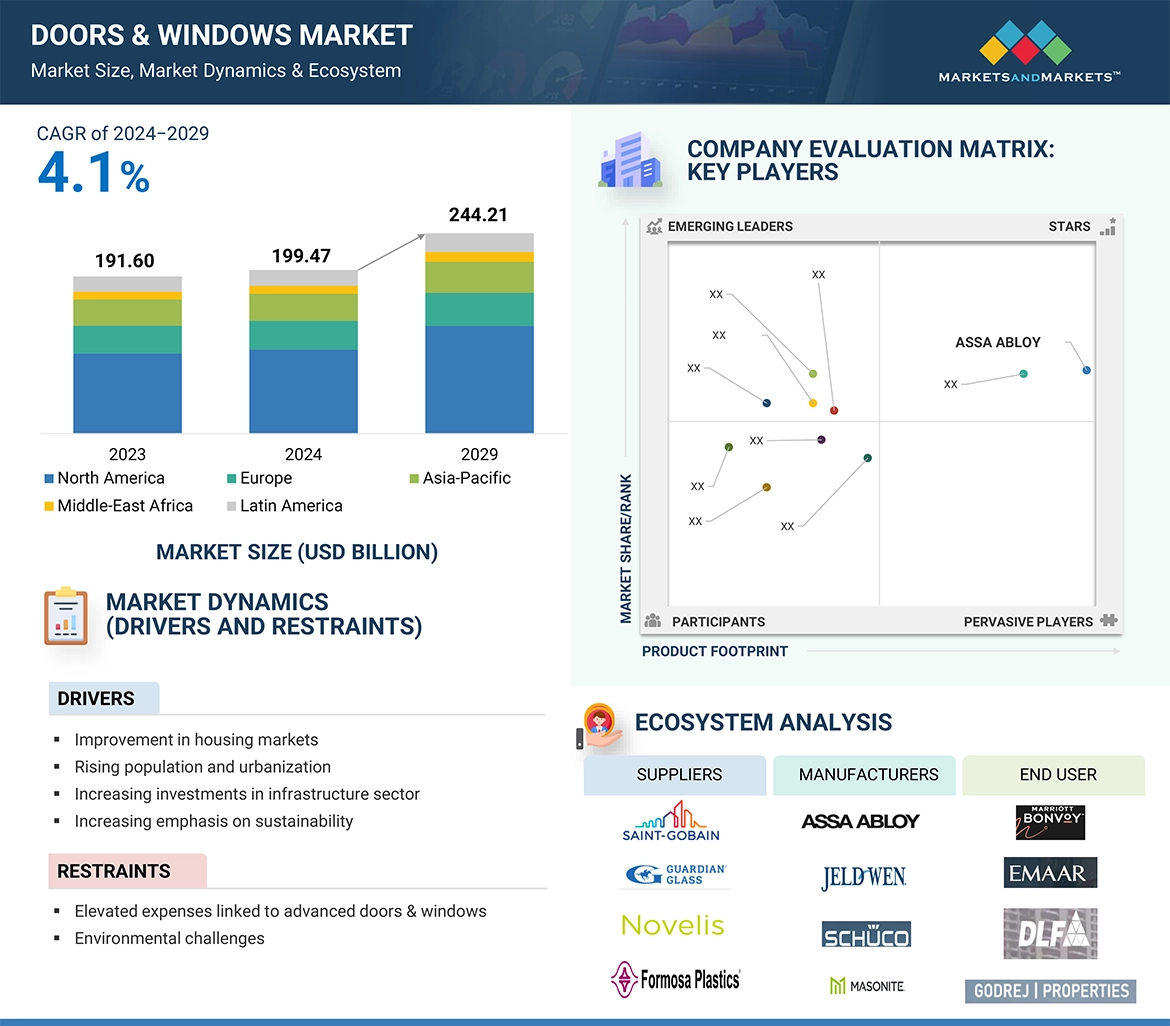
The Doors & Windows Market was valued at USD 199.47 billion in 2024 and is projected to reach USD 244.21 billion by 2029, growing at 4.1% cagr from 2024 to 2029. The market is predicted to grow at a fast pace on the global level due to the rising demand from the residential, commercial, and industrial sectors. These sectors increasingly rely on energy efficient solutions, smart solutions that in turn drives the demand of doors & windows. With increased employment and living standards in the urban areas, there is increased construction of residential buildings, commercial places and other public structures which results in significantly boosting the demand for high-quality, durable, and aesthetically pleasing building materials including doors & windows.
Attractive Opportunities in the Doors & Windows Market
Asia Pacific
The doors & windows market in the Asia Pacific is experiencing robust growth driven by expanding population and urbanization, improvement in the housing market, increasing investments in the infrastructure sector, and increasing emphasis on sustainability
Market growth is attributed to the increasing demand for doors & windows from the residential, commercial, and industrial sectors in emerging economies such as China and India
Market growth is attributed to the increasing demand for doors & windows from the residential, commercial, and industrial sectors in emerging economies such as China and India
A significant industry trend during the forecast period is likely to be substantial investment in R&D aimed at creating new recyclable products.
Global Doors & Windows Market Dynamics
DRIVER: Improvement in the Housing Market
If the housing markets are improving, the doors & windows market greatly because there are more opportunities for new projects as well as refurbishing projects. This is because as housing markets get stronger, with more home sales, new builds and rising property values, the demand for doors & windows also grows. New housing development require many doors & windows and homeowners are more likely to upgrade their homes leading to increased renovation projects. This leads to a higher need for different doors and windows, from basic models to high-quality, energy-efficient choices.
Since more and more people focus on energy efficiency and sustainability when it comes to buying a home or owning a house, the need for modem energy-saving doors & windows increases. Better housing markets mean compliance with higher standards and a focus on sustainable materials, which also enhances the demand for hi-performing doors & windows. This trend is especially evident in regions with a high rate of urbanization or where smart home solutions are gradually gaining popularity, as such markets require products that are not only functional but also energy-efficient, which contributes to the growth of the doors & windows market.
The National Association of Home Builders said that the survey for August revealed that more builders are trimming their prices to increase home sales, with 33% of in August compared with 31% in July and 29% in June. Such reductions in prices could lead to higher sales of homes since more people would be interested in the homes due to their cheaper prices. Consequently, the demand for doors & windows would rise since these essential components are needed for new homes.
RESTRAINT: Elevated Expenses Linked to Advanced Doors & Windows And Environmental Challenges
One of the key challenges that come with energy-efficient and high-tech doors & windows is their high cost which can be a bug hurdle for people with limited financial means especially from the developing countries. Additional options doors & windows with features like special glass and smart technology are typically more expensive than basic ones. This can be a disadvantage since the initial cost is relatively high, which may discourage individuals who cannot afford such costly products. Thus, the benefits that these new technologies offer may not be accessible to as many people as expected. Furthermore, it is also important to note that Installing these advanced products requires professional help, which adds to the expense. These advanced products need professional help for installation and this increases the overall cost. Another disadvantage of high-tech systems is that their maintenance and repairs can be very expensive. These additional costs can be a significant barrier to entry for some people, especially those who are on a tighter budget. As a result, the high price of advanced doors & windows can limit their adoption to more affluent buyers.
The production of materials like PVC for doors & windows can have negative impacts on the environment. PVC can emit toxic substances during its production as well as during the process of its disposal. Due to these environmental impacts, there are tendencies of having increased regulatory measures to control the impacts. Manufacturers may incur higher costs and face some rigid regulations to meet the requirements, which sometimes means changing to other, less hazardous, materials. The disposal and recycling of old doors and windows are also issues that have an impact on the environment. Traditional materials are often difficult to recycle and may be disposed of in a landfill, increasing waste and pollution. Since there is an increasing focus on sustainability, the industry needs to come up with more effective solutions for recycling or reusing the old materials. This focus on sustainability requires a lot of capital and research, which puts pressure on manufacturers to use more environmentally friendly materials and recycling processes to meet new environmental standards.
OPPORTUNITY: Increasing Demands from Emerging Markets
Countries like India, China, Brazil, and Nigeria are witnessing major economic growth, which is increasing the need for new homes and office buildings. As these countries expand, their cities are growing quickly, creating a high demand for construction. For example, cities in India like Mumbai and Bangalore are seeing a lot of new building projects because more people are moving into the middle class and have more disposable income. This drives the need for different types of doors & windows for new buildings and renovations.
According to the India Brand Equity Foundation (IBEF), by 2040, India's real estate market is expected to reach USD 9.30 billion (INR 65,000 crore), up from USD 1.72 billion (INR 12,000 crore) in 2019. The sector is estimated to generate USD 1 trillion by 2030, up from USD 200 billion in 2021, and to contribute 13% of the country's GDP by 2025. Retail, hospitality, and commercial real estate are all fast developing to meet India's burgeoning infrastructural demands. Furthermore, by 2047, India's real estate sector is expected to reach USD 5.8 trillion, increasing its GDP contribution to 15.5% from 7.3% today. The expansion of the real estate sector in India will drive a surge in residential, commercial, and hospitality construction projects, all of which require extensive quantities of doors & windows, which will further drive the market.
China is experiencing even faster urbanization with big construction projects in cities like Shanghai and Shenzhen. The focus on improving living standards and building modern infrastructure is increasing the demand for high-quality, energy-efficient doors & windows. Cities in Brazil, such as São Paulo and Rio de Janeiro, are seeing more real estate development and renovations, which boosts the need for both basic and high-end doors & windows. Thus, the growth in these emerging economies is driving the need for doors & windows.
CHALLENGES: Challenges in the Supply Chain
The doors & windows market relies on a global supply chain to get the raw materials it needs. This chain includes several steps, from extracting materials like aluminum and glass to making and delivering the final products. Disruptions such as geopolitical conflicts, pandemics, or natural disasters can seriously affect production and increase costs. Political issues, for example, may result in taxes or trade restrictions, increasing the cost or difficulty of obtaining resources. Natural catastrophes can devastate industries and restrict transportation, causing delays in delivering goods to clients. The COVID-19 pandemic showed how these disruptions could impact the market. Many factories were compelled to close or reduce operations due to health laws, resulting in material shortages and production delays. Transportation delays and increasing demand for specific commodities led to higher prices and longer product wait times. Companies have to recruit new suppliers and manage their.
Global Doors & Windows Market Ecosystem Analysis
The analysis of the doors and windows market ecosystem requires a critical examination of the major players in the system and their interactions with one another within the value chain. The foundation of this ecosystem is the basic material suppliers who offer products such as woods, metals, glasses, vinyls, and composites that are vital in the construction of sturdy and efficient doors and windows. These raw materials are then used by doors and windows manufacturers who develop, manufacture and install a range of products and types of doors and windows for use in homes, businesses and industries. The last part of the ecosystem is primarily the end-use segment which includes homeowners, construction firms, real estate developers, infrastructure projects, and other consumers who demand products based on factors such as beauty, efficiency, security, and sustainability. Analyzing the interrelationships between these factors allows for the definition of market developments, supply chain optimization, and potential development in the doors & windows field.
Windows is projected to be the fastest-growing product segment of the doors & windows market.
Windows is the leading and fastest growing product segment in the doors & windows market format. The dominance is due to the outstanding characteristics of windows, which provide energy efficiency, technological incorporation, and enhanced aesthetics, among other distinct functionalities when in use.Windows are openings in a building's walls that allow light, air, and views between the interior and exterior. They enhance the aesthetic attractiveness of a structure and are composed of wood, aluminum, vinyl, fiberglass, or glass. They come in a variety of designs, making them suitable for residential, commercial, and industrial purposes. Advanced windows include smart glass that adjusts transparency, triple glazing for exceptional insulation and noise reduction, low-E coatings that balance heat reflection and light entry, durable fiberglass and composite frames, integrated solar panels, automated remote control systems, and self-cleaning glass to provide energy-efficient, comfortable, and sustainable solutions for residential, commercial, and industrial buildings. Windows are so popular because of the demand for energy-efficient solutions, such as low E glass, thermal break frames, double and triple glazing, and the usage of smart glass technology, which has boosted the expansion of the window segment.
Pella Corporation's Insynctive technology integrates motorized blinds, shades, and security sensors into windows, allowing remote control and monitoring via the Insynctive App. This system provides convenience and security while preserving aesthetics. These innovations collectively enhance comfort, sustainability, and convenience in modern windows.
Plastic is projected to be the fastest-growing material segment in the Doors & windows market.
Plastic is predicted to be the most rapidly developing material type in the doors and windows market. Plastic has grown in popularity as a material for doors and windows due to its durability, low cost, and versatility. As the construction industry evolves, plastic materials, particularly uPVC (unplasticized polyvinyl chloride) and polyvinyl chloride (PVC), gain favor in both residential and commercial applications. These doors are easier to handle and require less maintenance and hardware or components than other types of doors and windows due to their small weight. Plastic in doors and windows is growing due to its affordability, durability, and versatility, providing energy efficiency, low maintenance, and a wide range of design alternatives for varied architectural needs. These doors are easier to handle and require less maintenance and hardware or components than other types of doors and windows due to their small weight. Plastic's popularity in doors and windows is driven by its affordability, durability, and versatility, as well as its energy efficiency, minimal maintenance, and wide range of design alternatives to meet a variety of architectural requirements. LIXIL Corporation, YKK AP Inc., Cornerstone Building Brands, Inc., Andersen Corporation, PGT Innovations, JELD-WEN, Inc., and Pella Corporation are some of the major manufacturers of plastic (Vinyl) doors & windows. For example, Ply Gem, a member of Cornerstone Building Brands, Inc., offers Perspective, the brand's most advanced multi-slide vinyl patio door. This unique, undetectable T-lock design achieves high performance, high-velocity hurricane zone, and Missile D impact resistance ratings while defending against extreme weather.
Asia Pacific is estimated to be the fastest-growing region in the doors & windows market.
The Asia Pacific region is estimated to be the fastest-growing in the doors & windows market. The growth is largely because of the booming population and urbanization in the region and growing demand from residential, commercial, and industrial sectors. Asia Pacific includes China, Japan, India, South Korea, and the Rest of Asia Pacific. According to the United Nations Population Fund, the Asia Pacific region, which includes large nations like China and India, accounts for 60% of the world's population, or 4.7 billion people. Rapid urbanization, driven by population expansion and migration to metropolitan areas, has increased demand for residential and commercial building. As more buildings are constructed, the need for doors and windows, which are key components of these structures, grows significantly. China and India are the main sources of this demand. In China, government initiatives aimed at urban renewal and modernization are driving significant expansion in the construction of high-rise residences, commercial complexes, and public infrastructure. Similarly, India's "Housing for All" program and smart city initiatives are increasing the demand for new doors and windows.The International Monetary Fund (IMF) predicts that China, Japan, and India will be the world's second, fourth, and fifth largest economies in 2024. Economic expansion raises disposable earnings, allowing consumers to spend in higher-quality, more aesthetically pleasing doors and windows. Furthermore, the expansion of commercial and industrial sectors in these economies drives the demand for durable and efficient doors & windows to meet the requirements of modern facilities and offices. This growth in the doors & windows market is led by China, India, and Japan due to the large consumer markets as well as for having presence of key doors & windows manufacturers. Therefore, the Asia Pacific region is establishing itself as an important market for global production and consumption of doors & windows and is expected to continue its growth throughout forecast period.
HIGHEST CAGR MARKET IN 2024-2029
ASIA PACIFIC FASTEST GROWING MARKET IN THE REGION
Recent Developments of Doors & Windows Market
In January 2025 ASSA ABLOY has acquired 3millID and Third Millennium, two companies specializing in physical access control readers and credentials. 3millID is based in the US, while Third Millennium is based in the UK. The acquisition is expected to strengthen ASSA ABLOY's position in the physical access control industry and expand its technology portfolio.
In December 2024, ASSA ABLOY has successfully acquired Norshield Security Products, a US-based manufacturer specializing in high-security openings and enclosures. This acquisition aligns with ASSA ABLOY's strategy to enhance its offerings in mature markets by integrating complementary products into its existing portfolio.
In December 2024, ASSA ABLOY has acquired Premier Steel Doors and Frames, a US manufacturer specializing in hollow metal doors and frames, as well as metal building door systems and aluminum windows. This acquisition, announced on marks a strategic move for ASSA ABLOY to enhance its product offerings and strengthen its market presence, particularly in the southern United States.
In May 2024, YKK AP Inc. and Kandenko Co., Ltd. formed a commercial alliance to enhance Building Integrated Photovoltaics (BIPV). This cooperation seeks to integrate renewable energy solutions into commercial building windows and walls, with a focus on carbon neutrality. The agreement will include demonstration testing with perovskite solar cells and other technologies.
North America, Europe, Asia Pacific, Middle East & Africa, Latin America
Key Questions Addressed by the Report
What primary factor is propelling the growth of the doors & windows market?
The primary factors propelling the growth of the doors & windows market include improvement in the housing market, rising population and urbanization, and increasing investments in the infrastructure sector and sustainability.
How is the Doors & Windows market segmented in terms of applications?
The doors & windows market is segmented into Product, Construction Type, Material, End-use industry, and Region.
What are the major challenges in the Doors & Windows market?
Elevated expenses in the advanced doors & windows are the major challenge in the release liners market.
What are the major opportunities in the Doors & Windows market?
Growing demand from emerging markets, growth in retrofit & renovation projects, and zero-carbon retrofitting provide lucrative opportunities for the doors & windows market over the next five years.
Which region has the largest demand?
The Asia Pacific (APAC) region stands out with the highest demand for Doors & Windows.
Who are the major manufacturers of Doors & Windows?
Major players in the Doors & Windows ASSA ABLOY (Sweden), LIXIL Corporation (Japan), Cornerstone Building Brands, Inc. (US), JELD-WEN, Inc. (US), YKK AP Inc. (Japan), Masonite (US), PELLA CORPORATION (US), Schüco International KG (Germany), ANDERSEN CORPORATION (US), and PGT INNOVATIONS (US) among others.
###############################
The study involved four major activities for estimating the current size of the global doors & windows market. Exhaustive secondary research was conducted to collect information on the market, the peer product market, and the parent product group market. The next step was to validate these findings, assumptions, and sizes with the industry experts across the value chain of doors & windows through primary research. Both the top-down and bottom-up approaches were employed to estimate the overall size of the doors & windows market. After that, market breakdown and data triangulation procedures were used to determine the size of different segments and sub-segments of the market.
Secondary Research
The market for the companies offering doors & windows is arrived at by secondary data available through paid and unpaid sources, analyzing the product portfolios of the major companies in the ecosystem, and rating the companies by their performance and quality. Various secondary sources such as Business Standard, Bloomberg, World Bank, and Factiva were referred to, to identify and collect information for this study on the doors & windows market. The secondary sources include annual reports, press releases, investor presentations of companies, white papers, journals, certified publications, and articles from recognized authors, directories, and databases. In the secondary research process, various secondary sources were referred to for identifying and collecting information related to the study. Secondary sources included annual reports, press releases, and investor presentations of doors & windows vendors, forums, certified publications, and whitepapers. The secondary research was used to obtain critical information on the industry’s value chain, the total pool of key players, market classification, and segmentation from the market and technology-oriented perspectives.
Primary Research
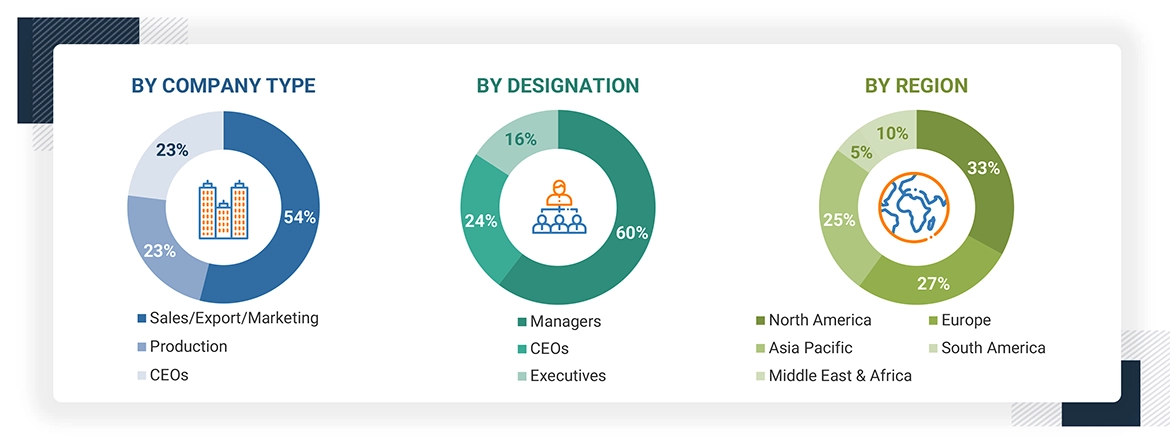
In the primary research process, various primary sources from both the supply and demand sides were interviewed to obtain qualitative and quantitative information for this report. The primary sources from the supply side included industry experts, such as Chief Executive Officers (CEOs), Vice Presidents (VPs), marketing directors, technology and innovation directors, and related key executives from various key companies and organizations operating in the doors & windows market. After the complete market engineering (calculations for market statistics, market breakdown, market size estimations, market forecasting, and data triangulation), extensive primary research was conducted to gather information and verify and validate the critical numbers arrived at. Primary research was also conducted to identify the segmentation types, industry trends, competitive landscape of doors & windows offered by various market players, and key market dynamics, such as drivers, restraints, opportunities, challenges, industry trends, and key player strategies. In the complete market engineering process, the top-down and bottom-up approaches were extensively used, along with several data triangulation methods, to perform the market estimation and market forecasting for the overall market segments and subsegments listed in this report. Extensive qualitative and quantitative analysis was performed on the complete market engineering process to list the key information/insights throughout the report.
Following is the breakdown of primary respondents—
The bottom-up and top-down approaches have been used to estimate the doors & windows market by product, material, construction type, end-use industry, and region. The research methodology used to calculate the market size includes the following steps:
The bottom-up and top-down approaches have been used to estimate the doors & windows market by product, material, construction type, end-use industry, and region. The research methodology used to calculate the market size includes the following steps:
The key players of each type in the doors & windows market have been identified through secondary research, and their revenues have been determined through primary and secondary research.
The size of the doors & windows market has been derived from the aggregation of the market shares of the leading players in each form, and the forecast is based on an analysis of market trends, such as pricing and consumption of doors & windows in end-use.
The market size of doors & windows based on region has been calculated using the market sizes of each type in each end-use sector.
The market size for doors & windows for each product, in terms of value, has been calculated by multiplying the average price of the product in terms of volume.
The following figure illustrates the overall market size estimation process employed for this study.
Data Triangulation
After arriving at the total market size from the estimation process explained above, the overall market was split into segments. The data triangulation and market breakdown procedures were employed, wherever applicable, to complete the overall market engineering process and arrive at the exact statistics for all segments and subsegments.
The data was triangulated by studying various factors and trends from both the demand and supply sides. Along with this, the market size was validated by using both the top-down and bottom-up approaches. It was later verified through primary interviews. Hence, there are three sources for every data segment: a top-down approach, a bottom-up approach, and expert interviews. The data were assumed to be correct when the values arrived at from the three sources matched.
Market Definition
Doors and windows are vital architectural elements that serve both functional and aesthetic purposes in buildings and structures. Typically composed of wood, metal, or plastic, and available in a variety of construction types such as swinging, sliding, folding, revolving, and others, each with unique functionality. A door is a movable structure that provides access and exit into a specific space. The major purpose of this barrier is to manage access while also offering security, privacy, and convenience. Windows, on the other hand, are openings in a building's walls that allow for natural light, ventilation, and outside views. Doors and windows play critical roles in residential, commercial, and industrial areas, providing security, privacy, and convenience while allowing natural light, ventilation, and sound to penetrate the intended surface.
Stakeholders
Manufacturers of Doors & Windows
Raw Material Suppliers
Door & Window Component Distributors/Suppliers
Manufacturers in Residential, Commercial, and Industrial Applications
Research Organizations
Industry Associations
Regulatory Bodies
Government and Research Organizations
Report Objectives
To define, describe, and forecast the size of the global doors & windows market in terms of value and volume based on material, construction type, product, end-use industry, and region
To provide detailed information on the major factors influencing the growth of the doors & windows market (such as drivers, restraints, opportunities, and challenges)
To strategically analyze micromarkets1 with respective to individual growth trends, prospects, and their contribution to the total market
To analyze the growth opportunities in the market for stakeholders and provide details on the competitive landscape for market leaders
To forecast the market size of the segments and submarkets, in terms of value and volume, in the key regions (North America, Europe, Asia Pacific, South America, and the Middle East & Africa)
To strategically profile the key players and comprehensively analyze their market shares and core competencies
To analyze competitive developments such as acquisitions, product launches, expansions, and agreements in the doors & windows market.
Personalize This Research
Triangulate with your Own Data
Get Data as per your Format and Definition
Gain a Deeper Dive on a Specific Application, Geography, Customer or Competitor
FIGURE 6 DOORS & WINDOWS MARKET: DATA TRIANGULATION
FIGURE 7 WINDOWS TO DOMINATE MARKET DURING FORECAST PERIOD
FIGURE 8 SWINGING DOORS & WINDOWS SEGMENT TO DOMINATE MARKET IN 2029
FIGURE 9 METAL SEGMENT TO ACCOUNT FOR LARGEST MARKET SIZE IN 2024
FIGURE 10 RESIDENTIAL SEGMENT TO REGISTER HIGHEST GROWTH DURING FORECAST PERIOD
FIGURE 11 ASIA PACIFIC ACCOUNTED FOR LARGEST MARKET SHARE IN 2023
FIGURE 12 RISING POPULATION AND URBANIZATION TO DRIVE MARKET
FIGURE 13 WINDOWS TO LEAD DOORS & WINDOWS MARKET DURING FORECAST PERIOD
FIGURE 14 SLIDING DOORS & WINDOWS TO REGISTER HIGHEST GROWTH DURING FORECAST PERIOD
FIGURE 15 PLASTIC TO REGISTER HIGHEST GROWTH DURING FORECAST PERIOD
FIGURE 16 RESIDENTIAL SEGMENT TO DOMINATE MARKET IN 2024
FIGURE 17 RESIDENTIAL SEGMENT ACCOUNTED FOR LARGEST SHARE OFASIA PACIFIC MARKET IN 2023
FIGURE 18 INDIA TO REGISTER HIGHEST GROWTH DURING FORECAST PERIOD
FIGURE 19 DOORS & WINDOWS MARKET: DRIVERS, RESTRAINTS, OPPORTUNITIES, AND CHALLENGES
FIGURE 20 URBAN POPULATION TREND (1999–2030)
FIGURE 21 ANNUAL GROWTH RATE FOR INDUSTRY (INCLUDING CONSTRUCTION)
FIGURE 22 BUILDINGS 200 METERS OR TALLER COMPLETED IN 2022, BY REGION
FIGURE 23 TRENDS AND DISRUPTIONS IMPACTING CUSTOMER BUSINESS
FIGURE 24 AVERAGE SELLING PRICE OF DOORS, BY REGION (USD/SQUARE METER)
FIGURE 25 AVERAGE SELLING PRICE OF WINDOWS, BY REGION (USD/SQUARE METER)
FIGURE 26 AVERAGE SELLING PRICE OF DOORS & WINDOWS, BY KEY PLAYER (USD/KG)
FIGURE 27 DOORS & WINDOWS MARKET: PORTER’S FIVE FORCES ANALYSIS
FIGURE 28 INFLUENCE OF STAKEHOLDERS ON BUYING PROCESS FOR TOP TWO VERTICALS
FIGURE 29 KEY BUYING CRITERIA FOR TOP TWO VERTICALS
FIGURE 30 DOORS & WINDOWS MARKET: VALUE CHAIN ANALYSIS
FIGURE 31 DOORS & WINDOWS MARKET: KEY PLAYERS IN ECOSYSTEM
FIGURE 32 EXPORT OF DOORS & WINDOWS, BY KEY COUNTRY, 2019–2023 (USD MILLION)
FIGURE 33 IMPORT OF DOORS & WINDOWS, BY KEY COUNTRY, 2019–2023 (USD MILLION)
FIGURE 34 LIST OF SIGNIFICANT PATENTS FOR DOORS & WINDOWS MARKET, 2013–2024
FIGURE 35 UNITED STATES: WOOD PRODUCTION, 2017–2023 (MILLION TONS)
FIGURE 36 INVESTOR DEALS & FUNDING IN DOORS & WINDOWS MARKET
FIGURE 37 WINDOWS SEGMENT TO REGISTER HIGHEST GROWTH DURING FORECAST PERIOD
FIGURE 38 SWINGING DOORS & WINDOWS SEGMENT TO ACCOUNT FOR LARGEST MARKET SIZE IN 2024
FIGURE 39 PLASTIC SEGMENT TO REGISTER HIGHEST GROWTH DURING FORECAST PERIOD
FIGURE 40 RESIDENTIAL INDUSTRY TO DOMINATE MARKET IN 2024
FIGURE 41 DOORS & WINDOWS MARKET: GROWTH RATE, BY COUNTRY, 2024–2029
FIGURE 42 ASIA PACIFIC: DOORS & WINDOWS MARKET SNAPSHOT
FIGURE 43 NORTH AMERICA: DOORS & WINDOWS MARKET SNAPSHOT
FIGURE 44 DOORS & WINDOWS MARKET SHARE ANALYSIS, 2023
FIGURE 45 DOORS & WINDOWS MARKET: REVENUE ANALYSIS OF KEY PLAYERS, 2019–2023 (USD BILLION)
FIGURE 46 COMPANY VALUATION, 2024 (USD BILLION)
FIGURE 47 FINANCIAL MATRIX: EV/EBITDA RATIO, 2024
FIGURE 48 PRODUCT/BRAND COMPARISON
FIGURE 49 DOORS & WINDOWS MARKET: COMPANY EVALUATION MATRIX (KEY PLAYERS), 2023
FIGURE 50 DOORS & WINDOWS MARKET: COMPANY FOOTPRINT
FIGURE 51 DOORS & WINDOWS MARKET: COMPANY EVALUATION MATRIX (STARTUPS/SMES), 2023
FIGURE 52 ASSA ABLOY: COMPANY SNAPSHOT (2023)
FIGURE 53 LIXIL CORPORATION: COMPANY SNAPSHOT (2023)
FIGURE 54 CORNERSTONE BUILDING BRANDS, INC.: COMPANY SNAPSHOT (2023)
FIGURE 55 JELD-WEN, INC.: COMPANY SNAPSHOT (2023)
FIGURE 56 MASONITE: COMPANY SNAPSHOT (2023)
The study involved four major activities for estimating the current size of the global doors & windows market. Exhaustive secondary research was conducted to collect information on the market, the peer product market, and the parent product group market. The next step was to validate these findings, assumptions, and sizes with the industry experts across the value chain of doors & windows through primary research. Both the top-down and bottom-up approaches were employed to estimate the overall size of the doors & windows market. After that, market breakdown and data triangulation procedures were used to determine the size of different segments and sub-segments of the market.
Secondary Research
The market for the companies offering doors & windows is arrived at by secondary data available through paid and unpaid sources, analyzing the product portfolios of the major companies in the ecosystem, and rating the companies by their performance and quality. Various secondary sources such as Business Standard, Bloomberg, World Bank, and Factiva were referred to, to identify and collect information for this study on the doors & windows market. The secondary sources include annual reports, press releases, investor presentations of companies, white papers, journals, certified publications, and articles from recognized authors, directories, and databases. In the secondary research process, various secondary sources were referred to for identifying and collecting information related to the study. Secondary sources included annual reports, press releases, and investor presentations of doors & windows vendors, forums, certified publications, and whitepapers. The secondary research was used to obtain critical information on the industry’s value chain, the total pool of key players, market classification, and segmentation from the market and technology-oriented perspectives.
Primary Research
In the primary research process, various primary sources from both the supply and demand sides were interviewed to obtain qualitative and quantitative information for this report. The primary sources from the supply side included industry experts, such as Chief Executive Officers (CEOs), Vice Presidents (VPs), marketing directors, technology and innovation directors, and related key executives from various key companies and organizations operating in the doors & windows market. After the complete market engineering (calculations for market statistics, market breakdown, market size estimations, market forecasting, and data triangulation), extensive primary research was conducted to gather information and verify and validate the critical numbers arrived at. Primary research was also conducted to identify the segmentation types, industry trends, competitive landscape of doors & windows offered by various market players, and key market dynamics, such as drivers, restraints, opportunities, challenges, industry trends, and key player strategies. In the complete market engineering process, the top-down and bottom-up approaches were extensively used, along with several data triangulation methods, to perform the market estimation and market forecasting for the overall market segments and subsegments listed in this report. Extensive qualitative and quantitative analysis was performed on the complete market engineering process to list the key information/insights throughout the report.
Following is the breakdown of primary respondents—
The bottom-up and top-down approaches have been used to estimate the doors & windows market by product, material, construction type, end-use industry, and region. The research methodology used to calculate the market size includes the following steps:
The bottom-up and top-down approaches have been used to estimate the doors & windows market by product, material, construction type, end-use industry, and region. The research methodology used to calculate the market size includes the following steps:
The key players of each type in the doors & windows market have been identified through secondary research, and their revenues have been determined through primary and secondary research.
The size of the doors & windows market has been derived from the aggregation of the market shares of the leading players in each form, and the forecast is based on an analysis of market trends, such as pricing and consumption of doors & windows in end-use.
The market size of doors & windows based on region has been calculated using the market sizes of each type in each end-use sector.
The market size for doors & windows for each product, in terms of value, has been calculated by multiplying the average price of the product in terms of volume.
The following figure illustrates the overall market size estimation process employed for this study.
Data Triangulation
After arriving at the total market size from the estimation process explained above, the overall market was split into segments. The data triangulation and market breakdown procedures were employed, wherever applicable, to complete the overall market engineering process and arrive at the exact statistics for all segments and subsegments.
The data was triangulated by studying various factors and trends from both the demand and supply sides. Along with this, the market size was validated by using both the top-down and bottom-up approaches. It was later verified through primary interviews. Hence, there are three sources for every data segment: a top-down approach, a bottom-up approach, and expert interviews. The data were assumed to be correct when the values arrived at from the three sources matched.
Market Definition
Doors and windows are vital architectural elements that serve both functional and aesthetic purposes in buildings and structures. Typically composed of wood, metal, or plastic, and available in a variety of construction types such as swinging, sliding, folding, revolving, and others, each with unique functionality. A door is a movable structure that provides access and exit into a specific space. The major purpose of this barrier is to manage access while also offering security, privacy, and convenience. Windows, on the other hand, are openings in a building's walls that allow for natural light, ventilation, and outside views. Doors and windows play critical roles in residential, commercial, and industrial areas, providing security, privacy, and convenience while allowing natural light, ventilation, and sound to penetrate the intended surface.
Stakeholders
Manufacturers of Doors & Windows
Raw Material Suppliers
Door & Window Component Distributors/Suppliers
Manufacturers in Residential, Commercial, and Industrial Applications
Research Organizations
Industry Associations
Regulatory Bodies
Government and Research Organizations
Report Objectives
To define, describe, and forecast the size of the global doors & windows market in terms of value and volume based on material, construction type, product, end-use industry, and region
To provide detailed information on the major factors influencing the growth of the doors & windows market (such as drivers, restraints, opportunities, and challenges)
To strategically analyze micromarkets1 with respective to individual growth trends, prospects, and their contribution to the total market
To analyze the growth opportunities in the market for stakeholders and provide details on the competitive landscape for market leaders
To forecast the market size of the segments and submarkets, in terms of value and volume, in the key regions (North America, Europe, Asia Pacific, South America, and the Middle East & Africa)
To strategically profile the key players and comprehensively analyze their market shares and core competencies
To analyze competitive developments such as acquisitions, product launches, expansions, and agreements in the doors & windows market.
Previous Versions of this Report
Custom Market Research Services
We Will Customise The Research For You, In Case The Report Listed Above Does Not Meet With Your Requirements


 HIGHEST CAGR MARKET IN 2024-2029
 ASIA PACIFIC FASTEST GROWING MARKET IN THE REGION
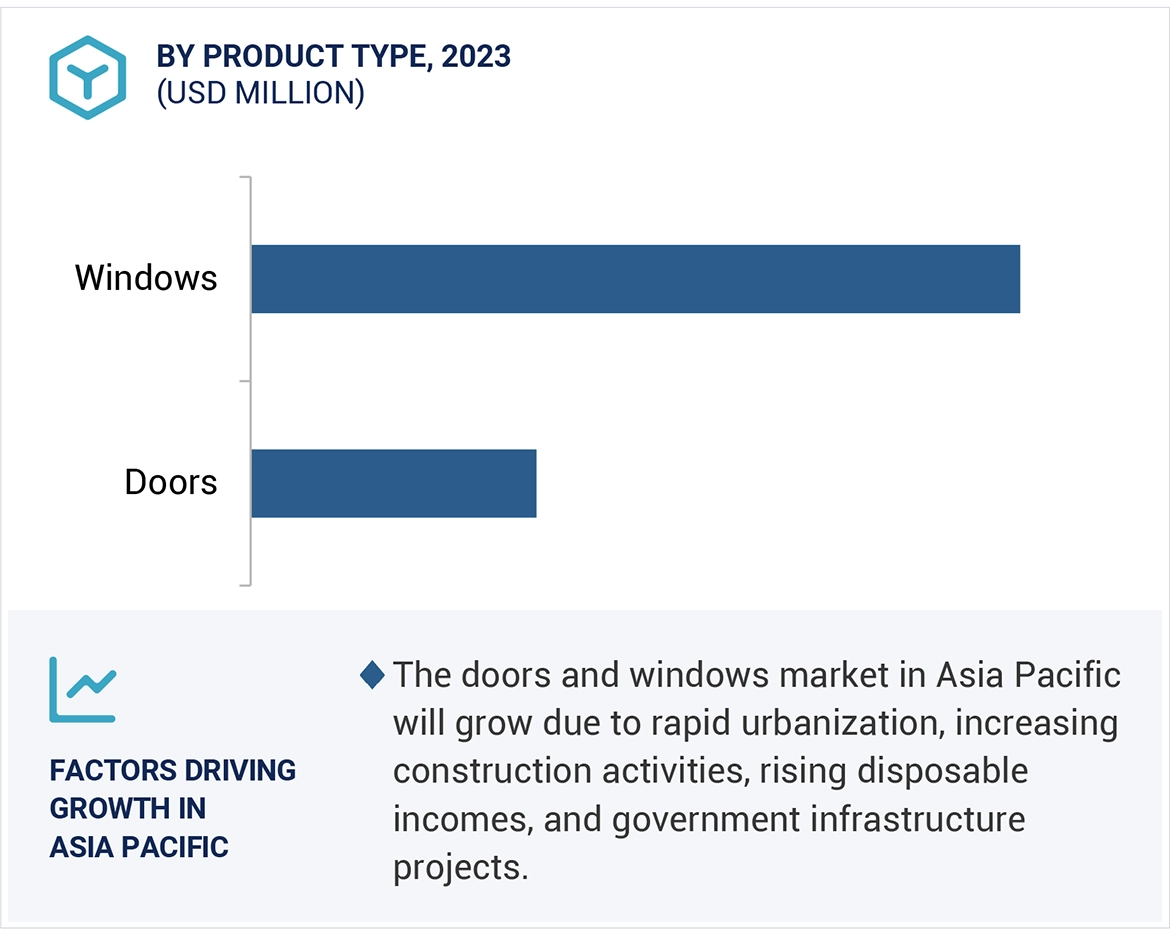


Growth opportunities and latent adjacency in Doors & Windows Market