Display Market

Display Market Size, Share & Industry Growth Analysis Report by Display Technology (LCD, OLED, Micro-LED, Direct-view LED), Panel Size (Microdisplays, Small & Medium-sized Panels, Large Panels), Product Type (Smartphones, Television Sets, Wearables), Vertical, and Region- Global Forecast to 2028

Report Code: SE 3387 May, 2023, by marketsandmarkets.com

[280 Pages Report] The global display market size is projected to reach USD 187.8 billion by 2028 from USD 157.8 billion in 2023 at a CAGR of 3.5% during the forecast period. Surging adoption of OLED displays in various applications, increasing demand for displays in the automotive and healthcare industries, increasing use of LED displays video walls, TVs, and digital signage applications, and growing popularity of interactive displays are some of the major factors driving the market growth globally.

Display Market

Display Market Statistics

Display Market Statistics Forecast to 2028

To know about the assumptions considered for the study, Request for Free Sample Report

Global Display Market Dynamics

Driver: Increasing use of LED displays for video walls, TVs, and digital signage applications

LED technology uses light emitting diodes to create lighting solutions, displays, and other applications. The technology is used in a wide range of applications, such as smartphones, TVs, video walls, and digital signage. LED displays have become one of the most used display technologies used across various applications and holds a significant share of the market compared to other technologies. While the LED display industry has matured in recent years, there has been a lack of innovation.

However, one recent breakthrough has been the miniaturization of the components required to build an LED screen. This development has enabled LED screens to become incredibly thin and expand to enormous sizes, making them suitable for use on any surface, both indoors and outdoors. Technological advancements, such as improved resolution, increased brightness capabilities, product versatility, and the emergence of durable surface LEDs and micro-LEDs have also contributed to the increase in LED applications, driving the growth of market.

Restraint: Decline in demand for displays in retail sector due to drastic shift toward online advertisement and shopping

The global electronic commerce industry has experienced tremendous growth in recent years, with millions of people engaging in online shopping. Despite initial concerns about security, consumers are increasingly comfortable buying products online due to faster delivery, easy return policies, and free shipping offered by many e-commerce sites. This trend has had a significant impact on the retail sector, with brick-and-mortar stores experiencing a decline in business due to accelerating online sales.

Digital advertising offers more sophisticated and personalized options for reaching multi-device, multi-channel consumers who spend more time online than before. As a result, the demand for displays in commercial and retail settings has significantly decreased as businesses shift their advertising focus toward online channels.

Opportunity: Micro-LED and mini-LED technologies to carve out new growth avenues for display industry

Micro-LED and Mini-LED technologies are expected to create new opportunities for the display market. Both technologies are designed to provide better picture quality, higher brightness, and greater energy efficiency than existing display technologies such as LCD and OLED. Micro-LED technology can be used for a wide range of applications, such as televisions, smartphones, and wearables.

Micro-LED displays are a next-generation technology that utilizes small, self-emitting LEDs that are less than 100 micrometers in size. Compared to conventional display technologies, they offer several benefits such as improved color accuracy, higher contrast, and faster response times. Additionally, micro-LED displays are more power-efficient and can be used in various applications, including smartphones, laptops, AR/VR devices, and large digital signage. These advantages make micro-LED displays a promising technology, with the potential to revolutionize the display industry.

Challenge: High costs associated with new display technology-based products

In recent years, the display market has been greatly impacted by the consistently decreasing prices of LCD panels. Although there are newer technologies such as micro-LED and quantum dot displays that are more expensive compared to established technologies like LED-LCD. Currently, the prices of LCD panels are lower than OLED panels, which is a result of increased demand for OLED displays from smartphones, smart wearables, and TV manufacturers. Typically, when a new technology is introduced, manufacturers charge a premium, which pushes prices upward and can limit the growth of that market. This, ultimately, has an adverse impact on the overall market.

Display Market Ecosystem

The key players in the display market include Samsung Electronics Co., Ltd. (South Korea), BOE Technology Group Co., Ltd. (China), LG Display Co., Ltd. (South Korea), AUO Corporation (Taiwan), and Innolux Corporation (Taiwan). These companies not only boast a comprehensive product portfolio but also have a strong geographic footprint.

Display Market by Ecosystem

Micro-LED to register highest CAGR during the forecast period

Micro-LED displays offer several advantages over traditional LCD displays, including improved energy efficiency, better contrast, and faster response times. Micro-LEDs are a promising technology, with a diverse range of potential applications. Notably, the two most significant areas of implementation lie at the opposite ends of the size spectrum. At one end, wearable devices such as smartwatches and near-to-eye (NTE) devices, which feature minute displays, can greatly benefit from micro-LED technology. Conversely, extremely large indoor public displays represent the other end of the size spectrum that can leverage the unique properties of micro-LEDs.

Consumer electronics to account for the largest share of display market during the forecast period

The consumer segment is expected to continue to account for the largest size of the market during the forecast period. The consumer industry includes products such as smartphones, televisions, smart wearables, PC monitors and laptops, and tablets, all of which have significant shares in the global market. The growing demand for organic light-emitting diode (OLED) and micro-LED displays for devices such as smartphones and television sets due to their thinness, flexibility and vibrant colors is a major factor driving the market growth for consumer electronics.

Smartphones to account for the largest share of display market during the forecast period

The smartphone display market accounted for the largest share in 2022 and is expected to dominate the market during forecast period. The growing adoption of OLED and flexible displays in smartphones is a major factor contributing to the market growth. Furthermore, the volume of flexible OLED display panels has been witnessing a significant growth in recent years, subsequently driving the market growth for smartphones. Furthermore, the rollout of 5G is expected to create a surge in demand for smartphones, thereby, driving the market growth for LCD and OLED displays. Moreover, the increasing adoption of smart wearbles is expected to create growth opportunities for market players offering LCD and OLED display panels.

Display Market Share

Asia Pacific to register the highest growth during the forecast period

Asia Pacific is expected to register the highest CAGR in the display market from 2023 to 2028. Asia Pacific is the largest producer and consumer of displays due to the presence of established display panel and device manufacturers such as Samsung Electronics Co., Ltd. (South Korea), LG Display Co., Ltd. (South Korea), BOE Technology Group Co., Ltd. (China), AUO Corporation (Taiwan), etc. Furthermore, increasing investments by governments and other organizations in retail and education industries is also expected to provide ample growth opportunities for market players in the region.

Display Market Statistics by Region

Display Market Statistics by Region

To know about the assumptions considered for the study, download the pdf brochure

Top Display Companies - Key Market Players

The key players in the display market are Samsung Electronics Co., Ltd. (South Korea), BOE Technology Group Co., Ltd. (China), LG Display Co., Ltd. (South Korea), AUO Corporation (Taiwan), and Innolux Corporation (Taiwan).  These companies have used both organic and inorganic growth strategies such as product launches, collaborations, acquisitions, and partnerships to strengthen their position in the market.

Display Market Report Scope

Report Metric

Details

Estimated Market Size  USD 157.8 billion in 2023
Projected Market Size USD 187.8 billion by 2028
Display Market Growth Rate CAGR of 3.5%

Display Market size available for years

2019–2028

Base year considered

2022

Forecast period

2023–2028

Forecast units

Value (USD Billion)

Segments covered

By Dispay Technology, By Panel Size, By Product Type, By Vertical

Geographies covered

Asia Pacific, North America, Europe, and Rest of the World

Companies covered

The major players in the display market are Samsung Electronics Co., Ltd. (South Korea), BOE Technology Group Co., Ltd. (China), LG Display Co., Ltd. (South Korea), AUO Corporation (Taiwan), Innolux Corporation (Taiwan), Sharp Corporation (Japan), Japan Display Inc. (Japan), Sony Group Corporation (Japan), Leyard Optoelectronic Co Ltd (China), Qisda Corporation (Taiwan), and VIA Optronics AG (Germany).

Display Market Highlights

The study segments the display market based on display technology, panel size, product type, and vertical at the regional and global level.

Segment

Subsegment

By Display Technology

  • LCD
  • OLED
  • Micro-LED
  • Direct-view LED
  • Quantum Dot Displays (QD Displays)
  • Others

By Panel Size

  • Microdisplays
  • Small & Medium-sized Panels
  • Large Panels

By Product Type

  • Smartphones
  • Television Sets
  • Monitors & Laptops
  • Digital Signage & Large Format Displays
  • Automotive Dsiplays
  • Tablets
  • Smart Wearables
  • Others

By Vertical

  • Consumer Electronics
  • Automotive
  • Sports & Entertainment
  • Transportation
  • Retail, Hospitality & BFSI
  • Industrial & Enterprise
  • Education
  • Helathcare
  • Aerospace & Defense
  • Others

By Region

  • North America
  • Europe
  • Asia Pacific
  • Rest of the World

Recent Developments in Display Industry

  • In January 2023, Samsung Electronics Co., Ltd. developed the world’s first touch-integrated OLED display. It started using touch integrated panels in place of plastic touch film. Samsung developed On-Cell Touch AMOLED (OCTA) technology, which integrates the touch sensor directly into the panel, eliminating the need for separate touch screen panels.
  • In December 2022, LG Display Co., Ltd.  launched a 97-inch OLED display panel which offers another level cinematic experience for users due to its large size. In addition, it also launched a 77-inch 8K OLED panel which offers the highest level of resolution by controlling 33 million self-emissive pixels to deliver exceptional ultra-high- resolution images
  • In May 2022, AUO Corporation showcased the world’s first 34-inch AmLED curved gaming display panel with a 21:9 widescreen and a 165Hz ultra-high refresh rate at SID Display Week 2022
  • In April 2021, Innolux Corporation developed a 16-inch MiniLED gaming notebook panel with high resolution, contrast ratio, and low latency, which is suitable for professional gaming. In addition, the company also showcased a 17.3-inch FHD gaming notebook panel with a 480Hz ultra-high refresh rate and a 27-inch MiniLED gaming monitor with a 300Hz ultra-high refresh rate.
  • In November 2020, BOE Technology Group Co., Ltd. launched the world's first 55-inch 4K AMQLED display, which employs electroluminescent quantum dots. The 55-inch 4K AMQLED display from BOE is the world's first of its kind, boasting a resolution of 3840×2160, a color gamut of 119% NTSC, and a contrast ratio of 1,000,000:1. It has a wide range of potential applicatins in the field of large displays.

Frequently Asked Questions (FAQ):

To speak to our analyst for a discussion on the above findings, click Speak to Analyst

TABLE OF CONTENTS
 
1 INTRODUCTION (Page No. - 30)
    1.1 STUDY OBJECTIVES 
    1.2 MARKET DEFINITION 
           1.2.1 INCLUSIONS AND EXCLUSIONS
           1.2.2 INCLUSIONS AND EXCLUSIONS
           1.2.3 INCLUSIONS AND EXCLUSIONS
           1.2.4 INCLUSIONS AND EXCLUSIONS
           1.2.5 INCLUSIONS AND EXCLUSIONS
           1.2.6 INCLUSIONS AND EXCLUSIONS
           1.2.7 INCLUSIONS AND EXCLUSIONS
    1.3 STUDY SCOPE 
           1.3.1 MARKET SEGMENTATION
                    FIGURE 1 DISPLAY MARKET: SEGMENTATION
           1.3.2 REGIONAL SCOPE
           1.3.3 YEARS CONSIDERED
    1.4 CURRENCY CONSIDERED 
    1.5 LIMITATIONS 
    1.6 UNITS CONSIDERED 
    1.7 STAKEHOLDERS 
 
2 RESEARCH METHODOLOGY (Page No. - 37)
    2.1 RESEARCH APPROACH 
           FIGURE 2 DISPLAY MARKET: RESEARCH DESIGN
           2.1.1 SECONDARY DATA
                    2.1.1.1 Major secondary sources
                    2.1.1.2 Key data from secondary sources
           2.1.2 PRIMARY DATA
                    2.1.2.1 Primary interviews with experts
                    2.1.2.2 List of key primary interview participants
                    2.1.2.3 Breakdown of primaries
                    2.1.2.4 Key data from primary sources
                    2.1.2.5 Secondary and primary research
                    2.1.2.6 Key industry insights
    2.2 MARKET SIZE ESTIMATION 
           2.2.1 BOTTOM-UP APPROACH
                    FIGURE 3 BOTTOM-UP APPROACH
           2.2.2 TOP-DOWN APPROACH
                    FIGURE 4 TOP-DOWN APPROACH
    2.3 FACTOR ANALYSIS 
           2.3.1 DEMAND-SIDE ANALYSIS
                    FIGURE 5 MARKET SIZE ESTIMATION: DEMAND-SIDE ANALYSIS
           2.3.2 SUPPLY-SIDE ANALYSIS
                    FIGURE 6 MARKET SIZE ESTIMATION: SUPPLY-SIDE ANALYSIS
           2.3.3 GROWTH FORECAST ASSUMPTIONS
                    TABLE 1 MARKET GROWTH ASSUMPTIONS
    2.4 RECESSION IMPACT 
    2.5 MARKET BREAKDOWN AND DATA TRIANGULATION 
           FIGURE 7 DATA TRIANGULATION
    2.6 RESEARCH ASSUMPTIONS 
    2.7 RISK ASSESSMENT 
           TABLE 2 RISK ASSESSMENT: DISPLAY MARKET
 
3 EXECUTIVE SUMMARY (Page No. - 50)
    FIGURE 8 DISPLAY MARKET: GLOBAL SNAPSHOT
    FIGURE 9 LCD SEGMENT TO ACCOUNT FOR LARGEST SHARE OF MARKET DURING FORECAST PERIOD
    FIGURE 10 SMALL & MEDIUM-SIZED PANELS SEGMENT TO ACCOUNT FOR LARGEST SIZE OF MARKET DURING FORECAST PERIOD
    FIGURE 11 SMARTPHONES SEGMENT TO LEAD MARKET DURING FORECAST PERIOD
    FIGURE 12 CONSUMER ELECTRONICS SEGMENT TO CAPTURE LARGEST SHARE OF MARKET DURING FORECAST PERIOD
    FIGURE 13 ASIA PACIFIC TO DOMINATE MARKET DURING FORECAST PERIOD
 
4 PREMIUM INSIGHTS (Page No. - 56)
    4.1 ATTRACTIVE OPPORTUNITIES FOR PLAYERS IN DISPLAY MARKET 
           FIGURE 14 GROWING DEMAND FOR OLED DISPLAYS TO DRIVE MARKET
    4.2 MARKET, BY DISPLAY TECHNOLOGY 
           FIGURE 15 LCD SEGMENT TO ACCOUNT FOR LARGEST SHARE OF MARKET DURING FORECAST PERIOD
    4.3 MARKET, BY PRODUCT TYPE 
           FIGURE 16 SMARTPHONES SEGMENT TO ACCOUNT FOR LARGEST SHARE OF MARKET DURING FORECAST PERIOD
    4.4 MARKET, BY PANEL SIZE 
           FIGURE 17 SMALL AND MEDIUM-SIZED PANELS SEGMENT TO ACCOUNT FOR LARGEST SIZE OF MARKET DURING FORECAST PERIOD
    4.5 MARKET, BY VERTICAL 
           FIGURE 18 CONSUMER ELECTRONICS SEGMENT TO ACCOUNT FOR LARGEST MARKET SHARE DURING FORECAST PERIOD
    4.6 ASIA PACIFIC: DISPLAY MARKET, BY DISPLAY TECHNOLOGY AND COUNTRY, 2022 
           FIGURE 19 LCD AND CHINA HELD LARGEST SHARES OF MARKET IN ASIA PACIFIC, BY DISPLAY TECHNOLOGY AND COUNTRY, RESPECTIVELY, IN 2022
 
5 MARKET OVERVIEW (Page No. - 60)
    5.1 INTRODUCTION 
    5.2 MARKET DYNAMICS 
           FIGURE 20 MARKET DYNAMICS: DISPLAY MARKET
           5.2.1 DRIVERS
                    5.2.1.1 Surging adoption of OLED displays in various applications
                    5.2.1.2 Increasing use of LED displays for video walls, TVs, and digital signage applications
                    5.2.1.3 Increasing applications of displays in automotive and healthcare industries
                               FIGURE 21 GLOBAL VEHICLE PRODUCTION, BY VEHICLE TYPE, 2015–2021 (MILLION UNITS)
                    5.2.1.4 Growing popularity of interactive displays
                    5.2.1.5 Rising adoption of IoT applications in industrial market
                               FIGURE 22 IMPACT ANALYSIS OF DRIVERS ON MARKET
           5.2.2 RESTRAINTS
                    5.2.2.1 Decline in demand for displays in retail sector due to drastic shift toward online advertisement and shopping
                    5.2.2.2 Deployment of widescreen alternatives, such as projectors and screenless displays, and emergence of new display concepts
                               FIGURE 23 IMPACT ANALYSIS OF RESTRAINTS ON DISPLAY MARKET
           5.2.3 OPPORTUNITIES
                    5.2.3.1 Growing adoption of flexible and foldable displays
                    5.2.3.2 Rapid adoption of AMOLED displays, especially post 5G rollout
                               FIGURE 24 SMARTPHONE SHIPMENTS AND 5G SUBSCRIPTIONS, 2019–2028 (MILLION UNITS)
                    5.2.3.3 Evolving micro-LED and mini-LED technologies leading to new growth avenues
                    5.2.3.4 Emerging use cases of displays
                               FIGURE 25 IMPACT ANALYSIS OF OPPORTUNITIES ON DISPLAY MARKET
           5.2.4 CHALLENGES
                    5.2.4.1 High costs associated with new display technology-based products
                    5.2.4.2 Technological obsolescence
                               FIGURE 26 IMPACT ANALYSIS OF CHALLENGES ON MARKET
    5.3 VALUE CHAIN ANALYSIS 
           FIGURE 27 VALUE CHAIN ANALYSIS: DISPLAY MARKET
           TABLE 3 MARKET: VALUE CHAIN ANALYSIS
    5.4 MARKET: ECOSYSTEM 
           FIGURE 28 DISPLAY MARKET: ECOSYSTEM
    5.5 KEY TECHNOLOGY TRENDS 
           5.5.1 IMMERSIVE DISPLAYS
           5.5.2 QD-OLED
           5.5.3 FLEXIBLE AND FOLDABLE DISPLAYS
           5.5.4 MICRO-LED
           5.5.5 E-PAPER TECHNOLOGY
           5.5.6 PROJECTION TECHNOLOGY
    5.6 PRICING ANALYSIS 
           5.6.1 AVERAGE SELLING PRICE TREND
                    TABLE 4 AVERAGE SELLING PRICE OF DISPLAY PANELS, BY DISPLAY TECHNOLOGY
           5.6.2 AVERAGE SELLING PRICE, BY PRODUCT TYPE
                    FIGURE 29 ASPS OF LCD PANELS, BY PRODUCT TYPE, 2019–2028 (USD)
    5.7 PATENT ANALYSIS 
           TABLE 5 PATENTS FILED FROM JANUARY 2012–DECEMBER 2022
           FIGURE 30 NUMBER OF PATENTS GRANTED FOR DISPLAYS
           FIGURE 31 TOP 10 COMPANIES WITH HIGHEST NUMBER OF PATENT APPLICATIONS FROM JANUARY 2012–DECEMBER 2022
           TABLE 6 TOP 20 PATENT OWNERS FROM JANUARY 2012–DECEMBER 2022
           TABLE 7 KEY PATENTS RELATED TO DISPLAYS
    5.8 PORTER’S FIVE FORCES ANALYSIS 
           FIGURE 32 DISPLAY MARKET: PORTER’S FIVE FORCES ANALYSIS, 2022
           FIGURE 33 IMPACT OF PORTER’S FIVE FORCES ON MARKET, 2022
           TABLE 8 MARKET: PORTER’S FIVE FORCES ANALYSIS, 2022
           5.8.1 THREAT OF NEW ENTRANTS
           5.8.2 THREAT OF SUBSTITUTES
           5.8.3 BARGAINING POWER OF SUPPLIERS
           5.8.4 BARGAINING POWER OF BUYERS
           5.8.5 INTENSITY OF COMPETITIVE RIVALRY
    5.9 KEY STAKEHOLDERS & BUYING CRITERIA 
           5.9.1 KEY STAKEHOLDERS IN BUYING PROCESS
                    FIGURE 34 INFLUENCE OF STAKEHOLDERS ON BUYING PROCESS
                    TABLE 9 INFLUENCE OF STAKEHOLDERS ON BUYING PROCESS
           5.9.2 BUYING CRITERIA
                    FIGURE 35 KEY BUYING CRITERIA FOR TOP THREE APPLICATIONS OF DISPLAYS
                    TABLE 10 KEY BUYING CRITERIA FOR DISPLAYS
    5.10 CASE STUDY ANALYSIS 
           5.10.1 SYCUAN CASINO RESORT ENHANCED GUEST EXPERIENCE BY ADDING HUNDREDS OF SAMSUNG DIGITAL DISPLAYS
           5.10.2 SCIEMENT IMPROVED VISUALIZATION OF CONGENITAL HEART DEFECTS, CEREBRAL ANEURYSMS, AND COMPLEX BLOOD VESSELS WITH SONY’S SPATIAL REALITY DISPLAYS
           5.10.3 AMU PLAZA KUMAMOTO (JAPAN) PROVIDED TIMELY INFORMATION TO CUSTOMERS USING PANASONIC’S COMPREHENSIVE DISPLAY SOLUTION
           5.10.4 BURT BROTHERS TIRE & SERVICES ENHANCED VISUAL EXPERIENCE FOR CUSTOMERS WITH DIGITAL SIGNAGE
           5.10.5 EUROLACKE REDESIGNED OFFICE SPACE WITH SHARP’S DISPLAY SOLUTIONS
    5.11 TRADE DATA 
           TABLE 11 EXPORT DATA FOR HS CODE 8537, 2017–2021 (USD MILLION)
           FIGURE 36 EXPORT DATA FOR HS CODE 8537, 2017–2021
           TABLE 12 IMPORT DATA FOR HS CODE 8537, 2017–2021 (USD MILLION)
           FIGURE 37 IMPORT DATA FOR HS CODE 8537, 2017–2021
    5.12 TARIFFS AND REGULATIONS 
           5.12.1 TARIFFS
                    TABLE 13 MFN TARIFFS FOR PRODUCTS INCLUDED UNDER HS CODE: 8537 EXPORTED BY GERMANY
           5.12.2 STANDARDS
                    5.12.2.1 Global
                    5.12.2.2 Europe
                    5.12.2.3 Asia Pacific
                    5.12.2.4 North America
           5.12.3 REGULATIONS
                    5.12.3.1 North America
                    5.12.3.2 Europe
                    5.12.3.3 Asia Pacific
    5.13 TRENDS/DISRUPTIONS IMPACTING CUSTOMER BUSINESS 
           FIGURE 38 REVENUE SHIFTS FOR DISPLAY MARKET
    5.14 KEY CONFERENCES & EVENTS, 2023 
           TABLE 14 MARKET: DETAILED LIST OF CONFERENCES & EVENTS
 
6 DISPLAY MARKET, BY PANEL SIZE (Page No. - 97)
    6.1 INTRODUCTION 
           TABLE 15 DISPLAY MARKET, BY PANEL SIZE, 2019–2022 (USD BILLION)
           FIGURE 39 MICRODISPLAYS TO REGISTER HIGHEST CAGR DURING FORECAST PERIOD
           TABLE 16 MARKET, BY PANEL SIZE, 2023–2028 (USD BILLION)
    6.2 MICRODISPLAYS 
           6.2.1 INCREASING DEMAND FOR WEARABLE DEVICES TO INDUCE DEMAND FOR MICRODISPLAYS
                    TABLE 17 MICRODISPLAYS: DISPLAY MARKET, BY DISPLAY TECHNOLOGY, 2019–2022 (USD MILLION)
                    TABLE 18 MICRODISPLAYS: MARKET, BY DISPLAY TECHNOLOGY, 2023–2028 (USD MILLION)
    6.3 SMALL & MEDIUM-SIZED PANELS 
           6.3.1 GROWING DEMAND FOR SMARTPHONES TO GENERATE DEMAND FOR SMALL & MEDIUM-SIZED DISPLAY PANELS
                    TABLE 19 SMALL & MEDIUM-SIZED PANELS: DISPLAY MARKET, BY DISPLAY TECHNOLOGY, 2019–2022 (USD BILLION)
                    TABLE 20 SMALL & MEDIUM-SIZED PANELS: MARKET, BY DISPLAY TECHNOLOGY, 2023–2028 (USD BILLION)
                    TABLE 21 SMALL & MEDIUM-SIZED PANELS: MARKET, BY DISPLAY TECHNOLOGY, 2019–2022 (MILLION UNITS)
                    TABLE 22 SMALL & MEDIUM-SIZED PANELS: MARKET, BY DISPLAY TECHNOLOGY, 2023–2028 (MILLION UNITS)
    6.4 LARGE PANELS 
           6.4.1 GROWING TELEVISION MARKET TO DRIVE DEMAND FOR LARGE PANELS
                    TABLE 23 LARGE PANELS: DISPLAY MARKET, BY DISPLAY TECHNOLOGY, 2019–2022 (USD BILLION)
                    TABLE 24 LARGE PANELS: MARKET, BY DISPLAY TECHNOLOGY, 2023–2028 (USD BILLION)
                    TABLE 25 LARGE PANELS: MARKET, BY DISPLAY TECHNOLOGY, 2019–2022 (MILLION UNITS)
                    TABLE 26 LARGE PANELS: MARKET, BY DISPLAY TECHNOLOGY, 2023–2028 (MILLION UNITS)
 
7 DISPLAY MARKET, BY DISPLAY TECHNOLOGY (Page No. - 105)
    7.1 INTRODUCTION 
           TABLE 27 DISPLAY MARKET, BY DISPLAY TECHNOLOGY, 2019–2022 (USD BILLION)
           FIGURE 40 LCD SEGMENT TO ACCOUNT FOR LARGEST SHARE OF MARKET DURING FORECAST PERIOD
           TABLE 28 MARKET, BY DISPLAY TECHNOLOGY, 2023–2028 (USD BILLION)
    7.2 LIQUID CRYSTAL DISPLAY (LCD) 
           TABLE 29 LCD: DISPLAY MARKET, BY PANEL SIZE, 2019–2022 (USD BILLION)
           FIGURE 41 LARGE PANELS SEGMENT TO ACCOUNT FOR LARGEST SHARE OF LCD MARKET DURING FORECAST PERIOD
           TABLE 30 LCD: DISPLAY MARKET, BY PANEL SIZE, 2023–2028 (USD BILLION)
           TABLE 31 LCD: MARKET, BY PRODUCT TYPE, 2019–2022 (USD BILLION)
           TABLE 32 LCD: MARKET, BY PRODUCT TYPE, 2023–2028 (USD BILLION)
           TABLE 33 LCD: MARKET, BY WEARABLE TYPE, 2019–2022 (USD MILLION)
           TABLE 34 LCD: MARKET, BY WEARABLE TYPE, 2023–2028 (USD MILLION)
           TABLE 35 LCD: MARKET, BY REGION, 2019–2022 (USD BILLION)
           TABLE 36 LCD: MARKET, BY REGION, 2023–2028 (USD BILLION)
           7.2.1 TWISTED NEMATIC (TN) DISPLAY
                    7.2.1.1 Cost- and energy-efficient option for displaying text and images on electronic devices
           7.2.2 IN-PLANE SWITCHING (IPS) DISPLAY
                    7.2.2.1 Offers wider viewing experience
           7.2.3 VERTICAL ALIGNMENT (VA)
                    7.2.3.1 Offers vibrant colors and deep blacks
           7.2.4 ADVANCED FRINGE FIELD SWITCHING (AFFS)
                    7.2.4.1 Consumes low power and ideal for portable electronic devices
           7.2.5 LED-BACKLIGHT LCD
                    7.2.5.1 Cost-efficient and environment-friendly
           7.2.6 THIN-FILM TRANSISTORS (TFTS)
                    7.2.6.1 Offer high resolution, color accuracy, and faster response times
    7.3 ORGANIC LIGHT-EMITTING DIODE (OLED) 
           TABLE 37 OLED: DISPLAY MARKET, BY PANEL SIZE, 2019–2022 (USD BILLION)
           TABLE 38 OLED: MARKET, BY PANEL SIZE, 2023–2028 (USD BILLION)
           TABLE 39 OLED: MARKET, BY PRODUCT TYPE, 2019–2022 (USD BILLION)
           TABLE 40 OLED: MARKET, BY PRODUCT TYPE, 2023–2028 (USD BILLION)
           TABLE 41 OLED: MARKET, BY WEARABLE TYPE, 2019–2022 (USD MILLION)
           TABLE 42 OLED: MARKET, BY WEARABLE TYPE, 2023–2028 (USD MILLION)
           TABLE 43 OLED: MARKET, BY REGION, 2019–2022 (USD BILLION)
           TABLE 44 OLED: MARKET, BY REGION, 2023–2028 (USD BILLION)
           7.3.1 PASSIVE MATRIX ORGANIC LIGHT-EMITTING DIODE (PMOLED)
                    7.3.1.1 Extensively used in wearable devices due to low power consumption
           7.3.2 ACTIVE-MATRIX ORGANIC LIGHT-EMITTING DIODE (AMOLED)
                    7.3.2.1 Offers faster refresh rates and better contrast ratios compared to other types of displays
    7.4 MICRO-LED 
           7.4.1 BENEFITS SUCH AS IMPROVED CONTRAST, ENERGY EFFICIENCY, AND QUICKER RESPONSE TIME TO DRIVE DEMAND FOR MICRO-LED DISPLAYS
                    TABLE 45 MICRO-LED: DISPLAY MARKET, BY PANEL SIZE, 2019–2022 (USD MILLION)
                    FIGURE 42 SMALL & MEDIUM-SIZED PANELS SEGMENT TO DOMINATE MICRO-LED MARKET DURING FORECAST PERIOD
                    TABLE 46 MICRO-LED: MARKET, BY PANEL SIZE, 2023–2028 (USD MILLION)
                    TABLE 47 MICRO-LED: MARKET, BY PRODUCT TYPE, 2019–2022 (USD BILLION)
                    TABLE 48 MICRO-LED: MARKET, BY PRODUCT TYPE, 2023–2028 (USD BILLION)
                    TABLE 49 MICRO-LED: MARKET, BY WEARABLE TYPE, 2019–2022 (USD MILLION)
                    TABLE 50 MICRO-LED: MARKET, BY WEARABLE TYPE, 2023–2028 (USD MILLION)
                    TABLE 51 MICRO-LED: MARKET, BY REGION, 2019–2022 (USD BILLION)
                    TABLE 52 MICRO-LED: MARKET, BY REGION, 2023–2028 (USD BILLION)
    7.5 DIRECT-VIEW LED (DLED) 
           TABLE 53 DIRECT-VIEW LED: DISPLAY MARKET, BY REGION, 2019–2022 (USD BILLION)
           TABLE 54 DIRECT-VIEW LED: MARKET, BY REGION, 2023–2028 (USD BILLION)
           7.5.1 DIRECT-VIEW FINE-PIXEL LED
                    7.5.1.1 Emerging technology for digital signage
           7.5.2 DIRECT-VIEW LARGE-PIXEL LED
                    7.5.2.1 Preferred for indoor applications
    7.6 QUANTUM DOT DISPLAY (QD DISPLAY) 
           7.6.1 BENEFITS SUCH AS BETTER COLOR GAMUT AND ENERGY EFFICIENCY TO DRIVE MARKET
                    TABLE 55 QUANTUM DOT DISPLAY: DISPLAY MARKET, BY PRODUCT TYPE, 2019–2022 (USD BILLION)
                    TABLE 56 QUANTUM DOT DISPLAY: MARKET, BY PRODUCT TYPE, 2023–2028 (USD BILLION)
                    TABLE 57 QUANTUM DOT DISPLAY: MARKET, BY REGION, 2019–2022 (USD BILLION)
                    TABLE 58 QUANTUM DOT DISPLAY: MARKET, BY REGION, 2023–2028 (USD BILLION)
    7.7 OTHERS 
           TABLE 59 OTHERS: DISPLAY MARKET, BY REGION, 2019–2022 (USD BILLION)
           TABLE 60 OTHERS: MARKET, BY REGION, 2023–2028 (USD BILLION)
 
8 DISPLAY MARKET, BY PRODUCT TYPE (Page No. - 126)
    8.1 INTRODUCTION 
           TABLE 61 DISPLAY MARKET, BY PRODUCT TYPE, 2019–2022 (USD BILLION)
           FIGURE 43 SMARTPHONES TO DOMINATE DISPLAY MARKET DURING FORECAST PERIOD
           TABLE 62 MARKET, BY PRODUCT TYPE, 2023–2028 (USD BILLION)
    8.2 SMARTPHONES 
           8.2.1 LCD, OLED, AND AMOLED AMONG KEY DISPLAY TECHNOLOGIES FOR SMARTPHONES
                    TABLE 63 SMARTPHONES: DISPLAY MARKET, BY DISPLAY TECHNOLOGY, 2019–2022 (USD BILLION)
                    FIGURE 44 OLED SEGMENT TO DOMINATE SMARTPHONE MARKET DURING FORECAST PERIOD
                    TABLE 64 SMARTPHONES: MARKET, BY DISPLAY TECHNOLOGY, 2023–2028 (USD BILLION)
    8.3 TELEVISION SETS 
           8.3.1 QUANTUM DOT DISPLAYS GAINING POPULARITY AMONG HIGH-END TELEVISION SETS
                    TABLE 65 TELEVISION SETS: DISPLAY MARKET, BY DISPLAY TECHNOLOGY, 2019–2022 (USD BILLION)
                    FIGURE 45 LCD SEGMENT TO ACCOUNT FOR LARGEST SHARE OF MARKET FOR TELEVISION SETS DURING FORECAST PERIOD
                    TABLE 66 TELEVISION SETS: MARKET, BY DISPLAY TECHNOLOGY, 2023–2028 (USD BILLION)
    8.4 MONITORS & LAPTOPS 
           8.4.1 LCD TECHNOLOGY PREDOMINANTLY USED IN MONITORS & LAPTOPS
                    TABLE 67 MONITORS & LAPTOPS: DISPLAY MARKET, BY DISPLAY TECHNOLOGY, 2019–2022 (USD BILLION)
                    TABLE 68 MONITORS & LAPTOPS: MARKET, BY DISPLAY TECHNOLOGY, 2023–2028 (USD BILLION)
    8.5 DIGITAL SIGNAGE & LARGE FORMAT DISPLAYS 
           8.5.1 LCD AND LED TECHNOLOGIES MOST COMMONLY USED IN LARGE FORMAT DISPLAYS AND DIGITAL SIGNAGE
                    TABLE 69 DIGITAL SIGNAGE & LARGE FORMAT DISPLAYS: DISPLAY MARKET, BY DISPLAY TECHNOLOGY, 2019–2022 (USD BILLION)
                    TABLE 70 DIGITAL SIGNAGE & LARGE FORMAT DISPLAYS: MARKET, BY DISPLAY TECHNOLOGY, 2023–2028 (USD BILLION)
                    TABLE 71 DIGITAL SIGNAGE & LARGE FORMAT DISPLAYS: MARKET, BY VERTICAL, 2019–2022 (USD MILLION)
                    TABLE 72 DIGITAL SIGNAGE & LARGE FORMAT DISPLAYS: MARKET, BY VERTICAL, 2023–2028 (USD MILLION)
    8.6 AUTOMOTIVE DISPLAYS 
           8.6.1 OLED TECHNOLOGY PREFERRED IN AUTOMOTIVE DISPLAYS DUE TO THEIR SUPERIOR PICTURE QUALITY, SHARPNESS, AND VISIBILITY
                    TABLE 73 AUTOMOTIVE DISPLAYS: DISPLAY MARKET, BY DISPLAY TECHNOLOGY, 2019–2022 (USD BILLION)
                    TABLE 74 AUTOMOTIVE DISPLAYS: MARKET, BY DISPLAY TECHNOLOGY, 2023–2028 (USD BILLION)
    8.7 TABLETS 
           8.7.1 EXTENSIVE USE OF OLED AND AMOLED DISPLAYS DUE TO THEIR SUPERIOR IMAGE QUALITY AND POWER EFFICIENCY
                    TABLE 75 TABLETS: DISPLAY MARKET, BY DISPLAY TECHNOLOGY, 2019–2022 (USD BILLION)
                    TABLE 76 TABLETS: MARKET, BY DISPLAY TECHNOLOGY, 2023–2028 (USD BILLION)
    8.8 SMART WEARABLES 
           TABLE 77 SMART WEARABLES: DISPLAY MARKET, BY WEARABLE TYPE, 2019–2022 (USD MILLION)
           TABLE 78 SMART WEARABLES: MARKET, BY WEARABLE TYPE, 2023–2028 (USD MILLION)
           TABLE 79 SMART WEARABLES: MARKET, BY DISPLAY TECHNOLOGY, 2019–2022 (USD BILLION)
           TABLE 80 SMART WEARABLES: MARKET, BY DISPLAY TECHNOLOGY, 2023–2028 (USD BILLION)
           8.8.1 SMARTWATCHES
                    8.8.1.1 Micro-LED displays to be potential replacement for OLED displays in smartwatches
                               TABLE 81 SMARTWATCHES: DISPLAY MARKET, BY DISPLAY TECHNOLOGY, 2019–2022 (USD MILLION)
                               TABLE 82 SMARTWATCHES: SMARTPHONES MARKET, BY DISPLAY TECHNOLOGY, 2023–2028 (USD MILLION)
           8.8.2 AR HMDS
                    8.8.2.1 MicroLED to emerge as disruptive technology for AR HMDs
                               TABLE 83 AR HMDS: DISPLAY MARKET, BY DISPLAY TECHNOLOGY, 2019–2022 (USD MILLION)
                               TABLE 84 AR HMDS: MARKET, BY DISPLAY TECHNOLOGY, 2023–2028 (USD MILLION)
                               TABLE 85 AR HMDS: MARKET, BY VERTICAL, 2019–2022 (USD MILLION)
                               TABLE 86 AR HMDS: MARKET, BY VERTICAL, 2023–2028 (USD MILLION)
           8.8.3 VR HMDS
                    8.8.3.1 LCD, OLED, and retinal projection commonly used in VR HMDs
                               TABLE 87 VR HMDS: DISPLAY MARKET, BY DISPLAY TECHNOLOGY, 2019–2022 (USD MILLION)
                               TABLE 88 VR HMDS: MARKET, BY DISPLAY TECHNOLOGY, 2023–2028 (USD MILLION)
                               TABLE 89 VR HMDS: MARKET, BY VERTICAL, 2019–2022 (USD MILLION)
                               TABLE 90 VR HMDS: MARKET, BY VERTICAL, 2023–2028 (USD MILLION)
    8.9 OTHERS 
           TABLE 91 OTHERS: DISPLAY MARKET, BY DISPLAY TECHNOLOGY, 2019–2022 (USD BILLION)
           TABLE 92 OTHERS: MARKET, BY DISPLAY TECHNOLOGY, 2023–2028 (USD MILLION)
           TABLE 93 OTHERS: MARKET, BY VERTICAL, 2019–2022 (USD MILLION)
           TABLE 94 OTHERS: MARKET, BY VERTICAL, 2023–2028 (USD MILLION)
 
9 DISPLAY MARKET, BY VERTICAL (Page No. - 147)
    9.1 INTRODUCTION 
           TABLE 95 DISPLAY MARKET, BY VERTICAL, 2019–2022 (USD BILLION)
           FIGURE 46 CONSUMER ELECTRONICS SEGMENT TO DOMINATE MARKET DURING FORECAST PERIOD
           TABLE 96 MARKET, BY VERTICAL, 2023–2028 (USD BILLION)
    9.2 CONSUMER ELECTRONICS 
           9.2.1 GROWING USE OF OLED AND MICRO-LED DISPLAY TECHNOLOGY TO DRIVE MARKET
    9.3 AUTOMOTIVE 
           9.3.1 INCREASING USE OF OLED DISPLAYS FOR AUTOMOTIVE APPLICATIONS TO DRIVE MARKET
    9.4 SPORTS & ENTERTAINMENT 
           9.4.1 RAPID PENETRATION OF AR/VR HMDS IN SPORTS & ENTERTAINMENT TO PROPEL MARKET GROWTH
    9.5 TRANSPORTATION 
           9.5.1 TRANSPORTATION VERTICAL TO GENERATE HIGH DEMAND FOR LARGE FORMAT DISPLAYS
    9.6 RETAIL, HOSPITALITY, AND BANKING, FINANCIAL SERVICES AND INSURANCE (BFSI) 
           9.6.1 INCREASING ADOPTION OF DIGITAL SIGNAGE IN RETAIL, HOSPITALITY, AND BFSI TO DRIVE MARKET
    9.7 INDUSTRIAL & ENTERPRISES 
           9.7.1 INCREASING USE OF AR/VR IN INDUSTRIES AND ENTERPRISES TO FUEL MARKET GROWTH
    9.8 EDUCATION 
           9.8.1 TRANSITION TO ONLINE LEARNING TO CONTRIBUTE TO MARKET GROWTH
    9.9 HEALTHCARE 
           9.9.1 INCREASING ADOPTION OF DISPLAYS TO VISUALIZE MEDICAL IMAGES TO DRIVE MARKET
    9.1 0AEROSPACE & DEFENSE 
           9.10.1 INCREASING USE OF HUDS AND MFDS TO ACCELERATE MARKET GROWTH
    9.11 OTHERS 
 
10 DISPLAY MARKET, BY RESOLUTION (Page No. - 157)
     10.1 INTRODUCTION 
     10.2 8K 
             10.2.1 8K DISPLAYS IN EVOLUTION PHASE
     10.3 4K 
             10.3.1 OFFERS HIGHLY VIBRANT AND REALISTIC IMAGES
     10.4 FULL HIGH DEFINITION (FHD) 
             10.4.1 OFFERS ADVANTAGES SUCH AS LOW PRICE AND SUPERIOR PICTURE QUALITY
     10.5 HIGH DEFINITION (HD) 
             10.5.1 EXTENSIVELY USED FOR GLOBALLY DISTRIBUTED VIDEO CONTENT
     10.6 LOWER THAN HD 
             10.6.1 LOWER-THAN-HD DISPLAYS MAINLY USED FOR INDUSTRIAL APPLICATIONS
 
11 DISPLAY MARKET, BY REGION (Page No. - 160)
     11.1 INTRODUCTION 
             FIGURE 47 REST OF ASIA PACIFIC TO REGISTER HIGHEST CAGR IN MARKET DURING FORECAST PERIOD
             TABLE 97 DISPLAY MARKET, BY REGION, 2019–2022 (USD BILLION)
             TABLE 98 MARKET, BY REGION, 2023–2028 (USD BILLION)
     11.2 NORTH AMERICA 
             FIGURE 48 NORTH AMERICA: DISPLAY MARKET SNAPSHOT
             TABLE 99 NORTH AMERICA: MARKET, BY DISPLAY TECHNOLOGY, 2019–2022 (USD BILLION)
             TABLE 100 NORTH AMERICA: MARKET, BY DISPLAY TECHNOLOGY, 2023–2028 (USD BILLION)
             TABLE 101 NORTH AMERICA: MARKET, BY COUNTRY, 2019–2022 (USD BILLION)
             TABLE 102 NORTH AMERICA: MARKET, BY COUNTRY, 2023–2028 (USD BILLION)
             11.2.1 NORTH AMERICA: RECESSION IMPACT
             11.2.2 US
                        11.2.2.1 Technological advancements related to displays to foster market growth
             11.2.3 CANADA
                        11.2.3.1 Increasing adoption of displays in food service and transportation industries to drive market
             11.2.4 MEXICO
                        11.2.4.1 Expanding consumer electronics, automotive, and retail verticals to support market growth
     11.3 EUROPE 
             FIGURE 49 EUROPE: DISPLAY MARKET SNAPSHOT
             TABLE 103 EUROPE: MARKET, BY DISPLAY TECHNOLOGY, 2019–2022 (USD BILLION)
             TABLE 104 EUROPE: MARKET, BY DISPLAY TECHNOLOGY, 2023–2028 (USD BILLION)
             TABLE 105 EUROPE: MARKET, BY COUNTRY, 2019–2022 (USD BILLION)
             TABLE 106 EUROPE: MARKET, BY COUNTRY, 2023–2028 (USD BILLION)
             11.3.1 EUROPE: RECESSION IMPACT
             11.3.2 GERMANY
                        11.3.2.1 Increasing adoption of displays in automotive industry to drive market
             11.3.3 FRANCE
                        11.3.3.1 Growing aerospace & defense industry to drive market
             11.3.4 UK
                        11.3.4.1 Heightened demand for smartphones and AR/VR HMDs to propel market growth
             11.3.5 REST OF EUROPE
     11.4 ASIA PACIFIC 
             FIGURE 50 ASIA PACIFIC: DISPLAY MARKET SNAPSHOT
             TABLE 107 AISA PACIFIC: MARKET, BY DISPLAY TECHNOLOGY, 2019–2022 (USD BILLION)
             TABLE 108 ASIA PACIFIC: MARKET, BY DISPLAY TECHNOLOGY, 2023–2028 (USD BILLION)
             TABLE 109 ASIA PACIFIC: MARKET, BY COUNTRY, 2019–2022 (USD BILLION)
             TABLE 110 ASIA PACIFIC: MARKET, BY COUNTRY, 2023–2028 (USD BILLION)
             11.4.1 ASIA PACIFIC: RECESSION IMPACT
             11.4.2 CHINA
                        11.4.2.1 Supportive government initiatives to drive market growth
             11.4.3 SOUTH KOREA
                        11.4.3.1 Presence of key display manufacturers to foster market growth
             11.4.4 JAPAN
                        11.4.4.1 Presence of key component suppliers of displays to foster market growth
             11.4.5 TAIWAN
                        11.4.5.1 Surge in production of display panels to augment market growth
             11.4.6 REST OF ASIA PACIFIC
     11.5 REST OF THE WORLD 
             TABLE 111 REST OF THE WORLD: DISPLAY MARKET, BY DISPLAY TECHNOLOGY, 2019–2022 (USD BILLION)
             TABLE 112 REST OF THE WORLD: MARKET, BY DISPLAY TECHNOLOGY, 2023–2028 (USD BILLION)
             TABLE 113 REST OF THE WORLD: MARKET, BY COUNTRY, 2019–2022 (USD BILLION)
             TABLE 114 REST OF THE WORLD: MARKET, BY COUNTRY, 2023–2028 (USD BILLION)
             11.5.1 REST OF THE WORLD: RECESSION IMPACT
             11.5.2 MIDDLE EAST & AFRICA
                        11.5.2.1 Expanding retail and transportation verticals to contribute to market growth
             11.5.3 SOUTH AMERICA
                        11.5.3.1 Increasing adoption of large format displays in outdoor advertising to enhance market growth
 
12 COMPETITIVE LANDSCAPE (Page No. - 180)
     12.1 INTRODUCTION 
     12.2 MARKET EVALUATION FRAMEWORK 
             TABLE 115 OVERVIEW OF STRATEGIES ADOPTED BY KEY PLAYERS
             FIGURE 51 COMPANIES ADOPTED PARTNERSHIPS AS KEY GROWTH STRATEGY FROM 2019–2022
             12.2.1 ORGANIC/INORGANIC GROWTH STRATEGIES
             12.2.2 PRODUCT PORTFOLIO
             12.2.3 GEOGRAPHIC PRESENCE
             12.2.4 MANUFACTURING AND DISTRIBUTION FOOTPRINT
     12.3 MARKET SHARE ANALYSIS, 2022 
             TABLE 116 MARKET SHARE ANALYSIS OF TOP 5 PLAYERS IN DISPLAY MARKET, 2022
     12.4 HISTORICAL REVENUE ANALYSIS, 2018–2022 
             FIGURE 52 HISTORICAL REVENUE ANALYSIS OF MAJOR COMPANIES IN MARKET (DISPLAY BUSINESS), 2018–2022 (USD BILLION)
     12.5 COMPANY EVALUATION QUADRANT 
             12.5.1 STARS
             12.5.2 EMERGING LEADERS
             12.5.3 PERVASIVE PLAYERS
             12.5.4 PARTICIPANTS
                         FIGURE 53 DISPLAY MARKET: COMPANY EVALUATION QUADRANT, 2022
     12.6 STARTUPS/SMES EVALUATION QUADRANT 
             12.6.1 COMPETITIVE BENCHMARKING
                        TABLE 117 DISPLAY MARKET: DETAILED LIST OF KEY STARTUPS/SMES
                        TABLE 118 COMPETITIVE BENCHMARKING FOR STARTUPS/SMES: DISPLAY TECHNOLOGY
                        TABLE 119 COMPETITIVE BENCHMARKING FOR STARTUPS/SMES: PRODUCT TYPE
                        TABLE 120 COMPETITIVE BENCHMARKING OF STARTUPS/SMES: REGION
             12.6.2 PROGRESSIVE COMPANIES
             12.6.3 RESPONSIVE COMPANIES
             12.6.4 DYNAMIC COMPANIES
             12.6.5 STARTING BLOCKS
                         FIGURE 54 DISPLAY MARKET: STARTUPS/SMES EVALUATION QUADRANT, 2022
     12.7 COMPANY FOOTPRINT 
             TABLE 121 MARKET: COMPANY FOOTPRINT
             TABLE 122 MARKET: COMPANY DISPLAY TECHNOLOGY FOOTPRINT
             TABLE 123 MARKET: COMPANY PRODUCT TYPE FOOTPRINT
             TABLE 124 MARKET: COMPANY REGION FOOTPRINT
     12.8 COMPETITIVE SCENARIOS AND TRENDS 
             12.8.1 PRODUCT LAUNCHES
                        TABLE 125 DISPLAY MARKET: PRODUCT LAUNCHES, 2019–2023
             12.8.2 DEALS
                        TABLE 126 MARKET: DEALS, 2019–2023
             12.8.3 OTHERS
                        TABLE 127 MARKET: OTHER STRATEGIES
 
13 COMPANY PROFILES (Page No. - 208)
(Business Overview, Products Offered, Recent Developments, MnM View Right to win, Strategic choices made, Weaknesses and competitive threats) *  
     13.1 INTRODUCTION 
     13.2 KEY PLAYERS 
             13.2.1 SAMSUNG ELECTRONICS CO., LTD.
                         TABLE 128 SAMSUNG ELECTRONICS CO., LTD.: COMPANY OVERVIEW
                         FIGURE 55 SAMSUNG ELECTRONICS CO., LTD.: COMPANY SNAPSHOT
                         TABLE 129 SAMSUNG ELECTRONICS CO., LTD.: PRODUCT LAUNCHES
             13.2.2 BOE TECHNOLOGY GROUP CO., LTD.
                         TABLE 130 BOE TECHNOLOGY GROUP CO., LTD.: COMPANY OVERVIEW
                         FIGURE 56 BOE TECHNOLOGY GROUP CO., LTD.: COMPANY SNAPSHOT
                         TABLE 131 BOE CORPORATION: PRODUCT LAUNCHES
                         TABLE 132 BOE TECHNOLOGY GROUP CO., LTD.: DEALS
             13.2.3 LG DISPLAY CO., LTD.
                         TABLE 133 LG DISPLAY CO., LTD.: COMPANY OVERVIEW
                         FIGURE 57 LG DISPLAY CO., LTD.: COMPANY SNAPSHOT
                         TABLE 134 LG DISPLAY CO., LTD.: PRODUCT LAUNCHES
                         TABLE 135 LG DISPLAY., LTD.: DEALS
                         TABLE 136 LG DISPLAY., LTD.: OTHERS
             13.2.4 AUO CORPORATION
                         TABLE 137 AUO CORPORATION: COMPANY OVERVIEW
                         FIGURE 58 AUO CORPORATION: COMPANY SNAPSHOT
                         TABLE 138 AUO CORPORATION: PRODUCT LAUNCHES
                         TABLE 139 AUO CORPORATION: DEALS
             13.2.5 INNOLUX CORPORATION
                         TABLE 140 INNOLUX CORPORATION: COMPANY OVERVIEW
                         FIGURE 59 INNOLUX CORPORATION: COMPANY SNAPSHOT
                         TABLE 141 INNOLUX CORPORATION: PRODUCT LAUNCHES
                         TABLE 142 INNOLUX CORPORATION: DEALS
             13.2.6 SHARP CORPORATION
                         TABLE 143 SHARP CORPORATION: COMPANY OVERVIEW
                         FIGURE 60 SHARP CORPORATION: COMPANY SNAPSHOT
                         TABLE 144 SHARP CORPORATION: PRODUCT LAUNCHES
                         TABLE 145 SHARP CORPORATION: DEALS
             13.2.7 JAPAN DISPLAY INC.
                         TABLE 146 JAPAN DISPLAY INC.: COMPANY OVERVIEW
                         FIGURE 61 JAPAN DISPLAY INC.: COMPANY SNAPSHOT
                         TABLE 147 JAPAN DISPLAY INC.: PRODUCT LAUNCHES
                         TABLE 148 JAPAN DISPLAY INC.: DEALS
             13.2.8 SONY GROUP CORPORATION
                         TABLE 149 SONY GROUP CORPORATION: COMPANY OVERVIEW
                         FIGURE 62 SONY GROUP CORPORATION: COMPANY SNAPSHOT
                         TABLE 150 SONY GROUP CORPORATION: PRODUCT LAUNCHES
                         TABLE 151 SONY GROUP CORPORATION: DEALS
             13.2.9 LEYARD OPTOELECTRONIC CO LTD
                         TABLE 152 LEYARD OPTOELECTRONIC CO LTD: COMPANY OVERVIEW
                         FIGURE 63 LEYARD OPTOELECTRONIC CO LTD: COMPANY SNAPSHOT
                         TABLE 153 LEYARD OPTOELECTRONIC CO LTD: PRODUCT LAUNCHES
                         TABLE 154 LEYARD OPTOELECTRONIC CO LTD: DEALS
             13.2.10 QISDA CORPORATION
                         TABLE 155 QISDA CORPORATION: COMPANY OVERVIEW
                         FIGURE 64 QISDA CORPORATION: COMPANY SNAPSHOT
             13.2.11 VIA OPTRONICS AG
                         TABLE 156 VIA OPTRONICS AG: COMPANY OVERVIEW
                         FIGURE 65 VIA OPTRONICS AG: COMPANY SNAPSHOT
                         TABLE 157 VIA OPTRONICS AG: PRODUCT LAUNCHES
                         TABLE 158 VIA OPTRONICS AG: DEALS
                         TABLE 159 VIA OPTRONICS AG: OTHERS
     13.3 OTHER PLAYERS 
             13.3.1 E INK HOLDINGS INC.
             13.3.2 TIANMA MICROELECTRONICS CO., LTD.
             13.3.3 UNIVERSAL DISPLAY
             13.3.4 TRULY INTERNATIONAL HOLDINGS LTD.
             13.3.5 PANASONIC HOLDINGS CORPORATION
             13.3.6 TCL CHINA STAR OPTOELECTRONICS TECHNOLOGY CO., LTD.
             13.3.7 HANNSTAR DISPLAY CORP.
             13.3.8 EMAGIN CORP.
             13.3.9 KOPIN CORPORATION
             13.3.10 NORITAKE ITRON CORP.
             13.3.11 PLESSEY SEMICONDUCTORS LTD
             13.3.12 ELUX INC.
             13.3.13 VISIONOX COMPANY
             13.3.14 WINSTAR DISPLAY CO., LTD.
             13.3.15 WISECHIP SEMICONDUCTOR INC.
*Details on Business Overview, Products Offered, Recent Developments, MnM View, Right to win, Strategic choices made, Weaknesses and competitive threats might not be captured in case of unlisted companies.  
 
14 APPENDIX (Page No. - 272)
     14.1 INSIGHTS FROM INDUSTRY EXPERTS 
     14.2 KNOWLEDGESTORE: MARKETSANDMARKETS’ SUBSCRIPTION PORTAL 
     14.3 CUSTOMIZATION OPTIONS 
     14.4 RELATED REPORTS 
     14.5 AUTHOR DETAILS 
 

The research study involved 4 major activities in estimating the size of the display market. Exhaustive secondary research has been done to collect important information about the market and peer markets. The validation of these findings, assumptions, and sizing with the help of primary research with industry experts across the value chain has been the next step. Both top-down and bottom-up approaches have been used to estimate the market size. Post which the market breakdown and data triangulation have been adopted to estimate the market sizes of segments and sub-segments.

Secondary Research

In secondary research, various secondary sources have been referred to for obtaining the information that was needed for the study. Various secondary sources that were used for the research include, corporate filings such as annual reports, press releases, investor presentations, and financial statements, trade, business, and professional associations, whitepapers, journals, certified publications, and articles from recognized authors and databases.

In the display market report, the top-down as well as the bottom-up approaches have been used for the estimation of the global market size, along with several other dependent submarkets. The major players in the market were identified with the help of extensive secondary research and their presence in the market was determined using secondary and primary research. All the percentage shares, splits, and breakdowns have been determined using secondary sources and verified through primary sources.

Primary Research

Extensive primary research has been conducted after understanding the display market scenario through secondary research. Several primary interviews have been conducted with key opinion leaders from both demand- and supply-side vendors across 4 major regions— Asia Pacific, North America, Europe, and the Rest of the World. Approximately 25% of the primary interviews have been conducted with the demand-side vendors and 75% with the supply-side vendors. Primary data has been collected mainly through telephonic interviews, which consist of 80% of the total primary interviews; questionnaires and emails have also been used to collect the data.

After successful interaction with industry experts, brief sessions were conducted with highly experienced independent consultants to reinforce the findings of our primary research. This, along with the in-house subject matter experts’ opinions, has led us to the findings as described in the report.

Display Market Size, and Share

To know about the assumptions considered for the study, download the pdf brochure

Market Size Estimation

In the market engineering process, both top-down and bottom-up approaches along with data triangulation methods have been used to estimate and validate the size of the display market and other dependent submarkets. The research methodology used to estimate the market sizes includes the following:

  • Initially, the focus was on top line investments and spending in the ecosystem. Further the segment level splits and major developments in the market have been considered.
  • Identifying different stakeholders in the display market that influence the entire market, along with participants across the value chain
  • Analyzing major manufacturers of display panels as well as studying their product portfolios
  • Analyzing trends related to the adoption of displays based on product type
  • Tracking the recent and upcoming developments in the market that include investments, R&D activities, product launches, collaborations, mergers & acquisitions, and partnerships, as well as forecasting the market size based on these developments and other critical parameters
  • Carrying out multiple discussions with key opinion leaders to identify the adoption trends of displays
  • Segmenting the overall market into various other market segments
  • Validating the estimates at every level through discussions with key opinion leaders, such as chief executives (CXOs), directors, and operation managers, and finally with the domain experts at MarketsandMarkets

Market Size Estimation Methodology-Bottom-up Approach

Display Market Size, and Bottom-up Approach

Market Size Estimation Methodology-Top- down Approach

Display Market Size, and Top- down Approach

Data Triangulation

After arriving at the overall market size through the market size estimation process explained in the earlier section, the overall display market has been divided into several segments and subsegments. To complete the overall market engineering process and arrive at the exact statistics for all segments, the data triangulation and market breakdown procedures have been used, wherever applicable. The data has been triangulated by studying various factors and trends from both the demand and supply side perspectives. Along with data triangulation and market breakdown, the market has been validated by top-down and bottom-up approaches.

Market Definition

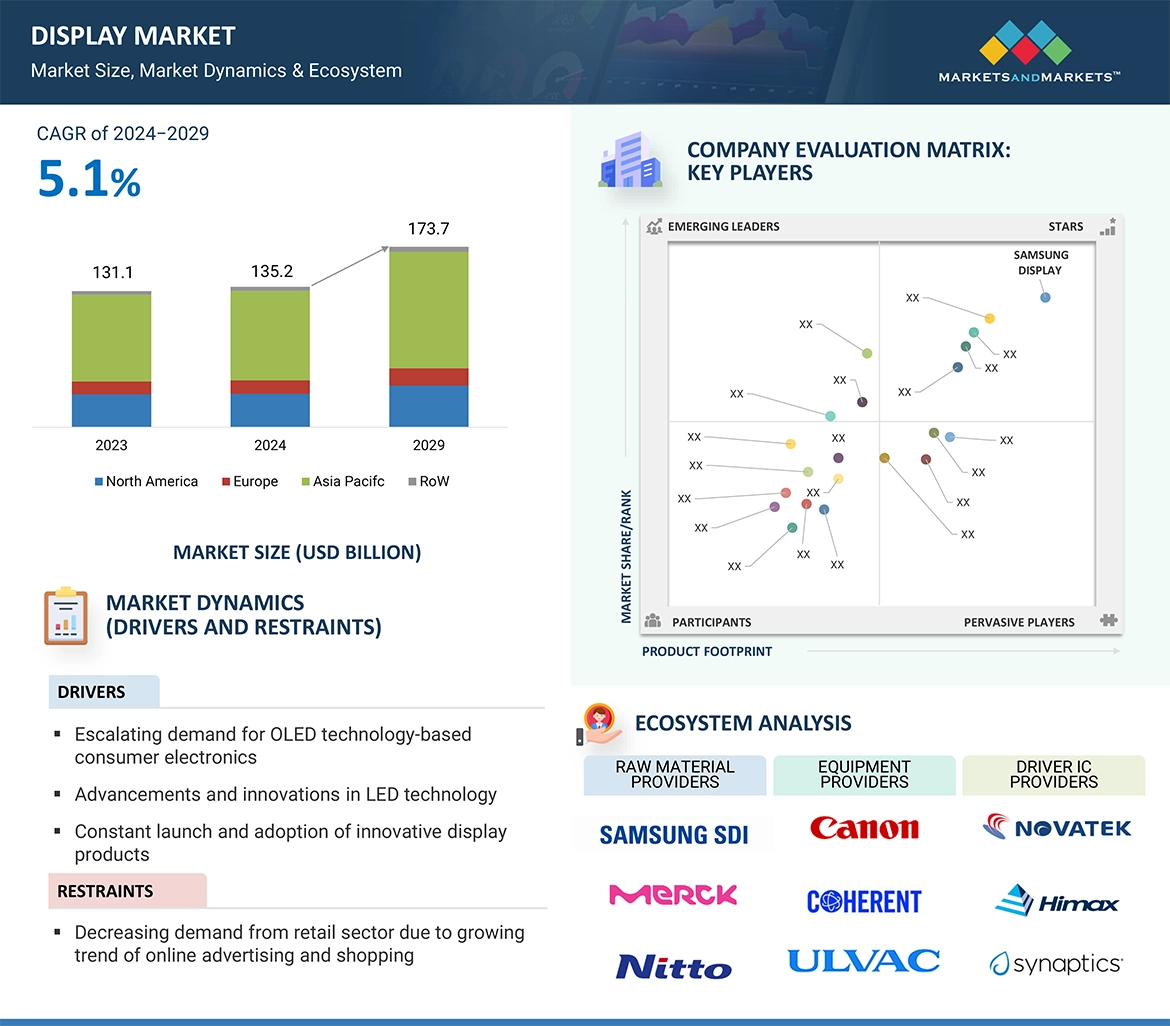
A display is an output device that provides textual, pictorial or graphical information. Display panels are used in devices such as televisions (TVs), personal computers (PCs), digital signage, smartphones, and wearables. Display panels are available in various types, such as rigid panels, flexible panels, and transparent panels, and utilize different technologies, such as liquid crystal display (LCD), organic light-emitting diode (OLED), microLED, direct-view LED, and quantum dot display.
Displays act as dynamic information-sharing devices in diverse sectors, including retail, transportation, healthcare, and education. Typically, they find applications in various consumer devices and automotive systems. Furthermore, displays are an integral part of restaurants, hospitality facilities, medical centers, or service industry’s point-of-sale systems. They are used for wayfinding and self-check-in; they also provide users with access to information such as patient details and product availability at a store.

Key Stakeholders

  • Display Panel Manufacturers
  • Semiconductor Component Suppliers/Foundries
  • Display Material and Component Suppliers
  • Manufacturing Equipment Suppliers
  • System Integrators/OSAT
  • Technology/IP Developers
  • Consulting and Market Research Service Providers
  • Display and Material-related Associations, Organizations, Forums, and Alliances
  • Venture Capitalists and Startups
  • Research and Educational Institutes
  • Distributors and Resellers
  • End Users

The main objectives of this study are as follows:

  • To define, analyze, and forecast the display market size, by display technology, panel size, product type, and vertical, in terms of value
  • To define, analyze, and forecast the display market size, by display technology, in terms of volume
  • To forecast the market size for various segments with respect to four main regions, namely, North America, Europe, Asia Pacific, and Rest of the World
  • To provide detailed information regarding the major drivers, restraints, opportunities, and challenges influencing the growth of the display market
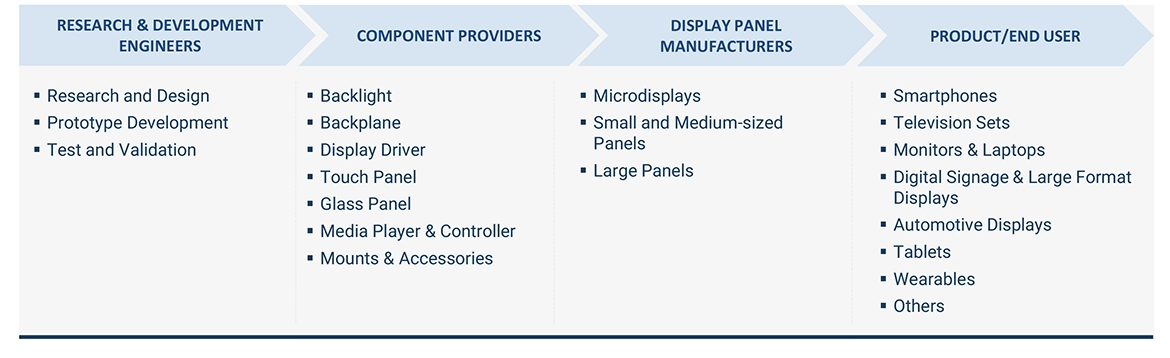
  • To study the complete value chain and related industry segments for the display market
  • To strategically analyze the micromarkets with respect to individual growth trends, prospects, and contributions to the total market
  • To analyze trends and disruptions; pricing trends; patents and innovations; trade data (export and import data); regulatory environment; Porter’s five forces analysis; case studies; key stakeholders & buying criteria; technology trends; the market ecosystem; and key conferences and events related to the display market
  • To analyze opportunities in the market for various stakeholders by identifying the high-growth segments of the market
  • To strategically profile the key players and comprehensively analyze their market position in terms of ranking and core competencies, along with detailing the competitive landscape for the market leaders
  • To analyze competitive developments such as product launches/developments, expansions, acquisitions, partnerships, collaborations, agreements, and research and development (R&D) activities carried out by players in the display market

Available Customizations:

With the given market data, MarketsandMarkets offers customizations according to the specific requirements of companies. The following customization options are available for the report:

Country-wise Information:

  • Country-wise breakdown for North America, Europe, Asia Pacific, and Rest of the World

Company Information:

  • Detailed analysis and profiling of additional market players (up to five)
Custom Market Research Services

We will customize the research for you, in case the report listed above does not meet with your exact requirements. Our custom research will comprehensively cover the business information you require to help you arrive at strategic and profitable business decisions.

Request Customization

Instant Answers with GPT - Ask Now!

Ask real questions. Get complete answers !
Report Code
SE 3387
Published ON
May, 2023
Choose License Type
BUY NOW
  • SHARE
X
Request Customization
Speak to Analyst
Speak to Analyst
OR FACE-TO-FACE MEETING
PERSONALIZE THIS RESEARCH
  • Triangulate with your Own Data
  • Get Data as per your Format and Definition
  • Gain a Deeper Dive on a Specific Application, Geography, Customer or Competitor
  • Any level of Personalization
REQUEST A FREE CUSTOMIZATION
LET US HELP YOU!
  • What are the Known and Unknown Adjacencies Impacting the Display Market
  • What will your New Revenue Sources be?
  • Who will be your Top Customer; what will make them switch?
  • Defend your Market Share or Win Competitors
  • Get a Scorecard for Target Partners
CUSTOMIZED WORKSHOP REQUEST
+1-888-600-6441
  • Call Us
  • +1-888-600-6441 (Corporate office hours)
  • +1-888-600-6441 (US/Can toll free)
  • +44-800-368-9399 (UK office hours)
CONNECT WITH US
ABOUT TRUST ONLINE
©2024 MarketsandMarkets Research Private Ltd. All rights reserved
DMCA.com Protection Status Website Feedback