Direct Air Capture Market

Direct Air Capture Market by Technology (Solid-DAC (S-DAC), Liquid-DAC (L-DAC), Electrochemical-DAC (E-DAC)), Source, Application (Carbon Capture and Storage (CCS), Carbon Capture (CC), Utilization, and Storage) Region - Global Forecast to 2030

Report Code: EP 8933 Feb, 2024, by marketsandmarkets.com

[160 Pages Report] The global direct air capture market in terms of revenue was estimated to be worth $62 million in 2023 and is poised to reach $1,727 million by 2030, growing at a CAGR of 60.9% from 2023 to 2030. Several factors driving the market are - more stringent government regulations and increased interest in synthetic fuels for environmental benefits in carbon reduction. Globally, governments are making strides to achieve a net-zero emission target. Over 140 major carbon-polluting countries, including China, US, and India, have promised to reach net-zero emissions by mid-century in 2050. The increased focus on net-zero emissions allows for an earlier investment opportunity for the developers of DAC solutions.

Direct Air Capture Market

To know about the assumptions considered for the study, Request for Free Sample Report

Direct Air Capture Market

To know about the assumptions considered for the study, download the pdf brochure

Direct Air Capture Market Dynamics

Driver: Increasing emphasis on  global net zero emission goals

The increasing global pressures on the environment, most notably carbon dioxide emissions are estimated to contribute nearly 76 percent of global greenhouse gas emission estimates, are a collective move toward influencing a global movement in adopting Direct Air Capture systems. In 2022, the Global Monitoring Lab in the National Oceanic and Atmospheric Administration (NOAA) announced the average atmosphere carbon dioxide grew to 417.06 parts per million "ppm", an increase of 2.13 ppm from the previous year.  Governments are acting to reach net-zero emissions. More than 140 countries, several of whom are among the highest contributors to pollution (such as China, the United States, India, and the European Union), are committed to reach net-zero emissions by 2050. The strong movement toward net-zero emissions (which requires not only emissions reduction, but also active removal of CO2) provides proper conditions for the viability of Direct Air Capture (DAC) systems to be adopted and succeed.

Restraint: Infrastructural Hurdles to Scaling Up Direct Air Capture

Transportation and storage infrastructure also serves as the backbone of the carbon management industry - Pipelines are workable at a commercial scale in theory, and they are currently commercially deployed in a limited manner. There are pipeline projects specifically for CO2 that the International Energy Agency (IEA) projects will be able to reach surplus CO2 capacity of greater than 420 million metric tons (Mt) in projected storage by 2030. Nonetheless, the total does represent improvement, but it is insufficient to meet the estimated storage need of 1,200 million metric tons (Mt) of CO2 storage by 2030 in the Net Zero Emissions (NZE) Scenario.

Opportunities: Expansion of the utilization of Direct Air Capture (DAC) on a larger scale.

Globally, twenty-seven Direct Air Capture (DAC) plants have been commissioned, collectively capturing nearly 0.01 million metric tons of CO2 annually. Presently, there are plans for at least 130 DAC facilities at various stages of development. Projections indicate that DAC technologies are poised to capture over 85 million tons of CO2 by 2030 and a substantial 980 million tons of CO2 by 2050. Governments worldwide are actively supporting DAC technologies as part of their strategies to achieve net-zero emission goals, creating an opportunity for the technology to be scaled up on a larger magnitude. In line with this trend, Carbon Engineering ULC is set to establish a plant in 2025 with the capacity to capture up to 1 million metric tons of CO2 annually.

Challenges: High cost of direct air capture technology

Direct Air Capture (DAC) utilizes clean energy sources, such as wind and solar, to remove the CO2 already in the atmosphere, but, compared to other CO2 removal techniques, it remains relatively expensive. DAC involves separating CO2, which is energy intensive, and is a newer technology and so there are fewer projects and companies engaged, contributing to cost issues associated with DAC. According to the World Resource Institute (WRI), the costs associated with capturing CO2 from the atmosphere via DAC are between USD 250 - USD 600, with cost variation dependent on the technology utilized, the use of low carbon energy, and the deployment scale. Even though DAC has current cost barriers, new technology could spur usage and cause considerable reductions in costs.

Direct Air Capture Market Ecosystem

In this market, few companies stand out as established and financially stable providers of direct air capture technology. With years of experience, these companies boast a diverse product portfolio, cutting-edge technologies, and robust global sales and marketing networks. Their proven track record in the industry positions them as reliable and trusted partners for customers seeking direct air capture solutions. These companies have demonstrated their ability to adapt to market dynamics and consistently deliver high-quality products and services, making them leaders in meeting the demands of the oil and gas sector. Companies in this market include Climeworks (Switzerland), Carbon Engineering ULC. (Canada), Global Thermostat (US), Heirloom Carbon Technologies (US), Skytree (Netherlands).

Direct Air Capture Market Ecosystem

The Liquid-DAC (L-DAC), by technology, is expected to be the largest market during the forecast period.

This report segments the direct air capture market based on technology into different types: Solid-DAC (S-DAC), Liquid-DAC (L-DAC), Electrochemical-DAC (E-DAC) and others. The Liquid-DAC (L-DAC) segment accounted to be the most dominating segment in the forecast period. In the Liquid-Direct Air Capture (L-DAC) process, that also CO2 was captured by the sorbents at low-temperature, but L-DAC still is in the first order of technologies, the operational activities are still performed at the lowest price and the fuel is the standard one. Solid DAC has a modular design; it is constructed using small, stackable modules, which results in lower initial deployment costs and facilitates gradual scalability. The flexibility to scale up or down easily makes it a well-suited technology for various applications, from capturing emissions in small industrial facilities to removing atmospheric CO2 in large-scale projects.

By application, carbon, capture and storage (CCS) is expected to be the largest growing during the forecast period.

This report segments the direct air capture market based on phase into two segments: Carbon capture, and storage (CCS) and carbon capture, utilization, and storage (CCUS). The carbon capture, and storage is expected to be the fastest and largest growing during the forecast period. The growth is attributed by the adoption of Carbon mineralization, which involves the permanent removal of carbon dioxide by converting it into a solid mineral form, usually a carbonate, through a chemical reaction with specific rocks. Carbon capture, utilization, and storage (CCUS) are the direct air capture process used for synthetic fuels, i.e., Power-to-X. The synthetic fuels are expected to be one of the top contributors to the aviation sector, providing ~40% of the aviation fuel demand. Predictions state that by 2070, at least ~20% of CO2 absorbed from bioenergy sources or caught directly from the atmosphere will be utilized in combination with clean hydrogen to generate synthetic hydrocarbon fuels.

“North America: The largest region in the direct air capture market.”

North America is poised to be the largest region of the direct air capture market forecast (2023-2030), followed by Europe. North America's primary role is firmly bolstered by clear policies and market-driven activities. The role of US Department of Energy support, particularly in regards to programs such as the The Regional Direct Air Capture (DAC) Hubs program, serves a firm basis for North America's market leader position. Under this program, US will develop four regional direct air capture hubs. Furthermore, policy frameworks have been put in place to encourage the deployment of DAC such as 45 Q tax credit and California low Carbon Fuel Standard.The regional market is experiencing growth due to the presence of leading solution providers like Global Thermostat (US), Carbon Engineering ULC. (Canada) and Heirloom Carbon Technologies (US).

In Europe, the net ambitious objectives committed to by the UK and the demand for CO2 in vertical farms in the Netherlands are largely behind the development of the market. The UK government has also established commitments of reducing direct emissions from public sector buildings by 50% by 2032 and by 75% by 2037, based on a 2017 baseline. The UK government will be required to utilize technologies, like direct air capture, which effectively captures pre-existing CO2 in the environment, in order to meet these targets.

North American Direct Air Capture Market Size, and Share

Key Market Players

The direct air capture (DAC) market is dominated by a few major players that have a wide regional presence. The major players in the direct air capture market include Climeworks (Switzerland), Carbon Engineering ULC. (Canada), Global Thermostat (US), Heirloom Carbon Technologies (US), Skytree (Netherlands). Between 2019 and 2023, Strategies such as new product launches, contracts, agreements, and expansions are followed by these companies to capture a larger direct air capture market share.

Want to explore hidden markets that can drive new revenue in Direct Air Capture Market?

Scope of the Report

Report Metric

Details

Market size available for years

2021–2030

Base year considered

2022

Forecast period

2023–2030

Forecast units

Value (USD Million/Billion)

Segments Covered

Direct Air Capture Market by Technology, Application, source, and Region.

Geographies covered

North America, Europe, Middle East & Africa, and Rest of the world.  

Companies covered

Climeworks(Switzerland), Carbon Engineering ULC.(Canada), Global thermostat (US), Heirloom Carbon Technologies(US), and Soletair Power (Finland), CarbonCapture Inc.(US), Avnos, Inc. (US), Noya PBC (US), Skytree (Netherlands), RepAir (Israel), MISSION ZERO TECHNOLOGIES (England, Carbyon (Netherlands), Octavia carbon (Kenya), Capture6 (US), Sustaera Inc. (US), Spiritus (US), Infinitree LLC (US), Mosaic Materials Inc. (US), Carbon Collect Limited (Ireland), Immaterial ( England), and Southern Green Gas Limited (Australia)

This research report categorizes the market based on technology, application, source, and region.

On the basis of technology, the market has been segmented as follows:
  • Solid-DAC (S-DAC)
  • Liquid-DAC (L-DAC)
  • Electrochemical-DAC (E-DAC)
On the basis of application, the market has been segmented as follows:
  • Carbon Capture, and Storage (CCS)
  • Carbon Capture, Utilization and Storage (CCUS)
On the basis of source, the market has been segmented as follows:
  • Electricity
  • Heat
On the basis of region, the market has been segmented as follows:
  • North America
  • Europe
  • Rest of the world

Recent Developments

  • In September 2023, Climeworks collaborated with Great Carbon valley, a pioneering Kenyan systems integrator and project development venture to explore the development of large-scale projects.
  • In November 2023, Heirloom Carbon Technologies signed an agreement with CarbonCure, a manufacturer of carbon removal or carbon utilization technologies  to capture CO2 from the atmosphere and permanently embed it in concrete. Under this agreement CarbonCure permanently store CO2 captured by Heirloom’s DAC facilities in nearby concrete plants.
  • In October 2022, Carbon Capture, Inc. and Fluor Corporation entered into a contract. Under this contract, Fluor Corporation, a leading global engineering, procurement, and construction (EPC) firm provides engineering and project integration services for Project Bison
  • In July 2021, Carbon Engineering ULC. and Lanza Tech, carbon recycling technology provider entered into partnership to generate sustainable aviation fuel (SAF) from atmospheric carbon dioxide (CO2), which is known as Project AtmosFUEL. The project will produce more than 100 million litres of SAF each year, once operational by the year 2031.

Frequently Asked Questions (FAQ):

To speak to our analyst for a discussion on the above findings, click Speak to Analyst

Exclusive indicates content/data unique to MarketsandMarkets and not available with any competitors.

INTRODUCTION
20
RESEARCH METHODOLOGY
25
EXECUTIVE SUMMARY
35
PREMIUM INSIGHTS
38
MARKET OVERVIEW
41
  • 5.1 INTRODUCTION
  • 5.2 MARKET DYNAMICS
    DRIVERS
    - Rising emphasis on achieving net-zero emission targets
    - Escalating adoption of CO2 in enhanced oil recovery process
    - Increasing investment in carbon capture and sequestration technologies
    RESTRAINTS
    - Limited network of carbon capture pipelines and storage capacity
    - High cost of carbon separation process
    OPPORTUNITIES
    - Increasing research on different DAC techniques
    - Rising focus on establishing large-scale DAC facilities
    CHALLENGES
    - High energy consumption by DAC facilities
    - Availability of alternate carbon capture technologies
  • 5.3 TRENDS/DISRUPTIONS IMPACTING CUSTOMERS’ BUSINESSES
  • 5.4 PRICING ANALYSIS
    INDICATIVE PRICING ANALYSIS OF DIRECT AIR CAPTURE TECHNOLOGY
  • 5.5 SUPPLY CHAIN ANALYSIS
    RAW MATERIAL SUPPLIERS
    COMPONENT MANUFACTURERS/ASSEMBLERS
    DISTRIBUTORS/END USERS
  • 5.6 ECOSYSTEM/MARKET MAP
  • 5.7 REGULATORY LANDSCAPE
    REGULATORY BODIES, GOVERNMENT AGENCIES, AND OTHER ORGANIZATIONS
    REGULATIONS
    - North America
    - Europe
    - RoW
  • 5.8 PATENT ANALYSIS
  • 5.9 CASE STUDY ANALYSIS
    GROWY ADOPTED SKYTREE’S COMPACT DAC TECHNOLOGY TO INCREASE SUSTAINABILITY OF VERTICAL FARMING OPERATIONS
    ZBT INSTALLED SOLETAIR POWER’S OUTDOOR DAC SYSTEM TO ENABLE EFFICIENT CARBON CAPTURE AND UTILIZATION
  • 5.10 TECHNOLOGY ANALYSIS
    SOLID DAC
    LIQUID DAC
    MEMBRANE-BASED DAC
    ELECTROCHEMICAL DAC
    OPERATING TEMPERATURE OF DAC
  • 5.11 KEY CONFERENCES AND EVENTS, 2023–2024
  • 5.12 TRADE ANALYSIS
    EXPORT SCENARIO
    IMPORT SCENARIO
  • 5.13 PORTER’S FIVE FORCES ANALYSIS
    THREAT OF SUBSTITUTES
    BARGAINING POWER OF SUPPLIERS
    BARGAINING POWER OF BUYERS
    THREAT OF NEW ENTRANTS
    INTENSITY OF COMPETITIVE RIVALRY
  • 5.14 KEY STAKEHOLDERS AND BUYING CRITERIA
    KEY STAKEHOLDERS IN BUYING PROCESS
    BUYING CRITERIA
DIRECT AIR CAPTURE MARKET, BY TECHNOLOGY
64
  • 6.1 INTRODUCTION
  • 6.2 SOLID DAC
    HIGH SUSTAINABILITY OF SOLID DAC TECHNOLOGY TO DRIVE DEMAND
  • 6.3 LIQUID DAC
    EXTENDED CAPTURE CAPACITY OF LIQUID DAC TO FUEL DEMAND
  • 6.4 ELECTROCHEMICAL DAC
    HIGH ENERGY EFFICIENCY ASSOCIATED WITH ELECTROCHEMICAL DAC IN CAPTURING CO2 TO DRIVE DEMAND
  • 6.5 OTHERS
DIRECT AIR CAPTURE MARKET, BY ENERGY SOURCE
67
  • 7.1 INTRODUCTION
  • 7.2 ELECTRICITY
    RISING DEMAND FOR ELECTROCHEMICAL DAC TECHNOLOGY TO DRIVE MARKET
    GEOTHERMAL
    SOLAR PV
    WIND
  • 7.3 HEAT
    INCREASING REQUIREMENT FOR HEAT IN REGENERATION OF SORBENTS TO DRIVE MARKET
    HEAT PUMP
    DIRECT HEAT
    WASTE HEAT
DIRECT AIR CAPTURE MARKET, BY APPLICATION
71
  • 8.1 INTRODUCTION
  • 8.2 CARBON CAPTURE AND STORAGE
    IMPLEMENTATION OF SUPPORTIVE GREENHOUSE EMISSION REDUCTION ACTS AND SUBSIDIES TO STORE CO2 TO DRIVE MARKET
  • 8.3 CARBON CAPTURE, UTILIZATION, AND STORAGE
    GROWING DEMAND FOR SYNTHETIC FUELS AND GREEN FERTILIZERS TO DRIVE MARKET
END-USER INDUSTRIES OF CO2 CAPTURED BY DIRECT AIR CAPTURE (DAC) TECHNOLOGY
74
  • 9.1 INTRODUCTION
  • 9.2 AGRICULTURE
    GROWING POPULATION TO DRIVE DEMAND
  • 9.3 CHEMICALS & FUELS
    INCREASING DEMAND FOR SYNTHETIC FUELS TO DRIVE MARKET
  • 9.4 CARBON MINERALIZATION
    GROWING FOCUS ON INSTALLING LARGE-SCALE DAC PLANTS TO DRIVE MARKET
  • 9.5 FOOD & BEVERAGES
    INCREASING DEMAND FOR BEVERAGES AND FROZEN FOOD PRODUCTS TO FUEL MARKET GROWTH
  • 9.6 OIL & GAS
    GROWING NEED FOR ENHANCED OIL RECOVERY (EOR) TO DRIVE MARKET
  • 9.7 OTHER END-USER INDUSTRIES
DIRECT AIR CAPTURE MARKET, BY REGION
77
  • 10.1 INTRODUCTION
  • 10.2 NORTH AMERICA
    NORTH AMERICAN DAC MARKET: RECESSION IMPACT
    NORTH AMERICA: KEY DAC PROJECTS
    BY COUNTRY
    - US
    - Canada
  • 10.3 EUROPE
    EUROPEAN DAC MARKET: RECESSION IMPACT
    EUROPE: KEY DAC PROJECTS
    BY COUNTRY
    - UK
    - Switzerland
    - Iceland
    - Netherlands
    - Rest of Europe
  • 10.4 ROW
    ROW DAC MARKET: RECESSION IMPACT
    ROW: KEY DAC PROJECTS
    MIDDLE EAST & AFRICA
    - By country
    ASIA PACIFIC
    - By country
    SOUTH AMERICA
    - By country
COMPETITIVE LANDSCAPE
95
  • 11.1 OVERVIEW
  • 11.2 STRATEGIES ADOPTED BY KEY PLAYERS, 2019–2023
  • 11.3 MARKET SHARE ANALYSIS, 2022
  • 11.4 MARKET EVALUATION FRAMEWORK, 2019–2023
  • 11.5 COMPANY EVALUATION MATRIX, 2022
    STARS
    EMERGING LEADERS
    PERVASIVE PLAYERS
    PARTICIPANTS
    COMPANY FOOTPRINT
    - Technology footprint
    - Energy source footprint
    - Regional footprint
    - Overall footprint
  • 11.6 START-UP/SME EVALUATION MATRIX, 2022
    PROGRESSIVE COMPANIES
    RESPONSIVE COMPANIES
    DYNAMIC COMPANIES
    STARTING BLOCKS
    COMPETITIVE BENCHMARKING
    - List of key start-ups/SMEs
    - Competitive benchmarking of start-ups/SMEs
  • 11.7 COMPETITIVE SCENARIOS AND TRENDS
    PRODUCT LAUNCHES
    DEALS
    EXPANSIONS
    OTHERS
COMPANY PROFILES
110
  • 12.1 KEY PLAYERS
    CLIMEWORKS
    - Business overview
    - Products/Solutions/Services offered
    - Recent developments
    - MnM view
    CARBON ENGINEERING ULC.
    - Business overview
    - Products/Solutions/Services offered
    - Recent developments
    - MnM view
    GLOBAL THERMOSTAT
    - Business overview
    - Products/Solutions/Services offered
    - Recent developments
    - MnM view
    HEIRLOOM CARBON TECHNOLOGIES
    - Business overview
    - Products/Solutions/Services offered
    - Recent developments
    - MnM view
    SOLETAIR POWER
    - Business overview
    - Products/Solutions/Services offered
    - Recent developments
    - MnM view
    CARBONCAPTURE INC.
    - Business overview
    - Products/Solutions/Services offered
    - Recent developments
    AVNOS, INC.
    - Business overview
    - Products/Solutions/Services offered
    - Recent developments
    NOYA PBC
    - Business overview
    - Products/Solutions/Services offered
    - Recent developments
    SKYTREE
    - Business overview
    - Products/Solutions/Services offered
    - Recent developments
    REPAIR CARBON
    - Business overview
    - Products/Solutions/Services offered
    MISSION ZERO TECHNOLOGIES
    - Business overview
    - Products/Solutions/Services offered
    - Recent developments
    CARBYON
    - Business overview
    - Products/Solutions/Services offered
    - Recent developments
    OCTAVIA CARBON
    - Business overview
    - Products/Solutions/Services offered
    - Recent developments
    CAPTURE6
    - Business overview
    - Products/Solutions/Services offered
    - Recent developments
    SUSTAERA INC.
    - Business overview
    - Products/Solutions/Services offered
    - Recent developments
  • 12.2 OTHER PLAYERS
    SPIRITUS
    INFINITREE LLC
    MOSAIC MATERIALS INC.
    CARBON COLLECT LIMITED
    IMMATERIAL
    SOUTHERN GREEN GAS LIMITED
APPENDIX
147
  • 13.1 INSIGHTS FROM INDUSTRY EXPERTS
  • 13.2 DISCUSSION GUIDE
  • 13.3 KNOWLEDGESTORE: MARKETSANDMARKETS’ SUBSCRIPTION PORTAL
  • 13.4 CUSTOMIZATION OPTIONS
  • 13.5 RELATED REPORTS
  • 13.6 AUTHOR DETAILS
LIST OF TABLES
 
  • TABLE 1 DIRECT AIR CAPTURE MARKET SNAPSHOT
  • TABLE 2 INDICATIVE PRICING ANALYSIS OF DIRECT AIR CAPTURE TECHNOLOGY, 2021–2030 (USD/TON)
  • TABLE 3 ROLE OF COMPANIES IN DIRECT AIR CAPTURE ECOSYSTEM
  • TABLE 4 NORTH AMERICA: LIST OF REGULATORY BODIES, GOVERNMENT AGENCIES, AND OTHER ORGANIZATIONS
  • TABLE 5 EUROPE: LIST OF REGULATORY BODIES, GOVERNMENT AGENCIES, AND OTHER ORGANIZATIONS
  • TABLE 6 ROW: LIST OF REGULATORY BODIES, GOVERNMENT AGENCIES, AND OTHER ORGANIZATIONS
  • TABLE 7 MARKET: LIST OF MAJOR PATENTS, 2018–2022
  • TABLE 8 MARKET: LIST OF CONFERENCES AND EVENTS, 2023–2024
  • TABLE 9 EXPORT DATA FOR HS CODE 281121-COMPLIANT CARBON DIOXIDE, BY COUNTRY, 2020–2022 (USD THOUSAND)
  • TABLE 10 IMPORT DATA FOR HS CODE 281121-COMPLIANT CARBON DIOXIDE, BY COUNTRY, 2020–2022 (USD THOUSAND)
  • TABLE 11 DIRECT AIR CAPTURE MARKET: PORTER’S FIVE FORCES ANALYSIS
  • TABLE 12 MARKET: INFLUENCE OF STAKEHOLDERS ON BUYING PROCESS, BY APPLICATION (%)
  • TABLE 13 MARKET: KEY BUYING CRITERIA, BY APPLICATION
  • TABLE 14 MARKET, BY TECHNOLOGY, 2021–2030 (USD MILLION)
  • TABLE 15 MARKET, BY ENERGY SOURCE, 2021–2030 (USD MILLION)
  • TABLE 16 MARKET, BY APPLICATION, 2023–2030 (USD MILLION)
  • TABLE 17 MARKET, BY REGION, 2021–2030 (KILO TONS)
  • TABLE 18 MARKET, BY REGION, 2021–2030 (USD MILLION)
  • TABLE 19 KEY DAC PROJECTS IN NORTH AMERICA
  • TABLE 20 US: CO2 EMISSION, 2015–2022 (MILLION TONS)
  • TABLE 21 US: INSTALLED RENEWABLE ENERGY CAPACITY, BY SOURCE, 2018–2022 (MW)
  • TABLE 22 CANADA: CO2 EMISSION, 2015–2022 (MILLION TONS)
  • TABLE 23 CANADA: INSTALLED RENEWABLE ENERGY CAPACITY, BY SOURCE, 2018–2022 (MW)
  • TABLE 24 KEY DAC PROJECTS IN EUROPE
  • TABLE 25 UK: CO2 EMISSION, 2015–2022 (MILLION TONS)
  • TABLE 26 UK: INSTALLED RENEWABLE ENERGY CAPACITY, BY SOURCE, 2018–2022 (MW)
  • TABLE 27 SWITZERLAND: CO2 EMISSION, 2015–2022 (MILLION TONS)
  • TABLE 28 SWITZERLAND: INSTALLED RENEWABLE ENERGY CAPACITY, BY SOURCE, 2018–2022 (MW)
  • TABLE 29 ICELAND: CO2 EMISSION, 2015–2022 (MILLION TONS)
  • TABLE 30 ICELAND: INSTALLED RENEWABLE ENERGY CAPACITY, BY SOURCE, 2018–2022 (MW)
  • TABLE 31 NETHERLANDS: CO2 EMISSION, 2015–2022 (MILLION TONS)
  • TABLE 32 NETHERLANDS: INSTALLED RENEWABLE ENERGY CAPACITY, BY SOURCE, 2018–2022 (MW)
  • TABLE 33 ROW: DIRECT AIR CAPTURE MARKET, BY REGION, 2021–2030 (USD MILLION)
  • TABLE 34 KEY DAC PROJECTS IN ROW
  • TABLE 35 SAUDI ARABIA: CO2 EMISSION, 2015–2022 (MILLION TONS)
  • TABLE 36 SAUDI ARABIA: INSTALLED RENEWABLE ENERGY CAPACITY, BY SOURCE, 2018–2022 (MW)
  • TABLE 37 UAE: CO2 EMISSION, 2015–2022 (MILLION TONS)
  • TABLE 38 UAE: INSTALLED RENEWABLE ENERGY CAPACITY, BY SOURCE, 2018–2022 (MW)
  • TABLE 39 ISRAEL: CO2 EMISSION, 2015–2022 (MILLION TONS)
  • TABLE 40 ISRAEL: INSTALLED RENEWABLE ENERGY CAPACITY, BY SOURCE, 2018–2022 (MW)
  • TABLE 41 KENYA: CO2 EMISSION, 2015–2022 (MILLION TONS)
  • TABLE 42 KENYA: INSTALLED RENEWABLE ENERGY CAPACITY, BY SOURCE, 2018–2022 (MW)
  • TABLE 43 SOUTH AFRICA: CO2 EMISSION, 2015–2022 (MILLION TONS)
  • TABLE 44 SOUTH AFRICA: INSTALLED RENEWABLE ENERGY CAPACITY, BY SOURCE, 2018–2022 (MW)
  • TABLE 45 AUSTRALIA: CO2 EMISSION, 2015–2022 (MILLION TONS)
  • TABLE 46 AUSTRALIA: INSTALLED RENEWABLE ENERGY CAPACITY, BY SOURCE, 2018–2022 (MW)
  • TABLE 47 CHINA: CO2 EMISSION, 2015–2022 (MILLION TONS)
  • TABLE 48 CHINA: INSTALLED RENEWABLE ENERGY CAPACITY, BY SOURCE, 2018–2022 (MW)
  • TABLE 49 JAPAN: CO2 EMISSION, 2015–2022 (MILLION TONS)
  • TABLE 50 JAPAN: INSTALLED RENEWABLE ENERGY CAPACITY, BY SOURCE, 2018–2022 (MW)
  • TABLE 51 BRAZIL: CO2 EMISSION, 2015–2022 (MILLION TONS)
  • TABLE 52 BRAZIL: INSTALLED RENEWABLE ENERGY CAPACITY, BY SOURCE, 2018–2022 (MW)
  • TABLE 53 CHILE: CO2 EMISSION, 2015–2022 (MILLION TONS)
  • TABLE 54 CHILE: INSTALLED RENEWABLE ENERGY CAPACITY, BY SOURCE 2018–2022 (MW)
  • TABLE 55 DIRECT AIR CAPTURE MARKET: OVERVIEW OF STRATEGIES ADOPTED BY KEY PLAYERS, 2019–2023
  • TABLE 56 MARKET EVALUATION FRAMEWORK, 2019–2023
  • TABLE 57 COMPANY TECHNOLOGY FOOTPRINT (4 KEY PLAYERS)
  • TABLE 58 COMPANY ENERGY SOURCE FOOTPRINT (4 KEY PLAYERS)
  • TABLE 59 COMPANY ENERGY SOURCE FOOTPRINT
  • TABLE 60 COMPANY REGION FOOTPRINT (4 KEY PLAYERS)
  • TABLE 61 MARKET: LIST OF KEY START-UPS/SMES
  • TABLE 62 MARKET: COMPETITIVE BENCHMARKING OF START-UPS/SMES
  • TABLE 63 MARKET: PRODUCT LAUNCHES, SEPTEMBER 2023
  • TABLE 64 MARKET: DEALS, MAY 2019–OCTOBER 2023
  • TABLE 65 MARKET: EXPANSIONS, OCTOBER 2019–JUNE 2023
  • TABLE 66 MARKET: OTHERS, JANUARY 2019 – DECEMBER 2022
  • TABLE 67 CLIMEWORKS: COMPANY OVERVIEW
  • TABLE 68 CLIMEWORKS: PRODUCTS/SOLUTIONS/SERVICES OFFERED
  • TABLE 69 CLIMEWORKS: DEALS
  • TABLE 70 CLIMEWORKS: OTHERS
  • TABLE 71 CARBON ENGINEERING ULC.: COMPANY OVERVIEW
  • TABLE 72 CARBON ENGINEERING ULC.: PRODUCTS/SOLUTIONS/SERVICES OFFERED
  • TABLE 73 CARBON ENGINEERING ULC.: DEALS
  • TABLE 74 CARBON ENGINEERING ULC.: OTHERS
  • TABLE 75 GLOBAL THERMOSTAT: COMPANY OVERVIEW
  • TABLE 76 GLOBAL THERMOSTAT: PRODUCTS/SOLUTIONS/SERVICES OFFERED
  • TABLE 77 GLOBAL THERMOSTAT: DEALS
  • TABLE 78 GLOBAL THERMOSTAT: OTHERS
  • TABLE 79 HEIRLOOM CARBON TECHNOLOGIES: COMPANY OVERVIEW
  • TABLE 80 HEIRLOOM CARBON TECHNOLOGIES: PRODUCTS/SOLUTIONS/SERVICES OFFERED
  • TABLE 81 HEIRLOOM CARBON TECHNOLOGIES: DEALS
  • TABLE 82 HEIRLOOM CARBON TECHNOLOGIES: OTHERS
  • TABLE 83 SOLETAIR POWER: COMPANY OVERVIEW
  • TABLE 84 SOLETAIR POWER: PRODUCTS/SOLUTIONS/SERVICES OFFERED
  • TABLE 85 SOLETAIR POWER: DEALS
  • TABLE 86 SOLETAIR POWER: OTHERS
  • TABLE 87 CARBONCAPTURE INC.: COMPANY OVERVIEW
  • TABLE 88 CARBONCAPTURE INC.: PRODUCTS/SOLUTIONS/SERVICES OFFERED
  • TABLE 89 CARBONCAPTURE INC.: DEALS
  • TABLE 90 CARBONCAPTURE INC.: OTHERS
  • TABLE 91 AVNOS, INC.: COMPANY OVERVIEW
  • TABLE 92 AVNOS, INC.: PRODUCTS/SOLUTIONS/SERVICES OFFERED
  • TABLE 93 AVNOS, INC.: OTHERS
  • TABLE 94 NOYA PBC: COMPANY OVERVIEW
  • TABLE 95 NOYA PBC: PRODUCTS/SOLUTIONS/SERVICES OFFERED
  • TABLE 96 NOYA PBC: DEALS
  • TABLE 97 SKYTREE: COMPANY OVERVIEW
  • TABLE 98 SKYTREE: PRODUCTS/SOLUTIONS/SERVICES OFFERED
  • TABLE 99 SKYTREE: PRODUCT LAUNCHES
  • TABLE 100 SKYTREE: DEALS
  • TABLE 101 REPAIR: COMPANY OVERVIEW
  • TABLE 102 REPAIR CARBON: PRODUCTS/SOLUTIONS/SERVICES OFFERED
  • TABLE 103 MISSION ZERO TECHNOLOGIES: COMPANY OVERVIEW
  • TABLE 104 MISSION ZERO TECHNOLOGIES: PRODUCTS/SOLUTIONS/SERVICES OFFERED
  • TABLE 105 MISSION ZERO TECHNOLOGIES: DEALS
  • TABLE 106 CARBYON: COMPANY OVERVIEW
  • TABLE 107 CARBYON: PRODUCTS/SOLUTIONS/SERVICES OFFERED
  • TABLE 108 CARBYON: DEALS
  • TABLE 109 OCTAVIA CARBON: COMPANY OVERVIEW
  • TABLE 110 OCTAVIA CARBON: PRODUCTS/SOLUTIONS/SERVICES OFFERED
  • TABLE 111 OCTAVIA CARBON: DEALS
  • TABLE 112 CAPTURE6: COMPANY OVERVIEW
  • TABLE 113 CAPTURE6: PRODUCTS/SOLUTIONS/SERVICES OFFERED
  • TABLE 114 CAPTURE6: DEALS
  • TABLE 115 SUSTAERA INC.: COMPANY OVERVIEW
  • TABLE 116 SUSTAERA INC.: PRODUCTS/SOLUTIONS/SERVICES OFFERED
  • TABLE 117 SUSTAERA INC.: DEALS
LIST OF FIGURES
 
  • FIGURE 1 MARKET SEGMENTATION
  • FIGURE 2 DIRECT AIR CAPTURE MARKET: RESEARCH DESIGN
  • FIGURE 3 DATA TRIANGULATION
  • FIGURE 4 DIRECT AIR CAPTURE MARKET SIZE ESTIMATION METHODOLOGY: BOTTOM-UP APPROACH
  • FIGURE 5 DIRECT AIR CAPTURE MARKET SIZE ESTIMATION METHODOLOGY: TOP-DOWN APPROACH
  • FIGURE 6 MAIN METRICS CONSIDERED TO ANALYZE DEMAND FOR DIRECT AIR CAPTURE SYSTEMS
  • FIGURE 7 INDUSTRY CONCENTRATION, 2022
  • FIGURE 8 NORTH AMERICA HELD LARGEST SHARE OF MARKET IN 2022
  • FIGURE 9 LIQUID DAC SEGMENT TO LEAD MARKET IN 2030
  • FIGURE 10 ELECTRICITY SEGMENT TO HOLD LARGER SHARE OF MARKET IN 2030
  • FIGURE 11 CARBON CAPTURE AND STORAGE SEGMENT TO DOMINATE MARKET IN 2030
  • FIGURE 12 GROWING NEED FOR CO2 IN ENHANCED OIL RECOVERY PROCESS TO CREATE LUCRATIVE OPPORTUNITIES FOR MARKET PLAYERS
  • FIGURE 13 EUROPEAN MARKET TO REGISTER HIGHEST CAGR DURING FORECAST PERIOD
  • FIGURE 14 LIQUID DAC SEGMENT TO ACCOUNT FOR LARGEST MARKET SHARE IN 2030
  • FIGURE 15 ELECTRICITY SEGMENT TO ACCOUNT FOR LARGER MARKET SHARE IN 2030
  • FIGURE 16 CARBON CAPTURE AND STORAGE SEGMENT TO HOLD LARGER MARKET SHARE IN 2030
  • FIGURE 17 DIRECT AIR CAPTURE MARKET: DRIVERS, RESTRAINTS, OPPORTUNITIES, AND CHALLENGES
  • FIGURE 18 GLOBAL CO2 EMISSION FROM ENERGY COMBUSTION AND INDUSTRIAL PROCESSES, 2012–2022
  • FIGURE 19 ENERGY REQUIREMENTS FOR SOLID DAC AND LIQUID DAC TECHNOLOGIES, 2023
  • FIGURE 20 TRENDS/DISRUPTIONS IMPACTING CUSTOMERS’ BUSINESSES
  • FIGURE 21 MARKET: SUPPLY CHAIN ANALYSIS
  • FIGURE 22 MARKET MAPPING
  • FIGURE 23 COMPANIES IN DIRECT AIR CAPTURE ECOSYSTEM
  • FIGURE 24 MARKET: PATENTS APPLIED AND GRANTED, 2012–2022
  • FIGURE 25 EXPORT DATA FOR HS CODE 2881121-COMPLIANT CARBON DIOXIDE, BY COUNTRY, 2020–2022 (USD THOUSAND)
  • FIGURE 26 IMPORT DATA FOR HS CODE 281121-COMPLIANT CARBON DIOXIDE, BY COUNTRY, 2020–2022 (USD THOUSAND)
  • FIGURE 27 DAC MARKET: PORTER’S FIVE FORCES ANALYSIS
  • FIGURE 28 INFLUENCE OF STAKEHOLDERS ON BUYING PROCESS, BY APPLICATION
  • FIGURE 29 KEY BUYING CRITERIA, BY APPLICATION
  • FIGURE 30 MARKET, BY TECHNOLOGY, 2022
  • FIGURE 31 MARKET, BY ENERGY SOURCE, 2022
  • FIGURE 32 MARKET, BY APPLICATION, 2022
  • FIGURE 33 GLOBAL CO2 EMISSIONS FROM TRANSPORTATION SECTOR, BY APPLICATION, 2012–2022
  • FIGURE 34 EUROPE TO WITNESS HIGHEST GROWTH DURING FORECAST PERIOD
  • FIGURE 35 MARKET, BY REGION, 2022
  • FIGURE 36 NORTH AMERICA: MARKET SNAPSHOT
  • FIGURE 37 EUROPE: MARKET SNAPSHOT
  • FIGURE 38 DIRECT AIR CAPTURE MARKET SHARE ANALYSIS, 2022
  • FIGURE 39 MARKET: COMPANY EVALUATION MATRIX, 2022
  • FIGURE 40 OVERALL COMPANY FOOTPRINT (4 KEY PLAYERS)
  • FIGURE 41 MARKET: START-UP/SME EVALUATION MATRIX, 2022


The study involved major activities in estimating the current size of the direct air capture market. Exhaustive secondary research was done to collect information on the peer and parent markets. The next step was to validate these findings, assumptions, and sizing with industry experts across the value chain through primary research. Both top-down and bottom-up approaches were employed to estimate the total market size. Thereafter, market breakdown and data triangulation were used to estimate the market size of the segments and subsegments.

Secondary Research

This research study on the dierect air capture market involved the use of extensive secondary sources, directories, and databases, such as Hoover’s, Bloomberg, Factiva, IRENA, International Energy Agency, and Statista Industry Journal, to collect and identify information useful for a technical, market-oriented, and commercial study of the market. The other secondary sources included annual reports, press releases & investor presentations of companies, white papers, certified publications, articles by recognized authors, manufacturer associations, trade directories, and databases.

Primary Research

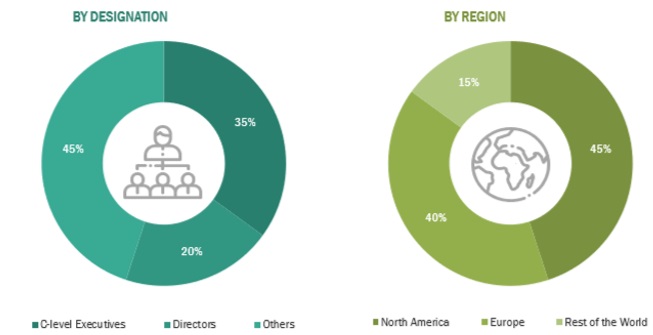
The direct air captures market comprises several stakeholders, such as direct air capture manufacturers, technology providers, and technical support providers in the supply chain. The demand side of this market is characterized by the rising demand for direct air capture systems in various applications such as carbon capture, and storage (CCS), and carbon capture, utilization, and storage (CCUS). The supply side is characterized by rising demand for contracts from the industrial sector and mergers & acquisitions among big players. Various primary sources from both the supply and demand sides of the market were interviewed to obtain qualitative and quantitative information. Following is the breakdown of primary respondents:
Direct Air Capture Market Size, and Share

To know about the assumptions considered for the study, download the pdf brochure

Direct Air Capture Market Size Estimation

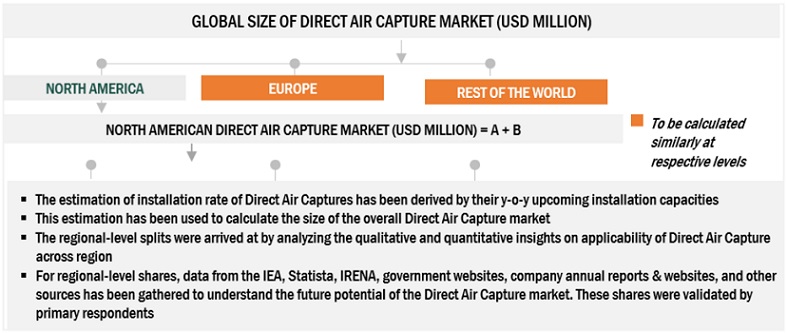
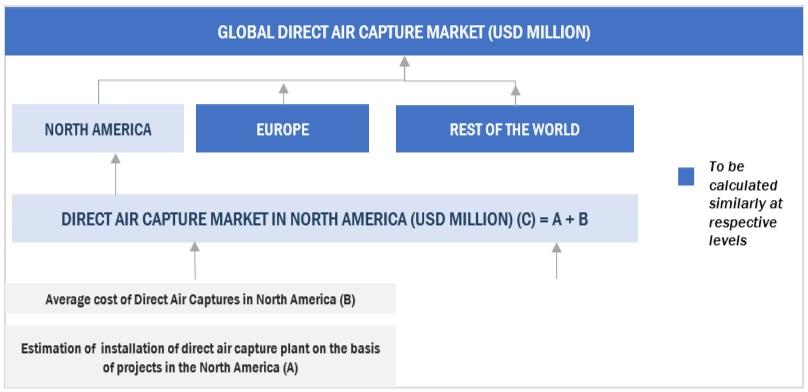
Both top-down and bottom-up approaches were used to estimate and validate the total size of the market. These methods were also used extensively to estimate the size of various subsegments in the market. The research methodology used to estimate the market size includes the following:

  • The key players in the industry and market have been identified through extensive secondary research, and their market share has been determined through primary and secondary research.
  • The industry’s value chain and market size, in terms of value, have been determined through both primary and secondary research processes.
  • All percentage shares, splits, and breakdowns have been determined using secondary sources and verified through primary sources.

Direct Air Capture Market Size: Top-Down Approach
Direct Air Capture Market Bottom Up Approach

To know about the assumptions considered for the study, Request for Free Sample Report

Direct Air Capture Market Size: Bottom-Up Approach
Direct Air Capture Market Top Down Approach

Data Triangulation

After arriving at the overall market size from the above estimation process, the total market has been split into several segments and subsegments. Data triangulation and market breakdown processes have been employed to complete the overall market engineering process and arrive at the exact statistics for all the segments and sub-segments, wherever applicable. The data has been triangulated by studying various factors and trends from both the demand- and supply sides. Along with this, the market has been validated using both the top-down and bottom-up approaches.

Market Definition

Direct Air Capture (DAC) is a technology designed to directly extract carbon dioxide (CO2) from the atmosphere, essentially extracting it directly from the air. The captured CO2 can then be securely stored underground or used in diverse applications, presenting a potent tool in combating climate change. When DAC is combined with renewable energy sources to drive the capture process, it has the potential to achieve negative emissions.

Key Stakeholders

  • Energy Regulators
  • Consulting companies in the energy and power sector
  • Institutional investors/shareholders
  • Governments and research organizations
  • Power equipment and garden tool manufacturers
  • Direct air capture technology providers
  • Spare parts and component suppliers

Objectives of the Study

  • To describe, segment, and forecast the direct air capture (DAC) market, by technology, energy source, and application in terms of value
  • To forecast the market across four key regions, namely, North America, Europe, and Rest of the World (RoW), in terms of value and volume
  • To provide detailed information about key drivers, restraints, opportunities, and challenges influencing the market
  • To strategically analyze the market with respect to individual growth trends, prospects, and contributions of each segment to the market
  • To analyze the supply chain, trends/disruptions impacting customer business, market/ecosystem, pricing trends, and regulatory landscape pertaining to solid oxide direct air captures
  • To strategically analyze micromarkets1 with respect to individual growth trends, expansions, and their contribution to the overall market
  • To analyze opportunities for stakeholders in the market and draw a competitive landscape for market players
  • To benchmark players within the market using the company evaluation matrix, which analyzes market players based on several parameters within the broad categories of business and product strategies
  • To analyze the key market players with respect to their market share, product specifications, and applications
  • To strategically profile the key players and comprehensively analyze their market ranking and core competencies2
  • To analyze competitive developments in the market, such as product launches, sales contracts, agreements, investments, expansions, partnerships, and collaborations

Available Customizations:

With the given market data, MarketsandMarkets offers customizations according to the specific requirements of companies. The following customization options are available for the report:

Product Analysis

  • Product Matrix, which provides a detailed comparison of the product portfolio of each company

Company Information

  • Detailed analyses and profiling of additional market players
Custom Market Research Services

We will customize the research for you, in case the report listed above does not meet with your exact requirements. Our custom research will comprehensively cover the business information you require to help you arrive at strategic and profitable business decisions.

Request Customization
Report Code
EP 8933
Published ON
Feb, 2024
Choose License Type
BUY NOW
  • SHARE
X
Request Customization
Speak to Analyst
Speak to Analyst
OR FACE-TO-FACE MEETING
PERSONALIZE THIS RESEARCH
  • Triangulate with your Own Data
  • Get Data as per your Format and Definition
  • Gain a Deeper Dive on a Specific Application, Geography, Customer or Competitor
  • Any level of Personalization
REQUEST A FREE CUSTOMIZATION
LET US HELP YOU!
  • What are the Known and Unknown Adjacencies Impacting the Direct Air Capture Market
  • What will your New Revenue Sources be?
  • Who will be your Top Customer; what will make them switch?
  • Defend your Market Share or Win Competitors
  • Get a Scorecard for Target Partners
CUSTOMIZED WORKSHOP REQUEST
knowledgestore logo

Want to explore hidden markets that can drive new revenue in Direct Air Capture Market?

Find Hidden Markets
  • Call Us
  • +1-888-600-6441 (Corporate office hours)
  • +1-888-600-6441 (US/Can toll free)
  • +44-800-368-9399 (UK office hours)
CONNECT WITH US
ABOUT TRUST ONLINE
©2024 MarketsandMarkets Research Private Ltd. All rights reserved
DMCA.com Protection Status
Website Feedback