Digital Radar Market

Digital Radar Market by Type (Active and Passive), Dimension (2D, 3D and 4D), Application (Safety, Security and Surveillance), Vertical (Automotive, Aerospace, Military and Defense) and Region - Global Forecast to 2029

Report Code: SE 9078 Jul, 2024, by marketsandmarkets.com

[216 Pages Report] The digital radar market is projected to grow from USD 5.9 billion in 2024 and is expected to reach USD 13.7 billion by 2029, growing at a CAGR of 18.2% from 2024 to 2029. The integration of digital radar in defense operations is one of the key factors leading to the emergence of the digital radar market. The effective detection and response to possible threats is made possible by the presence of a strong knowledge of the situation in the military. Modern radar technology is able to detect many different objects because of its high accuracy and comprehensive view, regardless of the place and mission. Since digital radar employs cutting-edge algorithms of signal processing and high-resolution images, it's one of the best systems that can offer better accuracy or reliability as far as the detection and tracking of objects both airborne and surface are concerned.

The objective of the report is to define, describe, and forecast the digital radar market based on type, dimension, application, vertical, and region.

Digital Radar Market

Digital Radar Market

Digital Radar Market Forecast to 2029

To know about the assumptions considered for the study, Request for Free Sample Report

Digital Radar Market Dynamics

Drivers: Rising demand of digital radar for enhanced weather detection and monitoring

Weather detection and monitoring demands accurate atmospheric condition data in present, including the fact of precipitation happening, the power of storms themselves, and the system for traveling of meteorological phenomena. It has been estimated that on daily basis National Oceanic and Atmospheric Administration (US) transmits approximately 5.4 gigabytes while uploading 15.9 gigabytes from other countries world-wide. Digital radar is significant since it offers precise and timely feedback because of having advanced sensing abilities to help in different fields.

Restraint: High development cost

The R&D and manufacturing of digital radar system is very expensive. Various stakeholder investments are needed in the value chain stages among them are R&D, manufacturing, system integration, and assembly. These radar security systems target short range, medium range, and long range. An operational frequency band is chosen according to one which is appropriate for any application range. Digital radar systems cost a lot to develop because they require high technology and specialized parts like strong signal processors, complex data interpretation algorithms and high-frequency transceivers.

Opportunity: Growth of unmanned aerial vehicles

For both military and civilian devices, unmanned aerial vehicles (UAV) have become a routine application. China, Russia, and Israel are developing drones and other UAV types which they use for intelligence collection, surveillance missions and reconnaissance purposes. Combat UAVs, such as the Predator and the Heron, have been developed by the US and Israel, respectively. UAVs have witnessed tremendous demand in the last few years owing to their cost-efficient and low-risk operations. Digital radars provide precise object detection, tracking, and collision avoidance capabilities. These capabilities are essential for enabling UAVs to navigate complex environments autonomously and avoid obstacles such as other aircraft, terrain, and buildings

Challenge: Electromagnetic jamming and interface issue

Jamming radar signals using electro magnetic energy is a big issue for the market. It is a form of war increasingly used when one party emits high frequency signals aimed at interfering with visual signals from radars. New jamming employs high energy signals to overrun the radar receiver thus decreasing its performance capability. Its primary goal is to reduce the efficiency of electronic radars, including false target generation and noise jamming. In July 2023, the US Air Force gave Southwest Research Institute (SwRI) USD 4.8 million contract for identifying and responding to hostile radar signals that could threaten US military airplane safety.

Digital Radar Map/Ecosystem:

Digital Radar Market by Ecosystem

Market for safety segment is expected to witness higher CAGR during the forecast period.

The rise in the use of digital radar in the automotive sector is one of the key driving factors for the digital radar market in safety application. The radar sensor sees objects on the road, and the vision sensor uses a camera to see ahead. DENSO CORPORATION (Japan), a leading mobility supplier, has unveiled a new product known as the Global Safety Package 3, which includes an improved sensing capability that enhances vehicle safety. To create a safer driving experience for all drivers, DENSO has developed an advanced safety technology that incorporates both millimeter wave radar sensors (MWR) and optical visual sensors into one device for use in cars.

Market for military & defense segment is expected to account for largest market share in the digital radar market during the forecast period.

The segment is driven by the need for enhanced threat detection and surveillance capabilities in order to guarantee national safety, supported by rising military expenditures. Technological advancements in digital radar systems, including improvements in signal processing and data analytics, further boost adoption, allowing for superior accuracy and range in monitoring airspace and detecting potential threats.

The 4D segment in the digital radar market to witness higher CAGR during the forecast period.

The 4D segment to witness high growth rate in the digital radar market due to its superior capabilities and wide-ranging applications of the 4D radar segment. 4D radar adds time as the fourth dimension, which makes it more precise and gives a better spatial awareness when compared with traditional radar systems that only have range data, angles, and velocity

Digital radar market in the Asia Pacific region is expected to witness higher CAGR during the forecast period.

The market in the Asia Pacific region is driven by high growth in the automotive sector. The increase in use of ADAS to improve vehicle safety within countries like China, and Japan among others is one of the key factors boosting the growth of the automotive sector in this region. As a result, digital radar benefits the robust automotive industry coupled with increasing attention towards safety features.

Digital Radar Market by Region

Digital Radar Market by Region

To know about the assumptions considered for the study, download the pdf brochure

Key Market Players

Major vendors in the digital radar companies include are Lockheed Martin Corporation (US), Thales (France), Indra (Spain), Leonardo S.p.A. (Italy), Bharat Electronics Limited (India), Advanced Micro Devices, Inc. (US), Magna International Inc. (Canada), NXP Semiconductors (Netherlands), Saab AB (Sweden), and Uhnder (US), among others.

Get online access to the report on the World's First Market Intelligence Cloud

  • Easy to Download Historical Data & Forecast Numbers
  • Company Analysis Dashboard for high growth potential opportunities
  • Research Analyst Access for customization & queries
  • Competitor Analysis with Interactive dashboard
  • Latest News, Updates & Trend analysis
Request Sample

Scope of the Report

Report Metric

Details

Market size available for years

2020—2029

Base year

2023

Forecast period

2024—2029

Forecast Units

USD Million/USD Billion

Segments Covered

By Type, Dimension, Application, Vertical, and Region

Geographic regions covered

North America, Europe, Asia Pacific, and RoW

Companies covered

Lockheed Martin Corporation (US), Thales (France), Indra (Spain), Leonardo S.p.A. (Italy), Bharat Electronics Limited (India), Advanced Micro Devices, Inc. (US), Magna International Inc. (Canada), NXP Semiconductors (Netherlands), Saab AB (Sweden), Uhnder (US), Israel Aerospace Industries (Israel), BAE Systems (UK), Elbit Systems Ltd. (Israel), Vayyar (Israel), Arbe (Israel), Ainstein Radar Systems (US), Oculii (US), Spartan Radar, Inc. (US), Cubtek Inc. (Taiwan), ASELSAN A.S. (Turkiye), Teledyne FLIR LLC (US), Echodyne Corp (US) Bitsensing (South Korea), RFISee (Israel), andGapwaves AB (Sweden).

Digital Radar Market Highlights

This research report categorizes the digital radar market based on type, dimension, application, vertical, and region.

Segment

Subsegment

By Type

  • Active
  • Passive

By Dimension

  • 2D & 3D
  • 4D

By Application

  • Safety
  • Security & Surveillance
  • Others

By Vertical

  • Automotive
  • Aerospace
  • Military & Defense
  • Others

By Region:

  • North America
    • US
    • Canada
    • Mexico
  • Europe
    • UK
    • Germany
    • France
    • Rest of Europe
  • Asia Pacific
    • China
    • Japan
    • South Korea
    • Rest of Asia Pacific
  • Rest of the world
    • GCC Countries
    • Rest of the Middle East & Africa
    • South America

Recent Developments

  • In April 2024, Thales (France) partnered with the Dutch Defense Ministry to hand over seven more Ground Master 200 Multi-Mission Compact (GM200 MM/C) radars. These highly mobile GM200 MM/C radars broaden the operational picture through advanced detection, tracking, and classification of different threats including drones, missiles, and aircraft.
  • In May 2023, Indra (Spain) developed the V2i version of S3TSR radar. The radar's detection and tracking capabilities are getting better. This will increase its capacity up to sixteen times. Smaller objects and ballistic missile tracking will be possible due to the improvements made.
  • In February 2023, Bharat Electronics Limited (India) and Israel Aerospace Industries (Israel) are forming a joint venture to provide product support for India's Defence Forces. This include radars and the MRSAM air-defence system. The partnership aims to establish a single point of contact for maintenance and technical support, enhancing the Make in India initiative.

Critical questions answered by this Report:

To speak to our analyst for a discussion on the above findings, click Speak to Analyst

TABLE OF CONTENTS
 
1 INTRODUCTION (Page No. - 20)
    1.1 STUDY OBJECTIVES 
    1.2 MARKET DEFINITION 
    1.3 STUDY SCOPE 
           1.3.1 INCLUSIONS AND EXCLUSIONS
           1.3.2 MARKETS COVERED AND REGIONAL SCOPE
           1.3.3 YEARS CONSIDERED
    1.4 CURRENCY CONSIDERED 
    1.5 UNITS CONSIDERED 
    1.6 LIMITATIONS 
    1.7 STAKEHOLDERS 
    1.8 RECESSION IMPACT 
 
2 RESEARCH METHODOLOGY (Page No. - 25)
    2.1 RESEARCH APPROACH 
           2.1.1 SECONDARY DATA
                    2.1.1.1 List of major secondary sources
                    2.1.1.2 Key data from secondary sources
           2.1.2 PRIMARY DATA
                    2.1.2.1 List of key interview participants
                    2.1.2.2 Breakdown of primary interviews
                    2.1.2.3 Key data from primary sources
                    2.1.2.4 Key industry insights
           2.1.3 SECONDARY AND PRIMARY RESEARCH
    2.2 MARKET SIZE ESTIMATION 
           2.2.1 BOTTOM-UP APPROACH
                    2.2.1.1 Approach to estimate market size using bottom-up analysis (supply side)
                    2.2.1.2 Approach to estimate market size using bottom-up analysis (demand side)
           2.2.2 TOP-DOWN APPROACH
                    2.2.2.1 Approach to estimate market size using top-down analysis (demand side)
    2.3 DATA TRIANGULATION 
    2.4 RESEARCH ASSUMPTIONS 
    2.5 RISK ANALYSIS 
    2.6 RESEARCH LIMITATIONS 
 
3 EXECUTIVE SUMMARY (Page No. - 37)
 
4 PREMIUM INSIGHTS (Page No. - 41)
    4.1 ATTRACTIVE OPPORTUNITIES FOR PLAYERS IN DIGITAL RADAR MARKET 
    4.2 DIGITAL RADAR MARKET, BY TYPE 
    4.3 DIGITAL RADAR MARKET, BY DIMENSION 
    4.4 DIGITAL RADAR MARKET, BY APPLICATION 
    4.5 DIGITAL RADAR MARKET IN NORTH AMERICA, BY TYPE AND COUNTRY 
    4.6 DIGITAL RADAR MARKET, BY COUNTRY 
 
5 MARKET OVERVIEW (Page No. - 44)
    5.1 INTRODUCTION 
    5.2 MARKET DYNAMICS 
           5.2.1 DRIVERS
                    5.2.1.1 Growing focus on improving safety and reliability of autonomous vehicles
                    5.2.1.2 Rising demand for reliable weather detection and monitoring solutions
                    5.2.1.3 Pressing need to identify potential threats and improve situational awareness in aerospace & defense sector
           5.2.2 RESTRAINTS
                    5.2.2.1 High development cost
           5.2.3 OPPORTUNITIES
                    5.2.3.1 Elevating requirement for sophisticated traffic management solutions
                    5.2.3.2 Increasing use of unmanned aerial vehicles (UAVs)
           5.2.4 CHALLENGES
                    5.2.4.1 Electromagnetic jamming and interface issue
    5.3 VALUE CHAIN ANALYSIS 
    5.4 ECOSYSTEM ANALYSIS 
    5.5 TECHNOLOGY ANALYSIS 
           5.5.1 KEY TECHNOLOGIES
                    5.5.1.1 Beamforming
                    5.5.1.2 Radar-on-Chip (RoC)
           5.5.2 COMPLEMENTARY TECHNOLOGIES
                    5.5.2.1 Sensor fusion
           5.5.3 ADJACENT TECHNOLOGIES
                    5.5.3.1 Advanced antenna
    5.6 TRENDS/DISRUPTIONS IMPACTING CUSTOMER BUSINESS 
    5.7 INVESTMENT AND FUNDING SCENARIO 
    5.8 PORTER’S FIVE FORCES ANALYSIS 
           5.8.1 THREAT OF NEW ENTRANTS
           5.8.2 THREAT OF SUBSTITUTES
           5.8.3 BARGAINING POWER OF SUPPLIERS
           5.8.4 BARGAINING POWER OF BUYERS
           5.8.5 INTENSITY OF COMPETITIVE RIVALRY
    5.9 KEY STAKEHOLDERS AND BUYING CRITERIA 
           5.9.1 KEY STAKEHOLDERS IN BUYING PROCESS
           5.9.2 BUYING CRITERIA
    5.10 CASE STUDY ANALYSIS 
           5.10.1 OKLAHOMA UNIVERSITY DEPLOYS ADVANCED RADAR TO PREDICT FORMATION OF SEVERE WEATHER
           5.10.2 INDIAN ARMY AND NAVY ADOPTS BHARAT ELECTRONICS LIMITED'S RADAR SOLUTIONS FOR IMPROVED SITUATIONAL AWARENESS
           5.10.3 INDRA MODERNIZES RADAR NETWORK IN NEW ZEALAND TO IMPROVE AIR SECURITY AND REDUCE CARBON EMISSIONS
    5.11 PRICING ANALYSIS 
           5.11.1 AVERAGE SELLING PRICE TREND, BY DIMENSION
           5.11.2 AVERAGE SELLING PRICE TREND, BY REGION
    5.12 PATENT ANALYSIS 
    5.13 TRADE ANALYSIS 
           5.13.1 IMPORT SCENARIO (HS CODE 8526)
           5.13.2 EXPORT SCENARIO (HS CODE 8526)
    5.14 REGULATORY LANDSCAPE 
           5.14.1 REGULATORY BODIES, GOVERNMENT AGENCIES, AND OTHER ORGANIZATIONS
           5.14.2 REGULATORY STANDARDS
           5.14.3 GOVERNMENT REGULATIONS
    5.15 KEY CONFERENCES AND EVENTS, 2024–2025 
 
6 DIGITAL RADAR MARKET, BY TYPE (Page No. - 74)
    6.1 INTRODUCTION 
    6.2 ACTIVE 
           6.2.1 RISING NEED FOR ENHANCED SECURITY AND SURVEILLANCE TO FUEL MARKET GROWTH
    6.3 PASSIVE 
           6.3.1 INCREASING FOCUS ON STEALTH AND NON-INTERFERENCE TECHNOLOGIES IN MILITARY APPLICATIONS TO FUEL DEMAND
 
7 DIGITAL RADAR MARKET, BY DIMENSION (Page No. - 78)
    7.1 INTRODUCTION 
    7.2 2D & 3D 
           7.2.1 2D
                    7.2.1.1 Surging demand for defense equipment for improved target detection to accelerate market growth
           7.2.2 3D
                    7.2.2.1 Rising demand from aerospace & defense industry to drive market
    7.3 4D 
           7.3.1 INCREASING AWARENESS OF PASSENGER AND VEHICLE SAFETY BENEFITS TO FUEL DEMAND
 
8 DIGITAL RADAR MARKET, BY APPLICATION (Page No. - 84)
    8.1 INTRODUCTION 
    8.2 SAFETY 
           8.2.1 EXCEPTIONAL RELIABILITY, UNPARALLELED PERFORMANCE, AND CUTTING-EDGE DIGITAL INNOVATIONS TO FUEL DEMAND
    8.3 SECURITY & SURVEILLANCE 
           8.3.1 INCREASING GOVERNMENT AND PRIVATE SECTOR INVESTMENTS TO SUPPORT MARKET GROWTH
    8.4 OTHER APPLICATIONS 
 
9 DIGITAL RADAR MARKET, BY VERTICAL (Page No. - 91)
    9.1 INTRODUCTION 
    9.2 AUTOMOTIVE 
           9.2.1 CHANGING LIFESTYLES AND CONSUMER PREFERENCES TO FUEL DEMAND
    9.3 AEROSPACE 
           9.3.1 RISING DEMAND FOR DIGITAL RADAR IN AEROSPACE APPLICATIONS TO PROPEL MARKET
    9.4 MILITARY & DEFENSE 
           9.4.1 INCREASING DEMAND FOR HIGH-END RADAR SOLUTIONS TO FUEL MARKET GROWTH
    9.5 OTHER VERTICALS 
 
10 DIGITAL RADAR MARKET, BY REGION (Page No. - 103)
     10.1 INTRODUCTION 
     10.2 NORTH AMERICA 
             10.2.1 NORTH AMERICA: RECESSION IMPACT
             10.2.2 US
                        10.2.2.1 Growing investments by defense department in security applications to support market growth
             10.2.3 CANADA
                        10.2.3.1 Rising focus on development of precision-guided defense systems to fuel market growth
             10.2.4 MEXICO
                        10.2.4.1 Pressing need to improve national security measures to boost demand
     10.3 EUROPE 
             10.3.1 EUROPE: RECESSION IMPACT
             10.3.2 GERMANY
                        10.3.2.1 Growing focus on enhancing situational awareness and national security to create opportunities
             10.3.3 UK
                        10.3.3.1 Increasing government funding in digitalizing military sector to boost demand
             10.3.4 FRANCE
                        10.3.4.1 Elevating demand and spending on advanced surveillance systems to contribute to market growth
             10.3.5 REST OF EUROPE
     10.4 ASIA PACIFIC 
             10.4.1 ASIA PACIFIC: RECESSION IMPACT
             10.4.2 CHINA
                        10.4.2.1 Collaboration with domestic and international players to modernize defense infrastructure to create opportunities
             10.4.3 JAPAN
                        10.4.3.1 Strong research and development ecosystem to propel market growth
             10.4.4 SOUTH KOREA
                        10.4.4.1 Thriving aerospace industry to provide lucrative opportunities
             10.4.5 REST OF ASIA PACIFIC
     10.5 ROW 
             10.5.1 ROW: RECESSION IMPACT
             10.5.2 GCC
             10.5.3 REST OF MIDDLE EAST & AFRICA
             10.5.4 SOUTH AMERICA
                        10.5.4.1 Increasing investment in modern military equipment to drive market growth
 
11 COMPETITIVE LANDSCAPE (Page No. - 134)
     11.1 OVERVIEW 
     11.2 REVENUE ANALYSIS, 2021–2023 
     11.3 MARKET SHARE ANALYSIS, 2023 
     11.4 COMPANY VALUATION AND FINANCIAL METRICS 
     11.5 BRAND/PRODUCT COMPARISON 
     11.6 COMPANY EVALUATION MATRIX: KEY PLAYERS, 2023 
             11.6.1 STARS
             11.6.2 EMERGING LEADERS
             11.6.3 PERVASIVE PLAYERS
             11.6.4 PARTICIPANTS
             11.6.5 COMPANY FOOTPRINT: KEY PLAYERS, 2023
                        11.6.5.1 Company footprint
                        11.6.5.2 Vertical footprint
                        11.6.5.3 Type footprint
                        11.6.5.4 Dimension footprint
                        11.6.5.5 Application footprint
                        11.6.5.6 Region footprint
     11.7 COMPANY EVALUATION MATRIX: STARTUPS/SMES, 2023 
             11.7.1 PROGRESSIVE COMPANIES
             11.7.2 RESPONSIVE COMPANIES
             11.7.3 DYNAMIC COMPANIES
             11.7.4 STARTING BLOCKS
             11.7.5 COMPETITIVE BENCHMARKING: SMES, 2023
                        11.7.5.1 Detailed list of startups/SMEs
                        11.7.5.2 Competitive benchmarking of key startups/SMEs
     11.8 COMPETITIVE SCENARIO AND TRENDS 
             11.8.1 PRODUCT LAUNCHES
             11.8.2 DEALS
 
12 COMPANY PROFILES (Page No. - 160)
     12.1 KEY PLAYERS 
             12.1.1 LOCKHEED MARTIN CORPORATION
                        12.1.1.1 Business overview
                        12.1.1.2 Products/Solutions/Services offered
                        12.1.1.3 Recent developments
                                     12.1.1.3.1 Product launches/Developments
                                     12.1.1.3.2 Deals
                                     12.1.1.3.3 Other developments
                        12.1.1.4 MnM view
                                     12.1.1.4.1 Key strengths
                                     12.1.1.4.2 Strategic choices
                                     12.1.1.4.3 Weaknesses and competitive threats
             12.1.2 THALES
                        12.1.2.1 Business overview
                        12.1.2.2 Products/Solutions/Services offered
                        12.1.2.3 Recent developments
                                     12.1.2.3.1 Deals
                                     12.1.2.3.2 Other developments
                        12.1.2.4 MnM view
                                     12.1.2.4.1 Key strengths
                                     12.1.2.4.2 Strategic choices
                                     12.1.2.4.3 Weaknesses and competitive threats
             12.1.3 INDRA
                        12.1.3.1 Business overview
                        12.1.3.2 Products/Solutions/Services offered
                        12.1.3.3 Recent developments
                                     12.1.3.3.1 Product launches/Developments
                                     12.1.3.3.2 Deals
                                     12.1.3.3.3 Other developments
                        12.1.3.4 MnM view
                                     12.1.3.4.1 Key strengths
                                     12.1.3.4.2 Strategic choices
                                     12.1.3.4.3 Weaknesses and competitive threats
             12.1.4 LEONARDO S.P.A.
                        12.1.4.1 Business overview
                        12.1.4.2 Products/Solutions/Services offered
                        12.1.4.3 Recent developments
                                     12.1.4.3.1 Product launches/Developments
                        12.1.4.4 MnM view
                                     12.1.4.4.1 Key strengths
                                     12.1.4.4.2 Strategic choices
                                     12.1.4.4.3 Weaknesses and competitive threats
             12.1.5 BHARAT ELECTRONICS LIMITED
                        12.1.5.1 Business overview
                        12.1.5.2 Products/Solutions/Services offered
                        12.1.5.3 Recent developments
                                     12.1.5.3.1 Product launches/Developments
                                     12.1.5.3.2 Deals
                        12.1.5.4 MnM view
                                     12.1.5.4.1 Key strengths
                                     12.1.5.4.2 Strategic choices
                                     12.1.5.4.3 Weaknesses and competitive threats
             12.1.6 ADVANCED MICRO DEVICES, INC.
                        12.1.6.1 Business overview
                        12.1.6.2 Products/Solutions/Services offered
                        12.1.6.3 Recent developments
                                     12.1.6.3.1 Product launches/Developments
                                     12.1.6.3.2 Deals
             12.1.7 MAGNA INTERNATIONAL INC
                        12.1.7.1 Business overview
                        12.1.7.2 Products/Solutions/Services offered
                        12.1.7.3 Recent developments
                                     12.1.7.3.1 Product launches/Developments
                                     12.1.7.3.2 Deals
             12.1.8 NXP SEMICONDUCTORS
                        12.1.8.1 Business overview
                        12.1.8.2 Products/Solutions/Services offered
                        12.1.8.3 Recent developments
                                     12.1.8.3.1 Product launches/Developments
                                     12.1.8.3.2 Deals
             12.1.9 SAAB AB
                        12.1.9.1 Business overview
                        12.1.9.2 Products/Solutions/Services offered
                        12.1.9.3 Recent developments
                                     12.1.9.3.1 Deals
                                     12.1.9.3.2 Other developments
             12.1.10 UHNDER
                        12.1.10.1 Business overview
                        12.1.10.2 Products/Solutions/Services offered
                        12.1.10.3 Recent developments
                                     12.1.10.3.1 Product launches/Developments
                                     12.1.10.3.2 Deals
     12.2 OTHER COMPANIES 
             12.2.1 ISRAEL AEROSPACE INDUSTRIES
             12.2.2 BAE SYSTEMS
             12.2.3 ELBIT SYSTEMS LTD.
             12.2.4 VAYYAR
             12.2.5 ARBE
             12.2.6 AINSTEIN RADAR SYSTEMS
             12.2.7 OCULII
             12.2.8 SPARTAN RADAR, INC.
             12.2.9 CUBTEK INC.
             12.2.10 ASELSAN A.S.
             12.2.11 TELEDYNE FLIR LLC
             12.2.12 ECHODYNE CORP
             12.2.13 BITSENSING
             12.2.14 RFISEE
             12.2.15 GAPWAVES AB
 
13 APPENDIX (Page No. - 210)
     13.1 DISCUSSION GUIDE 
     13.2 KNOWLEDGESTORE: MARKETSANDMARKETS’ SUBSCRIPTION PORTAL 
     13.3 CUSTOMIZATION OPTIONS 
     13.4 RELATED REPORTS 
     13.5 AUTHOR DETAILS 
 
LIST OF TABLES (177 TABLES)
 
TABLE 1 DIGITAL RADAR MARKET: RISK ANALYSIS
TABLE 2 ROLE OF COMPANIES IN ECOSYSTEM
TABLE 3 DIGITAL RADAR MARKET: PORTER’S FIVE FORCES ANALYSIS
TABLE 4 INFLUENCE OF STAKEHOLDERS ON BUYING PROCESS FOR TOP THREE VERTICALS (%)
TABLE 5 KEY BUYING CRITERIA FOR TOP THREE VERTICALS
TABLE 6 INDICATIVE PRICING TREND OF DIGITAL RADAR FOR AUTOMOTIVE VERTICAL, BY DIMENSION (USD)
TABLE 7 DIGITAL RADAR MARKET: PATENTS, 2023
TABLE 8 NORTH AMERICA: REGULATORY BODIES, GOVERNMENT AGENCIES, AND OTHER ORGANIZATIONS
TABLE 9 EUROPE: REGULATORY BODIES, GOVERNMENT AGENCIES, AND OTHER ORGANIZATIONS
TABLE 10 ASIA PACIFIC: REGULATORY BODIES, GOVERNMENT AGENCIES, AND OTHER ORGANIZATIONS
TABLE 11 ROW: REGULATORY BODIES, GOVERNMENT AGENCIES, AND OTHER ORGANIZATIONS
TABLE 12 DIGITAL RADAR MARKET: CONFERENCES AND EVENTS, 2024–2025
TABLE 13 DIGITAL RADAR MARKET, BY TYPE, 2020–2023 (USD MILLION)
TABLE 14 DIGITAL RADAR MARKET, BY TYPE, 2024–2029 (USD MILLION)
TABLE 15 DIGITAL RADAR MARKET, BY DIMENSION, 2020–2023 (USD MILLION)
TABLE 16 DIGITAL RADAR MARKET, BY DIMENSION, 2024–2029 (USD MILLION)
TABLE 17 2D & 3D: DIGITAL RADAR MARKET, BY REGION, 2020–2023 (USD MILLION)
TABLE 18 2D & 3D: DIGITAL RADAR MARKET, BY REGION, 2024–2029 (USD MILLION)
TABLE 19 4D: DIGITAL RADAR MARKET, BY REGION, 2020–2023 (USD MILLION)
TABLE 20 4D: DIGITAL RADAR MARKET, BY REGION, 2024–2029 (USD MILLION)
TABLE 21 DIGITAL RADAR MARKET, BY APPLICATION, 2020–2023 (USD MILLION)
TABLE 22 DIGITAL RADAR MARKET, BY APPLICATION, 2024–2029 (USD MILLION)
TABLE 23 SAFETY: DIGITAL RADAR MARKET, BY VERTICAL, 2020–2023 (USD MILLION)
TABLE 24 SAFETY: DIGITAL RADAR MARKET, BY VERTICAL, 2024–2029 (USD MILLION)
TABLE 25 SECURITY & SURVEILLANCE: DIGITAL RADAR MARKET, BY VERTICAL, 2020–2023 (USD MILLION)
TABLE 26 SECURITY & SURVEILLANCE: DIGITAL RADAR MARKET, BY VERTICAL, 2024–2029 (USD MILLION)
TABLE 27 OTHER APPLICATIONS: DIGITAL RADAR MARKET, BY VERTICAL, 2020–2023 (USD MILLION)
TABLE 28 OTHER APPLICATIONS: DIGITAL RADAR MARKET, BY VERTICAL, 2024–2029 (USD MILLION)
TABLE 29 DIGITAL RADAR MARKET, BY VERTICAL, 2020–2023 (USD MILLION)
TABLE 30 DIGITAL RADAR MARKET, BY VERTICAL, 2024–2029 (USD MILLION)
TABLE 31 AUTOMOTIVE: DIGITAL RADAR MARKET, IN TERMS OF VOLUME, 2020–2023 (MILLION UNITS)
TABLE 32 AUTOMOTIVE: DIGITAL RADAR MARKET, IN TERMS OF VOLUME, 2024–2029 (MILLION UNITS)
TABLE 33 AUTOMOTIVE: DIGITAL RADAR MARKET, BY DIMENSION, 2020–2023 (USD MILLION)
TABLE 34 AUTOMOTIVE: DIGITAL RADAR MARKET, BY DIMENSION, 2024–2029 (USD MILLION)
TABLE 35 AUTOMOTIVE: DIGITAL RADAR MARKET, BY APPLICATION, 2020–2023 (USD MILLION)
TABLE 36 AUTOMOTIVE: DIGITAL RADAR MARKET, BY APPLICATION, 2024–2029 (USD MILLION)
TABLE 37 AUTOMOTIVE: DIGITAL RADAR MARKET, BY REGION, 2020–2023 (USD MILLION)
TABLE 38 AUTOMOTIVE: DIGITAL RADAR MARKET, BY REGION, 2024–2029 (USD MILLION)
TABLE 39 AEROSPACE: DIGITAL RADAR MARKET, BY DIMENSION, 2020–2023 (USD MILLION)
TABLE 40 AEROSPACE: DIGITAL RADAR MARKET, BY DIMENSION, 2024–2029 (USD MILLION)
TABLE 41 AEROSPACE: DIGITAL RADAR MARKET, BY APPLICATION, 2020–2023 (USD MILLION)
TABLE 42 AEROSPACE: DIGITAL RADAR MARKET, BY APPLICATION, 2024–2029 (USD MILLION)
TABLE 43 AEROSPACE: DIGITAL RADAR MARKET, BY REGION, 2020–2023 (USD MILLION)
TABLE 44 AEROSPACE: DIGITAL RADAR MARKET, BY REGION, 2024–2029 (USD MILLION)
TABLE 45 MILITARY & DEFENSE: DIGITAL RADAR MARKET, BY DIMENSION, 2020–2023 (USD MILLION)
TABLE 46 MILITARY & DEFENSE: DIGITAL RADAR MARKET, BY DIMENSION, 2024–2029 (USD MILLION)
TABLE 47 MILITARY & DEFENSE: DIGITAL RADAR MARKET, BY APPLICATION, 2020–2023 (USD MILLION)
TABLE 48 MILITARY & DEFENSE: DIGITAL RADAR MARKET, BY APPLICATION, 2024–2029 (USD MILLION)
TABLE 49 MILITARY & DEFENSE: DIGITAL RADAR MARKET, BY REGION, 2020–2023 (USD MILLION)
TABLE 50 MILITARY & DEFENSE: DIGITAL RADAR MARKET, BY REGION, 2024–2029 (USD MILLION)
TABLE 51 OTHER VERTICALS: DIGITAL RADAR MARKET, BY DIMENSION, 2020–2023 (USD MILLION)
TABLE 52 OTHER VERTICALS: DIGITAL RADAR MARKET, BY DIMENSION, 2024–2029 (USD MILLION)
TABLE 53 OTHER VERTICALS: DIGITAL RADAR MARKET, BY APPLICATION, 2020–2023 (USD MILLION)
TABLE 54 OTHER VERTICALS: DIGITAL RADAR MARKET, BY APPLICATION, 2024–2029 (USD MILLION)
TABLE 55 OTHER VERTICALS: DIGITAL RADAR MARKET, BY REGION, 2020–2023 (USD MILLION)
TABLE 56 OTHER VERTICALS: DIGITAL RADAR MARKET, BY REGION, 2024–2029 (USD MILLION)
TABLE 57 DIGITAL RADAR MARKET: BY REGION, 2020–2023 (USD MILLION)
TABLE 58 DIGITAL RADAR MARKET: BY REGION, 2024–2029 (USD MILLION)
TABLE 59 NORTH AMERICA: DIGITAL RADAR MARKET, BY VERTICAL, 2020–2023 (USD MILLION)
TABLE 60 NORTH AMERICA: DIGITAL RADAR MARKET, BY VERTICAL, 2024–2029 (USD MILLION)
TABLE 61 NORTH AMERICA: DIGITAL RADAR MARKET, BY APPLICATION, 2020–2023 (USD MILLION)
TABLE 62 NORTH AMERICA: DIGITAL RADAR MARKET, BY APPLICATION, 2024–2029 (USD MILLION)
TABLE 63 NORTH AMERICA: DIGITAL RADAR MARKET, BY COUNTRY, 2020–2023 (USD MILLION)
TABLE 64 NORTH AMERICA: DIGITAL RADAR MARKET, BY COUNTRY, 2024–2029 (USD MILLION)
TABLE 65 US: DIGITAL RADAR MARKET, BY VERTICAL, 2020–2023 (USD MILLION)
TABLE 66 US: DIGITAL RADAR MARKET, BY VERTICAL, 2024–2029 (USD MILLION)
TABLE 67 CANADA: DIGITAL RADAR MARKET, BY VERTICAL, 2020–2023 (USD MILLION)
TABLE 68 CANADA: DIGITAL RADAR MARKET, BY VERTICAL, 2024–2029 (USD MILLION)
TABLE 69 MEXICO: DIGITAL RADAR MARKET, BY VERTICAL, 2020–2023 (USD MILLION)
TABLE 70 MEXICO: DIGITAL RADAR MARKET, BY VERTICAL, 2024–2029 (USD MILLION)
TABLE 71 EUROPE: DIGITAL RADAR MARKET, BY VERTICAL, 2020–2023 (USD MILLION)
TABLE 72 EUROPE: DIGITAL RADAR MARKET, BY VERTICAL, 2024–2029 (USD MILLION)
TABLE 73 EUROPE: DIGITAL RADAR MARKET, BY APPLICATION, 2020–2023 (USD MILLION)
TABLE 74 EUROPE: DIGITAL RADAR MARKET, BY APPLICATION, 2024–2029 (USD MILLION)
TABLE 75 EUROPE: DIGITAL RADAR MARKET, BY COUNTRY, 2020–2023 (USD MILLION)
TABLE 76 EUROPE: DIGITAL RADAR MARKET, BY COUNTRY, 2024–2029 (USD MILLION)
TABLE 77 GERMANY: DIGITAL RADAR MARKET, BY VERTICAL, 2020–2023 (USD MILLION)
TABLE 78 GERMANY: DIGITAL RADAR MARKET, BY VERTICAL, 2024–2029 (USD MILLION)
TABLE 79 UK: DIGITAL RADAR MARKET, BY VERTICAL, 2020–2023 (USD MILLION)
TABLE 80 UK: DIGITAL RADAR MARKET, BY VERTICAL, 2024–2029 (USD MILLION)
TABLE 81 FRANCE: DIGITAL RADAR MARKET, BY VERTICAL, 2020–2023 (USD MILLION)
TABLE 82 FRANCE: DIGITAL RADAR MARKET, BY VERTICAL, 2024–2029 (USD MILLION)
TABLE 83 REST OF EUROPE: DIGITAL RADAR MARKET, BY VERTICAL, 2020–2023 (USD MILLION)
TABLE 84 REST OF EUROPE: DIGITAL RADAR MARKET, BY VERTICAL, 2024–2029 (USD MILLION)
TABLE 85 ASIA PACIFIC: DIGITAL RADAR MARKET, BY VERTICAL, 2020–2023 (USD MILLION)
TABLE 86 ASIA PACIFIC: DIGITAL RADAR MARKET, BY VERTICAL, 2024–2029 (USD MILLION)
TABLE 87 ASIA PACIFIC: DIGITAL RADAR MARKET, BY APPLICATION, 2020–2023 (USD MILLION)
TABLE 88 ASIA PACIFIC: DIGITAL RADAR MARKET, BY APPLICATION, 2024–2029 (USD MILLION)
TABLE 89 ASIA PACIFIC: DIGITAL RADAR MARKET, BY COUNTRY, 2020–2023 (USD MILLION)
TABLE 90 ASIA PACIFIC: DIGITAL RADAR MARKET, BY COUNTRY, 2024–2029 (USD MILLION)
TABLE 91 CHINA: DIGITAL RADAR MARKET, BY VERTICAL, 2020–2023 (USD MILLION)
TABLE 92 CHINA: DIGITAL RADAR MARKET, BY VERTICAL, 2024–2029 (USD MILLION)
TABLE 93 JAPAN: DIGITAL RADAR MARKET, BY VERTICAL, 2020–2023 (USD MILLION)
TABLE 94 JAPAN: DIGITAL RADAR MARKET, BY VERTICAL, 2024–2029 (USD MILLION)
TABLE 95 SOUTH KOREA: DIGITAL RADAR MARKET, BY VERTICAL, 2020–2023 (USD MILLION)
TABLE 96 SOUTH KOREA: DIGITAL RADAR MARKET, BY VERTICAL, 2024–2029 (USD MILLION)
TABLE 97 REST OF ASIA PACIFIC: DIGITAL RADAR MARKET, BY VERTICAL, 2020–2023 (USD MILLION)
TABLE 98 REST OF ROW: DIGITAL RADAR MARKET, BY VERTICAL, 2024–2029 (USD MILLION)
TABLE 99 ROW: DIGITAL RADAR MARKET, BY VERTICAL, 2020–2023 (USD MILLION)
TABLE 100 ROW: DIGITAL RADAR MARKET, BY VERTICAL, 2024–2029 (USD MILLION)
TABLE 101 ROW: DIGITAL RADAR MARKET, BY APPLICATION, 2020–2023 (USD MILLION)
TABLE 102 ROW: DIGITAL RADAR MARKET, BY APPLICATION, 2024–2029 (USD MILLION)
TABLE 103 ROW: DIGITAL RADAR MARKET, BY GEOGRAPHY, 2020–2023 (USD MILLION)
TABLE 104 ROW: DIGITAL RADAR MARKET, BY GEOGRAPHY, 2024–2029 (USD MILLION)
TABLE 105 GCC: DIGITAL RADAR MARKET, BY VERTICAL, 2020–2023 (USD MILLION)
TABLE 106 GCC: DIGITAL RADAR MARKET, BY VERTICAL, 2024–2029 (USD MILLION)
TABLE 107 REST OF MIDDLE EAST & AFRICA: DIGITAL RADAR MARKET, BY VERTICAL, 2020–2023 (USD MILLION)
TABLE 108 REST OF MIDDLE EAST & AFRICA: DIGITAL RADAR MARKET, BY VERTICAL, 2024–2029 (USD MILLION)
TABLE 109 SOUTH AMERICA: DIGITAL RADAR MARKET, BY VERTICAL, 2020–2023 (USD MILLION)
TABLE 110 SOUTH AMERICA: DIGITAL RADAR MARKET, BY VERTICAL, 2024–2029 (USD MILLION)
TABLE 111 DIGITAL RADAR MARKET: OVERVIEW OF STRATEGIES ADOPTED BY KEY PLAYERS
TABLE 112 DIGITAL RADAR MARKET SHARE ANALYSIS FOR TOP FIVE PLAYERS, 2023
TABLE 113 DIGITAL RADAR MARKET: VERTICAL FOOTPRINT
TABLE 114 DIGITAL RADAR MARKET: TYPE FOOTPRINT
TABLE 115 DIGITAL RADAR MARKET: DIMENSION FOOTPRINT
TABLE 116 DIGITAL RADAR MARKET: APPLICATION FOOTPRINT
TABLE 117 DIGITAL RADAR MARKET: REGION FOOTPRINT
TABLE 118 DIGITAL RADAR MARKET: KEY STARTUPS
TABLE 119 DIGITAL RADAR MARKET: COMPETITIVE BENCHMARKING OF KEY STARTUPS/SMES
TABLE 120 DIGITAL RADAR MARKET: PRODUCT LAUNCHES, JANUARY 2021–JUNE 2024
TABLE 121 DIGITAL RADAR MARKET: DEALS, JANUARY 2021–JUNE 2024
TABLE 122 LOCKHEED MARTIN CORPORATION: COMPANY OVERVIEW
TABLE 123 LOCKHEED MARTIN CORPORATION: PRODUCTS/SOLUTIONS/SERVICES OFFERED
TABLE 124 LOCKHEED MARTIN CORPORATION: PRODUCT LAUNCHES/DEVELOPMENTS
TABLE 125 LOCKHEED MARTIN CORPORATION: DEALS
TABLE 126 LOCKHEED MARTIN CORPORATION: OTHER DEVELOPMENTS
TABLE 127 THALES: COMPANY OVERVIEW
TABLE 128 THALES: PRODUCTS/SOLUTIONS/SERVICES OFFERED
TABLE 129 THALES: DEALS
TABLE 130 THALES: OTHER DEVELOPMENTS
TABLE 131 INDRA: COMPANY OVERVIEW
TABLE 132 INDRA: PRODUCTS/SOLUTIONS/SERVICES OFFERED
TABLE 133 INDRA: PRODUCT LAUNCHES/DEVELOPMENTS
TABLE 134 INDRA: DEALS
TABLE 135 INDRA: OTHER DEVELOPMENTS
TABLE 136 LEONARDO S.P.A.: COMPANY OVERVIEW
TABLE 137 LEONARDO S.P.A.: PRODUCTS/SOLUTIONS/SERVICES OFFERED
TABLE 138 LEONARDO S.P.A.: PRODUCT LAUNCHES/DEVELOPMENTS
TABLE 139 BHARAT ELECTRONICS LIMITED: COMPANY OVERVIEW
TABLE 140 BHARAT ELECTRONICS LIMITED: PRODUCTS/SOLUTIONS/SERVICES OFFERED
TABLE 141 BHARAT ELECTRONICS LIMITED: PRODUCT LAUNCHES/DEVELOPMENTS
TABLE 142 BHARAT ELECTRONICS LIMITED: DEALS
TABLE 143 ADVANCED MICRO DEVICES, INC.: COMPANY OVERVIEW
TABLE 144 ADVANCED MICRO DEVICES, INC.: PRODUCTS/SOLUTIONS/SERVICES OFFERED
TABLE 145 ADVANCED MICRO DEVICES, INC.: PRODUCT LAUNCHES/DEVELOPMENTS
TABLE 146 ADVANCED MICRO DEVICES, INC.: DEALS
TABLE 147 MAGNA INTERNATIONAL INC.: COMPANY OVERVIEW
TABLE 148 MAGNA INTERNATIONAL INC.: PRODUCTS/SOLUTIONS/SERVICES OFFERED
TABLE 149 MAGNA INTERNATIONAL INC.: PRODUCT LAUNCHES/DEVELOPMENTS
TABLE 150 MAGNA INTERNATIONAL INC.: DEALS
TABLE 151 NXP SEMICONDUCTORS: COMPANY OVERVIEW
TABLE 152 NXP SEMICONDUCTORS: PRODUCTS/SOLUTIONS/SERVICES OFFERED
TABLE 153 NXP SEMICONDUCTORS: PRODUCT LAUNCHES/DEVELOPMENTS
TABLE 154 NXP SEMICONDUCTORS: DEALS
TABLE 155 SAAB AB: COMPANY OVERVIEW
TABLE 156 SAAB AB: PRODUCTS/SOLUTIONS/SERVICES OFFERED
TABLE 157 SAAB AB: DEALS
TABLE 158 SAAB AB: OTHER DEVELOPMENTS
TABLE 159 UHNDER: COMPANY OVERVIEW
TABLE 160 UHNDER: PRODUCTS/SOLUTIONS/SERVICES OFFERED
TABLE 161 UHNDER: PRODUCT LAUNCHES/DEVELOPMENTS
TABLE 162 UHNDER: DEALS
TABLE 163 ISRAEL AEROSPACE INDUSTRIES: COMPANY OVERVIEW
TABLE 164 BAE SYSTEMS: COMPANY OVERVIEW
TABLE 165 ELBIT SYSTEMS LTD.: COMPANY OVERVIEW
TABLE 166 VAYYAR: COMPANY OVERVIEW
TABLE 167 ARBE: COMPANY OVERVIEW
TABLE 168 AINSTEIN RADRA SYSTEMS: COMPANY OVERVIEW
TABLE 169 OCULII: COMPANY OVERVIEW
TABLE 170 SPARTAN RADAR, INC.: COMPANY OVERVIEW
TABLE 171 CUBTEK INC.: COMPANY OVERVIEW
TABLE 172 ASELSAN A.S.: COMPANY OVERVIEW
TABLE 173 TELEDYNE FLIR LLC: COMPANY OVERVIEW
TABLE 174 ECHODYNE CORP: COMPANY OVERVIEW
TABLE 175 BITSENSING: COMPANY OVERVIEW
TABLE 176 RFISEE: COMPANY OVERVIEW
TABLE 177 GAPWAVES AB: COMPANY OVERVIEW
 
 
LIST OF FIGURES (65 FIGURES)
 
FIGURE 1 DIGITAL RADAR MARKET: SEGMENTATION
FIGURE 2 DIGITAL RADAR MARKET: RESEARCH DESIGN
FIGURE 3 RESEARCH FLOW OF MARKET SIZE ESTIMATION
FIGURE 4 DIGITAL RADAR MARKET: BOTTOM-UP APPROACH
FIGURE 5 MARKET SIZE ESTIMATION METHODOLOGY (SUPPLY-SIDE): REVENUE GENERATED BY DIGITAL RADAR MANUFACTURERS
FIGURE 6 DIGITAL RADAR MARKET: BOTTOM-UP APPROACH
FIGURE 7 DIGITAL RADAR MARKET: TOP-DOWN APPROACH
FIGURE 8 DIGITAL RADAR MARKET: DATA TRIANGULATION
FIGURE 9 ACTIVE SEGMENT TO ACCOUNT FOR LARGER MARKET SHARE DURING FORECAST PERIOD
FIGURE 10 2D & 3D SEGMENT TO HOLD LARGER MARKET SHARE DURING FORECAST PERIOD
FIGURE 11 SECURITY & SURVEILLANCE SEGMENT TO HOLD LARGEST MARKET SHARE DURING FORECAST PERIOD
FIGURE 12 MILITARY & DEFENSE SEGMENT TO HOLD LARGEST MARKET SHARE DURING FORECAST PERIOD
FIGURE 13 NORTH AMERICA DOMINATED GLOBAL DIGITAL RADAR MARKET IN 2023
FIGURE 14 GROWING ADOPTION OF DIGITAL RADAR IN MILITARY & DEFENSE TO SURGE MARKET GROWTH DURING FORECAST PERIOD
FIGURE 15 ACTIVE SEGMENT TO DOMINATE MARKET DURING FORECAST PERIOD
FIGURE 16 2D & 3D SEGMENT TO ACCOUNT FOR LARGEST MARKET SHARE IN 2024
FIGURE 17 SECURITY & SURVEILLANCE SEGMENT TO DOMINATE MARKET DURING FORECAST PERIOD
FIGURE 18 NORTH AMERICA TO ACCOUNT FOR LARGEST MARKET SHARE IN 2024
FIGURE 19 REST OF ASIA PACIFIC TO REGISTER HIGHEST CAGR DURING FORECAST PERIOD
FIGURE 20 IMPACT OF DRIVERS ON DIGITAL RADAR MARKET
FIGURE 21 IMPACT OF RESTRAINTS ON DIGITAL RADAR MARKET
FIGURE 22 IMPACT OF OPPORTUNITIES ON DIGITAL RADAR MARKET
FIGURE 23 TEN HIGHEST TRAFFIC DELAY TIMES, BY CITY, 2022
FIGURE 24 IMPACT OF CHALLENGES ON DIGITAL RADAR MARKET
FIGURE 25 DIGITAL RADAR MARKET: VALUE CHAIN ANALYSIS
FIGURE 26 DIGITAL RADAR ECOSYSTEM
FIGURE 27 TRENDS/DISRUPTIONS INFLUENCING CUSTOMER BUSINESS
FIGURE 28 FUNDS RAISED BY UHNDER-STARTUP IN DIGITAL RADAR MARKET, 2020 – 2024 (USD MILLION)
FIGURE 29 DIGITAL RADAR MARKET: PORTER’S FIVE FORCES ANALYSIS
FIGURE 30 INFLUENCE OF STAKEHOLDERS ON BUYING PROCESS FOR TOP THREE VERTICALS
FIGURE 31 KEY BUYING CRITERIA FOR TOP THREE VERTICALS
FIGURE 32 AVERAGE SELLING PRICE TREND OF DIGITAL RADAR, BY DIMENSION
FIGURE 33 AVERAGE SELLING PRICE TREND OF 2D & 3D DIMENSIONAL AUTOMOTIVE DIGITAL RADAR, BY REGION, 2020–2023 (USD)
FIGURE 34 NUMBER OF PATENTS GRANTED AND APPLIED, 2013 –2023
FIGURE 35 IMPORT DATA FOR HS CODE 8526, BY COUNTRY, 2019–2022
FIGURE 36 EXPORT DATA FOR HS CODE 8526, BY COUNTRY, 2019–2022
FIGURE 37 ACTIVE SEGMENT TO HOLD LARGER MARKET SHARE DURING FORECAST PERIOD
FIGURE 38 2D & 3D SEGMENT TO HOLD LARGER MARKET SHARE DURING FORECAST PERIOD
FIGURE 39 SECURITY & SURVEILLANCE SEGMENT TO HOLD LARGEST MARKET SHARE FROM 2024 T0 2029
FIGURE 40 MILITARY & DEFENSE SEGMENT TO HOLD LARGEST MARKET FROM 2024 TO 2029
FIGURE 41 ASIA PACIFIC TO EXHIBIT HIGHEST CAGR DURING FORECAST PERIOD
FIGURE 42 NORTH AMERICA: DIGITAL RADAR MARKET SNAPSHOT
FIGURE 43 US TO LEAD NORTH AMERICAN DIGITAL RADAR MARKET DURING FORECAST PERIOD
FIGURE 44 EUROPE: DIGITAL RADAR MARKET SNAPSHOT
FIGURE 45 GERMANY TO HOLD LARGEST SHARE OF EUROPEAN MARKET DURING FORECAST PERIOD
FIGURE 46 ASIA PACIFIC: DIGITAL RADAR MARKET SNAPSHOT
FIGURE 47 CHINA TO HOLD LARGEST SHARE OF MARKET IN ASIA PACIFIC DURING FORECAST PERIOD
FIGURE 48 SOUTH AMERICA TO HOLD LARGEST SHARE OF MARKET IN ROW DURING FORECAST PERIOD
FIGURE 49 DIGITAL RADAR MARKET: REVENUE ANALYSIS OF TOP FIVE PLAYERS, 2021–2023
FIGURE 50 DIGITAL RADAR MARKET SHARE ANALYSIS OF TOP FIVE PLAYERS, 2023
FIGURE 51 COMPANY VALUATION (USD BILLION), 2024
FIGURE 52 FINANCIAL METRICS (ENTERPRISE VALUE/EBITDA), 2024
FIGURE 53 DIGITAL RADAR MARKET: BRAND/PRODUCT COMPARISON
FIGURE 54 DIGITAL RADAR MARKET: COMPANY EVALUATION MATRIX, 2023
FIGURE 55 DIGITAL RADAR MARKET: COMPANY FOOTPRINT
FIGURE 56 DIGITAL RADAR MARKET: STARTUPS/SMES EVALUATION MATRIX, 2023
FIGURE 57 LOCKHEED MARTIN CORPORATION: COMPANY SNAPSHOT
FIGURE 58 THALES: COMPANY SNAPSHOT
FIGURE 59 INDRA: COMPANY SNAPSHOT
FIGURE 60 LEONARDO S.P.A.: COMPANY SNAPSHOT
FIGURE 61 BHARAT ELECTRONICS LIMITED: COMPANY SNAPSHOT
FIGURE 62 ADVANCED MICRO DEVICES, INC.: COMPANY SNAPSHOT
FIGURE 63 MAGNA INTERNATIONAL INC.: COMPANY SNAPSHOT
FIGURE 64 NXP SEMICONDUCTORS: COMPANY SNAPSHOT
FIGURE 65 SAAB AB: COMPANY SNAPSHOT


The research process for this study included systematic gathering, recording, and analysis of data about customers and companies operating in the digital radar market. This process involved the extensive use of secondary sources, directories, and databases (Factiva, Oanda, and OneSource) for identifying and collecting valuable information for the comprehensive, technical, market-oriented, and commercial study of the digital radar market. In-depth interviews were conducted with primary respondents, including experts from core and related industries and preferred manufacturers, to obtain and verify critical qualitative and quantitative information as well as to assess growth prospects. Key players in the digital radar market were identified through secondary research, and their market rankings were determined through primary and secondary research. This research included studying annual reports of top players and interviewing key industry experts such as CEOs, directors, and marketing executives.

Secondary Research

In the secondary research process, various sources were used to identify and collect information important for this study. These include annual reports, press releases & investor presentations of companies, white papers, technology journals, certified publications, articles by recognized authors, directories, and databases.

Secondary research was mainly used to obtain key information about the industry's value chain, the total pool of market players, the classification of the market according to industry trends to the bottom-most level, regional markets, and key developments from the market and technology-oriented perspectives.

Primary Research

Primary research was also conducted to identify the segmentation types, key players, competitive landscape, and key market dynamics, such as drivers, restraints, opportunities, challenges, and industry trends, along with key strategies adopted by players operating in the digital radar market. Extensive qualitative and quantitative analyses were performed on the complete market engineering process to list key information and insights throughout the report.

Extensive primary research has been conducted after acquiring knowledge about the digital radar market scenario through secondary research. Several primary interviews have been conducted with experts from both demand (application, vertical, and region) and supply side (type and dimension) across four major geographic regions: North America, Europe, Asia Pacific, and RoW. Approximately 80% and 20% of the primary interviews were conducted from the supply and demand side, respectively. These primary data have been collected through questionnaires, emails, and telephonic interviews.

Digital Radar Market
 Size, and Share

To know about the assumptions considered for the study, download the pdf brochure

Market Size Estimation

In the complete market engineering process, both top-down and bottom-up approaches were implemented, along with several data triangulation methods, to estimate and validate the size of the digital radar market and various other dependent submarkets. Key players in the market were identified through secondary research, and their market share in the respective regions was determined through primary and secondary research. This entire research methodology included the study of annual and financial reports of the top players, as well as interviews with experts (such as CEOs, VPs, directors, and marketing executives) for key insights (quantitative and qualitative).

All percentage shares, splits, and breakdowns were determined using secondary sources and verified through primary sources. All the possible parameters that affect the markets covered in this research study were accounted for, viewed in detail, verified through primary research, and analyzed to obtain the final quantitative and qualitative data. This data was consolidated and supplemented with detailed inputs and analysis from MarketsandMarkets and presented in this report.

Digital Radar Market: Bottom-Up Approach

Digital Radar Market
 Size, and Bottom-Up Approach

Digital Radar Market: Top-Down Approach

Digital Radar Market
 Size, and Top-Down Approach

Data Triangulation

After arriving at the overall market size from the market size estimation process, as explained above, the total market has been split into several segments and subsegments. To complete the overall market engineering process and arrive at the exact statistics for all segments and subsegments, market breakdown and data triangulation procedures have been employed, wherever applicable. The data have been triangulated by studying various factors and trends from both the demand and supply sides. Along with this, the market has been validated using top-down and bottom-up approaches.

Market Definition

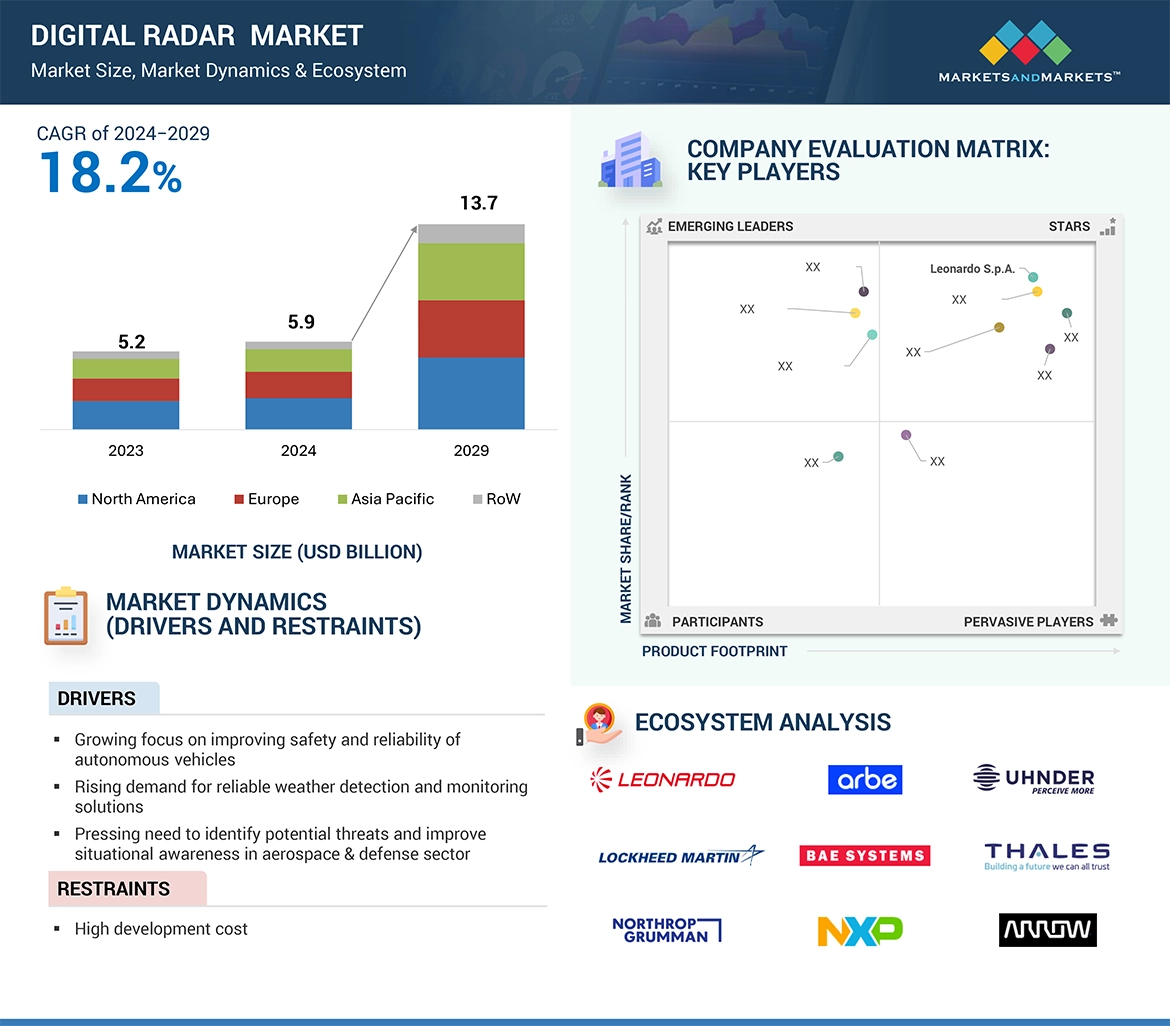
A digital radar is a radar system that uses digital technology to process and analyze the signals it receives. Instead of relying on analog circuits, digital radar converts the analog signals into digital data using analog-to-digital converters (ADCs). This digital data is then processed by digital signal processing (DSP) algorithms, which improve the accuracy, resolution, and reliability of the radar's measurements. Digital radars are capable of more precise detection and tracking of objects, better noise reduction, and enhanced performance in various environmental conditions compared to traditional analog radars.

Key Stakeholders

  • Government and defense agencies
  • Investors and financial institutions
  • Industries such as automotive, aviation, and telecommunications
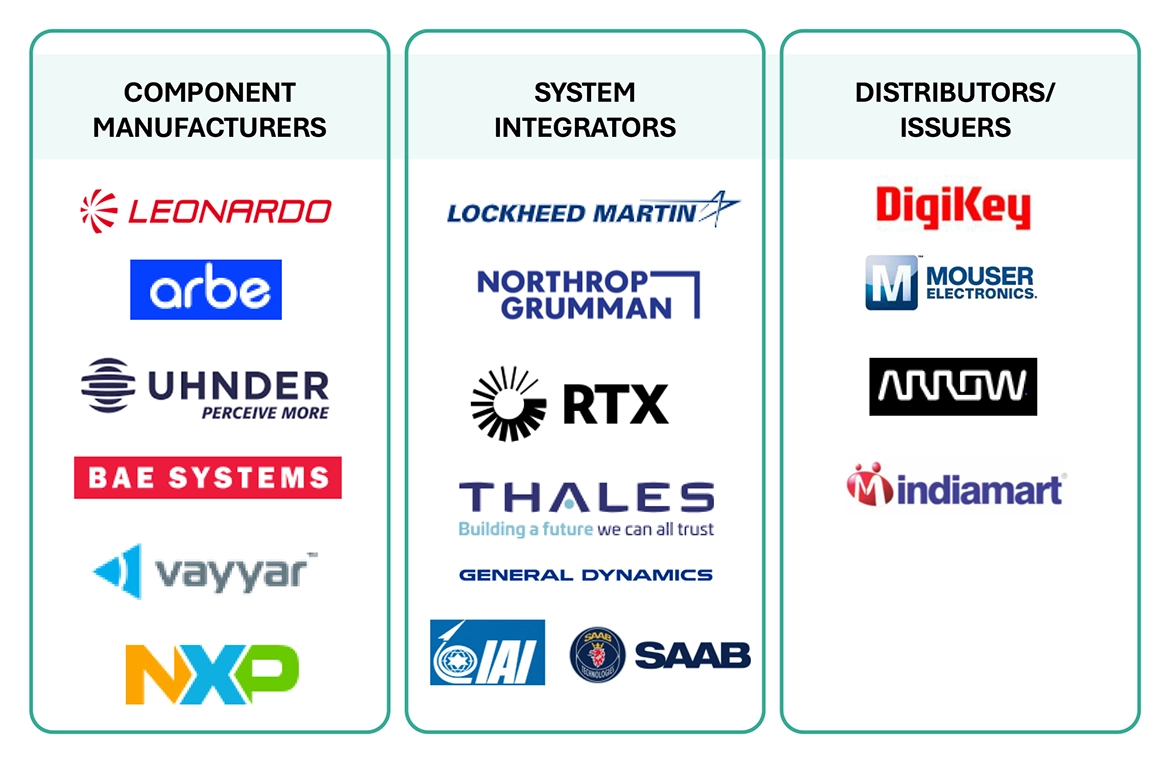
  • Component manufacturers
  • Raw material and manufacturing equipment suppliers
  • Original equipment manufacturers (OEMs)
  • Integrated device manufacturers (IDMs)
  • Original design manufacturers (ODMs)
  • Regulatory bodies
  • Technology investors
  • Research institutes and organizations

Report Objectives

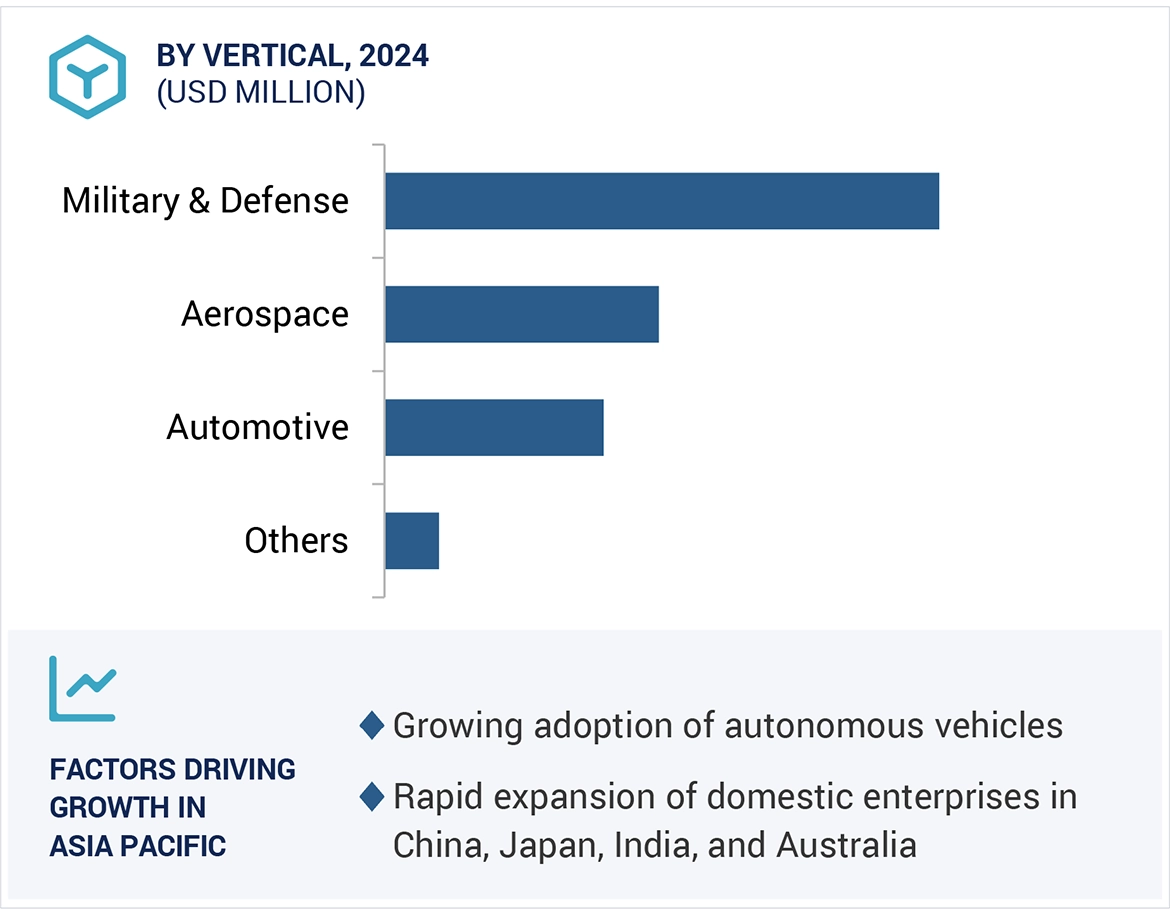
  • To define, describe, and forecast the digital radar market, in terms of value, by type, dimension, application, vertical, and region.
  • To forecast the size of the market segments for four major regions—North America, Europe, Asia Pacific, and the Rest of the World (RoW).
  • To provide detailed information regarding the major factors influencing the growth of the market (drivers, restraints, opportunities, and challenges)
  • To offer an ecosystem analysis, case study analysis, patent analysis, technology analysis, pricing analysis, Porter’s Five Forces analysis, and regulations pertaining to the market.
  • To give a detailed overview of the value chain of the digital radar market ecosystem
  • To strategically analyze micromarkets with respect to individual growth trends, prospects, and contributions to the total market
  • To strategically profile the key players and comprehensively analyze their market shares and core competencies
  • To analyze the opportunities in the market for stakeholders and describe the competitive landscape of the market
  • To study competitive developments such as collaborations, partnerships, product developments, and acquisitions in the market
  • To understand the impact of the recession on the digital radar market

Available Customizations

With the given market data, MarketsandMarkets offers customizations according to the company’s specific needs. The following customization options are available for the report:

Company Information

  • Detailed analysis and profiling of additional market players (up to 5)
Custom Market Research Services

We will customize the research for you, in case the report listed above does not meet with your exact requirements. Our custom research will comprehensively cover the business information you require to help you arrive at strategic and profitable business decisions.

Request Customization
Report Code
SE 9078
Published ON
Jul, 2024
Choose License Type
BUY NOW
  • SHARE
X
Request Customization
Speak to Analyst
Speak to Analyst
OR FACE-TO-FACE MEETING
PERSONALIZE THIS RESEARCH
  • Triangulate with your Own Data
  • Get Data as per your Format and Definition
  • Gain a Deeper Dive on a Specific Application, Geography, Customer or Competitor
  • Any level of Personalization
REQUEST A FREE CUSTOMIZATION
LET US HELP YOU!
  • What are the Known and Unknown Adjacencies Impacting the Digital Radar Market
  • What will your New Revenue Sources be?
  • Who will be your Top Customer; what will make them switch?
  • Defend your Market Share or Win Competitors
  • Get a Scorecard for Target Partners
CUSTOMIZED WORKSHOP REQUEST
  • Call Us
  • +1-888-600-6441 (Corporate office hours)
  • +1-888-600-6441 (US/Can toll free)
  • +44-800-368-9399 (UK office hours)
CONNECT WITH US
ABOUT TRUST ONLINE
©2024 MarketsandMarkets Research Private Ltd. All rights reserved
DMCA.com Protection Status Website Feedback