Diffractive Optical Element Market Size, Share and Trends

Report Code SE 9159
Published On Oct, 2024, By MarketsandMarkets™
Download Sample Report

Choose License Type

Buy Report Now Inquire Before Buying

Diffractive Optical Element Market by Beam Splitter, Pattern Generator, Diffuser, Lenses, Multilevel DOE, AR/VR, LIDAR, Laser Material Processing, Biomedical Devices, Holography, Spectroscopy, Metrology & Industrial Inspection - Global Forecast to 2030

Overview

The global diffractive optical element market is expected to reach USD 388.7 million in 2030 from USD 220.9 million in 2024, at a CAGR of 9.9% during the forecast period. The factors such as Advancements in technology in industries like consumer electronics, automotive, and manufacturing. In addition the miniaturization of devices are contributing to the growth of market. As consumer electronics, automotive, and AR continue seeking even smaller, high performance devices, DOES have become one that would best meet the desired performance. Growth in laser-based applications also plays a crucial role in the DOE market. Lasers are used in various fields, such as medical devices for surgery and diagnostic purposes, material processing like cutting, welding, engraving, and metrology.

AI Impact in the Diffractive Optical Element Market

Implementing artificial intelligence into diffractive optical elements enhances their design and functionality. AI improves the optimization processes associated with DOE work by allowing for highly advanced pattern generation and simulation capabilities. This allows for rapid design iterations, significantly reducing the time for prototyping and testing. For example, AI-based models can be employed to simulate the behavior of diffractive optics under various conditions to provide a better insight into their performance for specific optical requirements.

Moreover, it also plays an essential role in the manufacturing process. With AI, manufacturers can improve their modes of production by employing different machine learning algorithms, which can offer even higher accuracy and uniformity in the final products. This synergy between AI and diffractive optics offers improved performance characteristics, such as better light manipulation and efficiency. In addition, it offers new avenues toward potential innovative applications in optical computing and imaging systems.

Attractive Opportunities in the Diffractive Optical Element Market

ASIA PACIFIC

The growth of the market in Asia Pacific can be attributed to growth in technological advancements in laser technology and significant growth in sectors such as consumer electronics in countries like China, South Korea, and Japan.

The growth of the market can be attributed to the strategic initiatives by modernization of manufacturing sector and demand for emerging technologies

Presence of established diffractive optical element providers in countries like US, known for their technological expertise, contributes to the growth of the market in the North America.

Collaborations, partnerships and developments are expected to offer lucrative growth opportunities for the market players during the next 5 years.

Complexity in DOE fabrication and competition from alternative technology are some of the challenges in diffractive optical element market.

Global Diffractive Optical Element Market Dynamics

Driver: advancements in laser technology to fuel the demand for diffractive optical element

As lasers have been widely used in various fields like telecommunication, health sector, and manufacturing, there is an increasing demand for control of light. DOEs are increasingly used in the optimization of laser systems due its features like beam shaping, splitting, and focusing that play a vital role in enhancing the efficiency of laser-based applications. Due to the increasing demand for laser systems, DOEs are entering other industries as well and, hence, having a positive impact on the market. All these advancements contribute to innovation and are expanding the field of applications for DOEs within laser systems. The University of Rochester's Laboratory for Laser Energetics (LLE) was recently granted a USD 14.9 million contract from the U.S. Department of Defense (DOD) in August 2023 to study pulsed-laser effects. The award of funding, nearly doubling the DOD support that the university has received annually since 2019, can support further scientific missions as well as advance laser technology while developing talent for laser-based directed-energy systems. These advancements are expected to drive further innovation in DOE applications as the demand for high-precision optical components in laser systems continues to grow. This is further propelling the DOE market.

Restraint: Competition from alternative technology

Traditional optical elements, such as lenses and mirrors, were established choices for light manipulation because of their performance and reliability. The diffractive elements tend to be more expensive with greater optical diffraction efficiency than refractive elements, which may not appeal to a potential purchaser. These parts have been mainly used for applications that include microscopy, camera lenses, and laser system configurations. They are in much demand today because of their potential ability to produce high-precision and clear images. Most optical sensors and fiber-optic communication systems also utilize them to ensure the stability and reliability of those technologies.

In addition to the established use of refractive optics, innovations in competing technologies, such as micro-optics and metasurfaces, are emerging. They provide equivalent functionalities but better performance metrics, such as higher efficiency and greater flexibility in design. As these technologies gather momentum, they may limit market share and potential growth for DOEs, which could challenge their widespread adoption in various industries with advanced optical needs.


Opportunity: Emerging applications in augmented reality (AR) and virtual reality (VR)

Diffractive optical elements are finding emerging applications in Augmented Reality (AR) and Virtual Reality. Since augmented reality and virtual reality are being increasingly recognized and used within entertainment, educational, and enterprise boundaries, the demand for accurate optical components to control and manipulate light continues to grow. DOEs have enabled AR and VR devices in many applications, including image projection, light modulation, and enhancing visual experiences. The increased demand for immersive experience and real-time interaction encourages the application of advanced optical systems in achieving superior image quality and performance in AR and VR devices.

The trend toward miniaturization of AR/VR devices further amplifies the need for compact, high-efficiency optical components, positioning DOEs as key elements in this evolving technological landscape. These applications are driving demand for DOEs and supporting market growth. In February 2024, the VR/AR startup AutoVRse secured USD 2 million in seed funding led by Lumikai to develop customized applications for enterprises in experiential marketing, training, skill development, and design reviews. Such investments in AR and VR technologies will increase demand for DOEs as such devices are crucial for improving the performance of AR/VR devices. This would further fuel the growth of the DOE market.

Challenge: Uncertainties in DOE fabrication

Fabrication uncertainties at DOE are the major challenge for the industry of Diffractive Optical Element. Due to the sensitivity of optical performance against nanometer-scale manufacturing deviations, even minor deviations from design could produce a sizeable optical effect. For instance, in a laser material processing beam-shaping DOE, an error of as little as 50 nm in feature depth could produce unwanted hot spots in the output beam, possibly damaging the processed material. Regarding environmental factors, temperature fluctuations or vibrations of the lithography process tend to introduce random errors in the structure. Material imperfections include photoresist nonuniformity or substrate flatness that affects the final performance of the DOE.

Ghosting or contrast reductions observed in projected images due to changes of within 100 nm between lithography steps are common in multi-level DOEs for AR displays. Such uncertainties increases the demand for advanced process control, sophisticated metrology, and often iterative techniques in manufacturing. For instance, quality control by in-situ monitoring during etching or adaptive optical testing for monitoring increases production costs and stretches the time-to-market. However, in critical applications such as medical imaging DOEs, precision and consistency must take the day to make diagnostics possible. Overcoming these fabrication challenges is key to advancing DOE technology and ensuring its reliability in high-precision fields.

Global Diffractive Optical Element Market Ecosystem:

The diffractive optical element market is consolidated, with major companies such as Zeiss Group (Germany), AGC Inc (Japan), Cohernet Corp (US), Jenoptik (Germany), HOLO/OR Ltd (Israel), Broadcom (US), Nalux Co., Ltd (Japan), Holoeye Photonics AG (Germany), Nissei Technology Corp (Japan), Sintec Optronics Ltd (Singapore), and numerous small- and medium-sized enterprises. Almost all players offer various products in the diffractive optical element market. These products are used in applications such as AR/VR LIDAR, Laser material processing, biomedical devices, and others.


Based on component, the binary/multilevel DOE segment is expected to grow fastest during the forecast period.

Binary/multi-level DOE are experiencing rapid growth in Diffractive Optical Elements (DOEs). Binary/multi-level DOEs demonstrate high efficiency light control, compactness, and lightweight. Binary/multi-level DOEs continue to grow its applications that include augmented reality, virtual reality, consumer electronics, device miniaturization, and performance optimization. Binary and multi-level DOEs can manipulate light to create complex optical effects, such as beam shaping, splitting, and focusing, making them essential in applications that demand accuracy and customization.

Advances in AR and VR technologies, especially for gaming, healthcare, and education, increase the demand for high-precision optics. Multi-level DOEs are one of the most critical among them for a better projection and modulation of images containing complex light, which seemingly is necessary in the delivery of an immersive experience. High complexity in design without adding a third dimension is suitable for wearable devices and portable electronics. Advancing manufacturing technologies, including advances in lithography and etching processes, are lowering production costs, making binary and multilevel DOEs more accessible to a much broader range of markets. Thus, these DOEs are increasingly becoming a key enabler for the next-generation optical systems and are augmenting their rapid market growth.

Based on the application, biomedical devices segment is projected to dominate during the forecast period.

The demand in biomedical devices is expected to dominate in diffractive optical element market during the forecast period as medical technologies increasingly become more precise and miniaturized. DOEs are critical to more efficient operation and utilization of medical devices such as imaging systems, diagnostic tools, and lasers used in surgery applications wherein accuracy in light manipulation dictates effective treatment and patient safety. DOEs are critical in some advanced imaging techniques, for example, optical coherence tomography (OCT), ophthalmology, dermatology, and cardiovascular diagnostics.

Minimally invasive procedures have also contributed to this trend. DOEs are significantly involved in the production of laser beams used in applications like laser eye surgery and other focused therapies. With most healthcare systems around the world moving toward better outcomes for patients and faster recovery times, the demand is expected to be increased for highly precise biomedical devices. Apart from these, the rising trends of chronic diseases and aging population are expected to boost investment in advanced medical technologies, thereby solidifying the dominance of biomedical applications during the forecast period.


Based on Region, Asia Pacific Region to Grow Fastest During the Forecasted Period.

The Asia-Pacific region is expected to have fastest growth rate in the diffractive optical element (DOE) market during the forecast period. Several key factors drive the changes towards future development of DOE in the Asia-Pacific region. Major factor include rapid industrialization and expansion of industries in developing countries such as China, Japan, South Korea, and India. These countries rank among the world's leading consumer electronics, telecommunication, and automotive manufacturing centers. The DOEs in these countries play a very critical role in advanced optical systems used in laser processing, Augmented Reality (AR), and virtual reality (VR) devices.

Another application for DOE include research and development in photonics and optics in this region. In addition, asia Pacific has major semiconductor and electronics manufacturers, which are expected to drive demand for advanced optical technologies. Moreover, the recent advances in medical infrastructure, coupled with the growth of the region's demand for laser-based health care solutions are fuleing the growth. As these markets for healthcare and medical sciences grow, demand for DOEs is expected to increase.

HIGHEST CAGR MARKET IN 2023
ASIA PACIFIC FASTEST GROWING MARKET IN THE REGION

Recent Developments of Diffractive Optical Element Market industry

  • In January 2024, The company launched 15 standard off-the-shelf diffractive optical elements in glass. The diffractive optical elements are fabricated from Fused Silica glass using etching techniques, with an anti-reflective coating applied to both sides of the glass substrate. There are 10 multi-level DOEs which were optimized for wavelengths around 1030 nm, and 5 binary DOEs optimized for wavelengths around 1550 nm.
  • In January 2024, HOLOEYE offers 10 new kinds of standard off-the-shelf Diffractive Optical Elements made of glass. These DOEs are designed for optimal use with a wavelength around 450 nm. Each DOE is 5 mm x 5.75 mm in size and with a thickness of 0.725 mm
  • In October 2023, Coherent Corp., a leader in industrial laser optics, announced the launch of a new product line of diffractive optical elements (DOEs) designed for high-power industrial lasers. These DOE’s can achieve high optical efficiency and uniform laser beams.
  • In November 2022, Jenoptik, a leader in high-performance optical and photonic systems, has announced the latest expansion of its manufacturing operations in Florida. The new 7,110-square-foot addition will feature both open and modular cleanroom manufacturing areas, increasing the total production, engineering, and administrative space of the facility to 77,985 square feet.
  • In March 2022, HOLOEYE offers 13 off-the-shelf standard glass diffractive optical elements. The offered DOEs are optimized for a wavelength of approx. 800 nm. Made from Fused Silica, each DOE measures 9.95 x 9.35 mm with a thickness of 0.67 mm.

Key Market Players

Get online access to the report on the World's First Market Intelligence Cloud

  • Easy to Download Historical Data & Forecast Numbers
  • Company Analysis Dashboard for high growth potential opportunities
  • Research Analyst Access for customization & queries
  • Competitor Analysis with Interactive dashboard
  • Latest News, Updates & Trend analysis
Request Sample

Scope of the Report

Report Attribute Details
Market size available for years 2020–2030
Forecast units Value (USD Million) and Volume (Thousand Units)
Segments Covered By Type, Component, Application, End User and Region
Geographies covered North America, Europe, Asia Pacific, and Rest of the World

Key Questions Addressed by the Report

Which are the major companies in the diffractive optical element market? What are their significant strategies to strengthen their market presence?
The major companies in the diffractive optical element market are – Zeiss Group (Germany), AGC Inc (Japan), Cohernet Corp (US), Jenoptik (Germany), HOLO/OR Ltd (Israel),. The major strategies adopted by these players are product launches and developments, collaborations, acquisitions, and expansions.
What is the potential market for the diffractive optical element in terms of the region?
The Asia Pacific region is expected to dominate the diffractive optical element market due to the presence of major companies in various industries.
What are the opportunities for new market entrants?
There are significant opportunities in the diffractive optical element market for start-up companies. These companies provide innovative and diverse product portfolios.
What are the drivers and opportunities for the diffractive optical element market?
Factors such as advancements in laser technology and emerging technologies such as AR/VR are fueling the growth.
What are the major diffractive optical element applications expected to drive the market's growth in the next five years?
The major applications for the diffractive optical element are AR/VR, AR/VR, Rapid Optical, Prototyping, Abberration Correction, Lightweight Optics, Illumination Systems, Spectroscopy, Imaging and Sensing, Laser Material Processing, Lidar, Biomedical Devices, Holography, Metrology and Industrialssss Inspection. They are expected to have a significant share in this market.


Personalize This Research

  • Triangulate with your Own Data
  • Get Data as per your Format and Definition
  • Gain a Deeper Dive on a Specific Application, Geography, Customer or Competitor
  • Any level of Personalization
Request A Free Customisation

Let Us Help You

  • What are the Known and Unknown Adjacencies Impacting the Diffractive Optical Element Market
  • What will your New Revenue Sources be?
  • Who will be your Top Customer; what will make them switch?
  • Defend your Market Share or Win Competitors
  • Get a Scorecard for Target Partners
Request A Free Customisation

Table Of Content

Exclusive indicates content/data unique to MarketsandMarkets and not available with any competitors.

TITLE
PAGE NO
INTRODUCTION
23
RESEARCH METHODOLOGY
27
EXECUTIVE SUMMARY
38
PREMIUM INSIGHTS
42
MARKET OVERVIEW
45
  • 5.1 INTRODUCTION
  • 5.2 MARKET DYNAMICS
    DRIVERS
    - Advancements in laser technology
    - Increasing demand for medical devices
    - Rising use of optical elements in telecommunications and data centers
    RESTRAINTS
    - Competition from alternative technologies
    OPPORTUNITIES
    - Emerging applications in augmented reality (AR) and virtual reality (VR)
    - Rising demand for automotive head-up displays
    CHALLENGES
    - Uncertainties in DOE fabrication
    - High manufacturing costs
  • 5.3 VALUE CHAIN ANALYSIS
  • 5.4 ECOSYSTEM ANALYSIS
  • 5.5 TRENDS/DISRUPTIONS IMPACTING CUSTOMER BUSINESS
  • 5.6 PRICING ANALYSIS
    AVERAGE SELLING PRICE TREND OF DIFFRACTIVE OPTICAL ELEMENT HARDWARE OFFERED BY KEY PLAYERS
    AVERAGE SELLING PRICE TREND OF DIFFRACTIVE OPTICAL ELEMENT, BY COMPONENT
    AVERAGE SELLING PRICE TREND OF DIFFRACTIVE OPTICAL ELEMENT HARDWARE, BY REGION
  • 5.7 TECHNOLOGY ANALYSIS
    KEY TECHNOLOGIES
    - Holography
    COMPLEMENTARY TECHNOLOGIES
    - Photolithography
    - Integrated photonics
    ADJACENT TECHNOLOGIES
    - Fresnel zone plates
  • 5.8 PORTER'S FIVE FORCES ANALYSIS
    INTENSITY OF COMPETITIVE RIVALRY
    BARGAINING POWER OF SUPPLIERS
    BARGAINING POWER OF BUYERS
    THREAT OF SUBSTITUTES
    THREAT OF NEW ENTRANTS
  • 5.9 KEY STAKEHOLDERS AND BUYING CRITERIA
    KEY STAKEHOLDERS IN BUYING PROCESS
    BUYING CRITERIA
  • 5.10 CASE STUDY ANALYSIS
    ENHANCED PRECISION IN AESTHETIC LASER TREATMENTS
    REVOLUTIONARY LARGE-AREA SURFACE TEXTURING WITH DLITE DIFFRACTIVE BEAM SPLITTERS
    OPTIMIZED FOCUSING OPTICS FOR ULTRA-SHORT PULSED LASERS
  • 5.11 INVESTMENT AND FUNDING SCENARIO
  • 5.12 TRADE ANALYSIS
    IMPORT DATA (HS CODE 9002)
    EXPORT DATA (HS CODE 9002)
  • 5.13 PATENT ANALYSIS
  • 5.14 KEY CONFERENCES AND EVENTS, 2024–2025
  • 5.15 TARIFF AND REGULATORY LANDSCAPE
    REGULATORY BODIES, GOVERNMENT AGENCIES, AND OTHER ORGANIZATIONS
  • 5.16 TARIFF ANALYSIS
  • 5.17 STANDARDS
  • 5.18 IMPACT OF AI ON DIFFRACTIVE OPTICAL ELEMENT MARKET
    INTRODUCTION
    AI-SPECIFIC USE CASES
DIFFRACTIVE OPTICAL ELEMENT MARKET, BY TYPE
75
  • 6.1 INTRODUCTION
  • 6.2 DIFFRACTIVE BEAM SPLITTERS
    RISING DEMAND FOR HIGH-PRECISION LASER TECHNOLOGY TO DRIVE MARKET GROWTH
  • 6.3 DIFFRACTIVE PATTERN GENERATORS
    EXPANSION OF MEDICAL LASER APPLICATIONS TO BOOST SEGMENT GROWTH
  • 6.4 DIFFRACTIVE BEAM SHAPERS/DIFFRACTIVE DIFFUSERS
    FLAT TOP
    - Growing demand for uniform beam distribution in semiconductor processing to boost growth
    LINE TOP
    - Advancements in laser systems for manufacturing and inspection to fuel market growth
    SPOT ARRAY
    - Growing need for rapid material processing in various industries to boost segment growth
    OTHERS
DIFFRACTIVE OPTICAL ELEMENT MARKET, BY COMPONENT
81
  • 7.1 INTRODUCTION
  • 7.2 BINARY/MULTILEVEL DOE
    RISING DEMAND FOR ADVANCED OPTICAL COMPONENTS ACROSS INDUSTRIES TO BOOST MARKET GROWTH
  • 7.3 DIFFRACTIVE LENSES
    ADVANCEMENTS IN PHOTONICS AND OPTOELECTRONICS TECHNOLOGIES TO FUEL MARKET GROWTH
  • 7.4 DIFFUSING MATERIALS
    INCREASED DEMAND FOR PRECISION OPTICAL COMPONENTS TO BOOST SEGMENT GROWTH
  • 7.5 GRATINGS
    ADVANCEMENTS IN FABRICATION TECHNIQUES – KEY DRIVER
DIFFRACTIVE OPTICAL ELEMENT MARKET, BY APPLICATION
94
  • 8.1 INTRODUCTION
  • 8.2 AR/VR
    GROWING INTEREST IN AR/VR TO BOOST MARKET GROWTH
  • 8.3 RAPID OPTICAL PROTOTYPING
    RISING ADOPTION OF ADVANCED OPTICAL TECHNOLOGIES TO BOOST SEGMENT
  • 8.4 ABERRATION CORRECTION
    RISING DEMAND FOR HIGH-PERFORMANCE OPTICAL SYSTEMS TO DRIVE SEGMENT
  • 8.5 LIGHTWEIGHT OPTICS
    ADVANCEMENTS IN MANUFACTURING AND MINIATURIZATION TO FUEL MARKET GROWTH
  • 8.6 ILLUMINATION SYSTEMS
    RAPID ADOPTION IN AUTOMOTIVE INDUSTRY TO DRIVE SEGMENT
  • 8.7 SPECTROSCOPY
    INCREASING APPLICATIONS OF SPECTROSCOPY ACROSS INDUSTRIES TO DRIVE SEGMENT
  • 8.8 IMAGING & SENSING
    RISING DEMAND FOR SENSORS IN EMERGING TECHNOLOGIES TO FUEL GROWTH
  • 8.9 LASER MATERIAL PROCESSING
    ADVANCEMENTS IN LASER TECHNOLOGY AND MANUFACTURING PROCESSES TO PROPEL SEGMENT
  • 8.10 LIDAR
    INCREASING APPLICATIONS OF LIDAR TO BOOST MARKET GROWTH
  • 8.11 BIOMEDICAL DEVICES
    HIGH DEMAND FOR ADVANCED DIAGNOSTIC TOOLS TO FUEL SEGMENT
  • 8.12 HOLOGRAPHY
    ADOPTION OF HOLOGRAM OPTICAL ELEMENTS IN VARIOUS SECTORS TO GROW SEGMENT
  • 8.13 METROLOGY & INDUSTRIAL INSPECTION
    RAPID GROWTH OF INSPECTION SYSTEMS IN INDUSTRIES TO FUEL SEGMENT
  • 8.14 OTHER APPLICATIONS
DIFFRACTIVE OPTICAL ELEMENT MARKET, BY END-USE SECTOR
110
  • 9.1 INTRODUCTION
  • 9.2 CONSUMER ELECTRONICS
    RISING ADOPTION OF AUGMENTED AND VIRTUAL REALITY TO DRIVE MARKET GROWTH
  • 9.3 AUTOMOTIVE
    INTEGRATION OF LIDAR SYSTEMS IN ADAS TO FUEL MARKET GROWTH
  • 9.4 AEROSPACE & DEFENSE
    USE IN ANTI-DRONE AND ROCKET DEFENSE SYSTEMS TO DRIVE SEGMENT GROWTH
  • 9.5 HEALTHCARE
    INVESTMENTS IN CELLULAR IMAGING TECHNOLOGIES TO DRIVE MARKET GROWTH
  • 9.6 SEMICONDUCTOR
    ADVANCEMENTS IN DEEP ULTRAVIOLET INSPECTION SYSTEMS TO FUEL MARKET GROWTH
  • 9.7 IT & TELECOMMUNICATION
    HIGH-SPEED DATA TRANSMISSION AND ADVANCEMENTS IN DOE TECHNOLOGY TO FUEL MARKET GROWTH
  • 9.8 INDUSTRIAL
    INCREASING ADOPTION OF INDUSTRY 4.0 AND ADDITIVE MANUFACTURING TO DRIVE MARKET GROWTH
  • 9.9 OTHERS
    ADVANCEMENTS IN SPECTROSCOPY TO FUEL MARKET GROWTH
DIFFRACTIVE OPTICAL ELEMENT MARKET, BY REGION
143
  • 10.1 INTRODUCTION
  • 10.2 NORTH AMERICA
    MACROECONOMIC OUTLOOK FOR NORTH AMERICA
    US
    - Advancements in laser technology to drive market growth
    CANADA
    - Investments in renewable energy and photonics industries to fuel market growth
    MEXICO
    - Increased funding in semiconductor and advanced infrastructure to boost market growth
  • 10.3 EUROPE
    MACROECONOMIC OUTLOOK FOR EUROPE
    GERMANY
    - LiDAR advancements and industry leadership to contribute toward market growth
    UK
    - Holographic technology advances and AR growth to fuel market growth
    FRANCE
    - Advancements in quantum computing and photonics to drive market growth
    REST OF EUROPE
    - Advancements in nanotechnology and flat optics to fuel market growth
  • 10.4 ASIA PACIFIC
    MACROECONOMIC OUTLOOK FOR ASIA PACIFIC
    CHINA
    - Technological advancement and strong government support to drive market growth
    JAPAN
    - Rising demand for laser fusion technology and precision optical solutions to accelerate market growth
    SOUTH KOREA
    - Advancements in semiconductor manufacturing and government support to enhance market growth
    REST OF ASIA PACIFIC
    - Investments in AR, VR, and environmental monitoring technologies to drive market growth
  • 10.5 ROW
    MACROECONOMIC OUTLOOK FOR ROW
    MIDDLE EAST & AFRICA
    - GCC Countries
    - Rest of Middle East
    SOUTH AMERICA
    - Investments in telecommunications and digital infrastructure to fuel market growth
COMPETITIVE LANDSCAPE
162
  • 11.1 OVERVIEW
  • 11.2 KEY PLAYER STRATEGIES/RIGHT TO WIN, 2021–2024
    PRODUCT PORTFOLIO
    REGIONAL FOCUS
    SOLUTION OFFERINGS
    ORGANIC/INORGANIC STRATEGIES
  • 11.3 REVENUE ANALYSIS, 2019–2023
  • 11.4 MARKET SHARE ANALYSIS, 2O23
  • 11.5 COMPANY VALUATION AND FINANCIAL METRICS
  • 11.6 BRAND/PRODUCT COMPARISON
  • 11.7 COMPANY EVALUATION MATRIX: KEY PLAYERS
    STARS
    EMERGING LEADERS
    PERVASIVE PLAYERS
    PARTICIPANTS
    COMPANY FOOTPRINT: KEY PLAYERS, 2023
    - Company footprint
    - Type Footprint
    - Component Footprint
    - End-use Sector Footprint
    - Region Footprint
  • 11.8 COMPANY EVALUATION MATRIX: STARTUPS/SMES, 2023
    PROGRESSIVE COMPANIES
    RESPONSIVE COMPANIES
    DYNAMIC COMPANIES
    STARTING BLOCKS
    COMPETITIVE BENCHMARKING: STARTUPS/SMES, 2023
    - Detailed list of key startups/SMEs
    - Competitive benchmarking of key startups/SMEs
  • 11.9 COMPETITIVE SCENARIO
    PRODUCT LAUNCHES
COMPANY PROFILES
181
  • 12.1 KEY PLAYERS
    ZEISS GROUP
    - Business overview
    - Products/Solutions/Services offered
    - Recent developments
    - MnM view
    AGC INC.
    - Business overview
    - Products/Solutions/Services offered
    - MnM view
    COHERENT CORP.
    - Business overview
    - Products/Solutions/Services offered
    - Recent developments
    - MnM view
    JENOPTIK
    - Business overview
    - Products/Solutions/Services offered
    - Recent developments
    - MnM view
    HOLO/OR LTD.
    - Business overview
    - Products/Solutions/Services offered
    - MnM view
    BROADCOM
    - Business overview
    - Products/Solutions/Services offered
    NALUX CO., LTD.
    - Business overview
    - Products/Solutions/Services offered
    HOLOEYE PHOTONICS AG
    - Business overview
    - Products/Solutions/Services offered
    - Recent developments
    NISSEI TECHNOLOGY CORPORATION
    - Business overview
    - Products/Solutions/Services offered
    SINTEC OPTRONICS PTE LTD
    - Business overview
    - Products/Solutions/Services offered
  • 12.2 OTHER PLAYERS
    NIL TECHNOLOGY
    LASER COMPONENTS
    APOLLO OPTICAL SYSTEMS INC.
    HYPERION OPTICS
    VIAVI SOLUTIONS INC.
    LASER OPTICAL ENGINEERING LTD
    DIOPTIC GMBH
    FOCUSLIGHT TECHNOLOGIES INC.
    OPTIGRATE CORP
    WUXI OPTONTECH LTD
    HOLOGRAPHIX LLC
    FRANKFURT LASER COMPANY
    AXETRIS AG
    WAVELENGTH OPTO-ELECTRONIC SINGAPORE
    EGISMOS CORP
APPENDIX
213
  • 13.1 INSIGHTS FROM INDUSTRY EXPERTS
  • 13.2 DISCUSSION GUIDE
  • 13.3 KNOWLEDGESTORE: MARKETSANDMARKETS’ SUBSCRIPTION PORTAL
  • 13.4 CUSTOMIZATION OPTIONS
  • 13.5 RELATED REPORTS
  • 13.6 AUTHOR DETAILS
LIST OF TABLES
 
  • TABLE 1 ROLE OF COMPANIES IN DIFFRACTIVE OPTICAL ELEMENT ECOSYSTEM
  • TABLE 2 AVERAGE SELLING PRICE TREND OF DIFFRACTIVE OPTICAL ELEMENT COMPONENTS OFFERED BY KEY PLAYERS (USD)
  • TABLE 3 DIFFRACTIVE OPTICAL ELEMENT MARKET: PORTER'S FIVE FORCES ANALYSIS
  • TABLE 4 INFLUENCE OF STAKEHOLDERS ON BUYING PROCESS FOR TOP THREE END-USE SECTORS
  • TABLE 5 KEY BUYING CRITERIA FOR TOP THREE END-USE SECTORS
  • TABLE 6 DIFFRACTIVE OPTICAL ELEMENT MARKET: PATENTS, 2020–2024
  • TABLE 7 DIFFRACTIVE OPTICAL ELEMENT MARKET: KEY CONFERENCES AND EVENTS, 2024–2025
  • TABLE 8 NORTH AMERICA: REGULATORY BODIES, GOVERNMENT AGENCIES, AND OTHER ORGANIZATIONS
  • TABLE 9 EUROPE: REGULATORY BODIES, GOVERNMENT AGENCIES, AND OTHER ORGANIZATIONS
  • TABLE 10 ASIA PACIFIC: REGULATORY BODIES, GOVERNMENT AGENCIES, AND OTHER ORGANIZATIONS
  • TABLE 11 ROW: REGULATORY BODIES, GOVERNMENT AGENCIES, AND OTHER ORGANIZATIONS
  • TABLE 12 MFN TARIFF FOR HS CODE 9002-COMPLIANT PRODUCTS EXPORTED BY CHINA
  • TABLE 13 DIFFRACTIVE OPTICAL ELEMENT MARKET, BY TYPE, 2020–2023 (USD MILLION)
  • TABLE 14 DIFFRACTIVE OPTICAL ELEMENT MARKET, BY TYPE, 2024–2030 (USD MILLION)
  • TABLE 15 DIFFRACTIVE BEAM SHAPERS/DIFFUSERS: DIFFRACTIVE OPTICAL ELEMENT MARKET, BY TYPE, 2020–2023 (USD MILLION)
  • TABLE 16 DIFFRACTIVE BEAM SHAPERS/DIFFUSERS: DIFFRACTIVE OPTICAL ELEMENT MARKET, BY TYPE, 2024–2030 (USD MILLION)
  • TABLE 17 DIFFRACTIVE OPTICAL ELEMENT MARKET, BY COMPONENT, 2020–2023 (USD MILLION)
  • TABLE 18 DIFFRACTIVE OPTICAL ELEMENT MARKET, BY COMPONENT, 2024–2030 (USD MILLION)
  • TABLE 19 DIFFRACTIVE OPTICAL ELEMENT MARKET, BY COMPONENT, 2020–2023 (THOUSAND UNITS)
  • TABLE 20 DIFFRACTIVE OPTICAL ELEMENT MARKET, BY COMPONENT, 2024–2030 (THOUSAND UNITS)
  • TABLE 21 BINARY/MULTILEVEL DOE: DIFFRACTIVE OPTICAL ELEMENT MARKET, BY APPLICATION, 2020–2023 (USD MILLION)
  • TABLE 22 BINARY/MULTILEVEL DOE: DIFFRACTIVE OPTICAL ELEMENT MARKET, BY APPLICATION, 2024–2030 (USD MILLION)
  • TABLE 23 BINARY/MULTILEVEL DOE: DIFFRACTIVE OPTICAL ELEMENT MARKET, BY END-USE SECTOR, 2020–2023 (USD MILLION)
  • TABLE 24 BINARY/MULTILEVEL DOE: DIFFRACTIVE OPTICAL ELEMENT MARKET, BY END-USE SECTOR, 2024–2030 (USD MILLION)
  • TABLE 25 DIFFRACTIVE LENSES: DIFFRACTIVE OPTICAL ELEMENT MARKET, BY APPLICATION, 2020–2023 (USD MILLION)
  • TABLE 26 DIFFRACTIVE LENSES: DIFFRACTIVE OPTICAL ELEMENT MARKET, BY APPLICATION, 2024–2030 (USD MILLION)
  • TABLE 27 DIFFRACTIVE LENSES: DIFFRACTIVE OPTICAL ELEMENT MARKET, BY END-USE SECTOR, 2020–2023 (USD MILLION)
  • TABLE 28 DIFFRACTIVE LENSES: DIFFRACTIVE OPTICAL ELEMENT MARKET, BY END-USE SECTOR, 2024–2030 (USD MILLION)
  • TABLE 29 DIFFUSING MATERIALS: DIFFRACTIVE OPTICAL ELEMENT MARKET, BY APPLICATION, 2020–2023 (USD MILLION)
  • TABLE 30 DIFFUSING MATERIALS: DIFFRACTIVE OPTICAL ELEMENT MARKET, BY APPLICATION, 2024–2030 (USD MILLION)
  • TABLE 31 DIFFUSING MATERIALS: DIFFRACTIVE OPTICAL ELEMENT MARKET, BY END-USE SECTOR, 2020–2023 (USD MILLION)
  • TABLE 32 DIFFUSING MATERIALS: DIFFRACTIVE OPTICAL ELEMENT MARKET, BY END-USE SECTOR, 2024–2030 (USD MILLION)
  • TABLE 33 GRATINGS: DIFFRACTIVE OPTICAL ELEMENT MARKET, BY APPLICATION, 2020–2023(USD MILLION)
  • TABLE 34 GRATINGS: DIFFRACTIVE OPTICAL ELEMENT MARKET, BY APPLICATION, 2024–2030 (USD MILLION)
  • TABLE 35 GRATINGS: DIFFRACTIVE OPTICAL ELEMENT MARKET, BY END-USE SECTOR, 2020–2023 (USD MILLION)
  • TABLE 36 GRATINGS: DIFFRACTIVE OPTICAL ELEMENT MARKET, BY END-USE SECTOR, 2024–2030 (USD MILLION)
  • TABLE 37 DIFFRACTIVE OPTICAL ELEMENT MARKET, BY APPLICATION, 2020–2023 (USD MILLION)
  • TABLE 38 DIFFRACTIVE OPTICAL ELEMENT MARKET, BY APPLICATION, 2024–2030 (USD MILLION)
  • TABLE 39 AR/VR: DIFFRACTIVE OPTICAL ELEMENT MARKET, BY COMPONENT, 2020–2023 (USD MILLION)
  • TABLE 40 AR/VR: DIFFRACTIVE OPTICAL ELEMENT MARKET, BY COMPONENT, 2024–2030 (USD MILLION)
  • TABLE 41 RAPID OPTICAL PROTOTYPING: DIFFRACTIVE OPTICAL ELEMENT MARKET, BY COMPONENT, 2020–2023 (USD MILLION)
  • TABLE 42 RAPID OPTICAL PROTOTYPING: DIFFRACTIVE OPTICAL ELEMENT MARKET, BY COMPONENT, 2024–2030 (USD MILLION)
  • TABLE 43 ABERRATION CORRECTION: DIFFRACTIVE OPTICAL ELEMENT MARKET, BY COMPONENT, 2020–2023 (USD MILLION)
  • TABLE 44 ABERRATION CORRECTION: DIFFRACTIVE OPTICAL ELEMENT MARKET, BY COMPONENT, 2024–2030 (USD MILLION)
  • TABLE 45 LIGHTWEIGHT OPTICS: DIFFRACTIVE OPTICAL ELEMENT MARKET, BY COMPONENT, 2020–2023 (USD MILLION)
  • TABLE 46 LIGHTWEIGHT OPTICS: DIFFRACTIVE OPTICAL ELEMENT MARKET, BY COMPONENT, 2024–2030 (USD MILLION)
  • TABLE 47 ILLUMINATION SYSTEMS: DIFFRACTIVE OPTICAL ELEMENT MARKET, BY COMPONENT, 2020–2023 (USD MILLION)
  • TABLE 48 ILLUMINATION SYSTEMS: DIFFRACTIVE OPTICAL ELEMENT MARKET, BY COMPONENT, 2024–2030 (USD MILLION)
  • TABLE 49 SPECTROSCOPY: DIFFRACTIVE OPTICAL ELEMENT MARKET, BY COMPONENT, 2020–2023 (USD MILLION)
  • TABLE 50 SPECTROSCOPY: DIFFRACTIVE OPTICAL ELEMENT MARKET, BY COMPONENT, 2024–2030 (USD MILLION)
  • TABLE 51 IMAGING & SENSING: DIFFRACTIVE OPTICAL ELEMENT MARKET, BY COMPONENT, 2020–2023 (USD MILLION)
  • TABLE 52 IMAGING & SENSING: DIFFRACTIVE OPTICAL ELEMENT MARKET, BY COMPONENT, 2024–2030 (USD MILLION)
  • TABLE 53 LASER MATERIAL PROCESSING: DIFFRACTIVE OPTICAL ELEMENT MARKET, BY COMPONENT, 2020–2023 (USD MILLION)
  • TABLE 54 LASER MATERIAL PROCESSING: DIFFRACTIVE OPTICAL ELEMENT MARKET, BY COMPONENT, 2024–2030 (USD MILLION)
  • TABLE 55 LIDAR: DIFFRACTIVE OPTICAL ELEMENT MARKET, BY COMPONENT, 2020–2023 (USD MILLION)
  • TABLE 56 LIDAR: DIFFRACTIVE OPTICAL ELEMENT MARKET, BY COMPONENT, 2024–2030 (USD MILLION)
  • TABLE 57 BIOMEDICAL DEVICES: DIFFRACTIVE OPTICAL ELEMENT MARKET, BY COMPONENT, 2020–2023 (USD MILLION)
  • TABLE 58 BIOMEDICAL DEVICES: DIFFRACTIVE OPTICAL ELEMENT MARKET, BY COMPONENT, 2024–2030 (USD MILLION)
  • TABLE 59 HOLOGRAPHY: DIFFRACTIVE OPTICAL ELEMENT MARKET, BY COMPONENT, 2020–2023 (USD MILLION)
  • TABLE 60 HOLOGRAPHY: DIFFRACTIVE OPTICAL ELEMENT MARKET, BY COMPONENT, 2024–2030 (USD MILLION)
  • TABLE 61 METROLOGY & INDUSTRIAL INSPECTION: DIFFRACTIVE OPTICAL ELEMENT MARKET, BY COMPONENT, 2020–2023 (USD MILLION)
  • TABLE 62 METROLOGY & INDUSTRIAL INSPECTION: DIFFRACTIVE OPTICAL ELEMENT MARKET, BY COMPONENT, 2024–2030 (USD MILLION)
  • TABLE 63 OTHER APPLICATIONS: DIFFRACTIVE OPTICAL ELEMENT MARKET, BY COMPONENT, 2020–2023 (USD MILLION)
  • TABLE 64 OTHER APPLICATIONS: DIFFRACTIVE OPTICAL ELEMENT MARKET, BY COMPONENT, 2024–2030 (USD MILLION)
  • TABLE 65 DIFFRACTIVE OPTICAL ELEMENT MARKET, BY END-USE SECTOR, 2020–2023 (USD MILLION)
  • TABLE 66 DIFFRACTIVE OPTICAL ELEMENT MARKET, BY END-USE SECTOR, 2024–2030 (USD MILLION)
  • TABLE 67 CONSUMER ELECTRONICS: DIFFRACTIVE OPTICAL ELEMENT MARKET, BY COMPONENT, 2020–2023 (USD MILLION)
  • TABLE 68 CONSUMER ELECTRONICS: DIFFRACTIVE OPTICAL ELEMENT MARKET, BY COMPONENT, 2024–2030 (USD MILLION)
  • TABLE 69 CONSUMER ELECTRONICS: DIFFRACTIVE OPTICAL ELEMENT MARKET, BY REGION, 2020–2023 (USD MILLION)
  • TABLE 70 CONSUMER ELECTRONICS: DIFFRACTIVE OPTICAL ELEMENT MARKET, BY REGION, 2024–2030 (USD MILLION)
  • TABLE 71 CONSUMER ELECTRONICS: NORTH AMERICA DIFFRACTIVE OPTICAL ELEMENT MARKET, BY COUNTRY, 2020–2023 (USD MILLION)
  • TABLE 72 CONSUMER ELECTRONICS: NORTH AMERICA DIFFRACTIVE OPTICAL ELEMENT MARKET, BY COUNTRY, 2024–2030 (USD MILLION)
  • TABLE 73 CONSUMER ELECTRONICS: EUROPE DIFFRACTIVE OPTICAL ELEMENT MARKET, BY COUNTRY, 2020–2023 (USD MILLION)
  • TABLE 74 CONSUMER ELECTRONICS: EUROPE DIFFRACTIVE OPTICAL ELEMENT MARKET, BY COUNTRY, 2024–2030 (USD MILLION)
  • TABLE 75 CONSUMER ELECTRONICS: ASIA PACIFIC DIFFRACTIVE OPTICAL ELEMENT MARKET, BY COUNTRY, 2020–2023 (USD MILLION)
  • TABLE 76 CONSUMER ELECTRONICS: ASIA PACIFIC DIFFRACTIVE OPTICAL ELEMENT MARKET, BY COUNTRY, 2024–2030 (USD MILLION)
  • TABLE 77 CONSUMER ELECTRONICS: ROW DIFFRACTIVE OPTICAL ELEMENT MARKET, BY REGION, 2020–2023 (USD MILLION)
  • TABLE 78 CONSUMER ELECTRONICS: ROW DIFFRACTIVE OPTICAL ELEMENT MARKET, BY REGION, 2024–2030 (USD MILLION)
  • TABLE 79 AUTOMOTIVE: DIFFRACTIVE OPTICAL ELEMENT MARKET, BY COMPONENT, 2020–2023 (USD MILLION)
  • TABLE 80 AUTOMOTIVE: DIFFRACTIVE OPTICAL ELEMENT MARKET, BY COMPONENT, 2024–2030 (USD MILLION)
  • TABLE 81 AUTOMOTIVE: DIFFRACTIVE OPTICAL ELEMENT MARKET, BY REGION, 2020–2023 (USD MILLION)
  • TABLE 82 AUTOMOTIVE: DIFFRACTIVE OPTICAL ELEMENT MARKET, BY REGION, 2024–2030 (USD MILLION)
  • TABLE 83 AUTOMOTIVE: NORTH AMERICA DIFFRACTIVE OPTICAL ELEMENT MARKET, BY COUNTRY, 2020–2023 (USD MILLION)
  • TABLE 84 AUTOMOTIVE: NORTH AMERICA DIFFRACTIVE OPTICAL ELEMENT MARKET, BY COUNTRY, 2024–2030 (USD MILLION)
  • TABLE 85 AUTOMOTIVE: EUROPE DIFFRACTIVE OPTICAL ELEMENT MARKET, BY COUNTRY, 2020–2023 (USD MILLION)
  • TABLE 86 AUTOMOTIVE: EUROPE DIFFRACTIVE OPTICAL ELEMENT MARKET, BY COUNTRY, 2024–2030 (USD MILLION)
  • TABLE 87 AUTOMOTIVE: ASIA PACIFIC DIFFRACTIVE OPTICAL ELEMENT MARKET, BY COUNTRY, 2020–2023 (USD MILLION)
  • TABLE 88 AUTOMOTIVE: ASIA PACIFIC DIFFRACTIVE OPTICAL ELEMENT MARKET, BY COUNTRY, 2024–2030 (USD MILLION)
  • TABLE 89 AUTOMOTIVE: ROW DIFFRACTIVE OPTICAL ELEMENT MARKET, BY REGION, 2020–2023 (USD MILLION)
  • TABLE 90 AUTOMOTIVE: ROW DIFFRACTIVE OPTICAL ELEMENT MARKET, BY REGION, 2024–2030 (USD MILLION)
  • TABLE 91 AEROSPACE & DEFENSE: DIFFRACTIVE OPTICAL ELEMENT MARKET, BY COMPONENT, 2020–2023 (USD MILLION)
  • TABLE 92 AEROSPACE & DEFENSE: DIFFRACTIVE OPTICAL ELEMENT MARKET, BY COMPONENT, 2024–2030 (USD MILLION)
  • TABLE 93 AEROSPACE & DEFENSE: DIFFRACTIVE OPTICAL ELEMENT MARKET, BY REGION, 2020–2023 (USD MILLION)
  • TABLE 94 AEROSPACE & DEFENSE: DIFFRACTIVE OPTICAL ELEMENT MARKET, BY REGION, 2024–2030 (USD MILLION)
  • TABLE 95 AEROSPACE & DEFENSE: NORTH AMERICA DIFFRACTIVE OPTICAL ELEMENT MARKET, BY COUNTRY, 2020–2023 (USD MILLION)
  • TABLE 96 AEROSPACE & DEFENSE: NORTH AMERICA DIFFRACTIVE OPTICAL ELEMENT MARKET, BY COUNTRY, 2024–2030 (USD MILLION)
  • TABLE 97 AEROSPACE & DEFENSE: EUROPE DIFFRACTIVE OPTICAL ELEMENT MARKET, BY COUNTRY, 2020–2023 (USD MILLION)
  • TABLE 98 AEROSPACE & DEFENSE: EUROPE DIFFRACTIVE OPTICAL ELEMENT MARKET, BY COUNTRY, 2024–2030 (USD MILLION)
  • TABLE 99 AEROSPACE & DEFENSE: ASIA PACIFIC DIFFRACTIVE OPTICAL ELEMENT MARKET, BY COUNTRY, 2020–2023 (USD MILLION)
  • TABLE 100 AEROSPACE & DEFENSE: ASIA PACIFIC DIFFRACTIVE OPTICAL ELEMENT MARKET, BY COUNTRY, 2024–2030 (USD MILLION)
  • TABLE 101 AEROSPACE & DEFENSE: ROW DIFFRACTIVE OPTICAL ELEMENT MARKET, BY REGION, 2020–2023 (USD MILLION)
  • TABLE 102 AEROSPACE & DEFENSE: ROW DIFFRACTIVE OPTICAL ELEMENT MARKET, BY REGION, 2024–2030 (USD MILLION)
  • TABLE 103 HEALTHCARE: DIFFRACTIVE OPTICAL ELEMENT MARKET, BY COMPONENT, 2020–2023 (USD MILLION)
  • TABLE 104 HEALTHCARE: DIFFRACTIVE OPTICAL ELEMENT MARKET, BY COMPONENT, 2024–2030 (USD MILLION)
  • TABLE 105 HEALTHCARE: DIFFRACTIVE OPTICAL ELEMENT MARKET, BY REGION, 2020–2023 (USD MILLION)
  • TABLE 106 HEALTHCARE: DIFFRACTIVE OPTICAL ELEMENT MARKET, BY REGION, 2024–2030 (USD MILLION)
  • TABLE 107 HEALTHCARE: NORTH AMERICA DIFFRACTIVE OPTICAL ELEMENT MARKET, BY COUNTRY, 2020–2023 (USD MILLION)
  • TABLE 108 HEALTHCARE: NORTH AMERICA DIFFRACTIVE OPTICAL ELEMENT MARKET, BY COUNTRY, 2024–2030 (USD MILLION)
  • TABLE 109 HEALTHCARE: EUROPE DIFFRACTIVE OPTICAL ELEMENT MARKET, BY COUNTRY, 2020–2023 (USD MILLION)
  • TABLE 110 HEALTHCARE: EUROPE DIFFRACTIVE OPTICAL ELEMENT MARKET, BY COUNTRY, 2024–2030 (USD MILLION)
  • TABLE 111 HEALTHCARE: ASIA PACIFIC DIFFRACTIVE OPTICAL ELEMENT MARKET, BY COUNTRY, 2020–2023 (USD MILLION)
  • TABLE 112 HEALTHCARE: ASIA PACIFIC DIFFRACTIVE OPTICAL ELEMENT MARKET, BY COUNTRY, 2024–2030 (USD MILLION)
  • TABLE 113 HEALTHCARE: ROW DIFFRACTIVE OPTICAL ELEMENT MARKET, BY REGION, 2020–2023 (USD MILLION)
  • TABLE 114 HEALTHCARE: ROW DIFFRACTIVE OPTICAL ELEMENT MARKET, BY REGION, 2024–2030 (USD MILLION)
  • TABLE 115 SEMICONDUCTOR: DIFFRACTIVE OPTICAL ELEMENT MARKET, BY COMPONENT, 2020–2023 (USD MILLION)
  • TABLE 116 SEMICONDUCTOR: DIFFRACTIVE OPTICAL ELEMENT MARKET, BY COMPONENT, 2024–2030 (USD MILLION)
  • TABLE 117 SEMICONDUCTOR: DIFFRACTIVE OPTICAL ELEMENT MARKET, BY REGION, 2020–2023 (USD MILLION)
  • TABLE 118 SEMICONDUCTOR: DIFFRACTIVE OPTICAL ELEMENT MARKET, BY REGION, 2024–2030 (USD MILLION)
  • TABLE 119 SEMICONDUCTOR: NORTH AMERICA DIFFRACTIVE OPTICAL ELEMENT MARKET, BY COUNTRY, 2020–2023 (USD MILLION)
  • TABLE 120 SEMICONDUCTOR: NORTH AMERICA DIFFRACTIVE OPTICAL ELEMENT MARKET, BY COUNTRY, 2024–2030 (USD MILLION)
  • TABLE 121 SEMICONDUCTOR: EUROPE DIFFRACTIVE OPTICAL ELEMENT MARKET, BY COUNTRY, 2020–2023 (USD MILLION)
  • TABLE 122 SEMICONDUCTOR: EUROPE DIFFRACTIVE OPTICAL ELEMENT MARKET, BY COUNTRY, 2024–2030 (USD MILLION)
  • TABLE 123 SEMICONDUCTOR: ASIA PACIFIC DIFFRACTIVE OPTICAL ELEMENT MARKET, BY COUNTRY, 2020–2023 (USD MILLION)
  • TABLE 124 SEMICONDUCTOR: ASIA PACIFIC DIFFRACTIVE OPTICAL ELEMENT MARKET, BY COUNTRY, 2024–2030 (USD MILLION)
  • TABLE 125 SEMICONDUCTOR: ROW DIFFRACTIVE OPTICAL ELEMENT MARKET, BY REGION, 2020–2023 (USD MILLION)
  • TABLE 126 SEMICONDUCTOR: ROW DIFFRACTIVE OPTICAL ELEMENT MARKET, BY REGION, 2024–2030 (USD MILLION)
  • TABLE 127 IT & TELECOMMUNICATION: DIFFRACTIVE OPTICAL ELEMENT MARKET, BY COMPONENT, 2020–2023 (USD MILLION)
  • TABLE 128 IT & TELECOMMUNICATION: DIFFRACTIVE OPTICAL ELEMENT MARKET, BY COMPONENT, 2024–2030 (USD MILLION)
  • TABLE 129 IT & TELECOMMUNICATION: DIFFRACTIVE OPTICAL ELEMENT MARKET, BY REGION, 2020–2023 (USD MILLION)
  • TABLE 130 IT & TELECOMMUNICATION: DIFFRACTIVE OPTICAL ELEMENT MARKET, BY REGION, 2024–2030 (USD MILLION)
  • TABLE 131 IT & TELECOMMUNICATION: NORTH AMERICA DIFFRACTIVE OPTICAL ELEMENT MARKET, BY COUNTRY, 2020–2023 (USD MILLION)
  • TABLE 132 IT & TELECOMMUNICATION: NORTH AMERICA DIFFRACTIVE OPTICAL ELEMENT MARKET, BY COUNTRY, 2024–2030 (USD MILLION)
  • TABLE 133 IT & TELECOMMUNICATION: EUROPE DIFFRACTIVE OPTICAL ELEMENT MARKET, BY COUNTRY, 2020–2023 (USD MILLION)
  • TABLE 134 IT & TELECOMMUNICATION: EUROPE DIFFRACTIVE OPTICAL ELEMENT MARKET, BY COUNTRY, 2024–2030 (USD MILLION)
  • TABLE 135 IT & TELECOMMUNICATION: ASIA PACIFIC DIFFRACTIVE OPTICAL ELEMENT MARKET, BY COUNTRY, 2020–2023 (USD MILLION)
  • TABLE 136 IT & TELECOMMUNICATION: ASIA PACIFIC DIFFRACTIVE OPTICAL ELEMENT MARKET, BY COUNTRY, 2024–2030 (USD MILLION)
  • TABLE 137 IT & TELECOMMUNICATION: ROW DIFFRACTIVE OPTICAL ELEMENT MARKET, BY REGION, 2020–2023 (USD MILLION)
  • TABLE 138 IT & TELECOMMUNICATION: ROW DIFFRACTIVE OPTICAL ELEMENT MARKET, BY REGION, 2024–2030 (USD MILLION)
  • TABLE 139 INDUSTRIAL: DIFFRACTIVE OPTICAL ELEMENT MARKET, BY COMPONENT, 2020–2023 (USD MILLION)
  • TABLE 140 INDUSTRIAL: DIFFRACTIVE OPTICAL ELEMENT MARKET, BY COMPONENT, 2024–2030 (USD MILLION)
  • TABLE 141 INDUSTRIAL: DIFFRACTIVE OPTICAL ELEMENT MARKET, BY REGION, 2020–2023 (USD MILLION)
  • TABLE 142 INDUSTRIAL: DIFFRACTIVE OPTICAL ELEMENT MARKET, BY REGION, 2024–2030 (USD MILLION)
  • TABLE 143 INDUSTRIAL: NORTH AMERICA DIFFRACTIVE OPTICAL ELEMENT MARKET, BY COUNTRY, 2020–2023 (USD MILLION)
  • TABLE 144 INDUSTRIAL: NORTH AMERICA DIFFRACTIVE OPTICAL ELEMENT MARKET, BY COUNTRY, 2024–2030 (USD MILLION)
  • TABLE 145 INDUSTRIAL: EUROPE DIFFRACTIVE OPTICAL ELEMENT MARKET, BY COUNTRY, 2020–2023 (USD MILLION)
  • TABLE 146 INDUSTRIAL: EUROPE DIFFRACTIVE OPTICAL ELEMENT MARKET, BY COUNTRY, 2024–2030 (USD MILLION)
  • TABLE 147 INDUSTRIAL: ASIA PACIFIC DIFFRACTIVE OPTICAL ELEMENT MARKET, BY COUNTRY, 2020–2023 (USD MILLION)
  • TABLE 148 INDUSTRIAL: ASIA PACIFIC DIFFRACTIVE OPTICAL ELEMENT MARKET, BY COUNTRY, 2024–2030 (USD MILLION)
  • TABLE 149 INDUSTRIAL: ROW DIFFRACTIVE OPTICAL ELEMENT MARKET, BY REGION, 2020–2023 (USD MILLION)
  • TABLE 150 INDUSTRIAL: ROW DIFFRACTIVE OPTICAL ELEMENT MARKET, BY REGION, 2024–2030 (USD MILLION)
  • TABLE 151 OTHER END-USE SECTORS: DIFFRACTIVE OPTICAL ELEMENT MARKET, BY COMPONENT, 2020–2023 (USD MILLION)
  • TABLE 152 OTHER END-USE SECTORS: DIFFRACTIVE OPTICAL ELEMENT MARKET, BY COMPONENT, 2024–2030 (USD MILLION)
  • TABLE 153 OTHER END-USE SECTORS: DIFFRACTIVE OPTICAL ELEMENT MARKET, BY REGION, 2020–2023 (USD MILLION)
  • TABLE 154 OTHER END-USE SECTORS: DIFFRACTIVE OPTICAL ELEMENT MARKET, BY REGION, 2024–2030 (USD MILLION)
  • TABLE 155 OTHER END-USE SECTORS: NORTH AMERICA DIFFRACTIVE OPTICAL ELEMENT MARKET, BY COUNTRY, 2020–2023 (USD MILLION)
  • TABLE 156 OTHER END-USE SECTORS: NORTH AMERICA DIFFRACTIVE OPTICAL ELEMENT MARKET, BY COUNTRY, 2024–2030 (USD MILLION)
  • TABLE 157 OTHER END-USE SECTORS: EUROPE DIFFRACTIVE OPTICAL ELEMENT MARKET, BY COUNTRY, 2020–2023 (USD MILLION)
  • TABLE 158 OTHER END-USE SECTORS: EUROPE DIFFRACTIVE OPTICAL ELEMENT MARKET, BY COUNTRY, 2024–2030 (USD MILLION)
  • TABLE 159 OTHER END-USE SECTORS: ASIA PACIFIC DIFFRACTIVE OPTICAL ELEMENT MARKET, BY COUNTRY, 2020–2023 (USD MILLION)
  • TABLE 160 OTHER END-USE SECTORS: ASIA PACIFIC DIFFRACTIVE OPTICAL ELEMENT MARKET, BY COUNTRY, 2024–2030 (USD MILLION)
  • TABLE 161 OTHER END-USE SECTORS: ROW DIFFRACTIVE OPTICAL ELEMENT MARKET, BY REGION, 2020–2023 (USD MILLION)
  • TABLE 162 OTHER END-USE SECTORS: ROW DIFFRACTIVE OPTICAL ELEMENT MARKET, BY REGION, 2024–2030 (USD MILLION)
  • TABLE 163 DIFFRACTIVE OPTICAL ELEMENT MARKET, BY REGION, 2020–2023 (USD MILLION)
  • TABLE 164 DIFFRACTIVE OPTICAL ELEMENT MARKET, BY REGION, 2024–2030 (USD MILLION)
  • TABLE 165 NORTH AMERICA: DIFFRACTIVE OPTICAL ELEMENT MARKET, BY COUNTRY, 2020–2023 (USD MILLION)
  • TABLE 166 NORTH AMERICA: DIFFRACTIVE OPTICAL ELEMENT MARKET, BY COUNTRY, 2024–2030 (USD MILLION)
  • TABLE 167 NORTH AMERICA: DIFFRACTIVE OPTICAL ELEMENT MARKET, BY END-USE SECTOR, 2020–2023 (USD MILLION)
  • TABLE 168 NORTH AMERICA: DIFFRACTIVE OPTICAL ELEMENT MARKET, BY END-USE SECTOR, 2024–2030 (USD MILLION)
  • TABLE 169 EUROPE: DIFFRACTIVE OPTICAL ELEMENT MARKET, BY COUNTRY, 2020–2023 (USD MILLION)
  • TABLE 170 EUROPE: DIFFRACTIVE OPTICAL ELEMENT MARKET, BY COUNTRY, 2024–2030 (USD MILLION)
  • TABLE 171 EUROPE: DIFFRACTIVE OPTICAL ELEMENT MARKET, BY END-USE SECTOR, 2020–2023 (USD MILLION)
  • TABLE 172 EUROPE: DIFFRACTIVE OPTICAL ELEMENT MARKET, BY END-USE SECTOR, 2024–2030 (USD MILLION)
  • TABLE 173 ASIA PACIFIC: DIFFRACTIVE OPTICAL ELEMENT MARKET, BY COUNTRY, 2020–2023 (USD MILLION)
  • TABLE 174 ASIA PACIFIC: DIFFRACTIVE OPTICAL ELEMENT MARKET, BY COUNTRY, 2024–2030 (USD MILLION)
  • TABLE 175 ASIA PACIFIC: DIFFRACTIVE OPTICAL ELEMENT MARKET, BY END-USE SECTOR, 2020–2023 (USD MILLION)
  • TABLE 176 ASIA PACIFIC: DIFFRACTIVE OPTICAL ELEMENT MARKET, BY END-USE SECTOR, 2024–2030 (USD MILLION)
  • TABLE 177 ROW: DIFFRACTIVE OPTICAL ELEMENT MARKET, BY REGION, 2020–2023 (USD MILLION)
  • TABLE 178 ROW: DIFFRACTIVE OPTICAL ELEMENT MARKET, BY REGION, 2024–2030 (USD MILLION)
  • TABLE 179 ROW: DIFFRACTIVE OPTICAL ELEMENT MARKET, BY END-USE SECTOR, 2020–2023 (USD MILLION)
  • TABLE 180 ROW: DIFFRACTIVE OPTICAL ELEMENT MARKET, BY END-USE SECTOR, 2024–2030 (USD MILLION)
  • TABLE 181 MIDDLE EAST: DIFFRACTIVE OPTICAL ELEMENT MARKET, BY COUNTRY, 2020–2023 (USD MILLION)
  • TABLE 182 MIDDLE EAST: DIFFRACTIVE OPTICAL ELEMENT MARKET, BY COUNTRY, 2024–2030 (USD MILLION)
  • TABLE 183 KEY PLAYER STRATEGIES/RIGHT TO WIN, 2021–2024
  • TABLE 184 DIFFRACTIVE OPTICAL ELEMENT MARKET: DEGREE OF COMPETITION, 2023
  • TABLE 185 DIFFRACTIVE OPTICAL ELEMENT MARKET: TYPE FOOTPRINT
  • TABLE 186 DIFFRACTIVE OPTICAL ELEMENT MARKET: COMPONENT FOOTPRINT
  • TABLE 187 DIFFRACTIVE OPTICAL ELEMENT MARKET: END-USE SECTOR FOOTPRINT
  • TABLE 188 DIFFRACTIVE OPTICAL ELEMENT MARKET: REGION FOOTPRINT
  • TABLE 189 DIFFRACTIVE OPTICAL ELEMENT MARKET: KEY STARTUPS/SMES
  • TABLE 190 DIFFRACTIVE OPTICAL ELEMENT MARKET: COMPETITIVE BENCHMARKING OF KEY STARTUPS/SMES
  • TABLE 191 DIFFRACTIVE OPTICAL ELEMENT MARKET: PRODUCT LAUNCHES, 2021−2024
  • TABLE 192 DIFFRACTIVE OPTICAL ELEMENT MARKET: EXPANSIONS, 2021–2024
  • TABLE 193 ZEISS GROUP: COMPANY OVERVIEW
  • TABLE 194 ZEISS GROUP: PRODUCTS/SOLUTIONS/SERVICES OFFERED
  • TABLE 195 ZEISS GROUP: EXPANSIONS
  • TABLE 196 AGC INC.: COMPANY OVERVIEW
  • TABLE 197 AGC INC.: PRODUCTS/SOLUTIONS/SERVICES OFFERED
  • TABLE 198 COHERENT CORP.: COMPANY OVERVIEW
  • TABLE 199 COHERENT CORP.: PRODUCTS/SOLUTIONS/SERVICES OFFERED
  • TABLE 200 COHERENT CORP.: PRODUCT LAUNCHES
  • TABLE 201 JENOPTIK: COMPANY OVERVIEW
  • TABLE 202 JENOPTIK: PRODUCTS/SOLUTIONS/SERVICES OFFERED
  • TABLE 203 JENOPTIK: EXPANSIONS
  • TABLE 204 HOLO/OR LTD.: COMPANY OVERVIEW
  • TABLE 205 HOLO/OR LTD.: PRODUCTS/SOLUTIONS/SERVICES OFFERED
  • TABLE 206 BROADCOM: COMPANY OVERVIEW
  • TABLE 207 BROADCOM: PRODUCTS/SOLUTIONS/SERVICES OFFERED
  • TABLE 208 NALUX CO., LTD.: COMPANY OVERVIEW
  • TABLE 209 NALUX CO., LTD.: PRODUCTS/SOLUTIONS/SERVICES OFFERED
  • TABLE 210 HOLOEYE PHOTONICS AG: COMPANY OVERVIEW
  • TABLE 211 HOLOEYE PHOTONICS AG: PRODUCTS/SOLUTIONS/SERVICES OFFERED
  • TABLE 212 HOLOEYE PHOTONICS AG: PRODUCT LAUNCHES
  • TABLE 213 NISSEI TECHNOLOGY CORPORATION: COMPANY OVERVIEW
  • TABLE 214 NISSEI TECHNOLOGY CORPORATION: PRODUCTS/SOLUTIONS/SERVICES OFFERED
  • TABLE 215 SINTEC OPTRONICS PTE LTD.: COMPANY OVERVIEW
  • TABLE 216 SINTEC OPTRONICS PTE LTD.: PRODUCTS/SOLUTIONS/SERVICES OFFERED
LIST OF FIGURES
 
  • FIGURE 1 DIFFRACTIVE OPTICAL ELEMENT MARKET SEGMENTATION AND REGIONAL SCOPE
  • FIGURE 2 DIFFRACTIVE OPTICAL ELEMENT MARKET: RESEARCH DESIGN
  • FIGURE 3 REVENUE GENERATED BY COMPANIES FROM SALES OF DIFFRACTIVE OPTICAL ELEMENT
  • FIGURE 4 DIFFRACTIVE OPTICAL ELEMENT MARKET: BOTTOM-UP APPROACH
  • FIGURE 5 MARKET SIZE ESTIMATION METHODOLOGY: TOP-DOWN APPROACH
  • FIGURE 6 DATA TRIANGULATION
  • FIGURE 7 DIFFRACTIVE PATTERN GENERATORS SEGMENT TO EXHIBIT HIGHER CAGR DURING FORECAST PERIOD
  • FIGURE 8 DIFFUSING MATERIALS SEGMENT TO DOMINATE MARKET IN 2024
  • FIGURE 9 CONSUMER ELECTRONICS SEGMENT TO RECORD HIGHEST CAGR DURING FORECAST PERIOD
  • FIGURE 10 ASIA PACIFIC TO EXHIBIT HIGHEST CAGR DURING FORECAST PERIOD
  • FIGURE 11 RAPID ADVANCEMENTS IN LASER TECHNOLOGY TO OFFER LUCRATIVE GROWTH OPPORTUNITIES
  • FIGURE 12 DIFFRACTIVE BEAM SHAPERS/DIFFUSERS SEGMENT TO DOMINATE DURING FORECAST PERIOD
  • FIGURE 13 LASER MATERIAL PROCESSING TO GROW FASTEST DURING FORECAST PERIOD
  • FIGURE 14 HEALTHCARE SEGMENT AND ASIA PACIFIC TO CLAIM LARGEST MARKET SHARE BY 2030
  • FIGURE 15 ASIA PACIFIC TO REGISTER HIGHEST CAGR DURING FORECAST PERIOD
  • FIGURE 16 DIFFRACTIVE OPTICAL ELEMENT MARKET DYNAMICS: DRIVERS, RESTRAINTS, OPPORTUNITIES, AND CHALLENGES
  • FIGURE 17 DRIVERS AND THEIR IMPACT ON DIFFRACTIVE OPTICAL ELEMENT MARKET
  • FIGURE 18 RESTRAINTS AND THEIR IMPACT ON DIFFRACTIVE OPTICAL ELEMENT MARKET
  • FIGURE 19 OPPORTUNITIES AND THEIR IMPACT ON DIFFRACTIVE OPTICAL ELEMENT MARKET
  • FIGURE 20 CHALLENGES AND THEIR IMPACT ON DIFFRACTIVE OPTICAL ELEMENT MARKET
  • FIGURE 21 DIFFRACTIVE OPTICAL ELEMENT MARKET: VALUE CHAIN ANALYSIS
  • FIGURE 22 DIFFRACTIVE OPTICAL ELEMENT MARKET: ECOSYSTEM ANALYSIS
  • FIGURE 23 TRENDS/DISRUPTIONS IMPACTING CUSTOMER BUSINESS
  • FIGURE 24 AVERAGE SELLING PRICE TREND OF DIFFRACTIVE OPTICAL ELEMENT COMPONENTS OFFERED BY KEY PLAYERS, 2023
  • FIGURE 25 AVERAGE SELLING PRICE TREND OF DIFFRACTIVE OPTICAL ELEMENT, BY COMPONENT, 2021–2023
  • FIGURE 26 AVERAGE SELLING PRICE TREND OF DIFFRACTIVE OPTICAL ELEMENT COMPONENT, BY REGION (USD)
  • FIGURE 27 DIFFRACTIVE OPTICAL ELEMENT MARKET: PORTER'S FIVE FORCES ANALYSIS
  • FIGURE 28 INFLUENCE OF STAKEHOLDERS ON BUYING PROCESS FOR TOP THREE END-USE SECTORS
  • FIGURE 29 KEY BUYING CRITERIA FOR TOP THREE END-USE SECTORS
  • FIGURE 30 FUNDS ACQUIRED BY COMPANIES IN AR AND VR
  • FIGURE 31 IMPORT DATA FOR HS CODE 9002-COMPLIANT PRODUCTS FOR TOP FIVE COUNTRIES, 2019–2023 (USD MILLION)
  • FIGURE 32 EXPORT DATA FOR HS CODE 9002-COMPLIANT PRODUCTS FOR TOP FIVE COUNTRIES, 2019–2023 (USD MILLION)
  • FIGURE 33 NUMBER OF PATENTS GRANTED IN DIFFRACTIVE OPTICAL ELEMENT MARKET, 2014-2024
  • FIGURE 34 AI USE CASES IN DIFFRACTIVE OPTICAL ELEMENT
  • FIGURE 35 DIFFRACTIVE BEAM SHAPERSS/DIFFUSERS TO HOLD LARGEST MARKET SHARE DURING FORECAST PERIOD
  • FIGURE 36 DIFFUSING MATERIALS TO DOMINATE MARKET DURING FORECAST PERIOD
  • FIGURE 37 LASER MATERIAL PROCESSING TO WITNESS HIGHEST CAGR DURING FORECAST PERIOD
  • FIGURE 38 CONSUMER ELECTRONICS TO WITNESS HIGHEST CAGR DURING FORECAST PERIOD
  • FIGURE 39 ASIA PACIFIC TO DOMINATE DIFFRACTIVE OPTICAL ELEMENT MARKET DURING FORECAST PERIOD
  • FIGURE 40 NORTH AMERICA: DIFFRACTIVE OPTICAL ELEMENT MARKET SNAPSHOT
  • FIGURE 41 EUROPE: DIFFRACTIVE OPTICAL ELEMENT MARKET SNAPSHOT
  • FIGURE 42 ASIA PACIFIC: DIFFRACTIVE OPTICAL ELEMENT MARKET SNAPSHOT
  • FIGURE 43 DIFFRACTIVE OPTICAL ELEMENT MARKET: REVENUE ANALYSIS OF TOP PLAYERS, 2019–2023
  • FIGURE 44 MARKET SHARE ANALYSIS OF KEY PLAYERS, 2023
  • FIGURE 45 COMPANY VALUATION, 2023 (USD BILLION)
  • FIGURE 46 FINANCIAL METRICS (EV/EBITDA), 2024
  • FIGURE 47 BRAND/PRODUCT COMPARISON
  • FIGURE 48 DIFFRACTIVE OPTICAL ELEMENT MARKET: EVALUATION MATRIX (KEY COMPANIES), 2023
  • FIGURE 49 DIFFRACTIVE OPTICAL ELEMENT MARKET: COMPANY FOOTPRINT
  • FIGURE 50 DIFFRACTIVE OPTICAL ELEMENT MARKET: COMPANY EVALUATION MATRIX (STARTUPS/SMES), 2023
  • FIGURE 51 ZEISS GROUP: COMPANY SNAPSHOT
  • FIGURE 52 AGC INC.: COMPANY SNAPSHOT
  • FIGURE 53 COHERENT CORP.: COMPANY SNAPSHOT
  • FIGURE 54 JENOPTIK: COMPANY SNAPSHOT
  • FIGURE 55 BROADCOM: COMPANY SNAPSHOT

The study used four major activities to estimate the market size of the diffractive optical element. Exhaustive secondary research was conducted to gather information on the market and its peer and parent markets. The next step was to validate these findings, assumptions, and sizing with industry experts across the value chain through primary research. Both top-down and bottom-up approaches were employed to estimate the total market size. Finally, market breakdown and data triangulation methods were utilized to estimate the market size for different segments and subsegments.

Secondary Research

The research methodology used to estimate and forecast the size of the diffractive optical element market began with the acquisition of data related to the revenues of key vendors in the market through secondary research. Various secondary sources have been referred to in the secondary research process for identifying and collecting information for this study. Secondary sources include annual reports, press releases, and investor presentations of companies; white papers, journals, certified publications, and articles by recognized authors; websites; directories; and databases. Secondary research has mainly been used to obtain key information about the value chain of the diffractive optical element market, key players, market classification, and segmentation according to the industry trends to the bottom-most level, geographic markets, and key developments from both market and technology-oriented perspectives. Secondary data has been collected and analyzed to determine the overall market size, further validated through primary research. The secondary research referred to for this research study involves the Semiconductor Industry Association (SIA), Electronic System Design Alliance (ESD Alliance), Institute of Electrical and Electronics Engineers (IEEE), Taiwan Semiconductor Industry Association (TSIA), European Semiconductor Industry Association (ESIA), and Korea Semiconductor Industry Association (KSIA). Moreover, the study involved extensive use of secondary sources, directories, and databases, such as Hoovers, Bloomberg Businessweek, Factiva, and OneSource, to identify and collect valuable information for a technical, market-oriented, and commercial study of the diffractive optical element market. Vendor offerings have been taken into consideration to determine market segmentation.

Primary Research

In the primary research, various primary sources from both the supply and demand sides have been interviewed to obtain the qualitative and quantitative information relevant to this report. Primary sources from the supply side include the key industry participants, subject-matter experts (SMEs), and C-level executives and consultants from various key companies and organizations in the diffractive optical element ecosystem. After the complete market engineering (including calculations for the market statistics, the market breakdown, the market size estimations, the market forecasting, and the data triangulation), extensive primary research has been conducted to verify and validate the critical market numbers obtained. Extensive qualitative and quantitative analyses have been performed during the market engineering process to list key information/insights throughout the report. Extensive primary research has been conducted after understanding the diffractive optical element market scenario through secondary research. Several primary interviews have been conducted with market experts from the demand and supply-side players across key regions, namely, North America, Europe, Asia Pacific, and the Rest of the World (Middle East, Africa, and South America). Various primary sources from both the supply and demand sides of the market have been interviewed to obtain qualitative and quantitative information. Following is the breakdown of the primary respondents.

Primary data has been collected through questionnaires, emails, and telephonic interviews. In the canvassing of primaries, various departments within organizations, such as sales, operations, and administration, were covered to provide a holistic viewpoint in our report. After interacting with industry experts, brief sessions were conducted with highly experienced independent consultants to reinforce the findings from our primaries. This and the in-house subject matter experts’ opinions have led us to the findings described in the remainder of this report.

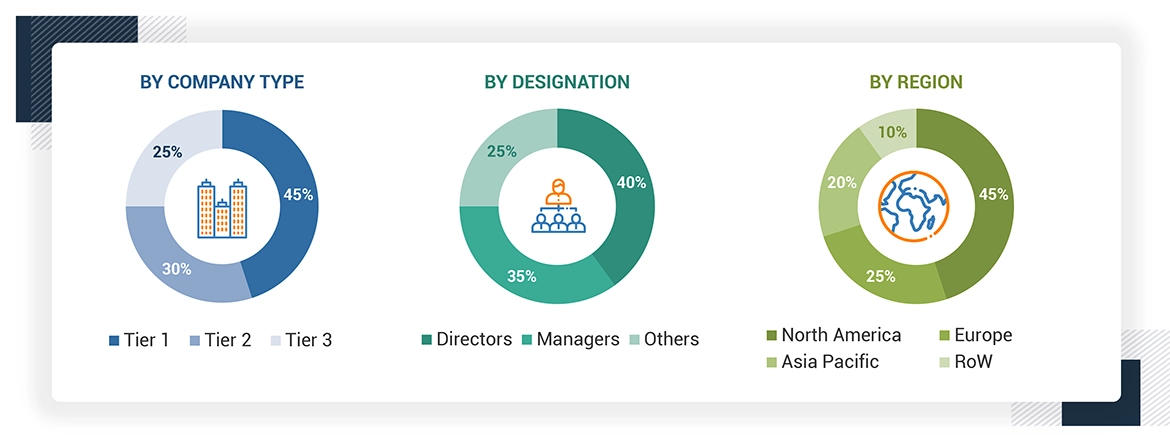
Note: The three tiers of the companies are defined based on their total revenue in 2023: Tier 1 - revenue greater than or equal to USD 1 billion; Tier 2 - revenue between USD 100 million and USD 1 billion; and Tier 3 revenue less than or equal to USD 100 million. Other designations include sales managers, marketing managers, and product managers.

About the assumptions considered for the study, To know download the pdf brochure

Market Size Estimation

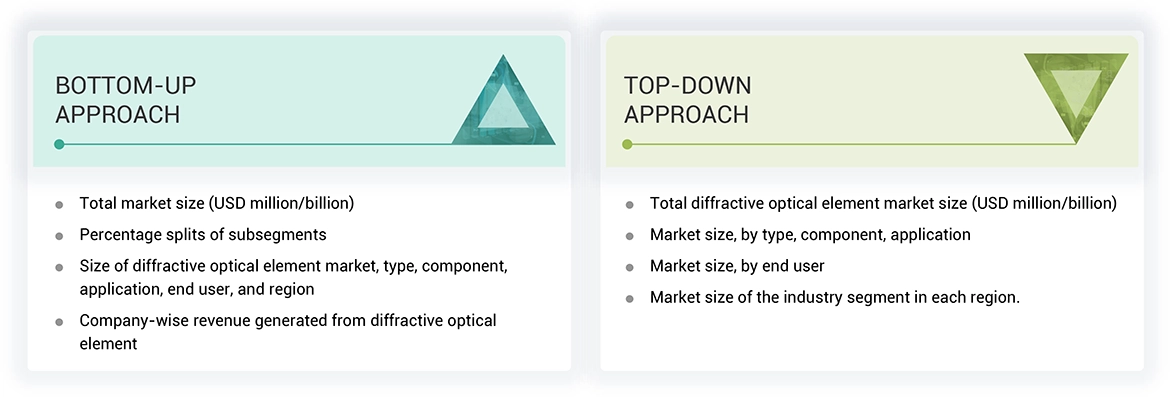
To estimate and validate the size of the diffractive optical element market and its submarkets, both top-down and bottom-up approaches were utilized. Secondary research was conducted to identify the key players in the market, and primary and secondary research was used to determine their market share in specific regions. The entire process involved studying top players' annual and financial reports and conducting extensive interviews with industry leaders such as CEOs, VPs, directors, and marketing executives. Secondary sources were used to determine all percentage shares and breakdowns, which were verified through primary sources. All parameters that could impact the markets covered in this research study were accounted for, analyzed in detail, verified through primary research, and consolidated to obtain the final quantitative and qualitative data.

Data Triangulation

Once the overall size of the diffractive optical element market was determined using the methods described above, it was divided into multiple segments and subsegments. Market engineering was performed for each segment and subsegment using market breakdown and data triangulation methods, as applicable, to obtain accurate statistics. To triangulate the data, various factors and trends from the demand and supply sides were studied. The market was validated using both top-down and bottom-up approaches.

Market Definition

A diffractive optical element, is an optical component that is distinguished by the principle of diffraction rather than refraction or reflection. It may split, shape, or even focus light into different patterns by virtue of microstructure patterns on its surface, thus allowing for very controlled and very accurate distribution of light. They are used in laser beam shaping and splitting up, homogenization, and many others, in fields such as material processing, medical devices, and metrology. Major advantages DOEs have to offer are compactness, efficiency, and performing complex optical functions within one single element.

Key Stakeholders

  • Original equipment manufacturers (OEMs)
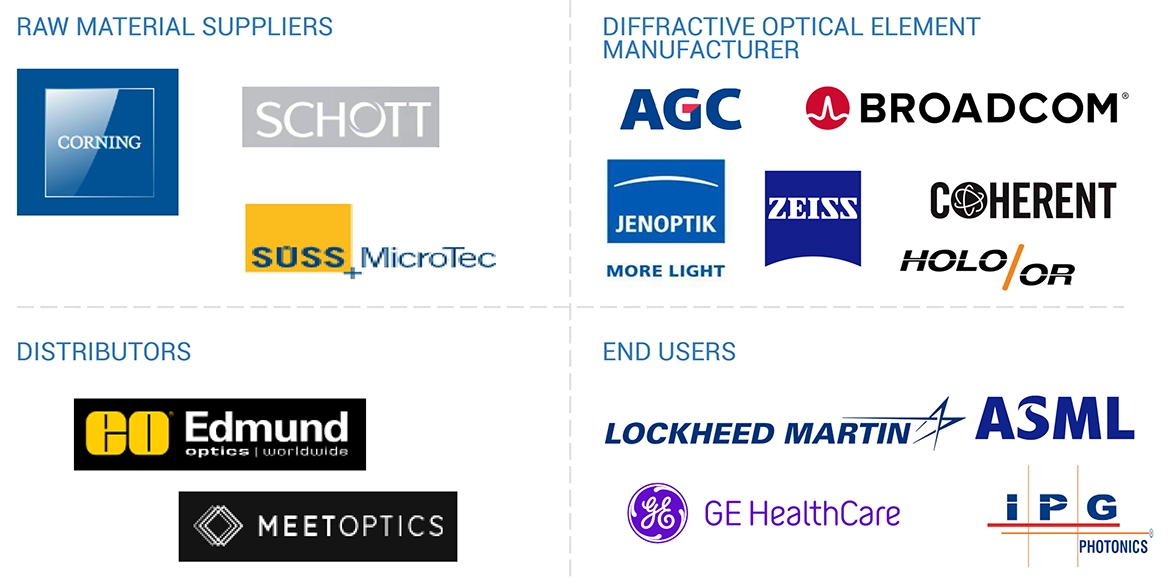
  • Raw material suppliers
  • Technology investors
  • Electronic hardware equipment manufacturers
  • Research organizations and consulting companies
  • Government bodies such as regulatory authorities and policymakers
  • Venture capitalists and private equity firms
  • Associations, organizations, and alliances related to diffractive optical element

Report Objectives

  • To describe and forecast the diffractive optical element market, by type, component, application, end user and region, in terms of value
  • To describe and forecast the market for various segments across four central regions, namely, North America, Europe, Asia Pacific, and Rest of the World (RoW), in terms of value
  • To strategically analyze the micro markets with regard to the individual growth trends, prospects, and contribution to the market
  • To provide detailed information regarding drivers, restraints, opportunities, and challenges influencing the growth of the market
  • To analyze opportunities for stakeholders by identifying high-growth segments in the market
  • To provide a detailed overview of the value chain
  • To strategically analyze the ecosystem, regulatory landscape, patent landscape, Porter’s five forces, import and export scenarios trade landscape, and case studies pertaining to the market under study
  • To strategically profile key players in the diffractive optical element market and comprehensively analyze their market shares and core competencies
  • To strategically profile the key players and provide a detailed competitive landscape of the market
  • To analyze competitive developments such as partnerships, acquisitions, expansions, collaborations, and product launches, along with research and development (R&D) in the diffractive optical element market

Available Customizations

With the given market data, MarketsandMarkets offers customizations according to the specific requirements of companies. The following customization options are available for the report:

Company Information:

  • Detailed analysis and profiling of additional market players (up to 5)
  • Additional country-level analysis of the diffractive optical element market

Product Analysis

  • Product matrix, which provides a detailed comparison of the product portfolio of each company in the diffractive optical element market.
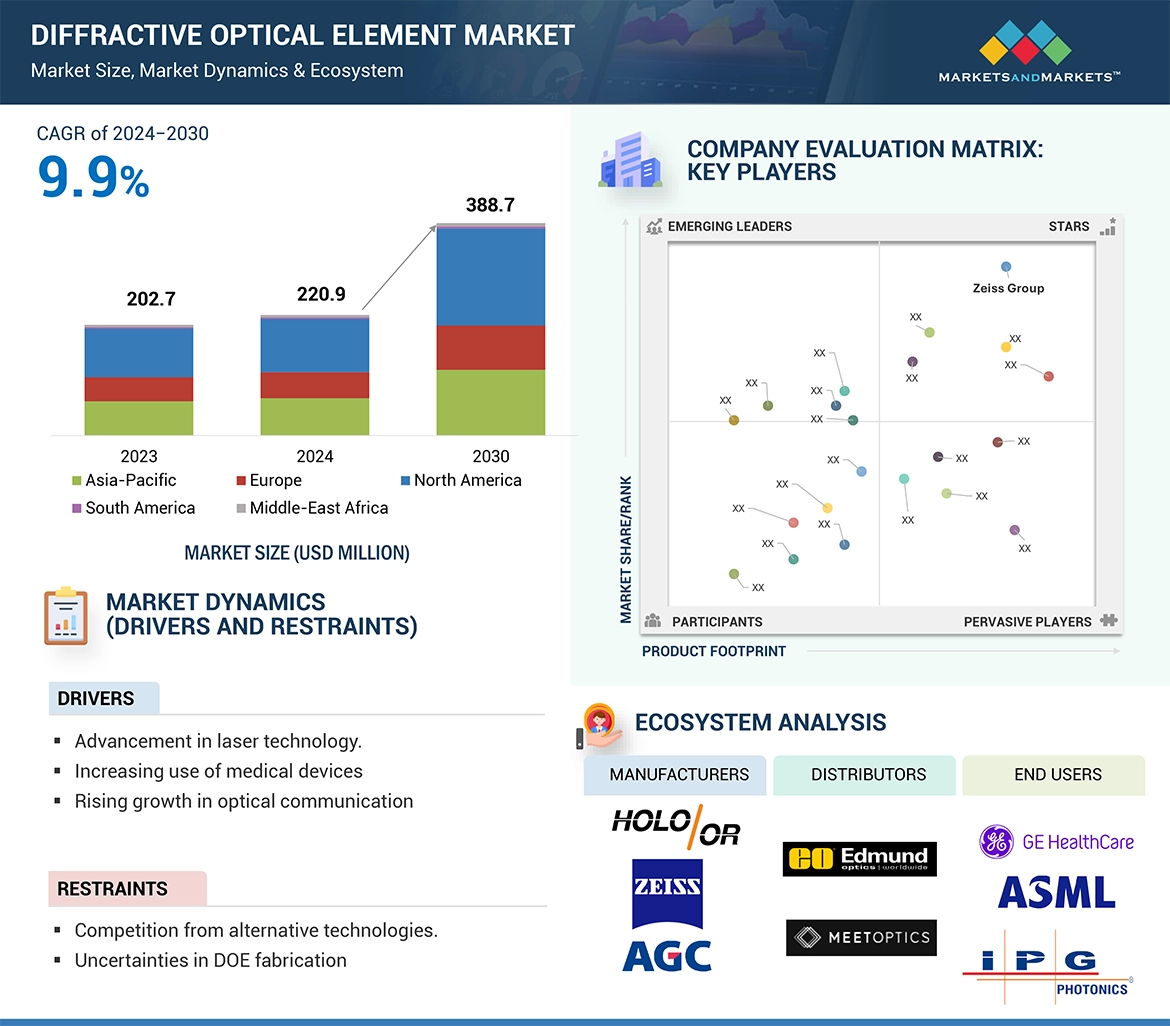
 

Previous Versions of this Report

Custom Market Research Services

We Will Customise The Research For You, In Case The Report Listed Above Dose Not Meet With Your Requirements

Get 10% Free Customisation

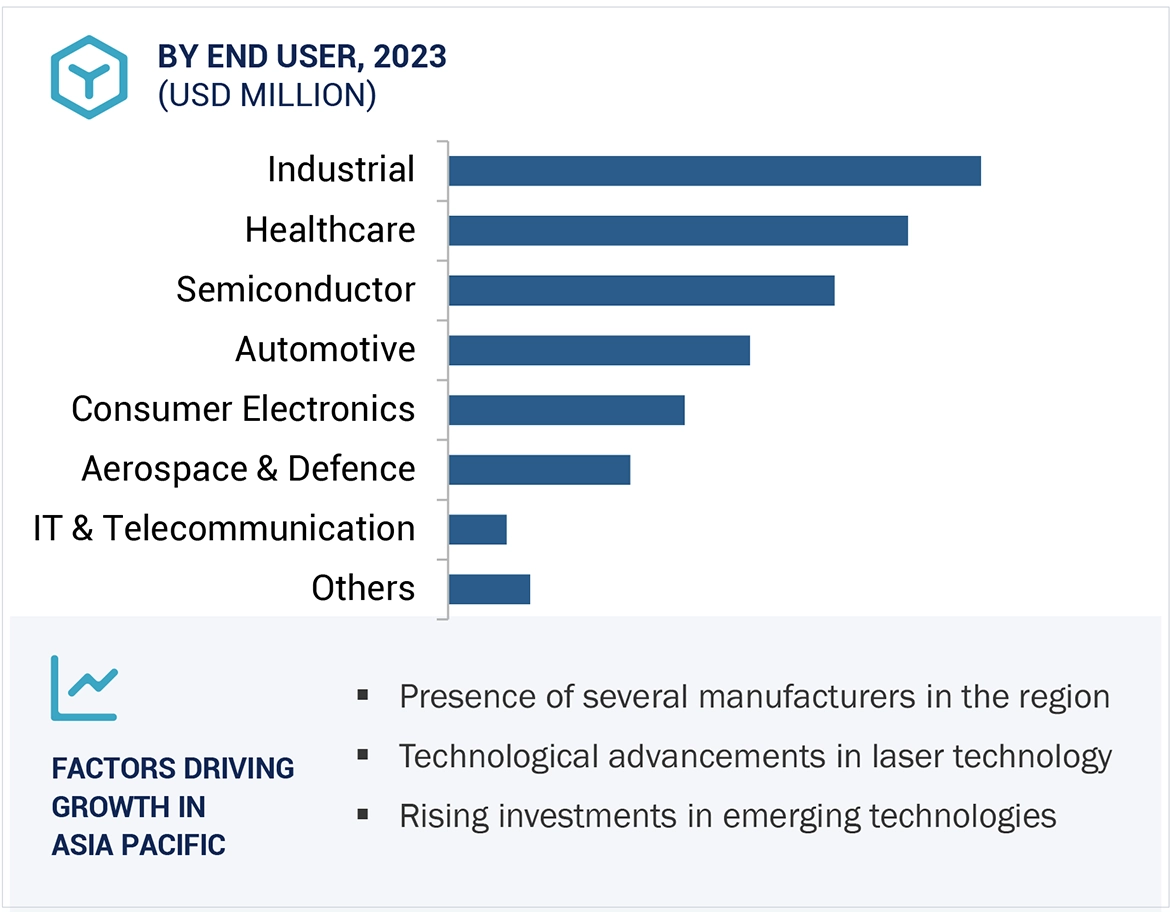
Growth opportunities and latent adjacency in Diffractive Optical Element Market

DMCA.com Protection Status