
Data Center Insulation Market

Data Center Insulation Market by Material (Mineral Wool, PU Foam, PE Foam, Polystyrene Foam, Flexible Elastomeric Foam), Insulation Type (Thermal & Acoustic), Application (Wall & Roof, Raised Floors, Pipes & Ducts) and Region - Global Forecast to 2032


OVERVIEW
Source: Secondary Research, Interviews with Experts, MarketsandMarkets Analysis
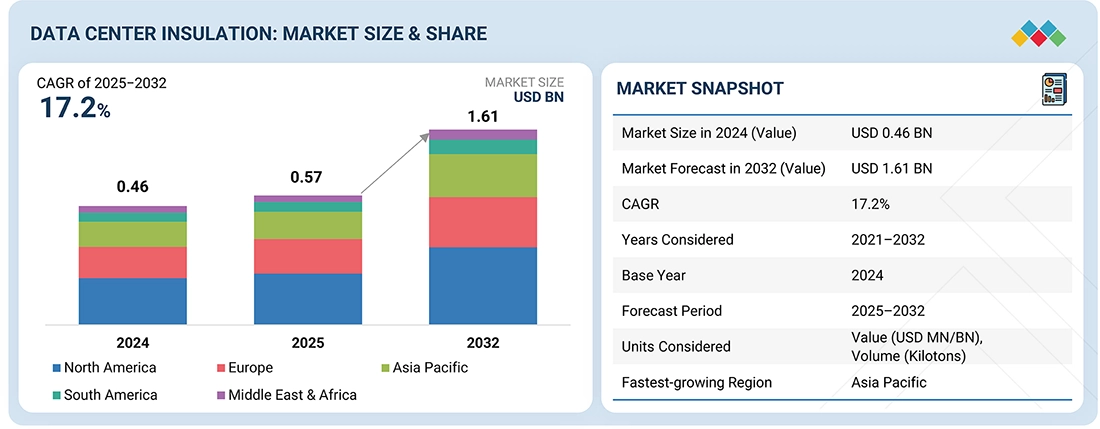
The global data center insulation market is expected to grow from USD 0.46 billion in 2024 to USD 1.61 billion by 2032, with a CAGR of 17.2% from 2025 to 2032. This growth is driven by increasing demand for insulation solutions in data centers, which is fueled by the expansion of data centers worldwide. The main factors contributing to this growth include rising energy needs and the push for cost-effective cooling methods. Effective insulation allows temperature regulation without heat loss, improving the PUE of buildings. Additionally, higher standards for carbon emissions and energy conservation have led to the adoption of specialized insulation materials like mineral wool, spray foam, and polyethylene foam.
KEY TAKEAWAYS
-
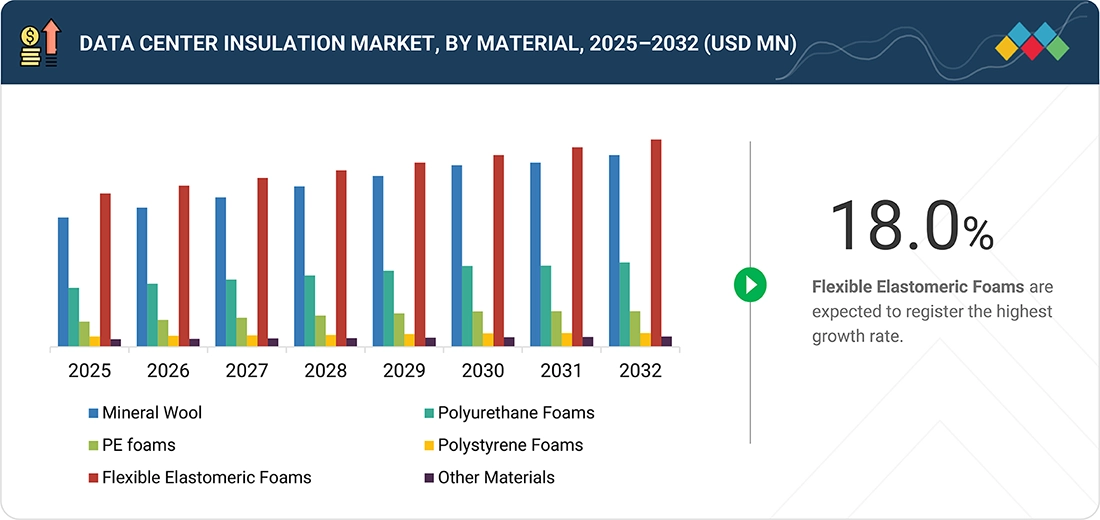
BY MaterialFlexible elastomeric foam is expected to capture the largest market share in the data center insulation market owing to its superior thermal efficiency, moisture resistance, and ease of installation, making it ideal for high-performance and energy-efficient data center environments.
-
BY InsulationThermal insulation is expected to hold the largest market share due to its vital role in improving energy efficiency and maintaining optimal temperatures in modern data centers.
-
BY ApplicationPipes and ducts are projected to hold the highest market share as they play a crucial role in ensuring efficient cooling, minimizing energy loss, and maintaining thermal stability in data center operations.
-
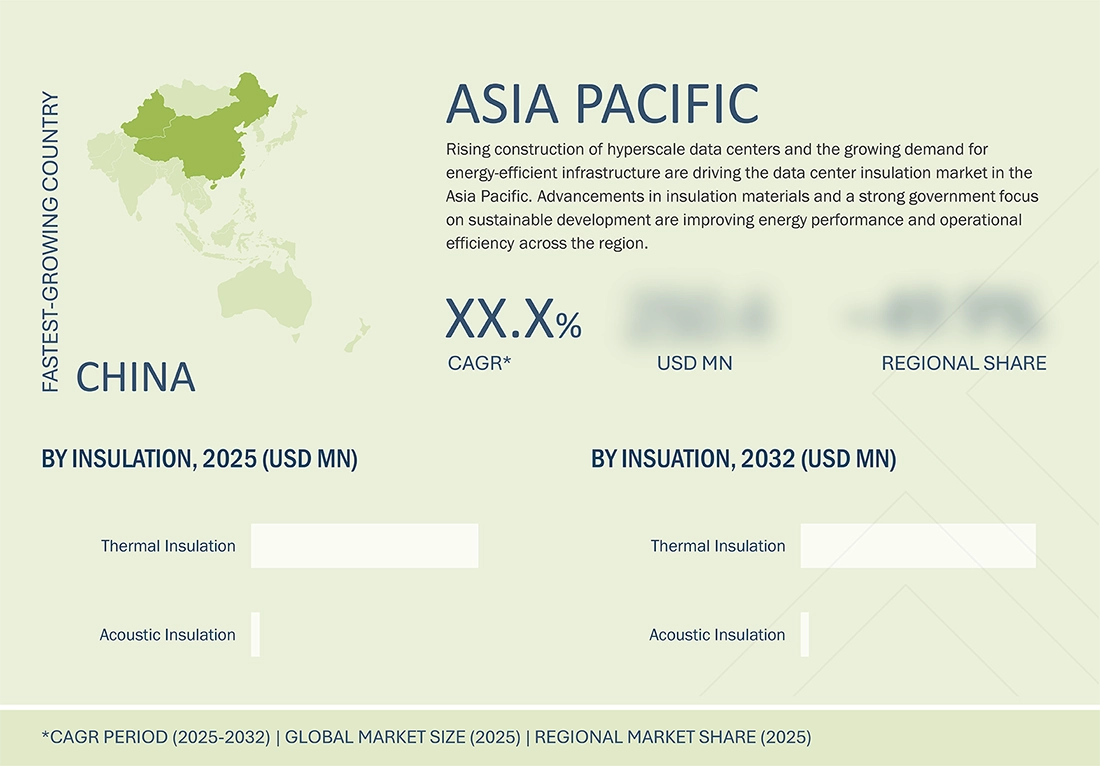
BY REGIONThe market is studied across several regions: Europe, North America, the Asia Pacific, South America, and the Middle East & Africa. the Asia Pacific is projected to hold the highest market share during the forecast period due to rapid data center expansion, strong investments in digital infrastructure, and increasing emphasis on energy-efficient and sustainable insulation solutions across emerging economies.
The growth of the global data center insulation market is driven by increasing demand for energy-efficient materials that enhance thermal regulation, reduce noise, and optimize operational performance across modern data centers. Flexible elastomeric foam is the dominant material due to its superior thermal efficiency, moisture resistance, and ease of installation. Thermal insulation holds the largest market share, supported by its crucial role in maintaining temperature stability and lowering cooling energy consumption. By application, pipes and ducts lead the market as they ensure efficient cooling and minimize thermal losses in high-density environments. Regionally, the Asia Pacific remains the fastest-growing market, fueled by rapid data center expansion, strong digital infrastructure investments, and a rising focus on sustainable and energy-efficient operations.
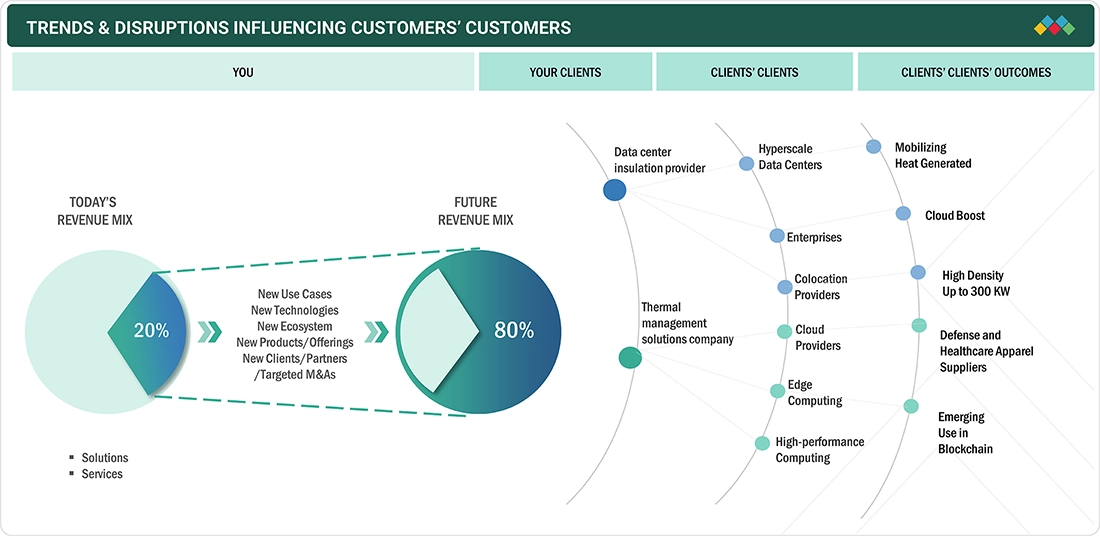
TRENDS & DISRUPTIONS IMPACTING CUSTOMERS' CUSTOMERS
The data center insulation market is evolving quickly due to changes in infrastructure design, driven by increasing needs for energy efficiency, high-density computing, and sustainable operations. As hyperscale, enterprise, and colocation providers expand to support AI, cloud, and blockchain workloads, thermal management and insulation technologies are becoming essential for optimal performance. Companies specializing in advanced insulation and thermal solutions work closely with data center operators to enhance heat management, lower cooling energy use, and ensure environmental stability at densities reaching 300 kilowatts. Simultaneously, the growth of edge and high-performance computing is boosting demand for modular, scalable, and lightweight insulation systems. These changes are reshaping competition, connecting insulation providers, infrastructure developers, and cloud service users in a joint effort to improve efficiency, reliability, and sustainability worldwide in the data center sector.
Source: Secondary Research, Interviews with Experts, MarketsandMarkets Analysis
MARKET DYNAMICS
Level
-
Advancements in thermal management and acoustic optimization in high-density and liquid-cooled data centers

-
Rising global data center construction

Level
-
High initial installation and material costs

-
Lack of standardization and regulatory push

Level
-
Increasing installation of GenAI-based mega centers

-
Retrofitting & modernization of legacy data centers

Level
-
Alternative materials, such as mineral fiber ceilings, roof coatings, and reflective panels

-
Substitution with other technologies such as direct-to-chip and immersion cooling

Source: Secondary Research, Interviews with Experts, MarketsandMarkets Analysis
Driver: Advancements in thermal management and acoustic optimization in high-density and liquid-cooled data centers
Advancements in thermal management and acoustic optimization drive the data center insulation market. As facilities adopt high-density, liquid-cooled architectures, effective heat regulation and acoustic control are crucial for reliability and efficiency. Modern insulation materials support cooling systems by reducing heat transfer, preventing condensation, and stabilizing temperatures. Acoustic optimization reduces noise and vibration from fans, pumps, and mechanical equipment, creating safer, more comfortable workplaces. These innovations improve energy efficiency, extend equipment lifespan, and enhance Power Usage Effectiveness (PUE), aligning with sustainability goals. AI, edge computing, and high-performance workloads are increasing the demand for multifunctional insulation systems with superior thermal and acoustic performance for future data centers.
Restraint: High initial installation and material costs
A major restraint in the data center insulation market is high costs. Advanced materials, such as elastomeric foams, polyurethane, and composites, offer better thermal and acoustic performance but have higher upfront costs than traditional materials. Installation requires skilled workers and strict safety standards, increasing capital expenditure. In large data centers, high-performance insulation across extensive piping and ductwork can significantly inflate budgets. Fluctuating raw material prices also affect costs. Despite long-term savings from energy efficiency and maintenance reduction, the high initial investment discourages small and medium operators with limited finances.
Opportunity: Increasing installation of GenAI-based mega centers
The rise of GenAI mega data centers presents a significant opportunity for the data center insulation market. Growing generative AI workloads needing high-performance hardware lead to large-scale data centers worldwide. These require continuous use of the GPU and processor, producing heat and demanding advanced thermal and acoustic insulation. Operators customize infrastructure for AI training and inference, increasing the need for efficient insulation materials that regulate temperature, reduce energy loss, and extend equipment life. The scale and power needs of GenAI data centers also drive the adoption of sustainable, high-performance insulation solutions that meet strict environmental standards. Moving to AI-optimized infrastructure will boost demand for advanced insulation technologies, creating growth opportunities for manufacturers and suppliers in the data center industry.
Challenge: Alternative materials, such as mineral fiber ceilings, roof coatings, and reflective panels
Substitutes like mineral fiber ceilings, roof coatings, and reflective panels challenge the data center insulation market. These lower-cost options are easier to install and offer basic thermal insulation in less demanding environments. Reflective panels and roof coatings are attractive for remedial and low-density data centers, effectively reducing surface temperature and solar heat gain. Mineral fiber materials appeal to operators seeking affordable acoustic control without the expense of specialized systems. In high-density environments, where these alternatives are less effective than high-grade foams or composites but more economical and accessible, they may hinder the adoption of superior insulation materials.
Data Center Insulation Market: COMMERCIAL USE CASES ACROSS INDUSTRIES
| COMPANY | USE CASE DESCRIPTION | BENEFITS |
|---|---|---|
 |
Develops high-performance insulation materials and systems designed for HVAC, ducting, and building envelope applications in data centers. Its solutions help reduce thermal loss, prevent condensation, and enhance energy efficiency in cooling and mechanical systems. | Provides advanced thermal insulation that minimizes energy consumption, improves temperature control, and supports reliable cooling performance in data center environments. |
 |
Manufactures elastomeric foam insulation systems with superior thermal and acoustic properties. These solutions are applied in server rooms, cooling lines, and chilled-water systems for modern data centers requiring precise temperature regulation. | Ensures long-term operational efficiency through reduced thermal bridging, improved system durability, and enhanced environmental performance. |
 |
Produces high-performance insulated panels, building envelopes, and HVAC insulation products used in data center construction and retrofits. Its offerings focus on sustainability, fire safety, and superior energy performance. | Delivers reduced energy usage, high fire resistance, and compliance with global green building standards, supporting sustainable data center operations. |
 |
A global leader in fiberglass insulation for thermal and acoustic control. Its products are widely used in data center walls, ceilings, and mechanical systems to maintain thermal balance and reduce noise. | Offers reliable thermal protection, excellent fire resistance, and energy efficiency, helping data centers lower cooling costs and enhance safety. |
 |
Provides a comprehensive range of insulation materials, including fiberglass, foam, and polyiso boards, for data center infrastructure. The company’s focus on performance and sustainability supports advanced thermal management in large-scale facilities. | Ensures optimal heat containment and energy performance, contributing to consistent temperature stability and long-term sustainability in data center environments. |
Logos and trademarks shown above are the property of their respective owners. Their use here is for informational and illustrative purposes only.
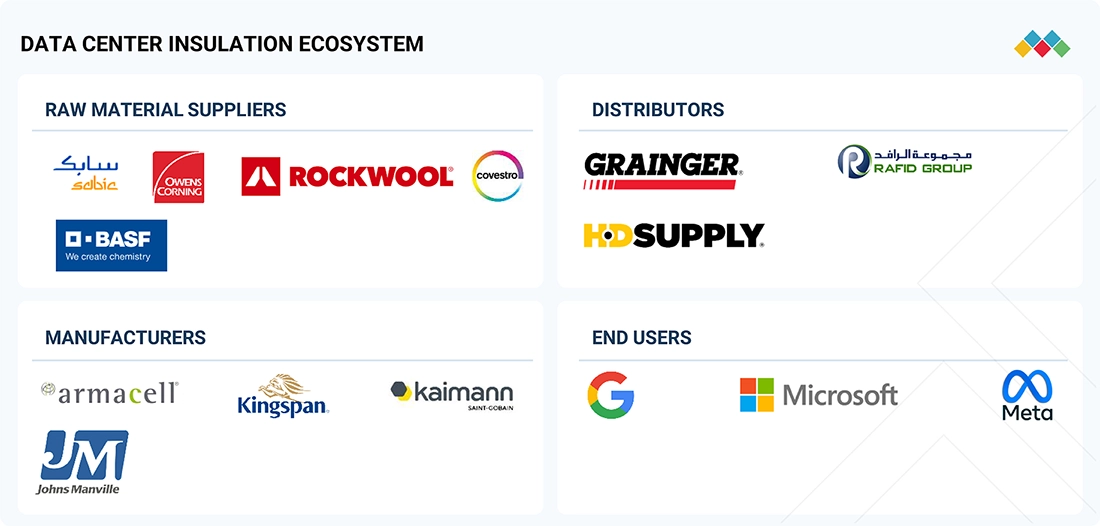
MARKET ECOSYSTEM
The data center insulation market ecosystem consists of a structured supply chain including raw material suppliers, manufacturers, distributors, and end users. Raw material suppliers like SABIC, BASF, Owens Corning, Rockwool, and Covestro provide essential chemical and mineral inputs. Manufacturers such as Armacell, Kingspan, Kaimann, and Johns Manville process these materials into insulation products. Distributors like Grainger, HD Supply, and Rafid Group handle logistics and delivery. The final products are utilized by major data center operators, including Google, Microsoft, and Meta, ensuring optimal thermal efficiency and operational reliability throughout digital infrastructure projects.
Logos and trademarks shown above are the property of their respective owners. Their use here is for informational and illustrative purposes only.
MARKET SEGMENTS
Source: Secondary Research, Interviews with Experts, MarketsandMarkets Analysis
Data center insulation market, By material
Polyethylene foam is expected to grow at the highest CAGR in the data center insulation market in the forecast period, primarily due to its excellent insulation efficiency, moisture resistance, and ease of installation. These performance qualities make polyethylene foam the material of choice in next-generation data centers, which require precision temperature control and consistent energy efficiency. Polyethylene foam is lightweight and flexible, thus it can be useful for a variety of applications such as pipes, ducts, walls, and flooring for thermal and acoustic insulation in varying operating environments. Due to its closed-cell structure, polyethylene foam also minimizes thermal bridging and provides high vapor resistance, thereby increasing the reliability of systems in high-density data centers. Its suitability for modern modular construction methods and green formulations only enhances the attractiveness for this market. The growth in global hyperscale data centers and edge facilities is increasing the demand for economical and durable insulation materials, thus further driving the growth of polyethylene foams. The material has proved its effectiveness in reducing energy losses and extending the life of HVAC systems, making it an essential material in achieving long-term operational sustainability for data center infrastructure.
Data center insulation market, By insulation type.
The thermal insulation segment is expected to grow fastest in the data center insulation market during the forecast period, driven by increasing focus on energy efficiency and temperature control in high-performance computing. As data centers become larger and denser, maintaining thermal conditions is vital to prevent overheating, reduce energy loss, and ensure continuous operation. Thermal insulation materials, such as polyurethane foams, fiberglass, and elastomeric coatings, improve heat resistance, lower HVAC loads, cut costs, and boost energy efficiency. They also support environmental goals by lowering carbon footprints and meeting global energy standards. The rise of hyperscale and edge data centers in emerging economies further boosts demand for thermal management, making insulation critical for performance, safety, and cost-efficiency.
Data center insulation market, By application.
The pipes and ducts segment is expected to be the fastest-growing application in the data center insulation market during the forecast period, driven by the rising need to enhance cooling efficiency and minimize thermal losses in high-density facilities. In today's data centers, insulated pipes and ducts maintain chilled air and fluid temperatures, reducing the cooling load on HVAC systems, thus enhancing overall energy efficiency. Furthermore, advanced materials such as polyethylene, elastomeric foam, and fiberglass maximize thermal resistance, condensation control, and durability. With the global expansion of data centers, operators are more and more utilizing insulated piping and ducting systems to regulate airflow, reduce maintenance costs, and support their sustainability goals. This growing emphasis on energy-efficient infrastructure renders the pipes and ducts segment a key driver of performance and reliability for modern data center operations.
REGION
Asia Pacific region to register the highest CAGR during the forecast period.
The Asia Pacific region is projected to lead the data center insulation market during the forecast period due to rapid infrastructure development, digitalization, and increased cloud investments. Countries like China, India, Japan, and Singapore are seeing a surge in hyperscale data center construction, creating high demand for insulation materials that improve energy efficiency and reduce costs. Rising energy use and stricter environmental regulations will push operators toward sustainable, high-performance insulation for better thermal management. Government initiatives for green data centers and renewable energy will further boost the adoption of insulation. Focus on reducing carbon emissions and improving cooling efficiency positions Asia Pacific as a key growth hub for the global data center insulation market, driven by ongoing investments from cloud providers and colocation operators.
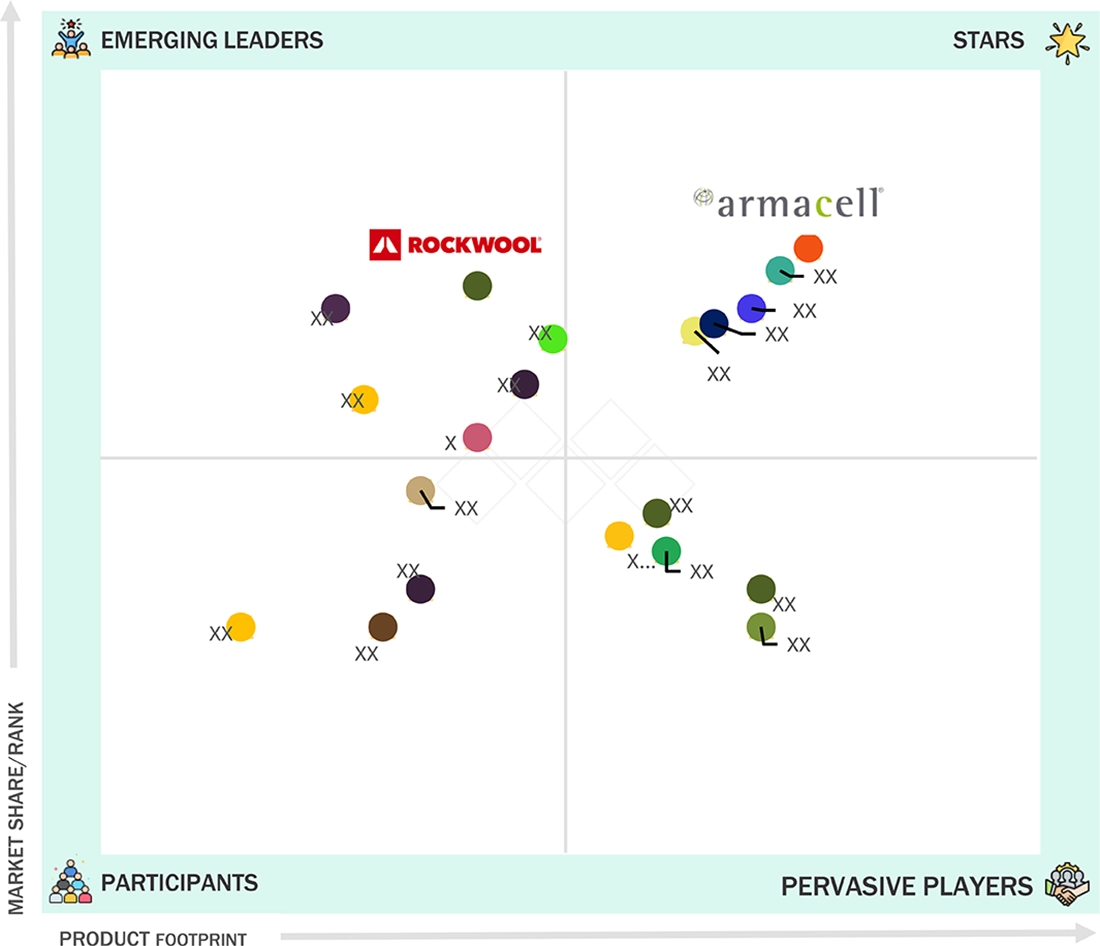
Data Center Insulation Market: COMPANY EVALUATION MATRIX
In the data center insulation market, Armacell (Star) holds a leading position with its advanced portfolio of flexible insulation materials designed for superior thermal performance, energy efficiency, and condensation control. Leveraging its expertise in mechanical and HVAC insulation systems, Armacell delivers high-quality solutions that help maintain optimal temperature regulation and minimize energy loss in large-scale data centers. The company’s strong research foundation and commitment to sustainable manufacturing have established it as a trusted global supplier of technical insulation materials. Rockwool (Emerging Leader) is rapidly strengthening its presence in the market with its stone wool insulation products known for excellent fire resistance, acoustic performance, and long-term thermal stability. By combining natural raw materials with advanced production technologies, Rockwool is expanding its footprint across major data center hubs in Europe, North America, and Asia. Other key players are focusing on expanding their production capacities, integrating eco-friendly materials, and developing advanced insulation technologies to meet the increasing demand for sustainable and energy-efficient data center infrastructure.
Source: Secondary Research, Interviews with Experts, MarketsandMarkets Analysis
KEY MARKET PLAYERS
MARKET SCOPE
| REPORT METRIC | DETAILS |
|---|---|
| Market Size in 2024 (Value) | USD 0.46 Billion |
| Market Forecast in 2030 (Value) | USD 1.61 Billion |
| Growth Rate | 17.20% |
| Years Considered | 2021–2032 |
| Base Year | 2024 |
| Forecast Period | 2025–2032 |
| Units Considered | Value (USD MN/BN), Volume (Kilotons) |
| Report Coverage | Revenue forecast, company ranking, competitive landscape, growth factors, and trends |
| Segments Covered |
|
| Regions Covered | North America, Europe, Asia Pacific, South America, Middle East & Africa |
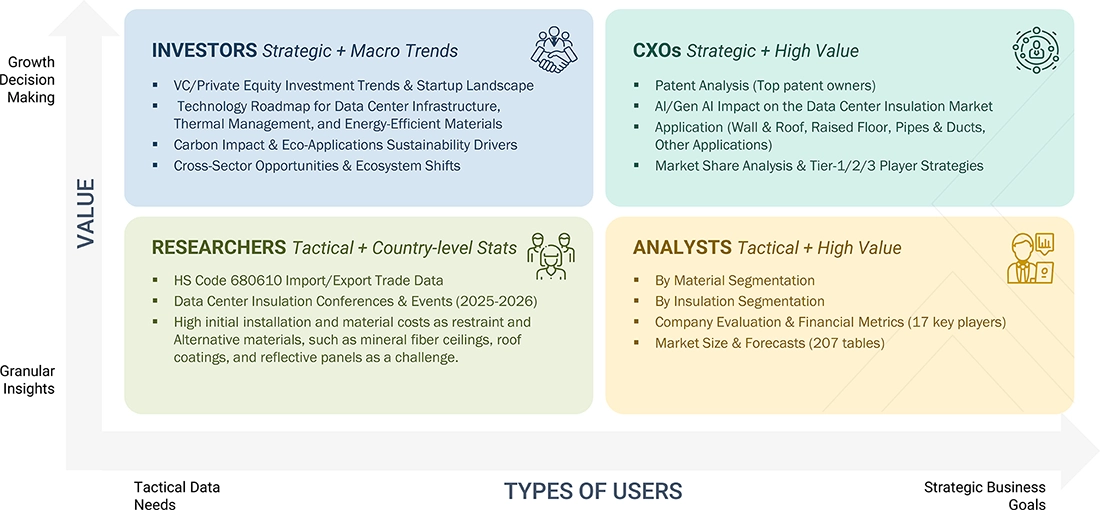
WHAT IS IN IT FOR YOU: Data Center Insulation Market REPORT CONTENT GUIDE
DELIVERED CUSTOMIZATIONS
We have successfully delivered the following deep-dive customizations:
| CLIENT REQUEST | CUSTOMIZATION DELIVERED | VALUE ADDS |
|---|---|---|
| Hyperscale Data Center Operators | Conduct detailed energy and thermal efficiency benchmarking to identify insulation configurations that reduce PUE (Power Usage Effectiveness) and enhance cooling performance | Enables operators to lower cooling costs, improve uptime, and meet sustainability goals through optimized thermal insulation systems. |
| Colocation Providers | Provide comparative analysis of insulation materials for multi-tenant facilities with diverse load profiles and operational requirements. | Supports flexible infrastructure design, ensures consistent performance across zones, and reduces total cost of ownership. |
| Enterprise Data Centers | Develop tailored insulation roadmaps for legacy infrastructure upgrades and hybrid cloud integration with a focus on energy recovery and retrofitting. | Improves facility lifespan, enables compliance with new energy regulations, and enhances environmental performance. |
| Edge and Modular Data Center Builders | Evaluate lightweight, modular insulation panels and materials optimized for rapid deployment and compact installations. | Facilitates faster deployment, improves temperature control in small footprints, and supports scalability in distributed computing environments. |
| Data Center Design and Engineering Firms | Offer material compatibility assessments, simulation modeling, and digital twin validation for insulation system performance under variable thermal loads. | Strengthens design precision, reduces project risk, and enhances system reliability through data-driven thermal management insights. |
| HVAC and Cooling System Integrators | Conduct durability, condensation, and fire-resistance testing of insulation materials under dynamic airflow and high-humidity conditions. | Ensures safety compliance, minimizes condensation risks, and enhances overall cooling system efficiency and resilience. |
RECENT DEVELOPMENTS
- October 2025 : Derbigum, a subsidiary of Kingspan Group, has acquired Eurotag Danmark A/S, its exclusive Danish distributor and a leading supplier of Derbigum roofing solutions. The acquisition strengthens Kingspan’s presence in Denmark and supports its global sustainability and circular economy goals. By combining Derbigum’s advanced waterproof membrane technology featuring high recycled content with Eurotag’s expertise in flat roofing, the partnership aims to enhance recycling initiatives, reduce waste, and promote sustainable construction practices across the region.
- June 2024 : Armacell has acquired the engineering business of E&M Industries, a Western Australia–based specialist in thermal and acoustic insulation jacketing systems. Operating under Armacell Australia Engineering Pty Ltd, the acquisition strengthens Armacell’s presence in the Asia-Pacific insulation market and supports its strategic expansion into energy-efficient and industrial insulation solutions, including applications for data centres and energy infrastructure. The transaction enhances Armacell’s capabilities in fabrication, energy-saving technologies, and solution-based insulation offerings.
- September 2020 : Johns Manville Corporation planned to install a new production plant for Polyiso products involving Energy 3 as its new roof insulation product in Hillsboro, Texas. The company declared that the plant would tremendously contribute to expanding the production capacity and job availability.
Table of Contents
 Exclusive indicates content/data unique to MarketsandMarkets and not available with any competitors.
Methodology
The research methodology used to estimate the current size of the data center insulation market consisted of four major activities. Extensive secondary research was performed to acquire detailed information about the market, peer markets, and parent markets. These findings, assumptions, and metrics were verified through primary research with experts from both the demand and supply sides of the data center insulation value chain. Both top-down and bottom-up approaches were used to estimate the total market size. The estimation of market sizes for various segments and subsegments in the market was finalized using full market segmentation and data triangulation techniques.
Secondary Research
The research methodology for estimating and forecasting the data center insulation market begins with gathering data on key vendors' revenues by doing secondary research. The secondary research process involves consulting a range of secondary sources, including Hoover's, Bloomberg Businessweek, Factiva, the World Bank, and industry-specific journals. These secondary sources encompass annual reports, press releases, investor presentations, white papers, certified publications, articles from recognized authors, regulatory notifications, trade directories, and databases. Also, vendor offerings are taken into consideration to inform market segmentation.
Primary Research
The data center insulation market comprises several stakeholders in the supply chain, such as raw material suppliers, manufacturers, distributors, contractors/sub-contractors, infrastructure OEMs, system integrators, and end users. The demand side of this market is defined by the development of information technology, telecommunications, finance and banking, retail and e-commerce, healthcare, government & public sector, and education. Interviews were conducted with a range of primary sources on both the supply and demand sides of the market to gather both qualitative and quantitative data.
The following is the breakdown of the primary respondents:

To know about the assumptions considered for the study, download the pdf brochure
Market Size Estimation
The top-down and bottom-up approaches have been used to estimate and validate the total size of the data center insulation market. These methods have also been widely used to determine the size of various related market subsegments. The research methodology employed to estimate the market size included the following: The following segments provide details about the overall market size estimation process employed in this study:
- Extensive primary and secondary research was done to identify the key players.
- The value chain and market size of the data center insulation market, in terms of value, were determined through primary and secondary research.
- All percentage shares, splits, and breakdowns were collected through secondary sources and verified through primary sources.
- All possible parameters that affect the market were covered in this research study and are viewed in extensive detail, verified through primary research, and analyzed to obtain the final quantitative and qualitative data.
- The study of reports, reviews, and newsletters of top market players, along with extensive interviews for opinions from key leaders, such as CEOs, directors, and marketing executives, is included in this research.
Global data center insulation market Size: Bottom-Up Approach and Top-Down Approach

Data Triangulation
After determining the overall market size using the market size estimation processes explained above, the market was divided into several segments and sub-segments. To complete the overall market engineering process and determine the exact statistics for each market segment and subsegment, data triangulation and market breakdown procedures were employed, as applicable. The data was triangulated by studying various factors and trends from both the demand and supply sides in the data center sector.
Market Definition
The insulation market in data centers already plays a vital role in improving energy efficiency and sustainability, as these data centers consume approximately 1% of the total global energy and emit around 2% of the greenhouse gases. The cooling systems can account for as high as 40% of the total operational cost, primarily driven by the continuous heat generated by the servers. Cooling equipment, piping, and distribution systems should be insulated to prevent heat loss or gain and control condensation, thereby reducing component failures and keeping the environment clean and free of dust. High-quality insulation materials, such as mineral wool and Polyurethane Foam, have beneficial side effects. A positive impact on thermal management and energy waste in data centers has an overall beneficial effect on the carbon footprint of such establishments. Data centers can improve PUE by a high margin to support global sustainability through the implementation of high-level insulation solutions.
Stakeholders
- Data Center Operators and Insulation Material Manufacturers
- Data Center Construction Companies and HVAC and Cooling System Providers
- Engineering and Consulting Firms and Data Center Equipment Manufacturers
- Associations and Industrial Bodies such as the ASHRAE (American Society of Heating, Refrigerating, and Air-Conditioning Engineers), Uptime Institute, The Green Grid, BICSI (Building Industry Consulting Service International), and Others
- NGOs, Governments, Investment Banks, Venture Capitalists, and Private Equity Firms
Report Objectives
- To analyze and forecast the market size of the global data center insulation market in terms of value and volume
- To provide detailed information regarding the major factors (drivers, restraints, challenges, and opportunities) influencing the regional market
- To analyze and forecast the global data center insulation market based on insulation, material, application, and region
- To analyze the opportunities in the market for stakeholders and provide details of a competitive landscape for market leaders
- To forecast the size of various market segments based on five major regions: Asia Pacific, Europe, North America, South America, and the Middle East & Africa, along with their respective key countries
- To track and analyze the competitive developments, such as partnerships and expansions, in the market
- To strategically profile the key players and comprehensively analyze their market shares and core competencies
Need a Tailored Report?
Customize this report to your needs
Get 10% FREE Customization
Customize This ReportPersonalize This Research
- Triangulate with your Own Data
- Get Data as per your Format and Definition
- Gain a Deeper Dive on a Specific Application, Geography, Customer or Competitor
- Any level of Personalization
Let Us Help You
- What are the Known and Unknown Adjacencies Impacting the Data Center Insulation Market
- What will your New Revenue Sources be?
- Who will be your Top Customer; what will make them switch?
- Defend your Market Share or Win Competitors
- Get a Scorecard for Target Partners

Custom Market Research Services
We Will Customise The Research For You, In Case The Report Listed Above Does Not Meet With Your Requirements
Get 10% Free Customisation


Growth opportunities and latent adjacency in Data Center Insulation Market