Cyber-Physical Systems (CPS) Market Size, Share & Analysis

Report Code SE 9158
Published On Sep, 2024, By MarketsandMarkets™
Download Sample Report

Choose License Type

Buy Report Now Inquire Before Buying

Cyber-Physical Systems (CPS) Market by Edge Computing, Data Processing & Analytics, Sensor, Actuator, ICS, IIoT, Digital Twin, Intelligent Transportation System, Smart Grid, Smart Building, Smart Agriculture, Robotics, Framework - Global Forecast to 2029

Overview

The global cyber-physical systems market is expected to grow from USD 124.1 billion in 2024 to USD 255.3 billion by 2029, growing at a CAGR of 15.5% from 2024 to 2029. A cyber-physical system (CPS) merges physical activities with digital technology, making it possible for the real and virtual worlds to interact seamlessly. This market caters to several verticals, such as manufacturing and oil & gas, where it improves productivity, security, and sustainability. The demand for CPS systems is mainly driven by the development of the Internet of Things (IoT ), artificial, robotic, and data analytical technologies to cut costs and make better decisions. As most enterprises go through a digital transformation trend, the cyber-physical systems market is expected to grow as there will be a continuous push for interconnected and more robust systems. The growing trend of industrial automation also influences the growth of the cyber-physical systems market. The increasing focus on renewable energy sources, such as smart grids, to conform to global clean and efficient demands creates lucrative opportunities for players in the market. The smart grid technology segment positively impacts the market growth due to its increased deployment across the energy sector.

AI is revolutionizing CPS by improving their abilities to process data, make decisions, and perform tasks autonomously. This is possible as some of the systems that make up CPS can process enormous amounts of data in real time and perform tasks, such as predictive maintenance and adaptive control. AI technology significantly increases the efficiency of industrial management technologies by improving decision-making ability and precise control over the industrial process. Furthermore, it minimizes downtime and ensures the effective utilization of resources. It also enhances the performance of CPS in terms of adjusting to changes, making it more robust. AI-based smart systems used in industries, such as manufacturing, healthcare, and aerospace, are integrating physical and digital components to enhance operational efficiency in the CPS framework. For instance, companies, such as General Electric Company (US), employ an AI-enabled data analytics module within the CPS to supervise machinery in real time. Such systems can evaluate if equipment will fail and send relevant alerts ahead of time, preventing unplanned downtimes. This practice enhances the underlying operational processes and increases the value of the machinery used, highlighting the significance of AI in CPS.

Attractive Opportunities in the Cyber-Physical Systems Market

Asia Pacific

Rapid industrialization and urbanization in Asia Pacific are accelerating the adoption of cyber-physical system (CPS) technologies.

Government initiatives and policies support digital transformation and smart technology adoption.

Growing focus on sustainability and energy efficiency boost the adoption of smart grids and digital twins across the region.

Expansion of smart city projects presents significant opportunities for CPS applications in urban infrastructure.

Increasing investment in advanced manufacturing technologies offers potential for CPS innovations for industrial automation applications.

Global Cyber-Physical Systems Market Dynamics

Driver: Growing trend of industrial automation

The industrial automation trend is gaining momentum and is one of the main drivers of the cyber-physical systems market. Automation technologies are widely deployed in industries, such as manufacturing, automotive, and process, to increase efficiency, productivity, and precision, minimizing human intervention. With changing traditional manufacturing and industrial processes, advanced automation solutions, such as robotics, artificial intelligence, and machine learning, enable real-time monitoring of assets, predictive maintenance, and better management of the shift toward automation also improves the operation performance and justifies the broader objectives of digital transformation, hence amplifying the growth of the cyber-physical systems market. The demand for accelerated performance with minimum human interference accelerates automation in key industries. These systems interact and bridge the gap between physical processes, computational elements, and human-machine interaction. This makes the manufacturing environment more responsive and adaptive and continuously drives the growth in the cyber-physical systems market. Additionally, CPS enhances production flexibility, allowing manufacturers to adapt quickly to changing demands and reduce downtimes. It helps a business integrate real-time data from IoT devices, sensors, and machines into the decision-making process for better choices with reduced chances of errors and higher output.

Restraint: High installation costs

Despite the benefits of deploying cyber-physical systems, high installation cost is a major restraining factor in the cyber-physical systems market. Advanced cyber-physical systems usually require high investment in advanced technology, infrastructures, and human resources during installation. Such factors may be an obstacle for enterprises of smaller sizes or those with limited budgets. These factors are slowing down the adoption rate of such systems. In addition, installations of cyber-physical systems designed with specific characteristics are complex depending upon their size and operation, which increases the initial cost and time to achieve returns on investment. This factor might deter some enterprises from making investments in these high-end solutions. Small and medium-sized enterprises (SMEs) consider CPS deployment more financially burdensome due to the lack of access to sufficient capital and expertise. Furthermore, the difficulty in adapting these systems to operational needs limits financial investments from SMEs. In addition, the dearth of skilled personnel to manage and maintain such advanced systems adds to the burden on smaller enterprises. Systemic upgrades, periodic maintenance, and higher cybersecurity measures further extend the financial strain, limiting the long-term viability of such investments by smaller firms.


Opportunity: Rising preference for sustainable energy

The shifting preference toward sustainable energy remains an excellent opportunity for players in the cyber-physical system market. As the demand for clean and efficient energy solutions continues to rise, technologies contributing to the smart grids make them more visible. Additionally, with the shift toward renewable energy sources, smart grids that require cyber-physical systems to improve the level of monitoring, managing, and optimally operating energy distribution fit well into this concept. Therefore, the rising focus on sustainability has increased innovation and investment in cyber-physical systems. Additionally, the increase in deployment of advanced energy management technologies is creating growth opportunities for players in the market. The transition toward renewable energy sources is driven by global environmental goals and the rising emphasis on reducing carbon footprints. By enabling real-time energy monitoring, CPS optimizes grid operations to utilize energy resources while ensuring minimum waste efficiently, thus supporting sustainability initiatives. The emergence of electric vehicles is happening amid the high interest in energy storage solutions, providing growth opportunities for players in the cyber-physical systems market, given that such emerging technologies need intelligent management and optimization for seamless integration into the energy grid.

Challenge: Complexities associated with integrating various components

One major challenge in the market of cyber-physical systems is the integration of these complex systems. The technical difficulty lies in integrating all cyber-physical system components, including sensors, devices, and data analytics platforms, into one operable system. The interoperability between different technologies, management of huge volumes of data, and enabling enhanced security of cyber-physical systems are also key challenges. These challenges increase development time and raise development costs, resulting in challenges in implementation across industries. Therefore, well-thought planning and execution of the integration strategy are required to ensure the system is successfully deployed in the organization. Different hardware and software systems create cyber-physical systems, making integration complicated. Very thorough testing and precise coordination are needed to ensure compatibility and seamless communication between heterogeneous components. Besides, maintaining data integrity and cybersecurity in a system with numerous interconnected devices is even another layer of complexity. To deal with this challenge, companies must invest heavily in better infrastructure and human capital. Security is yet another vital concern. As more devices and systems are integrated, the greater the vulnerability to cyber threats. This increases the requirement for adequate cybersecurity, adding to the cost and time required for effective deployment.

Global Cyber-Physical Systems Market Ecosystem Analysis

The cyber-physical systems market is dominated by established and financially sound manufacturers with extensive experience in the industry. These companies have diversified product portfolios, cutting-edge technologies, and strong global sales and marketing networks. The adoption of cyber-physical systems (CPS) in various applications, and the impact of emerging technologies have been provided below. Furthermore, the system component providers, networking and communication solutions providers, systems integrators, and verticals are major entities involved in the ecosystem of cyber-physical systems market.


Digital twin segment to register highest CAGR during forecast period

Digital twins are emerging as one of the transformative forces in the cyber-physical systems market due to the creation of virtual replicas of physical assets, processes, or systems with high precision. Such a technology would equip organizations with real-time simulation and analytics that optimize operations by drawing insight from performance and condition data about physical assets. This technology helps enhance decision-making and enables superior operational efficiencies and strategic planning based on data-derived insights. Since these benefits are gradually recognized in industries, such as manufacturing, energy, and healthcare, the adoption of the technology is increasing. As applications of digital twins are increased, the effectiveness in scenario simulation and outcome prediction makes huge contributions to downtime reduction and increased maintenance levels. With real-time data, businesses can identify potential issues before they happen, reducing disruptions and costs. It further enhances decision-making processes by making them more accurate with predictive analytics through AI and machine learning embedded within the digital twin. Growing awareness of the benefits is bound to increase the adoption of the technology in other sectors, ensuring that the place of digital twins in the future of cyber-physical systems is secured.

Smart grid segment held largest share of cyber-physical systems market in 2023

The smart grid segment held the largest share in the cyber-physical systems market in 2023 due to technological advancements in energy management systems. The smart grid provides real-time monitoring and integration of energy sources, enhancing grids’ reliability and efficiency. The rapidly increasing population and urbanization have also significantly increased the global energy demand. Smart grids are essential in meeting high energy demand by optimizing distribution networks with minimal energy losses. Providing such a reliable energy supply while integrating various energy sources makes the smart grid one of the crucial components to meet future energy needs. Such factors are responsible for boosting the growth of the cyber-physical systems market for the smart grid segment. Beyond improvement in energy distribution, smart grids also allow the integration of renewable energy sources, such as solar and wind, into the general mix. This ability is key since most of the world is striving for cleaner energy sources to help cut down on climate change. With advanced metering infrastructure and real-time data analytics, utilities are better equipped to respond to energy supply and demand fluctuations.

Manufacturing segment captured second-largest share of cyber-physical systems market in 2023

The manufacturing sector is a key vertical in the cyber-physical system market, holding the second-largest share in 2023. Most manufacturing operations rely on advanced technologies to increase the value of the production process. Furthermore, cyber-physical systems in manufacturing allow real-time monitoring and control of production lines, resulting in increased resource management and process optimization efficiency. The cyber-physical systems provide automation support with enhanced quality even in manufacturing and, as a result, give optimal process performance in both process and discrete manufacturing processes, besides reducing the cost of operation. The manufacturing sector has already been at the forefront due to the introduction of smart technologies, such as robotics, and the integration of IoT. Furthermore, substantial investments in this sector increase the development of cyber-physical systems. While manufacturers increasingly adopt CPS, one of the more visible concepts in this direction is that of smart factories where machines, humans, and systems function in seamless cooperation with each other. Enhanced quality control limits defects and waste due to the possibility of collecting and analyzing data from various stages within the chain.

Asia Pacific to Exhibit Highest CAGR in Cyber-Physical Systems Market During Forecast Period

The cyber-physical systems market has been observing a faster growth rate in Asia Pacific, owing to rapid industrialization, surging investments in smart infrastructures, and upscaling adoption of sophisticated technologies among key sectors. Nations, such as China, Japan, South Korea, and India, lead in integrating CPS technologies, including the Industrial Internet of Things (IIoT), smart grids, and digital twins, into manufacturing, automotive, and energy industries. This region’s persistent digital transition is aligned with government initiatives, and zoning research & development (R&D) resources stimulate acceptance of CPS to boost operational effectiveness and competitiveness. Furthermore, increasing demand for automation, expanding smart cities, and the rising trend toward Industry 4.0 practices are propelling the CPS market in Asia Pacific, making it the fastest-growing region. The industrial scenario of the region has started to take a changing curve due to the heightened demand for CPS in industries, such as manufacturing and energy, where automation has become a key requirement- one that relies on real-time monitoring. The ongoing development of smart cities across Asia Pacific further propels the demand for CPS. These cities need sophisticated infrastructure supporting connected systems, sustainable energy solutions, and efficient resource management.

HIGHEST CAGR MARKET IN 2023
ASIA PACIFIC FASTEST GROWING MARKET IN THE REGION

Recent Developments of Cyber-Physical Systems Market industry

  • In May 2024, Hitachi completed its acquisition of Thales’ Ground Transportation Systems (GTS), enhancing its global presence in 51 countries. The acquisition positions Hitachi Rail to lead in sustainable mobility solutions, leveraging GTS’s expertise in rail signaling and digital systems.
  • In April 2024, Siemens and Mercedes-Benz collaborated to develop a Digital Energy Twin to enhance sustainable factory planning in the automotive industry, aiming for 100% renewable energy at all production sites by 2039. The innovative tool developed under this collaboration provides monitoring of energy usage scenarios and helps optimize efficiency and reduce emissions in manufacturing facilities.
  • In February 2024, Rockwell Automation partnered with Prometeon Tyre Group to enhance global manufacturing processes through a multi-year collaboration. This partnership is intended to implement Rockwell’s Manufacturing Execution System (MES) to improve efficiency, productivity, and sustainability across Prometeon’s facilities in Italy, Turkey, Egypt, and Brazil. Furthermore, this partnership aims to create a more connected and streamlined production environment.
  • In December 2023, Honeywell International Inc. announced the acquisition of the Access Solutions business of Carrier Global Corporation. This acquisition has strengthened Honeywell’s building automation capabilities by adding three well-regarded brands, such as LenelS2, Onity, and Supra.
  • In August 2023, Schneider Electric launched Managed Security Services (MSS) tailored for operational technology environments. These services are aimed to detect and mitigate cyber threats proactively. This offering also enhances cybersecurity through 24/7 monitoring, leveraging advanced technologies and expertise. It addresses the growing risks industries face, ensuring operational continuity and compliance with regulatory standards.

Key Market Players

Furthermore, some of the prominent small and medium enterprises involved in the cyber-physical systems market include,

Get online access to the report on the World's First Market Intelligence Cloud

  • Easy to Download Historical Data & Forecast Numbers
  • Company Analysis Dashboard for high growth potential opportunities
  • Research Analyst Access for customization & queries
  • Competitor Analysis with Interactive dashboard
  • Latest News, Updates & Trend analysis
Request Sample

Scope of the Report

Report Attribute Details
Market size available for years 2020–2029
Forecast units Value (USD Million/Billion)
Segments Covered By Type, Vertical
Geographies covered North America, Europe, Asia Pacific, and Rest of the world (RoW)

Key Questions Addressed by the Report

What are the cyber-physical systems market’s major driving factors and opportunities?
Major driving factors for the cyber-physical systems market include smart infrastructure development and the rising deployment of digital twin technology. Collaborative strategies among participants in the supply chain are also anticipated to fuel market growth.
Which region is expected to hold the highest market share in 2029?
Asia Pacific region is expected to hold the highest share in the cyber-physical systems market in 2029 due to growing investments in smart manufacturing and Industry 4.0 initiatives.
Who are the leading players in the global cyber-physical systems market?
Companies, such as ABB (Switzerland), Honeywell International Inc. (US), Rockwell Automation (US), Schneider Electric (France), and Siemens (Germany), are the leading players in the market. These companies rely on several strategies, including new product launches and developments, collaborations, partnerships, and acquisitions. Such strategies give these companies an edge over other players in the market.
What are some of the technological advancements in the cyber-physical systems market?
Recent developments in the cyber-physical systems market include advanced predictive analytics and the development of digital twins through AI for real-time simulation and optimization of systems. There has also been considerable progress in deploying edge computing to improve responsiveness and efficiency to several critical applications.
What is the size of the global cyber-physical systems market?
The global cyber-physical systems market was valued at USD 124.1 billion in 2024 and is anticipated to reach USD 255.3 billion by 2029, growing at a CAGR of 15.5% during the forecast period.


Personalize This Research

  • Triangulate with your Own Data
  • Get Data as per your Format and Definition
  • Gain a Deeper Dive on a Specific Application, Geography, Customer or Competitor
  • Any level of Personalization
Request A Free Customisation

Let Us Help You

  • What are the Known and Unknown Adjacencies Impacting the Cyber-Physical Systems (CPS) Market
  • What will your New Revenue Sources be?
  • Who will be your Top Customer; what will make them switch?
  • Defend your Market Share or Win Competitors
  • Get a Scorecard for Target Partners
Request A Free Customisation

Table Of Content

Exclusive indicates content/data unique to MarketsandMarkets and not available with any competitors.

TITLE
PAGE NO
INTRODUCTION
26
RESEARCH METHODOLOGY
30
EXECUTIVE SUMMARY
42
PREMIUM INSIGHTS
47
MARKET OVERVIEW
50
  • 5.1 INTRODUCTION
  • 5.2 MARKET DYNAMICS
    DRIVERS
    - Rapid advances in operational technology
    - Increasing implementation of smart infrastructure projects
    - Rising deployment of digital twin technology
    - Burgeoning demand for personalized medicines
    - Increasing development of intelligent transportation systems
    RESTRAINTS
    - High implementation costs
    - Shortage of skilled operators
    OPPORTUNITIES
    - Integration of CPS with IoT technology for advanced applications
    - Rising emphasis on energy efficiency
    - Growing preference for precision farming techniques
    CHALLENGES
    - Challenges associated with developing specialized protection tools
    - Growing security risks
  • 5.3 VALUE CHAIN ANALYSIS
  • 5.4 ECOSYSTEM ANALYSIS
  • 5.5 INVESTMENT AND FUNDING SCENARIO
  • 5.6 TRENDS/DISRUPTIONS IMPACTING CUSTOMER BUSINESS
  • 5.7 PRICING ANALYSIS
    AVERAGE SELLING PRICE TREND OF DIGITAL TWIN, BY KEY PLAYER
    AVERAGE SELLING PRICE TREND, BY REGION
  • 5.8 TECHNOLOGY ANALYSIS
    KEY TECHNOLOGIES
    - Sensors and actuators
    - Embedded systems
    - Real-time operating systems (RTOS)
    - Control systems
    - Cybersecurity
    - Artificial intelligence (AI) and machine learning (ML)
    COMPLEMENTARY TECHNOLOGIES
    - Internet of Things (IoT)
    - Augmented reality (AR) and virtual reality (VR)
    - Edge computing
    ADJACENT TECHNOLOGIES
    - Blockchain and distributed ledger technology (DLT)
  • 5.9 IMPACT OF GEN AI/AI ON CYBER-PHYSICAL SYSTEMS MARKET
    INTRODUCTION
    ADVANCEMENTS IN CYBER-PHYSICAL SYSTEMS DUE TO AI
    - Operational technology
    - Industrial control systems (ICS)
    - IIoT
    - Digital twin
    - Smart buildings
    - Intelligent transportation systems (ITS)
    - Smart grids
    - Smart agriculture
    - Robotics
    CASE STUDIES
  • 5.10 PORTER'S FIVE FORCES ANALYSIS
    INTENSITY OF COMPETITIVE RIVALRY
    BARGAINING POWER OF SUPPLIERS
    BARGAINING POWER OF BUYERS
    THREAT OF NEW ENTRANTS
    THREAT OF SUBSTITUTES
  • 5.11 KEY STAKEHOLDERS AND BUYING CRITERIA
    KEY STAKEHOLDERS IN BUYING PROCESS
    BUYING CRITERIA
  • 5.12 CASE STUDY ANALYSIS
    METROPOLITAN AIRPORTS COMMISSION ADOPTS HONEYWELL’S NIAGARA FRAMEWORK TO IMPROVE OPERATIONAL EFFICIENCY
    ARB MIDSTREAM DEPLOYS SCADA GRAPHICS AND IGNITION TEMPLATES TO ENABLE OPERATIONAL READINESS OF CRUDE OIL PIPELINE
    INDIAN PUBLIC TRANSPORTATION SYSTEM IMPLEMENTS INTELLIGENT TRANSPORTATION SYSTEM TO OPTIMIZE OPERATIONS
    EQUS PARTNERS WITH SCHNEIDER ELECTRIC TO IMPLEMENT SMART SOLUTION FEATURING ADVANCED METERING INFRASTRUCTURE TO IMPROVE GRID RELIABILITY
  • 5.13 TRADE ANALYSIS
    IMPORT SCENARIO (HS CODE 847950)
    EXPORT SCENARIO (HS CODE 847950)
    IMPORT SCENARIO (HS CODE 902690)
    EXPORT SCENARIO (HS CODE 902690)
    IMPORT SCENARIO (HS CODE 903289)
    EXPORT SCENARIO (HS CODE 903289)
  • 5.14 TARIFF AND REGULATORY LANDSCAPE
    TARIFF ANALYSIS
    REGULATORY BODIES, GOVERNMENT AGENCIES, AND OTHER ORGANIZATIONS
    REGULATIONS
    STANDARDS
  • 5.15 PATENT ANALYSIS
  • 5.16 KEY CONFERENCES AND EVENTS, 2024–2025
FRAMEWORKS OF CYBER-PHYSICAL SYSTEMS
95
  • 6.1 INTRODUCTION
  • 6.2 PERCEPTION LAYER
  • 6.3 DATA TRANSMISSION & MANAGEMENT LAYER
  • 6.4 APPLICATION LAYER
COMPONENTS OF CYBER-PHYSICAL SYSTEMS
98
  • 7.1 INTRODUCTION
  • 7.2 HARDWARE
  • 7.3 SOFTWARE
  • 7.4 SERVICES
CYBER AND PHYSICAL SYSTEMS
100
  • 8.1 INTRODUCTION
  • 8.2 CYBER SYSTEMS
    EDGE COMPUTING
    DATA PROCESSING & ANALYTICS
    NETWORKING
    SECURITY
  • 8.3 PHYSICAL SYSTEMS
    SENSORS
    ACTUATORS
    DIGITAL & ANALOG DEVICES
    ENERGY SOURCES
    COMMUNICATION INTERFACE
    DATA STORAGE DEVICES
CYBER-PHYSICAL SYSTEMS MARKET, BY TYPE
104
  • 9.1 INTRODUCTION
  • 9.2 OPEN-LOOP
    SIMPLE DESIGN AND COST-EFFECTIVENESS TO CONTRIBUTE TO SEGMENTAL GROWTH
  • 9.3 CLOSED-LOOP
    REQUIREMENT FOR REAL-TIME FEEDBACK IN COMPLEX ENVIRONMENTS TO FUEL SEGMENTAL GROWTH
CYBER-PHYSICAL SYSTEMS MARKET, BY TECHNOLOGY
107
  • 10.1 INTRODUCTION
  • 10.2 INDUSTRIAL MANAGEMENT
    OPERATIONAL TECHNOLOGY
    - Mounting demand from process industries to drive market
    INDUSTRIAL CONTROL SYSTEMS
    - Increasing complexity of industrial operations to boost segmental growth
    IIOT
    - Growing adoption of Industry 4.0 practices to augment segmental growth
    DIGITAL TWIN
    - Increasing use in industries to optimize maintenance schedules to fuel segmental growth
  • 10.3 SMART OPERATIONS
    SMART BUILDINGS
    - Burgeoning demand for energy-efficient solutions to accelerate segmental growth
    INTELLIGENT TRANSPORTATION SYSTEMS
    - Rising emphasis on optimizing traffic flow to foster segmental growth
    SMART GRIDS
    - Software
    - Hardware
    - Services
    SMART AGRICULTURE
    - Need for sustainable farming practices to contribute to segmental growth
  • 10.4 ROBOTICS
    RISING INTEGRATION OF ROBOTS IN INDUSTRIES TO PERFORM PRECISE OPERATIONS TO FOSTER SEGMENTAL GROWTH
CYBER-PHYSICAL SYSTEMS MARKET, BY VERTICAL
134
  • 11.1 INTRODUCTION
  • 11.2 MANUFACTURING
    INCREASING ADOPTION OF INDUSTRY 4.0 TECHNOLOGIES TO BOOST SEGMENTAL GROWTH
  • 11.3 HEALTHCARE
    RISING EMPHASIS ON SUPPORTING PRECISE MEDICAL INTERVENTIONS TO AUGMENT SEGMENTAL GROWTH
  • 11.4 AGRICULTURE
    GROWING NEED FOR SUSTAINABLE FARMING PRACTICES TO DRIVE MARKET
  • 11.5 AUTOMOTIVE & TRANSPORTATION
    RAPID ADVANCES IN AUTONOMOUS DRIVING TECHNOLOGIES TO BOOST SEGMENTAL GROWTH
  • 11.6 AEROSPACE
    INCREASING FOCUS ON DESIGN IMPROVEMENT AND OPERATIONAL EFFICIENCY TO AUGMENT SEGMENTAL GROWTH
  • 11.7 ENERGY
    GROWING DEMAND FOR REAL-TIME MONITORING SYSTEMS TO REVOLUTIONIZE GRID OPERATIONS TO DRIVE MARKET
  • 11.8 INFRASTRUCTURE
    INCREASING FOCUS ON SMART CITY DEVELOPMENT OF FOSTER SEGMENTAL GROWTH
  • 11.9 OIL & GAS
    RISING NEED TO PREVENT DOWNTIME AND MINIMIZE ENVIRONMENTAL IMPACTS TO ACCELERATE SEGMENTAL GROWTH
CYBER-PHYSICAL SYSTEMS MARKET, BY REGION
153
  • 12.1 INTRODUCTION
  • 12.2 NORTH AMERICA
    MACROECONOMIC OUTLOOK FOR NORTH AMERICA
    US
    - Rapid digitalization and industrial automation to augment market growth
    CANADA
    - Increasing support for emerging technologies to boost market growth
    MEXICO
    - Rising emphasis on smart manufacturing to foster market growth
  • 12.3 EUROPE
    MACROECONOMIC OUTLOOK FOR EUROPE
    GERMANY
    - Increasing investment in digital technologies and smart factory solutions to fuel market growth
    UK
    - Growing focus on advancing energy infrastructure to contribute to market growth
    FRANCE
    - Rising emphasis on sustainable development and energy efficiency to accelerate market growth
    REST OF EUROPE
  • 12.4 ASIA PACIFIC
    MACROECONOMIC OUTLOOK FOR ASIA PACIFIC
    CHINA
    - Increasing focus on optimizing energy distribution and improving power grid reliability to drive market
    JAPAN
    - Growing emphasis on addressing cyber risks to contribute to market growth
    SOUTH KOREA
    - Rising integration of advanced technologies for smart city development to bolster segmental growth
    INDIA
    - Growing focus on digital transformation to contribute to market growth
    REST OF ASIA PACIFIC
  • 12.5 ROW
    MACROECONOMIC OUTLOOK FOR ROW
    MIDDLE EAST
    - Rising emphasis on technological advancement and sustainability to accelerate market growth
    - GCC countries
    - Rest of Middle East
    AFRICA
    - Increasing modernization of energy distribution systems to boost market growth
    SOUTH AMERICA
    - Rising deployment of advanced technologies for industrial automation to fuel market growth
COMPETITIVE LANDSCAPE
179
  • 13.1 OVERVIEW
  • 13.2 KEY PLAYER STRATEGIES/RIGHT TO WIN, 2020–2024
  • 13.3 MARKET SHARE ANALYSIS, 2023
  • 13.4 REVENUE ANALYSIS, 2019–2023
  • 13.5 COMPANY VALUATION AND FINANCIAL METRICS
  • 13.6 BRAND/PRODUCT COMPARISON
  • 13.7 COMPANY EVALUATION MATRIX: KEY PLAYERS, 2023
    STARS
    EMERGING LEADERS
    PERVASIVE PLAYERS
    PARTICIPANTS
    COMPANY FOOTPRINT: KEY PLAYERS, 2023
    - Company footprint
    - Technology footprint
    - Vertical footprint
    - Region footprint
  • 13.8 COMPANY EVALUATION MATRIX: STARTUPS/SMES, 2023
    PROGRESSIVE COMPANIES
    RESPONSIVE COMPANIES
    DYNAMIC COMPANIES
    STARTING BLOCKS
    COMPETITIVE BENCHMARKING: STARTUPS/SMES, 2023
    - Detailed list of key startups/SMEs
    - Competitive benchmarking of key startups/SMEs
  • 13.9 COMPETITIVE SCENARIO
    PRODUCT LAUNCHES
    DEALS
    EXPANSIONS
    OTHERS
COMPANY PROFILES
214
  • 14.1 KEY PLAYERS
    ABB
    - Business overview
    - Products/Solutions/Services offered
    - Recent developments
    - MnM view
    HONEYWELL INTERNATIONAL INC.
    - Business overview
    - Products/Solutions/Services offered
    - Recent developments
    - MnM view
    HITACHI, LTD.
    - Business overview
    - Products/Solutions/Services offered
    - Recent developments
    - MnM view
    SCHNEIDER ELECTRIC
    - Business overview
    - Products/Solutions/Services offered
    - Recent developments
    - MnM view
    SIEMENS
    - Business overview
    - Products/Solutions/Services offered
    - Recent developments
    - MnM view
    ROCKWELL AUTOMATION
    - Business overview
    - Products/Solutions/Services offered
    - Recent developments
    CONTINENTAL AG
    - Business overview
    - Products/Solutions/Services offered
    - Recent developments
    GENERAL ELECTRIC COMPANY
    - Business overview
    - Products/Solutions/Services offered
    - Recent developments
    TOSHIBA CORPORATION
    - Business overview
    - Products/Solutions/Services offered
    - Recent developments
    ROBERT BOSCH GMBH
    - Business overview
    - Products/Solutions/Services offered
    - Recent developments
    CISCO SYSTEMS, INC.
    - Business overview
    - Products/Solutions/Services offered
    - Recent developments
  • 14.2 OTHER PLAYERS
    EMERSON ELECTRIC CO.
    INTEL CORPORATION
    IBM CORPORATION
    DASSAULT SYSTÈMES
    MICROSOFT
    JOHNSON CONTROLS INC.
    ORACLE
    SAP SE
    DEERE & COMPANY
    TRIMBLE INC.
    AGCO CORPORATION
    MITSUBISHI ELECTRIC CORPORATION
    ITRON INC.
    FUJI ELECTRIC CO., LTD.
    YASKAWA ELECTRIC CORPORATION
    FANUC CORPORATION
    CUBIC CORPORATION
APPENDIX
291
  • 15.1 INSIGHTS FROM INDUSTRY EXPERTS
  • 15.2 DISCUSSION GUIDE
  • 15.3 KNOWLEDGESTORE: MARKETSANDMARKETS’ SUBSCRIPTION PORTAL
  • 15.4 CUSTOMIZATION OPTIONS
  • 15.5 RELATED REPORTS
  • 15.6 AUTHOR DETAILS
  • 15.7 TABLE 1 ROLE OF COMPANIES IN CYBER-PHYSICAL SYSTEMS ECOSYSTEM
LIST OF TABLES
 
  • TABLE 2 AVERAGE SELLING PRICE TREND OF DIGITAL TWIN, BY KEY PLAYER (USD)
  • TABLE 3 PORTER'S FIVE FORCES ANALYSIS
  • TABLE 4 INFLUENCE OF STAKEHOLDERS ON BUYING PROCESS FOR TOP THREE VERTICALS (%)
  • TABLE 5 KEY BUYING CRITERIA FOR TOP THREE VERTICALS
  • TABLE 6 IMPORT DATA FOR HS CODE 847950-COMPLIANT PRODUCTS, BY COUNTRY, 2019–2023 (USD THOUSAND)
  • TABLE 7 EXPORT DATA FOR HS CODE 847950-COMPLIANT PRODUCTS, BY COUNTRY, 2019–2023 (USD THOUSAND)
  • TABLE 8 IMPORT DATA FOR HS CODE 902690-COMPLIANT PRODUCTS, BY COUNTRY, 2019–2023 (USD THOUSAND)
  • TABLE 9 EXPORT DATA FOR HS CODE 902690-COMPLIANT PRODUCTS, BY COUNTRY, 2019–2023 (USD THOUSAND)
  • TABLE 10 IMPORT DATA FOR HS CODE 903289-COMPLIANT PRODUCTS, BY COUNTRY, 2019–2023 (USD THOUSAND)
  • TABLE 11 EXPORT DATA FOR HS CODE 903289-COMPLIANT PRODUCTS, BY COUNTRY, 2019–2023 (USD THOUSAND)
  • TABLE 12 MFN TARIFF FOR HS CODE 902690-COMPLIANT PRODUCTS EXPORTED BY US, 2023
  • TABLE 13 MFN TARIFF FOR HS CODE 902690-COMPLIANT PRODUCTS EXPORTED BY GERMANY, 2023
  • TABLE 14 MFN TARIFF FOR HS CODE 902690-COMPLIANT PRODUCTS EXPORTED BY CHINA, 2023
  • TABLE 15 MFN TARIFF FOR HS CODE 902690-COMPLIANT PRODUCTS EXPORTED BY MEXICO, 2023
  • TABLE 16 NORTH AMERICA: REGULATORY BODIES, GOVERNMENT AGENCIES, AND OTHER ORGANIZATIONS
  • TABLE 17 EUROPE: REGULATORY BODIES, GOVERNMENT AGENCIES, AND OTHER ORGANIZATIONS
  • TABLE 18 ASIA PACIFIC: REGULATORY BODIES, GOVERNMENT AGENCIES, AND OTHER ORGANIZATIONS
  • TABLE 19 ROW: REGULATORY BODIES, GOVERNMENT AGENCIES, AND OTHER ORGANIZATIONS
  • TABLE 20 LIST OF MAJOR PATENTS, 2021–2024
  • TABLE 21 KEY CONFERENCES AND EVENTS, 2024–2025
  • TABLE 22 CYBER-PHYSICAL SYSTEMS MARKET, BY TYPE, 2020–2023 (USD MILLION)
  • TABLE 23 CYBER-PHYSICAL SYSTEMS MARKET, BY TYPE, 2024–2029 (USD MILLION)
  • TABLE 24 CYBER-PHYSICAL SYSTEMS MARKET, BY TECHNOLOGY, 2020–2023 (USD MILLION)
  • TABLE 25 CYBER-PHYSICAL SYSTEMS MARKET, BY TECHNOLOGY, 2024–2029 (USD MILLION)
  • TABLE 26 INDUSTRIAL MANAGEMENT: CYBER-PHYSICAL SYSTEMS MARKET, BY TECHNOLOGY TYPE, 2020–2023 (USD MILLION)
  • TABLE 27 INDUSTRIAL MANAGEMENT: CYBER-PHYSICAL SYSTEMS MARKET, BY TECHNOLOGY TYPE, 2024–2029 (USD MILLION)
  • TABLE 28 INDUSTRIAL MANAGEMENT: CYBER-PHYSICAL SYSTEMS MARKET, BY REGION, 2020–2023 (USD MILLION)
  • TABLE 29 INDUSTRIAL MANAGEMENT: CYBER-PHYSICAL SYSTEMS MARKET, BY REGION, 2024–2029 (USD MILLION)
  • TABLE 30 OPERATIONAL TECHNOLOGY: CYBER-PHYSICAL SYSTEMS MARKET, BY REGION, 2020–2023 (USD MILLION)
  • TABLE 31 OPERATIONAL TECHNOLOGY: CYBER-PHYSICAL SYSTEMS MARKET, BY REGION, 2024–2029 (USD MILLION)
  • TABLE 32 OPERATIONAL TECHNOLOGY: CYBER-PHYSICAL SYSTEMS MARKET, BY VERTICAL, 2020–2023 (USD MILLION)
  • TABLE 33 OPERATIONAL TECHNOLOGY: CYBER-PHYSICAL SYSTEMS MARKET, BY VERTICAL, 2024–2029 (USD MILLION)
  • TABLE 34 INDUSTRIAL CONTROL SYSTEMS: CYBER-PHYSICAL SYSTEMS MARKET, BY REGION, 2020–2023 (USD MILLION)
  • TABLE 35 INDUSTRIAL CONTROL SYSTEMS: CYBER-PHYSICAL SYSTEMS MARKET, BY REGION, 2024–2029 (USD MILLION)
  • TABLE 36 INDUSTRIAL CONTROL SYSTEMS: CYBER-PHYSICAL SYSTEMS MARKET, BY VERTICAL, 2020–2023 (USD MILLION)
  • TABLE 37 INDUSTRIAL CONTROL SYSTEMS: CYBER-PHYSICAL SYSTEMS MARKET, BY VERTICAL, 2024–2029 (USD MILLION)
  • TABLE 38 IIOT: CYBER-PHYSICAL SYSTEMS MARKET, BY REGION, 2020–2023 (USD MILLION)
  • TABLE 39 IIOT: CYBER-PHYSICAL SYSTEMS MARKET, BY REGION, 2024–2029 (USD MILLION)
  • TABLE 40 IIOT: CYBER-PHYSICAL SYSTEMS MARKET, BY VERTICAL, 2020–2023 (USD MILLION)
  • TABLE 41 IIOT: CYBER-PHYSICAL SYSTEMS MARKET, BY VERTICAL, 2024–2029 (USD MILLION)
  • TABLE 42 DIGITAL TWIN: CYBER-PHYSICAL SYSTEMS MARKET, BY REGION, 2020–2023 (USD MILLION)
  • TABLE 43 DIGITAL TWIN: CYBER-PHYSICAL SYSTEMS MARKET, BY REGION, 2024–2029 (USD MILLION)
  • TABLE 44 DIGITAL TWIN: CYBER-PHYSICAL SYSTEMS MARKET, BY VERTICAL, 2020–2023 (USD MILLION)
  • TABLE 45 DIGITAL TWIN: CYBER-PHYSICAL SYSTEMS MARKET, BY VERTICAL, 2024–2029 (USD MILLION)
  • TABLE 46 SMART OPERATIONS: CYBER-PHYSICAL SYSTEMS MARKET, BY TECHNOLOGY TYPE, 2020–2023 (USD MILLION)
  • TABLE 47 SMART OPERATIONS: CYBER-PHYSICAL SYSTEMS MARKET, BY TECHNOLOGY TYPE, 2024–2029 (USD MILLION)
  • TABLE 48 SMART OPERATIONS: CYBER-PHYSICAL SYSTEMS MARKET, BY REGION, 2020–2023 (USD MILLION)
  • TABLE 49 SMART OPERATIONS: CYBER-PHYSICAL SYSTEMS MARKET, BY REGION, 2024–2029 (USD MILLION)
  • TABLE 50 SMART BUILDINGS: CYBER-PHYSICAL SYSTEMS MARKET, BY REGION, 2020–2023 (USD MILLION)
  • TABLE 51 SMART BUILDINGS: CYBER-PHYSICAL SYSTEMS MARKET, BY REGION, 2024–2029 (USD MILLION)
  • TABLE 52 SMART BUILDINGS: CYBER-PHYSICAL SYSTEMS MARKET, BY VERTICAL, 2020–2023 (USD MILLION)
  • TABLE 53 SMART BUILDINGS: CYBER-PHYSICAL SYSTEMS MARKET, BY VERTICAL, 2024–2029 (USD MILLION)
  • TABLE 54 INTELLIGENT TRANSPORTATION SYSTEMS: CYBER-PHYSICAL SYSTEMS MARKET, BY REGION, 2020–2023 (USD MILLION)
  • TABLE 55 INTELLIGENT TRANSPORTATION SYSTEMS: CYBER-PHYSICAL SYSTEMS MARKET, BY REGION, 2024–2029 (USD MILLION)
  • TABLE 56 INTELLIGENT TRANSPORTATION SYSTEMS: CYBER-PHYSICAL SYSTEMS MARKET, BY VERTICAL, 2020–2023 (USD MILLION)
  • TABLE 57 INTELLIGENT TRANSPORTATION SYSTEMS: CYBER-PHYSICAL SYSTEMS MARKET, BY VERTICAL, 2024–2029 (USD MILLION)
  • TABLE 58 SMART GRIDS: CYBER-PHYSICAL SYSTEMS MARKET, BY REGION, 2020–2023 (USD MILLION)
  • TABLE 59 SMART GRIDS: CYBER-PHYSICAL SYSTEMS MARKET, BY REGION, 2024–2029 (USD MILLION)
  • TABLE 60 SMART GRIDS: CYBER-PHYSICAL SYSTEMS MARKET, BY VERTICAL, 2020–2023 (USD MILLION)
  • TABLE 61 SMART GRIDS: CYBER-PHYSICAL SYSTEMS MARKET, BY VERTICAL, 2024–2029 (USD MILLION)
  • TABLE 62 SMART GRIDS: CYBER-PHYSICAL SYSTEMS MARKET, BY OFFERING, 2020–2023 (USD MILLION)
  • TABLE 63 SMART GRIDS: CYBER-PHYSICAL SYSTEMS MARKET, BY OFFERING, 2024–2029 (USD MILLION)
  • TABLE 64 SMART GRIDS: CYBER-PHYSICAL SYSTEMS MARKET, BY SOFTWARE COMPONENT, 2020–2023 (USD MILLION)
  • TABLE 65 SMART GRIDS: CYBER-PHYSICAL SYSTEMS MARKET, BY SOFTWARE COMPONENT, 2024–2029 (USD MILLION)
  • TABLE 66 SMART GRIDS: CYBER-PHYSICAL SYSTEMS MARKET, BY HARDWARE TYPE, 2020–2023 (USD MILLION)
  • TABLE 67 SMART GRIDS: CYBER-PHYSICAL SYSTEMS MARKET, BY HARDWARE TYPE, 2024–2029 (USD MILLION)
  • TABLE 68 SMART AGRICULTURE: CYBER-PHYSICAL SYSTEMS MARKET, BY REGION, 2020–2023 (USD MILLION)
  • TABLE 69 SMART AGRICULTURE: CYBER-PHYSICAL SYSTEMS MARKET, BY REGION, 2024–2029 (USD MILLION)
  • TABLE 70 SMART AGRICULTURE: CYBER-PHYSICAL SYSTEMS MARKET, BY VERTICAL, 2020–2023 (USD MILLION)
  • TABLE 71 SMART AGRICULTURE: CYBER-PHYSICAL SYSTEMS MARKET, BY VERTICAL, 2024–2029 (USD MILLION)
  • TABLE 72 ROBOTICS: CYBER-PHYSICAL SYSTEMS MARKET, BY REGION, 2020–2023 (USD MILLION)
  • TABLE 73 ROBOTICS: CYBER-PHYSICAL SYSTEMS MARKET, BY REGION, 2024–2029 (USD MILLION)
  • TABLE 74 ROBOTICS: CYBER-PHYSICAL SYSTEMS MARKET, BY VERTICAL, 2020–2023 (USD MILLION)
  • TABLE 75 ROBOTICS: CYBER-PHYSICAL SYSTEMS MARKET, BY VERTICAL, 2024–2029 (USD MILLION)
  • TABLE 76 CYBER-PHYSICAL SYSTEMS MARKET, BY VERTICAL, 2020–2023 (USD MILLION)
  • TABLE 77 CYBER-PHYSICAL SYSTEMS MARKET, BY VERTICAL, 2024–2029 (USD MILLION)
  • TABLE 78 MANUFACTURING: CYBER-PHYSICAL SYSTEMS MARKET, BY TECHNOLOGY, 2020–2023 (USD MILLION)
  • TABLE 79 MANUFACTURING: CYBER-PHYSICAL SYSTEMS MARKET, BY TECHNOLOGY, 2024–2029 (USD MILLION)
  • TABLE 80 MANUFACTURING: CYBER-PHYSICAL SYSTEMS MARKET FOR INDUSTRIAL MANAGEMENT, BY TECHNOLOGY TYPE, 2020–2023 (USD MILLION)
  • TABLE 81 MANUFACTURING: CYBER-PHYSICAL SYSTEMS MARKET FOR INDUSTRIAL MANAGEMENT, BY TECHNOLOGY TYPE, 2024–2029 (USD MILLION)
  • TABLE 82 MANUFACTURING: CYBER-PHYSICAL SYSTEMS MARKET FOR SMART OPERATIONS, BY TECHNOLOGY TYPE, 2020–2023 (USD MILLION)
  • TABLE 83 MANUFACTURING: CYBER-PHYSICAL SYSTEMS MARKET FOR SMART OPERATIONS, BY TECHNOLOGY TYPE, 2024–2029 (USD MILLION)
  • TABLE 84 HEALTHCARE: CYBER-PHYSICAL SYSTEMS MARKET, BY TECHNOLOGY, 2020–2023 (USD MILLION)
  • TABLE 85 HEALTHCARE: CYBER-PHYSICAL SYSTEMS MARKET, BY TECHNOLOGY, 2024–2029 (USD MILLION)
  • TABLE 86 HEALTHCARE: CYBER-PHYSICAL SYSTEMS MARKET FOR INDUSTRIAL MANAGEMENT, BY TECHNOLOGY TYPE, 2020–2023 (USD MILLION)
  • TABLE 87 HEALTHCARE: CYBER-PHYSICAL SYSTEMS MARKET FOR INDUSTRIAL MANAGEMENT, BY TECHNOLOGY TYPE, 2024–2029 (USD MILLION)
  • TABLE 88 AGRICULTURE: CYBER-PHYSICAL SYSTEMS MARKET, BY TECHNOLOGY, 2020–2023 (USD MILLION)
  • TABLE 89 AGRICULTURE: CYBER-PHYSICAL SYSTEMS MARKET, BY TECHNOLOGY, 2024–2029 (USD MILLION)
  • TABLE 90 AGRICULTURE: CYBER-PHYSICAL SYSTEMS MARKET FOR INDUSTRIAL MANAGEMENT, BY TECHNOLOGY TYPE, 2020–2023 (USD MILLION)
  • TABLE 91 AGRICULTURE: CYBER-PHYSICAL SYSTEMS MARKET FOR INDUSTRIAL MANAGEMENT, BY TECHNOLOGY TYPE, 2024–2029 (USD MILLION)
  • TABLE 92 AGRICULTURE: CYBER-PHYSICAL SYSTEMS MARKET FOR SMART OPERATIONS, BY TECHNOLOGY TYPE, 2020–2023 (USD MILLION)
  • TABLE 93 AGRICULTURE: CYBER-PHYSICAL SYSTEMS MARKET FOR SMART OPERATIONS, BY TECHNOLOGY TYPE, 2024–2029 (USD MILLION)
  • TABLE 94 AUTOMOTIVE & TRANSPORTATION: CYBER-PHYSICAL SYSTEMS MARKET, BY TECHNOLOGY, 2020–2023 (USD MILLION)
  • TABLE 95 AUTOMOTIVE & TRANSPORTATION: CYBER-PHYSICAL SYSTEMS MARKET, BY TECHNOLOGY, 2024–2029 (USD MILLION)
  • TABLE 96 AUTOMOTIVE & TRANSPORTATION: CYBER-PHYSICAL SYSTEMS MARKET FOR INDUSTRIAL MANAGEMENT, BY TECHNOLOGY TYPE, 2020–2023 (USD MILLION)
  • TABLE 97 AUTOMOTIVE & TRANSPORTATION: CYBER-PHYSICAL SYSTEMS MARKET FOR INDUSTRIAL MANAGEMENT, BY TECHNOLOGY TYPE, 2024–2029 (USD MILLION)
  • TABLE 98 AUTOMOTIVE & TRANSPORTATION: CYBER-PHYSICAL SYSTEMS MARKET FOR SMART OPERATIONS, BY TECHNOLOGY TYPE, 2020–2023 (USD MILLION)
  • TABLE 99 AUTOMOTIVE & TRANSPORTATION: CYBER-PHYSICAL SYSTEMS MARKET FOR SMART OPERATIONS, BY TECHNOLOGY TYPE, 2024–2029 (USD MILLION)
  • TABLE 100 AEROSPACE: CYBER-PHYSICAL SYSTEMS MARKET, BY TECHNOLOGY, 2020–2023 (USD MILLION)
  • TABLE 101 AEROSPACE: CYBER-PHYSICAL SYSTEMS MARKET, BY TECHNOLOGY, 2024–2029 (USD MILLION)
  • TABLE 102 AEROSPACE: CYBER-PHYSICAL SYSTEMS MARKET FOR INDUSTRIAL MANAGEMENT, BY TECHNOLOGY TYPE, 2020–2023 (USD MILLION)
  • TABLE 103 AEROSPACE: CYBER-PHYSICAL SYSTEMS MARKET FOR INDUSTRIAL MANAGEMENT, BY TECHNOLOGY TYPE, 2024–2029 (USD MILLION)
  • TABLE 104 AEROSPACE: CYBER-PHYSICAL SYSTEMS MARKET FOR SMART OPERATIONS, BY TECHNOLOGY TYPE, 2020–2023 (USD MILLION)
  • TABLE 105 AEROSPACE: CYBER-PHYSICAL SYSTEMS MARKET FOR SMART OPERATIONS, BY TECHNOLOGY TYPE, 2024–2029 (USD MILLION)
  • TABLE 106 ENERGY: CYBER-PHYSICAL SYSTEMS MARKET, BY TECHNOLOGY, 2020–2023 (USD MILLION)
  • TABLE 107 ENERGY: CYBER-PHYSICAL SYSTEMS MARKET, BY TECHNOLOGY, 2024–2029 (USD MILLION)
  • TABLE 108 ENERGY: CYBER-PHYSICAL SYSTEMS MARKET FOR INDUSTRIAL MANAGEMENT, BY TECHNOLOGY TYPE, 2020–2023 (USD MILLION)
  • TABLE 109 ENERGY: CYBER-PHYSICAL SYSTEMS MARKET FOR INDUSTRIAL MANAGEMENT, BY TECHNOLOGY TYPE, 2024–2029 (USD MILLION)
  • TABLE 110 ENERGY: CYBER-PHYSICAL SYSTEMS MARKET FOR SMART OPERATIONS, BY TECHNOLOGY TYPE, 2020–2023 (USD MILLION)
  • TABLE 111 ENERGY: CYBER-PHYSICAL SYSTEMS MARKET FOR SMART OPERATIONS, BY TECHNOLOGY TYPE, 2024–2029 (USD MILLION)
  • TABLE 112 INFRASTRUCTURE: CYBER-PHYSICAL SYSTEMS MARKET, BY TECHNOLOGY, 2020–2023 (USD MILLION)
  • TABLE 113 INFRASTRUCTURE: CYBER-PHYSICAL SYSTEMS MARKET, BY TECHNOLOGY, 2024–2029 (USD MILLION)
  • TABLE 114 INFRASTRUCTURE: CYBER-PHYSICAL SYSTEMS MARKET FOR INDUSTRIAL MANAGEMENT, BY TECHNOLOGY TYPE, 2020–2023 (USD MILLION)
  • TABLE 115 INFRASTRUCTURE: CYBER-PHYSICAL SYSTEMS MARKET FOR INDUSTRIAL MANAGEMENT, BY TECHNOLOGY TYPE, 2024–2029 (USD MILLION)
  • TABLE 116 INFRASTRUCTURE: CYBER-PHYSICAL SYSTEMS MARKET FOR SMART OPERATIONS, BY TECHNOLOGY TYPE, 2020–2023 (USD MILLION)
  • TABLE 117 INFRASTRUCTURE: CYBER-PHYSICAL SYSTEMS MARKET FOR SMART OPERATIONS, BY TECHNOLOGY TYPE, 2024–2029 (USD MILLION)
  • TABLE 118 OIL & GAS: CYBER-PHYSICAL SYSTEMS MARKET, BY TECHNOLOGY, 2020–2023 (USD MILLION)
  • TABLE 119 OIL & GAS: CYBER-PHYSICAL SYSTEMS MARKET, BY TECHNOLOGY, 2024–2029 (USD MILLION)
  • TABLE 120 OIL & GAS: CYBER-PHYSICAL SYSTEMS MARKET FOR INDUSTRIAL MANAGEMENT, BY TECHNOLOGY TYPE, 2020–2023 (USD MILLION)
  • TABLE 121 OIL & GAS: CYBER-PHYSICAL SYSTEMS MARKET FOR INDUSTRIAL MANAGEMENT, BY TECHNOLOGY TYPE, 2024–2029 (USD MILLION)
  • TABLE 122 CYBER-PHYSICAL SYSTEMS MARKET, BY REGION, 2020–2023 (USD MILLION)
  • TABLE 123 CYBER-PHYSICAL SYSTEMS MARKET, BY REGION, 2024–2029 (USD MILLION)
  • TABLE 124 NORTH AMERICA: CYBER-PHYSICAL SYSTEMS MARKET, BY COUNTRY, 2020–2023 (USD MILLION)
  • TABLE 125 NORTH AMERICA: CYBER-PHYSICAL SYSTEMS MARKET, BY COUNTRY, 2024–2029 (USD MILLION)
  • TABLE 126 NORTH AMERICA: CYBER-PHYSICAL SYSTEMS MARKET, BY TECHNOLOGY, 2020–2023 (USD MILLION)
  • TABLE 127 NORTH AMERICA: CYBER-PHYSICAL SYSTEMS MARKET, BY TECHNOLOGY, 2024–2029 (USD MILLION)
  • TABLE 128 NORTH AMERICA: CYBER-PHYSICAL SYSTEMS MARKET FOR INDUSTRIAL MANAGEMENT, BY TECHNOLOGY TYPE, 2020–2023 (USD MILLION)
  • TABLE 129 NORTH AMERICA: CYBER-PHYSICAL SYSTEMS MARKET FOR INDUSTRIAL MANAGEMENT, BY TECHNOLOGY TYPE, 2024–2029 (USD MILLION)
  • TABLE 130 NORTH AMERICA: CYBER-PHYSICAL SYSTEMS MARKET FOR SMART OPERATIONS, BY TECHNOLOGY TYPE, 2020–2023 (USD MILLION)
  • TABLE 131 NORTH AMERICA: CYBER-PHYSICAL SYSTEMS MARKET FOR SMART OPERATIONS, BY TECHNOLOGY TYPE, 2024–2029 (USD MILLION)
  • TABLE 132 EUROPE: CYBER-PHYSICAL SYSTEMS MARKET, BY COUNTRY, 2020–2023 (USD MILLION)
  • TABLE 133 EUROPE: CYBER-PHYSICAL SYSTEMS MARKET, BY COUNTRY, 2024–2029 (USD MILLION)
  • TABLE 134 EUROPE: CYBER-PHYSICAL SYSTEMS MARKET, BY TECHNOLOGY, 2020–2023 (USD MILLION)
  • TABLE 135 EUROPE: CYBER-PHYSICAL SYSTEMS MARKET, BY TECHNOLOGY, 2024–2029 (USD MILLION)
  • TABLE 136 EUROPE: CYBER-PHYSICAL SYSTEMS MARKET FOR INDUSTRIAL MANAGEMENT, BY TECHNOLOGY TYPE, 2020–2023 (USD MILLION)
  • TABLE 137 EUROPE: CYBER-PHYSICAL SYSTEMS MARKET FOR INDUSTRIAL MANAGEMENT, BY TECHNOLOGY TYPE, 2024–2029 (USD MILLION)
  • TABLE 138 EUROPE: CYBER-PHYSICAL SYSTEMS MARKET FOR SMART OPERATIONS, BY TECHNOLOGY TYPE, 2020–2023 (USD MILLION)
  • TABLE 139 EUROPE: CYBER-PHYSICAL SYSTEMS MARKET FOR SMART OPERATIONS, BY TECHNOLOGY TYPE, 2024–2029 (USD MILLION)
  • TABLE 140 ASIA PACIFIC: CYBER-PHYSICAL SYSTEMS MARKET, BY COUNTRY, 2020–2023 (USD MILLION)
  • TABLE 141 ASIA PACIFIC: CYBER-PHYSICAL SYSTEMS MARKET, BY COUNTRY, 2024–2029 (USD MILLION)
  • TABLE 142 ASIA PACIFIC: CYBER-PHYSICAL SYSTEMS MARKET, BY TECHNOLOGY, 2020–2023 (USD MILLION)
  • TABLE 143 ASIA PACIFIC: CYBER-PHYSICAL SYSTEMS MARKET, BY TECHNOLOGY, 2024–2029 (USD MILLION)
  • TABLE 144 ASIA PACIFIC: CYBER-PHYSICAL SYSTEMS MARKET FOR INDUSTRIAL MANAGEMENT, BY TECHNOLOGY TYPE, 2020–2023 (USD MILLION)
  • TABLE 145 ASIA PACIFIC: CYBER-PHYSICAL SYSTEMS MARKET FOR INDUSTRIAL MANAGEMENT, BY TECHNOLOGY TYPE, 2024–2029 (USD MILLION)
  • TABLE 146 ASIA PACIFIC: CYBER-PHYSICAL SYSTEMS MARKET FOR SMART OPERATIONS, BY TECHNOLOGY TYPE, 2020–2023 (USD MILLION)
  • TABLE 147 ASIA PACIFIC: CYBER-PHYSICAL SYSTEMS MARKET FOR SMART OPERATIONS, BY TECHNOLOGY TYPE, 2024–2029 (USD MILLION)
  • TABLE 148 ROW: CYBER-PHYSICAL SYSTEMS MARKET, BY REGION, 2020–2023 (USD MILLION)
  • TABLE 149 ROW: CYBER-PHYSICAL SYSTEMS MARKET, BY REGION, 2024–2029 (USD MILLION)
  • TABLE 150 ROW: CYBER-PHYSICAL SYSTEMS MARKET, BY TECHNOLOGY, 2020–2023 (USD MILLION)
  • TABLE 151 ROW: CYBER-PHYSICAL SYSTEMS MARKET, BY TECHNOLOGY, 2024–2029 (USD MILLION)
  • TABLE 152 ROW: CYBER-PHYSICAL SYSTEMS MARKET FOR INDUSTRIAL MANAGEMENT, BY TECHNOLOGY TYPE, 2020–2023 (USD MILLION)
  • TABLE 153 ROW: CYBER-PHYSICAL SYSTEMS MARKET FOR INDUSTRIAL MANAGEMENT, BY TECHNOLOGY TYPE, 2024–2029 (USD MILLION)
  • TABLE 154 ROW: CYBER-PHYSICAL SYSTEMS MARKET FOR SMART OPERATIONS, BY TECHNOLOGY TYPE, 2020–2023 (USD MILLION)
  • TABLE 155 ROW: CYBER-PHYSICAL SYSTEMS MARKET FOR SMART OPERATIONS, BY TECHNOLOGY TYPE, 2024–2029 (USD MILLION)
  • TABLE 156 MIDDLE EAST: CYBER-PHYSICAL SYSTEMS MARKET, BY COUNTRY, 2020–2023 (USD MILLION)
  • TABLE 157 MIDDLE EAST: CYBER-PHYSICAL SYSTEMS MARKET, BY COUNTRY, 2024–2029 (USD MILLION)
  • TABLE 158 CYBER-PHYSICAL SYSTEMS MARKET: OVERVIEW OF STRATEGIES ADOPTED BY KEY PLAYERS, 2020–2024
  • TABLE 159 CYBER-PHYSICAL SYSTEMS MARKET: DEGREE OF COMPETITION, 2023
  • TABLE 160 CYBER-PHYSICAL SYSTEMS MARKET: TECHNOLOGY FOOTPRINT
  • TABLE 161 CYBER-PHYSICAL SYSTEMS MARKET: VERTICAL FOOTPRINT
  • TABLE 162 CYBER-PHYSICAL SYSTEMS MARKET: REGION FOOTPRINT
  • TABLE 163 CYBER-PHYSICAL SYSTEMS MARKET: DETAILED LIST OF KEY STARTUPS/SMES
  • TABLE 164 CYBER-PHYSICAL SYSTEMS MARKET: COMPETITIVE BENCHMARKING OF KEY STARTUPS/SMES
  • TABLE 165 CYBER-PHYSICAL SYSTEMS MARKET: PRODUCT LAUNCHES, JANUARY 2020–AUGUST 2024
  • TABLE 166 CYBER-PHYSICAL SYSTEMS MARKET: DEALS, JANUARY 2020–AUGUST 2024
  • TABLE 167 CYBER-PHYSICAL SYSTEMS MARKET: EXPANSIONS, JANUARY 2020–AUGUST 2024
  • TABLE 168 CYBER-PHYSICAL SYSTEMS MARKET: OTHERS, JANUARY 2020–AUGUST 2024
  • TABLE 169 ABB: COMPANY OVERVIEW
  • TABLE 170 ABB: PRODUCTS/SOLUTIONS/SERVICES OFFERED
  • TABLE 171 ABB: PRODUCT LAUNCHES
  • TABLE 172 ABB: DEALS
  • TABLE 173 ABB: EXPANSIONS
  • TABLE 174 HONEYWELL INTERNATIONAL INC.: COMPANY OVERVIEW
  • TABLE 175 HONEYWELL INTERNATIONAL INC.: PRODUCTS/SOLUTIONS/SERVICES OFFERED
  • TABLE 176 HONEYWELL INTERNATIONAL INC.: PRODUCT LAUNCHES
  • TABLE 177 HONEYWELL INTERNATIONAL INC.: DEALS
  • TABLE 178 HITACHI, LTD.: COMPANY OVERVIEW
  • TABLE 179 HITACHI, LTD.: PRODUCTS/SOLUTIONS/SERVICES OFFERED
  • TABLE 180 HITACHI, LTD.: DEALS
  • TABLE 181 SCHNEIDER ELECTRIC: COMPANY OVERVIEW
  • TABLE 182 SCHNEIDER ELECTRIC: PRODUCTS/SOLUTIONS/SERVICES OFFERED
  • TABLE 183 SCHNEIDER ELECTRIC: PRODUCT LAUNCHES
  • TABLE 184 SCHNEIDER ELECTRIC: DEALS
  • TABLE 185 SIEMENS: COMPANY OVERVIEW
  • TABLE 186 SIEMENS: PRODUCTS/SOLUTIONS/SERVICES OFFERED
  • TABLE 187 SIEMENS: PRODUCT LAUNCHES
  • TABLE 188 SIEMENS: DEALS
  • TABLE 189 SIEMENS: OTHERS
  • TABLE 190 ROCKWELL AUTOMATION: COMPANY OVERVIEW
  • TABLE 191 ROCKWELL AUTOMATION: PRODUCTS/SOLUTIONS/SERVICES OFFERED
  • TABLE 192 ROCKWELL AUTOMATION: DEALS
  • TABLE 193 CONTINENTAL AG: COMPANY OVERVIEW
  • TABLE 194 CONTINENTAL AG: PRODUCTS/SOLUTIONS/SERVICES OFFERED
  • TABLE 195 CONTINENTAL AG: PRODUCT LAUNCHES
  • TABLE 196 CONTINENTAL AG: DEALS
  • TABLE 197 GENERAL ELECTRIC COMPANY: COMPANY OVERVIEW
  • TABLE 198 GENERAL ELECTRIC COMPANY: PRODUCTS/SOLUTIONS/SERVICES OFFERED
  • TABLE 199 GENERAL ELECTRIC COMPANY: PRODUCT LAUNCHES
  • TABLE 200 TOSHIBA CORPORATION: COMPANY OVERVIEW
  • TABLE 201 TOSHIBA CORPORATION: PRODUCTS/SOLUTIONS/SERVICES OFFERED
  • TABLE 202 TOSHIBA CORPORATION: PRODUCT LAUNCHES
  • TABLE 203 ROBERT BOSCH GMBH: COMPANY OVERVIEW
  • TABLE 204 ROBERT BOSCH GMBH: PRODUCTS/SOLUTIONS/SERVICES OFFERED
  • TABLE 205 ROBERT BOSCH GMBH: PRODUCT LAUNCHES
  • TABLE 206 ROBERT BOSCH GMBH: DEALS
  • TABLE 207 CISCO SYSTEMS, INC.: COMPANY OVERVIEW
  • TABLE 208 CISCO SYSTEMS, INC.: PRODUCTS/SOLUTIONS/SERVICES OFFERED
  • TABLE 209 CISCO SYSTEMS, INC.: PRODUCT LAUNCHES
  • TABLE 210 CISCO SYSTEMS, INC.: DEALS
  • FIGURE 1 CYBER-PHYSICAL SYSTEMS MARKET SEGMENTATION
LIST OF FIGURES
 
  • FIGURE 2 CYBER-PHYSICAL SYSTEMS MARKET: RESEARCH DESIGN
  • FIGURE 3 CYBER-PHYSICAL SYSTEMS MARKET SIZE ESTIMATION METHODOLOGY
  • FIGURE 4 CYBER-PHYSICAL SYSTEMS MARKET: BOTTOM-UP APPROACH
  • FIGURE 5 CYBER-PHYSICAL SYSTEMS MARKET: TOP-DOWN APPROACH
  • FIGURE 6 CYBER-PHYSICAL SYSTEMS MARKET SIZE ESTIMATION METHODOLOGY (SUPPLY SIDE)
  • FIGURE 7 CYBER-PHYSICAL SYSTEMS MARKET: DATA TRIANGULATION
  • FIGURE 8 CYBER-PHYSICAL SYSTEMS MARKET: RESEARCH ASSUMPTIONS
  • FIGURE 9 CYBER-PHYSICAL SYSTEMS MARKET: RESEARCH LIMITATIONS
  • FIGURE 10 INDUSTRIAL MANAGEMENT SEGMENT TO WITNESS HIGHEST CAGR DURING FORECAST PERIOD
  • FIGURE 11 CLOSED-LOOP SEGMENT TO WITNESS HIGHER CAGR DURING FORECAST PERIOD
  • FIGURE 12 INDUSTRIAL CONTROL SYSTEMS SEGMENT TO CAPTURE LARGEST SHARE OF MARKET FOR INDUSTRIAL MANAGEMENT IN 2029
  • FIGURE 13 SMART GRIDS SEGMENT TO HOLD LARGEST SHARE OF MARKET FOR SMART OPERATIONS IN 2029
  • FIGURE 14 ENERGY SEGMENT TO DOMINATE CYBER-PHYSICAL SYSTEMS MARKET FROM 2024 TO 2029
  • FIGURE 15 ASIA PACIFIC TO REGISTER HIGHEST CAGR FROM 2024 TO 2029
  • FIGURE 16 RAPID MODERNIZATION OF POWER GRIDS TO CONTRIBUTE TO MARKET GROWTH
  • FIGURE 17 SMART GRIDS SEGMENT AND US TO HOLD LARGEST SHARES OF CYBER-PHYSICAL SYSTEMS MARKET, BY TECHNOLOGY, IN 2024
  • FIGURE 18 SMART GRIDS SEGMENT TO HOLD LARGEST MARKET SHARE IN 2029
  • FIGURE 19 INDIA TO EXHIBIT HIGHEST CAGR IN GLOBAL CYBER-PHYSICAL SYSTEMS MARKET DURING FORECAST PERIOD
  • FIGURE 20 DRIVERS, RESTRAINTS, OPPORTUNITIES, AND CHALLENGES
  • FIGURE 21 IMPACT ANALYSIS: DRIVERS
  • FIGURE 22 IMPACT ANALYSIS: RESTRAINTS
  • FIGURE 23 IMPACT ANALYSIS: OPPORTUNITIES
  • FIGURE 24 IMPACT ANALYSIS: CHALLENGES
  • FIGURE 25 VALUE CHAIN ANALYSIS
  • FIGURE 26 CYBER-PHYSICAL SYSTEMS ECOSYSTEM
  • FIGURE 27 INVESTMENT AND FUNDING SCENARIO
  • FIGURE 28 TRENDS/DISRUPTIONS INFLUENCING CUSTOMER BUSINESS
  • FIGURE 29 AVERAGE SELLING PRICE TREND OF DIGITAL TWIN, BY KEY PLAYER
  • FIGURE 30 AVERAGE SELLING PRICE TREND OF DIGITAL TWIN, 2020–2024
  • FIGURE 31 AVERAGE SELLING PRICE TREND OF DIGITAL TWIN, BY REGION, 2020–2024
  • FIGURE 32 IMPACT OF GEN AI/AI ON CYBER-PHYSICAL SYSTEMS MARKET
  • FIGURE 33 PORTER'S FIVE FORCES ANALYSIS
  • FIGURE 34 INFLUENCE OF KEY STAKEHOLDERS ON BUYING PROCESS FOR TOP THREE VERTICALS
  • FIGURE 35 KEY BUYING CRITERIA FOR TOP THREE VERTICALS
  • FIGURE 36 IMPORT DATA FOR HS CODE 847950-COMPLIANT PRODUCTS, BY COUNTRY, 2019–2023
  • FIGURE 37 EXPORT DATA FOR HS CODE 847950-COMPLIANT PRODUCTS, BY COUNTRY, 2019–2023
  • FIGURE 38 IMPORT DATA FOR HS CODE 902690-COMPLIANT PRODUCTS, BY COUNTRY, 2019–2023
  • FIGURE 39 EXPORT DATA FOR HS CODE 902690-COMPLIANT PRODUCTS, BY COUNTRY, 2019–2023
  • FIGURE 40 IMPORT DATA FOR HS CODE 903289-COMPLIANT PRODUCTS, BY COUNTRY, 2019–2023
  • FIGURE 41 EXPORT DATA FOR HS CODE 903289-COMPLIANT PRODUCTS, BY COUNTRY, 2019–2023
  • FIGURE 42 PATENTS APPLIED AND GRANTED, 2014–2023
  • FIGURE 43 FRAMEWORKS OF CYBER-PHYSICAL SYSTEMS
  • FIGURE 44 CYBER AND PHYSICAL SYSTEMS
  • FIGURE 45 CLOSE-LOOP SEGMENT TO DOMINATE CYBER-PHYSICAL SYSTEMS MARKET BETWEEN 2024 AND 2029
  • FIGURE 46 INDUSTRIAL MANAGEMENT SEGMENT TO DOMINATE CYBER-PHYSICAL SYSTEMS MARKET DURING FORECAST PERIOD
  • FIGURE 47 ENERGY SEGMENT TO HOLD LARGEST SHARE OF CYBER-PHYSICAL SYSTEMS MARKET IN 2029
  • FIGURE 48 ASIA PACIFIC TO REGISTER HIGHEST CAGR DURING FORECAST PERIOD
  • FIGURE 49 NORTH AMERICA: CYBER-PHYSICAL SYSTEMS MARKET SNAPSHOT
  • FIGURE 50 EUROPE: CYBER-PHYSICAL SYSTEMS MARKET SNAPSHOT
  • FIGURE 51 ASIA PACIFIC: CYBER-PHYSICAL SYSTEMS MARKET SNAPSHOT
  • FIGURE 52 MARKET SHARE ANALYSIS OF COMPANIES OFFERING CYBER-PHYSICAL SYSTEMS, 2023
  • FIGURE 53 CYBER-PHYSICAL SYSTEMS MARKET: REVENUE ANALYSIS OF FIVE KEY PLAYERS, 2019–2023
  • FIGURE 54 COMPANY VALUATION, 2024
  • FIGURE 55 FINANCIAL METRICS, 2024 (EV/EBITDA)
  • FIGURE 56 BRAND/PRODUCT COMPARISON
  • FIGURE 57 CYBER-PHYSICAL SYSTEMS MARKET: COMPANY EVALUATION MATRIX (KEY PLAYERS), 2023
  • FIGURE 58 CYBER-PHYSICAL SYSTEMS MARKET: COMPANY FOOTPRINT
  • FIGURE 59 CYBER-PHYSICAL SYSTEMS MARKET: COMPANY EVALUATION MATRIX (STARTUPS/SMES), 2023
  • FIGURE 60 ABB: COMPANY SNAPSHOT
  • FIGURE 61 HONEYWELL INTERNATIONAL INC.: COMPANY SNAPSHOT
  • FIGURE 62 HITACHI, LTD.: COMPANY SNAPSHOT
  • FIGURE 63 SCHNEIDER ELECTRIC: COMPANY SNAPSHOT
  • FIGURE 64 SIEMENS: COMPANY SNAPSHOT
  • FIGURE 65 ROCKWELL AUTOMATION: COMPANY SNAPSHOT
  • FIGURE 66 CONTINENTAL AG: COMPANY SNAPSHOT
  • FIGURE 67 GENERAL ELECTRIC COMPANY: COMPANY SNAPSHOT
  • FIGURE 68 TOSHIBA CORPORATION: COMPANY SNAPSHOT
  • FIGURE 69 ROBERT BOSCH GMBH: COMPANY SNAPSHOT
  • FIGURE 70 CISCO SYSTEMS, INC.: COMPANY SNAPSHOT

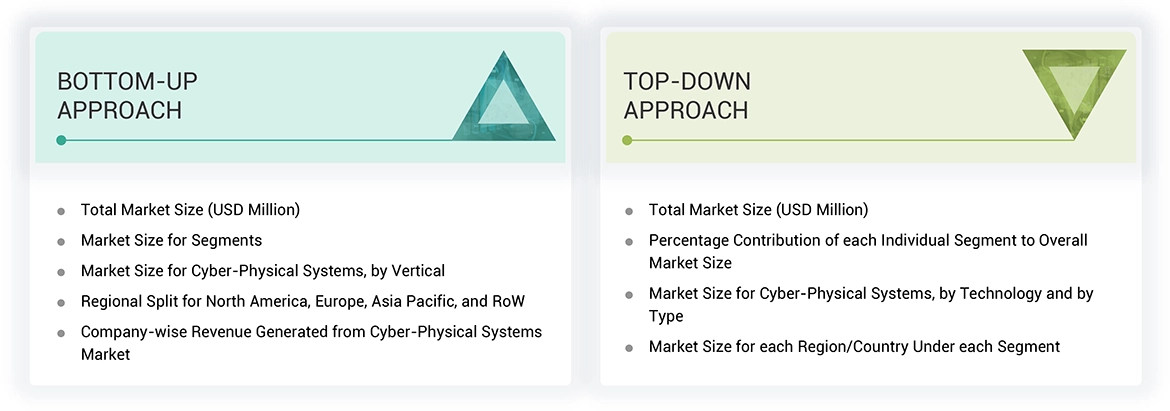
The study involved four major activities in estimating the current size of the cyber-physical systems market—exhaustive secondary research collected information on the market, peer, and parent markets. The next step was to validate these findings, assumptions, and sizing with industry experts across the value chain through primary research. Both top-down and bottom-up approaches were employed to estimate the complete market size. After that, market breakdown and data triangulation were used to estimate the market size of segments and subsegments.

Secondary Research

Various secondary sources have been referred to in the secondary research process to identify and collect information important for this study. The secondary sources include annual reports, press releases, and investor presentations of companies; white papers; journals and certified publications; and articles from recognized authors, websites, directories, and databases. Secondary research has been conducted to obtain critical information about the industry’s supply chain, the market’s value chain, the total pool of key players, market segmentation according to the industry trends (to the bottom-most level), regional markets, and key developments from market- and technology-oriented perspectives. The secondary data has been collected and analyzed to determine the overall market size, further validated by primary research.

List of major secondary sources

Source

Web Link

International Society of Automation

https://www.isa.org/

International Federation of Robotics

https://ifr.org/

Cyber-Physical Systems Virtual Organization

https://cps-vo.org/node/1

The US National Science Foundation

https://www.nsf.gov/

International Electrotechnical Commission

https://www.iec.ch/homepage

Automation Association

https://automationassociation.com/

Primary Research

Extensive primary research was conducted after gaining knowledge about the current scenario of the cyber-physical systems market through secondary research. Several primary interviews were conducted with experts from the demand and supply sides across four major regions—North America, Europe, Asia Pacific, and RoW. This primary data was collected through questionnaires, emails, and telephonic interviews.

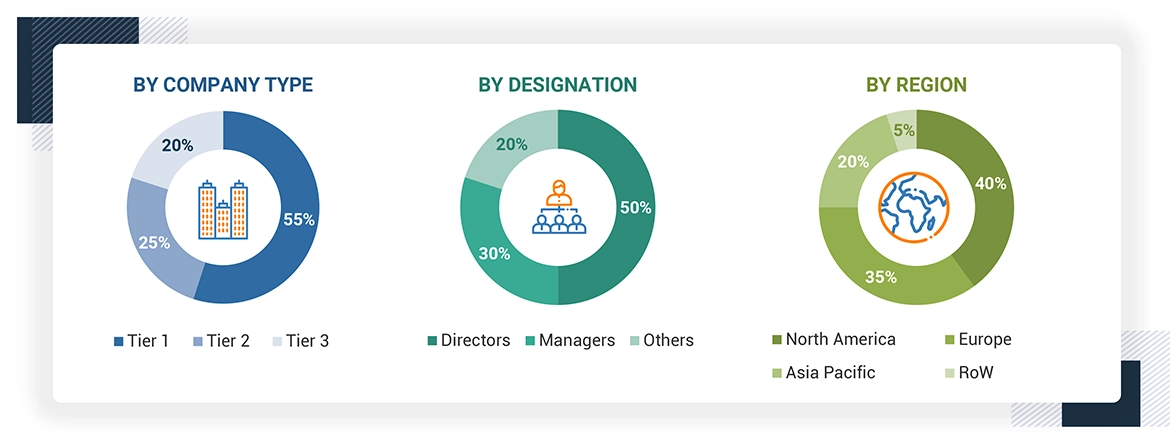
Note: Other designations include sales managers, marketing managers, and product managers.

The three tiers of the companies have been defined based on their total revenue as of 2023: tier 1: revenue greater than USD 1 billion, tier 2: revenue between USD 500 million and USD 1 billion, and tier 3: revenue less than USD 500 million.

About the assumptions considered for the study, To know download the pdf brochure

Market Size Estimation

In the complete market engineering process, top-down and bottom-up approaches and several data triangulation methods have been used to estimate and forecast the overall market segments and subsegments listed in this report. Key players in the market have been identified through secondary research, and their market shares in the respective regions have been determined through primary and secondary research. This entire procedure includes the study of annual and financial reports of the top market players and extensive interviews for key insights (quantitative and qualitative) with industry experts (CEOs, VPs, directors, and marketing executives).

All percentage shares, splits, and breakdowns have been determined using secondary sources and verified through primary sources. All the parameters affecting the markets covered in this research study have been accounted for, viewed in detail, verified through primary research, and analyzed to obtain the final quantitative and qualitative data. This data has been consolidated and supplemented with detailed inputs and analysis from MarketsandMarkets and presented in this report. The following figure represents this study’s overall market size estimation process.

Data Triangulation

After arriving at the overall market size from the above estimation process, the market has been split into several segments and subsegments. The data triangulation procedure has been employed wherever applicable to complete the overall market engineering process and arrive at the exact statistics for all segments and subsegments. The data has been triangulated by studying various factors and trends from both the demand and supply sides. Additionally, the market size has been validated using top-down and bottom-up approaches.

Market Definition

Cyber-Physical Systems (CPS) are advanced integrations of computational and physical processes that leverage real-time data from sensors and actuators. These systems facilitate interaction between the digital and physical worlds and enhances efficiency, safety, and decision-making capabilities across various applications such as manufacturing, healthcare, transportation, and agriculture. Cyber-physical systems represent engineered systems made from and integrating physical and computational components. The development within the area of CPS provide the capabilities for adaptability, scalability, resiliency, safety, security, and usability, with expanded horizons for these vital systems. Technologies for the CPS are also changing the way people shall interact with engineered systems in ways similar to how the Internet has revolutionized the way people interact with information.

Key Stakeholders

  • Hardware providers
  • Software providers
  • System integrators
  • Government bodies and policymakers
  • Associations, organizations, and alliances related to the cyber-physical systems ecosystem
  • Market research and consulting firms
  • Raw material suppliers and distributors
  • Research institutes and organizations
  • Original equipment manufacturers (OEMs)
  • Traders and suppliers
  • Venture capitalists and private equity firms
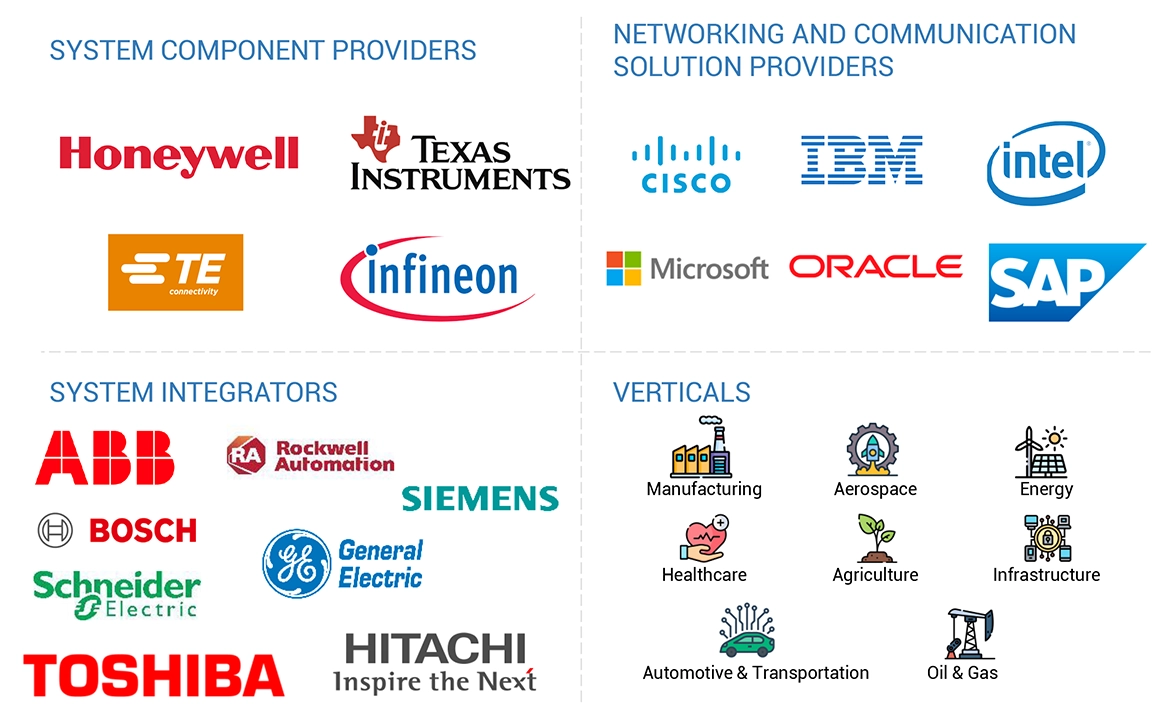
  • End users of cyber-physical systems across various verticals, such as manufacturing, healthcare, agriculture, automotive & transportation, aerospace, energy, and infrastructure (smart cities), among others

Report Objectives

  • To define and forecast the cyber-physical systems market based on technologies and verticals in terms of value for cyber-physical systems.
  • To describe and forecast the cyber-physical systems market based on four key regions, namely, North America, Europe, Asia Pacific, and the Rest of the World (RoW), along with their respective countries
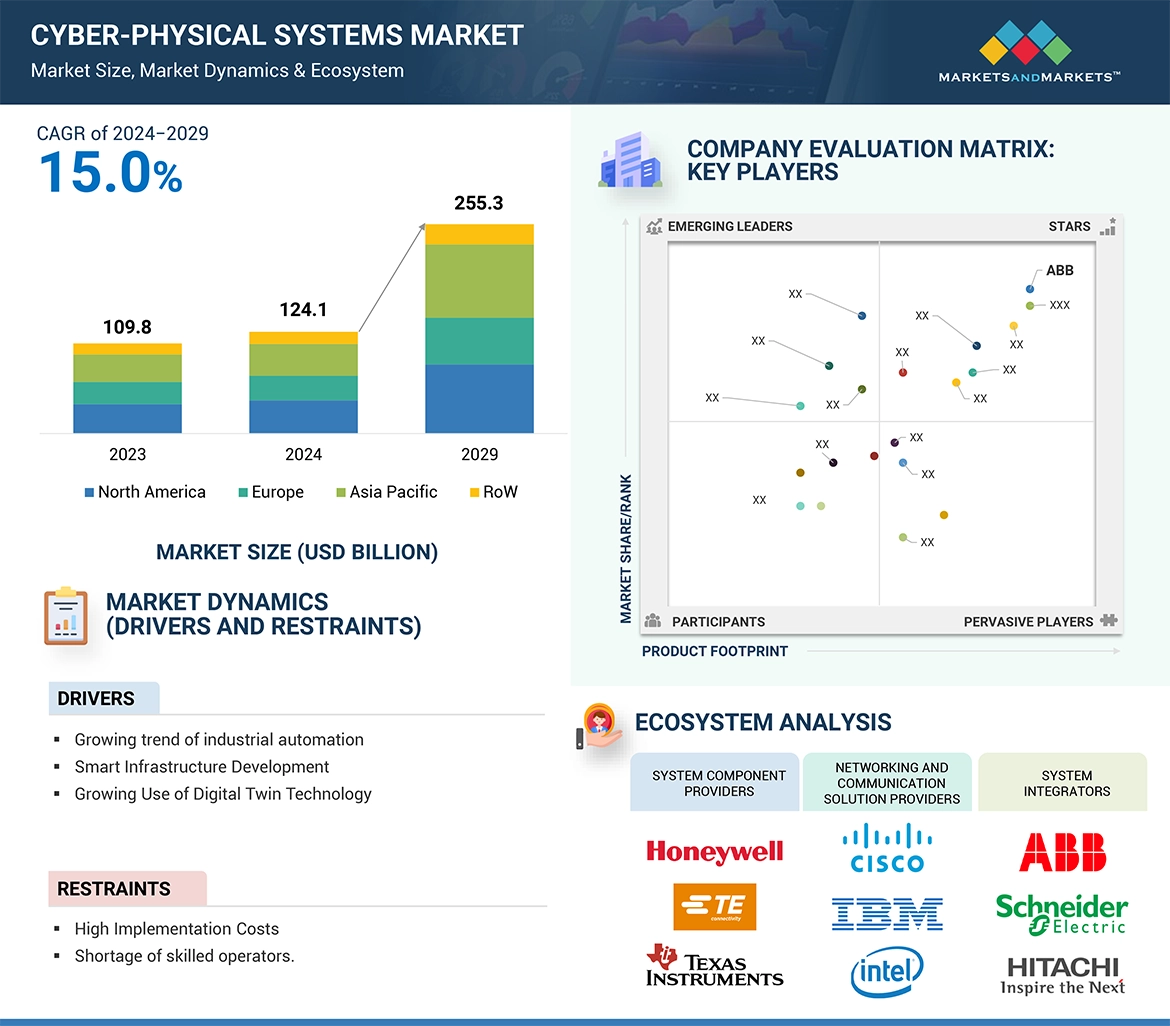
  • To provide detailed information regarding drivers, restraints, opportunities, and challenges influencing the growth of the market
  • To strategically analyze micromarkets with respect to individual growth trends, prospects, and contributions to the overall market size
  • To study the complete value chain of the cyber-physical systems market
  • To analyze opportunities in the market for stakeholders by identifying high-growth segments of the cyber-physical systemss ecosystem
  • To strategically profile the key players and comprehensively analyze their market positions in terms of their ranking and core competencies, and provide a detailed competitive landscape
  • To analyze competitive developments, such as product launches and developments, acquisitions, collaborations, agreements, and partnerships, in the cyber-physical systems market

Available Customizations

With the given market data, MarketsandMarkets offers customizations according to the specific requirements of companies. The following customization options are available for the report:

  • Detailed analysis and profiling of additional market players (up to 5)
  • Additional country-level analysis of the cyber-physical systems market

Product Analysis

  • Product matrix provides a detailed comparison of the product portfolio of each company in the cyber-physical systems market.

Previous Versions of this Report

Custom Market Research Services

We Will Customise The Research For You, In Case The Report Listed Above Dose Not Meet With Your Requirements

Get 10% Free Customisation

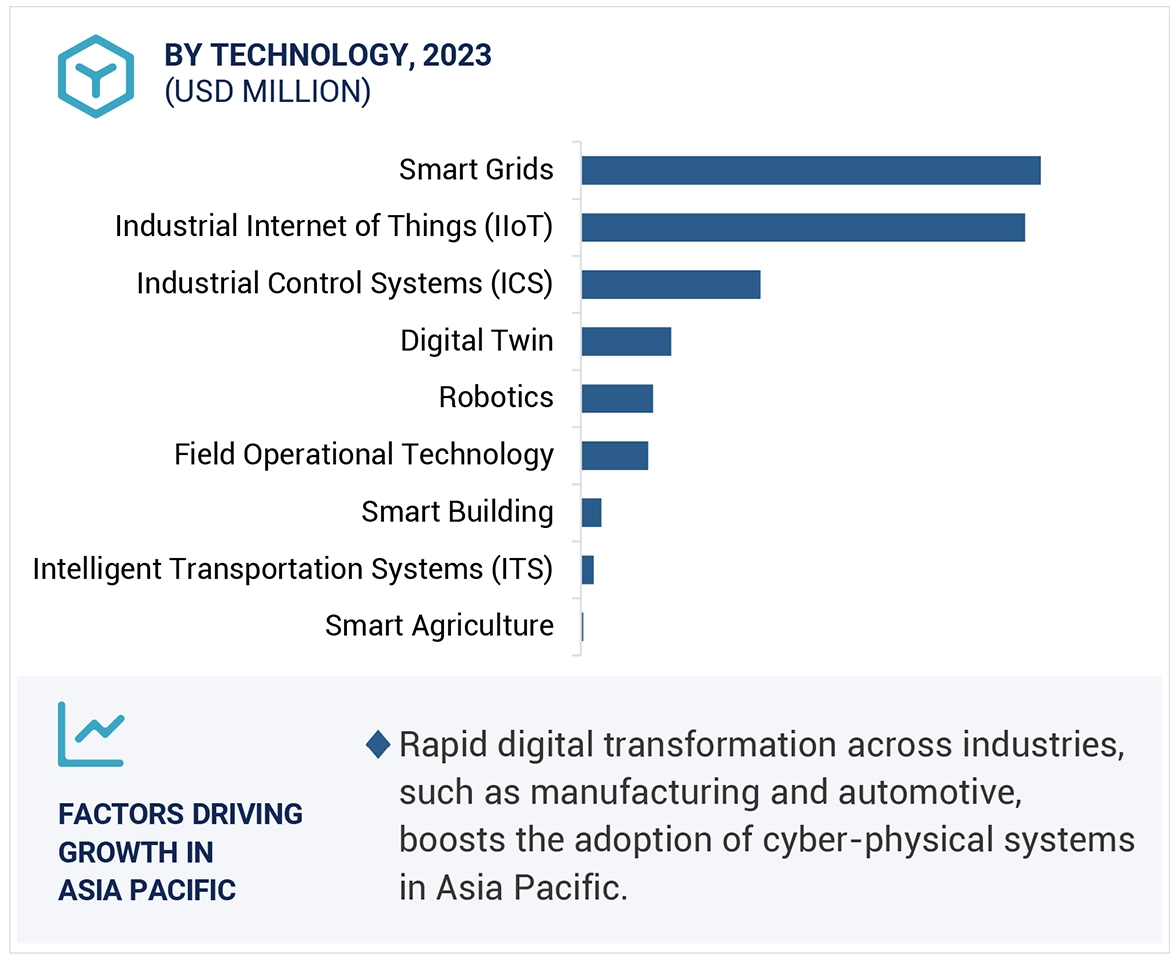
Growth opportunities and latent adjacency in Cyber-Physical Systems (CPS) Market

DMCA.com Protection Status