Cooling Tower Market by Type (Evaporative, Dry, Hybrid), Design (Natural, Mechanical), Construction Material (Concrete, Steel, FRP, Wood), Flow Type, Technology, Application (Power Generation, HVACR, Food & Beverage), & Region - Global Forecast to 2029
Cooling Tower Market
The global cooling tower market is valued at USD 3.0 billion in 2024 and is projected to reach USD 3.9 billion by 2029, growing at 5.3% cagr from 2024 to 2029. The cooling tower market is experiencing robust growth, driven by diverse applications across various sectors. This market includes several types of cooling towers such as evaporative, dry, and hybrid, each catering to specific needs and environmental conditions. The design segment encompasses mechanical draft, and natural draft, and offering solutions tailored to different operational requirements and efficiency levels. Key application segments include power generation, industrial manufacturing, HVACR, petrochemical, and food processing industries, each leveraging cooling tower technology to enhance operational efficiency and manage heat dissipation. The integration of advanced materials and innovative technologies continues to propel the market forward, addressing environmental regulations and the need for sustainable practices.
Attractive Opportunities in the Cooling Tower Market
Note: e-estimated p-projected.
Source: Expert Interviews, Secondary Sources, and MarketsandMarkets Analysis
To know about the assumptions considered for the study, Request for Free Sample Report
Cooling Tower Market Dynamics
Driver: Growing Interest from Developing Markets in the Asia-Pacific Region
The growing interest from developing markets in the Asia-Pacific region significantly boosts the cooling tower market. This surge is driven by the rapid pace of urbanization and industrial expansion in countries such as China, India, and Southeast Asian nations. These regions are investing heavily in infrastructure projects, including power plants, manufacturing facilities, and commercial complexes, all of which require efficient cooling solutions. Additionally, increased government initiatives to enhance energy efficiency and reduce carbon footprints are promoting the adoption of modern cooling tower technologies. The rising demand for electricity and cooling in residential and commercial buildings further contributes to the robust growth of the cooling tower market in the Asia-Pacific region.
Restraint: Moderate Expansion in Europe and North America
The cooling tower market in Europe and North America is experiencing moderate expansion due to several restraining factors. Mature markets in these regions are characterized by high saturation and slower industrial growth compared to emerging economies. Additionally, stringent environmental regulations and compliance costs pose challenges for market players, limiting new installations and expansions. The focus on upgrading and maintaining existing infrastructure over new construction also contributes to the restrained growth. Economic uncertainties and market volatility further impact investment decisions, leading to cautious spending on large-scale cooling tower projects. Consequently, while there is steady demand, the growth rate in Europe and North America remains moderate compared to more rapidly developing regions.
Opportunities: Increasing Demand from the Nuclear Power Generation Industry
The increasing demand from the nuclear power generation industry presents significant opportunities for the cooling tower market. As countries seek to diversify their energy mix and reduce carbon emissions, nuclear power is being recognized as a reliable and low-carbon energy source. The expansion of nuclear power plants necessitates efficient and robust cooling solutions to manage the substantial heat generated during power production. Cooling towers are essential components in maintaining the optimal operating temperatures of nuclear reactors, ensuring safety and efficiency. With the global emphasis on clean energy and the construction of new nuclear facilities, the cooling tower market stands to benefit from heightened demand for advanced cooling technologies tailored to the stringent requirements of the nuclear power sector. This trend is expected to drive innovation and investment in cooling tower solutions that can support the specific needs of nuclear power generation.
Challenges: High Water Consumption Requirements
High water consumption requirements pose a significant challenge for the cooling tower market. Cooling towers, particularly those used in large-scale industrial applications, often require substantial amounts of water to operate efficiently. This high demand for water can strain local water resources, especially in regions facing water scarcity or regulatory constraints on water usage. The need for large volumes of water not only impacts the operational costs for industries but also raises environmental concerns regarding water conservation and sustainable practices. Additionally, industries must navigate complex regulatory environments that govern water usage and discharge, adding to the operational complexities. Addressing this challenge necessitates the development of more water-efficient cooling technologies and systems that can reduce water consumption without compromising performance, thereby aligning with global sustainability goals and regulatory compliance.
Cooling Tower Market: Ecosystem
Prominent companies in this market include well-established, financially stable manufacturers of centrifuges. These companies have been operating in the market for several years and possess a diversified product portfolio and strong global sales and marketing networks. Prominent companies in this market include Baltimore Aircoil Company Inc. (US), John Cockerill (Belgium), SPX Technologies (US), Ebara Corporation (Japan), Evapco, Inc. (US), Krones AG (Germany), Babcock & Wilcox Enterprises Inc. (US), Seagull Cooling Tower Co., Ltd (Malaysia), Enexio (Germany), and Paharpur Cooling Tower Limited (India).
Based on type, hybrid is the third-largest segment in cooling tower market.
These towers integrate evaporative cooling principles with air-cooled heat exchange methods, offering versatility and improved energy efficiency compared to traditional cooling systems. By leveraging the advantages of both approaches, hybrid cooling towers provide an optimal solution for various industrial applications, balancing water conservation with effective heat dissipation, thereby driving their significant presence in the market. They are particularly favored in regions with fluctuating climatic conditions, as they can adapt to varying temperature and humidity levels. With advancements in design and technology, hybrid cooling towers continue to evolve, offering enhanced efficiency, reliability, and environmental sustainability.
Based on design, natural draft is the second-largest segment in cooling tower market.
Natural draft towers harness the natural forces of convection to draw air through the tower, utilizing the temperature differential between the warmer internal air and the cooler external atmosphere to facilitate efficient heat exchange. Their towering structures, often characterized by hyperbolic or chimney-like shapes, enable the creation of a strong draft, resulting in significant airflow and heat dissipation. Natural draft cooling towers are particularly favored for large-scale applications such as power plants and industrial facilities, where their inherent simplicity, reliability, and cost-effectiveness make them an attractive choice for efficient heat rejection.
Based on the application, HVACR is projected to grow at a faster rate during the forecasted period.
The HVACR sector is poised for rapid expansion during the projected period. This growth is fueled by escalating demand for energy-efficient and sustainable cooling solutions in both residential and commercial domains, alongside increasing awareness regarding indoor air quality and comfort. Advancements in technology, such as the integration of smart and connected HVACR systems, are propelling adoption rates higher. Additionally, stringent regulations aimed at reducing greenhouse gas emissions and promoting eco-friendly refrigerants further accelerate market expansion. Consequently, the segment is anticipated to witness robust development, catering to the evolving needs of modern buildings and infrastructure globally.
Asia Pacific is expected to be the largest market during the forecast period.
Asia Pacific emerges as the foremost hub for the global cooling towers market, showcasing unparalleled potential and growth opportunities. With a dynamic industrial landscape and rapid urbanization trends, countries like China, India, and Japan spearhead this regional dominance. China's ambitious infrastructure projects and robust manufacturing sector drive significant demand for cooling towers, particularly in power generation and heavy industries. India's expanding commercial and residential sectors, coupled with a growing emphasis on sustainability, elevate the market's prospects. Furthermore, Japan's technological prowess and focus on energy efficiency augment the adoption of advanced cooling solutions. The region's strategic position as a center for key industries, combined with evolving regulatory landscapes favoring eco-friendly cooling technologies, solidifies Asia Pacific's pivotal role in shaping the global cooling towers market's trajectory.
To know about the assumptions considered for the study, download the pdf brochure
Cooling Tower Market Players
The cooling tower market is dominated by a few major players that have a wide regional presence. The key players in the cooling tower market are as Baltimore Aircoil Company Inc. (US), John Cockerill (Belgium), SPX Technologies (US), Ebara Corporation (Japan), Evapco, Inc. (US), Krones AG (Germany), Babcock & Wilcox Enterprises Inc. (US), Seagull Cooling Tower Co., Ltd (Malaysia), Enexio (Germany), and Paharpur Cooling Tower Limited (India).
In the last few years, the companies have adopted growth strategies such as product launches, investments, acquisitions, and expansions to capture a larger share of the cooling tower market.
Cooling Tower Market Report Scope
This report categorizes the global cooling tower market base
Report Metric |
Details |
Years considered for the study |
2021-2029 |
Base Year |
2023 |
Forecast period |
2024–2029 |
Units considered |
Value (USD Million), Volume (Units) |
Segments |
Type, Design, Construction Material, Flow Type, Technology, Application, and Region |
Regions |
Asia Pacific, North America, Europe, Middle East & Africa, and South America |
Companies |
Baltimore Aircoil Company Inc. (US), John Cockerill (Belgium), SPX Technologies (US), Ebara Corporation (Japan), Evapco, Inc. (US), Krones AG (Germany), Babcock & Wilcox Enterprises Inc. (US), Seagull Cooling Tower Co., Ltd (Malaysia), Enexio (Germany), and Paharpur Cooling Tower Limited (India) |
This report categorizes the global cooling tower market based on type, design, construction material, flow type, technology, application, and region.
On the basis of type, the cooling tower market has been segmented as follows:
- Evaporative
- Dry
- Hybrid
On the basis of design, the cooling tower market has been segmented as follows:
- Mechanical Draft
- Natural Draft
On the basis of construction material, the cooling tower market has been segmented as follows:
- Concrete
- Fiber-Reinforced Plastic
- Wood
- Steel
On the basis of flow type, the cooling tower market has been segmented as follows:
- Counterflow
- Crossflow
On the basis of technology, the cooling tower market has been segmented as follows:
- Open Circuit
- Close Circuit
- Hybrid Circuit
On the basis of application, the cooling tower market has been segmented as follows:
- Power Generation
- HVACR
- Food & Beverage
- Chemical
- Petrochemical and Oil & Gas
- Others
On the basis of region, the cooling tower market has been segmented as follows:
- Asia Pacific
- Europe
- North America
- Middle East & Africa
- South America
Recent Developments
- In February 2022, Baltimore Aircoil Company Inc unveiled its newest advancement, the TrilliumSeries Adiabatic Cooler, catering to industries seeking optimal energy efficiency and water conservation. This state-of-the-art cooler boasts an innovative design that maximizes both water and energy utilization, resulting in substantial reductions in operational expenses. Additionally, engineered for effortless installation and maintenance, the TrilliumSeries Cooler ensures a seamless user experience, further enhancing its appeal to a wide range of applications.
- In June 2022, John Cockerill completed the acquisition of the cooling operations from the Hamon Group across Belgium, France, and Spain.
Frequently Asked Questions (FAQ):
What are the factors influencing the growth of the cooling tower market?
The growth of the cooling tower market is influenced by factors such as growing interest from developing markets in the Asia-Pacific region, heightened demand for cooling towers driven by stringent environmental regulations, increase in HVACR installations and expansion of industrial operations, and advancements redefining the cooling tower industry
Which are the key types driving the cooling tower market?
The key types driving the demand for cooling tower are evaporative and dry cooling towers.
Who are the major manufacturers?
Major manufacturers include Baltimore Aircoil Company Inc. (US), John Cockerill (Belgium), SPX Technologies (US), Ebara Corporation (Japan), Evapco, Inc. (US), Krones AG (Germany), Babcock & Wilcox Enterprises Inc. (US), Seagull Cooling Tower Co., Ltd (Malaysia), Enexio (Germany), and Paharpur Cooling Tower Limited (India)
What will be the growth prospects of the cooling tower market?
The cooling tower market is expected to witness robust growth due to rising demand from power generation, HVACR, chemical, and food & beverage applications.
What will be the growth prospects of the cooling tower market in terms of CAGR in next five years?
The CAGR of the market will be in between 5.3% in next five years. .
To speak to our analyst for a discussion on the above findings, click Speak to Analyst
Exclusive indicates content/data unique to MarketsandMarkets and not available with any competitors.
- 5.1 INTRODUCTION
-
5.2 MARKET DYNAMICSDRIVERS- Increased demand for cooling towers in developing economies of Asia Pacific- Implementation of stringent government-led environmental regulations- Rise in heating, ventilation, air conditioning, and refrigeration (HVAR) system installations and industrial operations- Advancements in cooling towersRESTRAINTS- Moderate demand for cooling towers in Europe and North AmericaOPPORTUNITIES- Increasing demand for cooling towers in nuclear industryCHALLENGES- High water consumption for cooling- Decline in system performance attributed to frequent corrosion
-
5.3 PORTER’S FIVE FORCES ANALYSISBARGAINING POWER OF SUPPLIERSBARGAINING POWER OF BUYERSTHREAT OF SUBSTITUTESTHREAT OF NEW ENTRANTSINTENSITY OF COMPETITIVE RIVALRY
-
5.4 KEY STAKEHOLDERS AND BUYING CRITERIAKEY STAKEHOLDERS IN BUYING PROCESSBUYING CRITERIA
-
5.5 MACROECONOMIC INDICATORSGLOBAL GDP TRENDS
- 5.6 VALUE CHAIN ANALYSIS
- 5.7 ECOSYSTEM ANALYSIS
-
5.8 CASE STUDY ANALYSISBALTIMORE AIRCOIL COMPANY, INC.’S “CS REPLACEMENT FILL 20211215” GUIDE HELPS CUSTOMERS REPLACE COOLING TOWER FILLS BY PROVIDING DETAILED INSTRUCTIONS AND RECOMMENDATIONSPAHARPUR COOLING TOWERS LTD. INSTALLS GREENPRO-CERTIFIED LOW-APPROACH COOLING TOWERS AT TAJ PALACE AND TAJ EXOTICA TO LOWER ENERGY CONSUMPTIONREALITEQ PROVIDES COMMUNICATION, INTEGRATION, AND OPERATING SCREENS FOR REMOTE MONITORING AND CONTROL SYSTEMS
-
5.9 REGULATORY LANDSCAPEREGULATORY BODIES, GOVERNMENT BODIES, AND OTHER ORGANIZATIONSREGULATIONS- Asia Pacific- Europe- North America
-
5.10 TECHNOLOGY ANALYSISKEY TECHNOLOGY- Modular cooling towerCOMPLEMENTARY TECHNOLOGY- HDPE cooling technologyADJACENT TECHNOLOGY- Renewable energy integration
- 5.11 TRENDS/DISRUPTIONS IMPACTING CUSTOMERS’ BUSINESSES
-
5.12 TRADE ANALYSISSTEEL- Import scenario (HS code 732690)- Export scenario (HS code 732690)POLYVINYL CHLORIDE (PVC)- Import scenario (HS code 390410)- Export scenario (HS code 390410)
- 5.13 KEY CONFERENCES AND EVENTS, 2024–2025
-
5.14 PRICING ANALYSISAVERAGE SELLING PRICE (ASP) TREND OF KEY PLAYERS, BY DESIGNAVERAGE SELLING PRICE (ASP) TREND OF KEY PLAYERS, BY TYPEAVERAGE SELLING PRICE (ASP) TREND OF KEY PLAYERS, BY APPLICATIONAVERAGE SELLING PRICE (ASP) TREND, BY REGION
- 5.15 INVESTMENT AND FUNDING SCENARIO
-
5.16 IMPACT OF GENERATIVE AI AND AI ON COOLING TOWER MARKETADOPTION OF GENERATIVE AI FOR THERMAL MANAGEMENT IN TOP COUNTRIESIMPACT OF AI ON COOLING TOWER MARKET
-
5.17 PATENT ANALYSISINTRODUCTIONMETHODOLOGYPATENT TYPEPUBLICATION TRENDSINSIGHTSJURISDICTION ANALYSISTOP 10 COMPANIES
- 6.1 INTRODUCTION
-
6.2 COUNTERFLOWREQUIREMENT FOR LESS SPACE DUE TO VERTICAL TOWER CONSTRUCTION TO DRIVE DEMAND- Key advantages of counterflow cooling towers
-
6.3 CROSSFLOWEASY CLEANING AND OPERATING FEATURES TO FUEL DEMAND
- 7.1 INTRODUCTION
-
7.2 OPEN CIRCUITGROWING USE IN CIVIL AND INDUSTRIAL APPLICATIONS TO DRIVE MARKET
-
7.3 CLOSE CIRCUITHIGH USE IN FOOD & BEVERAGES INDUSTRY TO FUEL MARKET GROWTH
-
7.4 HYBRID CIRCUITLOW ENERGY CONSUMPTION AND MAINTENANCE COSTS TO DRIVE DEMAND
- 8.1 INTRODUCTION
-
8.2 CONCRETERISING DEMAND IN POWER GENERATION, PETROCHEMICALS, AND CHEMICALS INDUSTRIES TO PROPEL MARKET
-
8.3 FIBER-REINFORCED PLASTIC (FRP)LIGHTWEIGHT, HIGH STRENGTH, FLEXIBILITY, AND CHEMICAL RESISTANCE PROPERTIES TO DRIVE DEMAND
-
8.4 WOODSIGNIFICANT USE TO CONSTRUCT MECHANICAL AND NATURAL DRAFT COOLING TOWERS TO DRIVE MARKET
-
8.5 STEELHIGH USE OF STEEL IN MANUFACTURING OF COOLING TOWERS TO DRIVE MARKET
- 9.1 INTRODUCTION
-
9.2 MECHANICAL DRAFTHIGHER EFFICIENCY THAN NATURAL DRAFT COOLING TOWERS TO DRIVE DEMAND
-
9.3 NATURAL DRAFTLOW MAINTENANCE COSTS AND POWER-SAVING FEATURES TO FUEL DEMAND
- 10.1 INTRODUCTION
-
10.2 EVAPORATIVERAPID INDUSTRIALIZATION AND RISING INSTALLATION OF DIRECT AND INDIRECT EVAPORATIVE COOLING SYSTEMS TO DRIVE MARKET
-
10.3 DRYHIGH DEMAND FOR DRY COOLING TOWERS IN HVACR AND FOOD & BEVERAGE INDUSTRIES TO FUEL MARKET GROWTH
-
10.4 HYBRIDGROWING NEED FOR HYBRID COOLING TOWERS IN POWER GENERATION APPLICATIONS TO PROPEL MARKET
- 11.1 INTRODUCTION
-
11.2 POWER GENERATIONHIGH ADOPTION OF COOLING TOWERS IN POWER INDUSTRY TO DRIVE MARKET- Thermal power plants- Nuclear power plants- Other power generation applications
-
11.3 HVACRGROWING DEPLOYMENT OF HVACR SYSTEMS IN COMMERCIAL BUILDINGS TO FUEL DEMAND- District cooling- Data centers- Other HVACR applications
-
11.4 FOOD & BEVERAGEINCREASING INSTALLATION OF COOLING TOWERS TO PREVENT OVERHEATING AND MAINTAIN HYGIENE TO DRIVE MARKET- Dairy- Distilleries/Breweries- Other food & beverage applications
-
11.5 CHEMICALRISING DEPLOYMENT OF COOLING TOWERS TO CONTROL EXCESS HEAT AND MAINTAIN DESIRED TEMPERATURE INSIDE PLANTS TO FUEL MARKET GROWTH- Fertilizer manufacturing- Pharmaceutical manufacturing- Other chemical applications
-
11.6 PETROCHEMICAL AND OIL & GASINCREASING REQUIREMENT FOR LARGE COOLING SYSTEMS TO DRIVE DEMAND
-
11.7 OTHERSPAPER & PULP MILLSMARINE INDUSTRYIRON FOUNDRIES
- 12.1 INTRODUCTION
-
12.2 ASIA PACIFICGROWTH OF ASIA PACIFIC MARKETCHINA- Shift in power generation source from coal to natural gas and nuclear energy to drive marketINDIA- Rising foreign investments and industrial growth to drive marketJAPAN- Promotion of cooling towers by Cooling Tower Institute to drive marketSOUTH KOREA- Rising investments in energy sources to propel marketAUSTRALIA- Increasing demand for cooling solutions from infrastructure development projects to fuel market growthREST OF ASIA PACIFIC
-
12.3 EUROPEGERMANY- Expanding petrochemicals and chemicals industries to drive marketITALY- Increasing demand in chemicals industry to propel marketFRANCE- Shift toward renewable energy production to boost market growthSPAIN- Increasing deployment in oil refineries to fuel market growthUK- Shift toward renewable power generation to drive demandRUSSIA- Expansion of oil refineries to drive marketREST OF EUROPE
-
12.4 NORTH AMERICAUS- Presence of large number of power plants and oil refineries to propel marketCANADA- Increasing demand for cooling towers in various industries to contribute to market growthMEXICO- Growing oil & gas industry to drive market
-
12.5 MIDDLE EAST & AFRICAGCC- Saudi Arabia- UAE- Rest of GCCSOUTH AFRICA- Notable increase in energy demand to create growth opportunities for market playersREST OF MIDDLE EAST & AFRICA
-
12.6 SOUTH AMERICABRAZIL- Rapid growth in electricity generation and oil & gas production to drive marketARGENTINA- Increasing electricity demand to propel marketREST OF SOUTH AMERICA
- 13.1 OVERVIEW
- 13.2 KEY PLAYER STRATEGIES/RIGHT TO WIN, 2019–2024
- 13.3 MARKET SHARE ANALYSIS, 2023
- 13.4 REVENUE ANALYSIS, 2021–2023
- 13.5 COMPANY VALUATION AND FINANCIAL METRICS
- 13.6 BRAND/PRODUCT COMPARISON
-
13.7 COMPANY EVALUATION MATRIX: KEY PLAYERS, 2023STARSEMERGING LEADERSPERVASIVE PLAYERSPARTICIPANTSCOMPANY FOOTPRINT: KEY PLAYERS, 2023- Company footprint- Region footprint- Flow type footprint- Technology footprint- Construction material footprint- Design footprint- Type footprint- Application footprint
-
13.8 COMPANY EVALUATION MATRIX: START-UPS/SMES, 2023PROGRESSIVE COMPANIESRESPONSIVE COMPANIESDYNAMIC COMPANIESSTARTING BLOCKSCOMPETITIVE BENCHMARKING: START-UPS/SMES, 2023- Detailed list of key start-ups/SMEs- Competitive benchmarking of key start-ups/SMEs
-
13.9 COMPETITIVE SCENARIOS AND TRENDSPRODUCT LAUNCHESDEALSEXPANSIONSOTHERS
-
14.1 KEY PLAYERSBALTIMORE AIRCOIL COMPANY, INC.- Business overview- Products offered- Recent developments- MnM viewSPX TECHNOLOGIES- Business overview- Products offered- Recent developments- MnM viewJOHN COCKERILL- Business overview- Products offered- Recent developments- MnM viewEBARA CORPORATION- Business overview- Products offered- Recent developments- MnM viewEVAPCO, INC.- Business overview- Products offered- Recent developments- MnM viewENEXIO MANAGEMENT GMBH- Business overview- Products offered- Recent developments- MnM viewBABCOCK & WILCOX ENTERPRISES, INC.- Business overview- Products offered- MnM viewKRONES AG- Business overview- Products offered- MnM viewSEAGULL COOLING TOWER CO., LTD.- Business overview- Products offered- MnM viewPAHARPUR COOLING TOWERS LTD.- Business overview- Products offered- MnM view
-
14.2 OTHER PLAYERSAMCOT COOLING TOWER CORPORATION.BELLCTDONGAHE INDUSTRIAL COMPANY LTD.BOLDROCCHI T.E. SRL.HENG AN (HACST)MARLEY FLOWMITA COOLING TECHNOLOGIES S.R.L.NIHON SPINDLE MANUFACTURING CO. LTD.PERFECT COOLING TOWERSSTAR COOLING TOWERS PVT. LTD.DELTA COOLING TOWERS, INC.NATIONAL COOLING TOWERSTOWER TECH COOLING SYSTEM PVT. LTDWATCO GROUPROBSON INDUSTRIES INC.
- 15.1 DISCUSSION GUIDE
- 15.2 KNOWLEDGESTORE: MARKETSANDMARKETS’ SUBSCRIPTION PORTAL
- 15.3 CUSTOMIZATION OPTIONS
- 15.4 RELATED REPORTS
- 15.5 AUTHOR DETAILS
- TABLE 1 COOLING TOWER MARKET: INCLUSIONS AND EXCLUSIONS
- TABLE 2 NUCLEAR ENERGY CONSUMPTION, BY REGION, 2018–2022 (EXAJOULES)
- TABLE 3 COOLING TOWER MARKET: PORTER’S FIVE FORCES ANALYSIS
- TABLE 4 INFLUENCE OF STAKEHOLDERS ON BUYING PROCESS, BY APPLICATION (%)
- TABLE 5 KEY BUYING CRITERIA, BY APPLICATION
- TABLE 6 PROJECTED REAL GDP GROWTH (ANNUAL PERCENT CHANGE) OF KEY COUNTRIES, 2021–2029
- TABLE 7 ROLES OF COMPANIES IN COOLING TOWER ECOSYSTEM
- TABLE 8 ASIA PACIFIC: REGULATORY BODIES, GOVERNMENT AGENCIES, AND OTHER ORGANIZATIONS
- TABLE 9 EUROPE: REGULATORY BODIES, GOVERNMENT AGENCIES, AND OTHER ORGANIZATIONS
- TABLE 10 NORTH AMERICA: REGULATORY BODIES, GOVERNMENT AGENCIES, AND OTHER ORGANIZATIONS
- TABLE 11 IMPORT DATA RELATED TO HS CODE 732690-COMPLIANT PRODUCTS FOR TOP COUNTRIES, 2019–2023 (USD THOUSAND)
- TABLE 12 EXPORT DATA RELATED TO HS CODE 732690-COMPLIANT PRODUCTS FOR TOP COUNTRIES, 2019–2023 (USD THOUSAND)
- TABLE 13 IMPORT DATA RELATED TO HS CODE 390410-COMPLIANT PRODUCTS FOR TOP COUNTRIES, 2019–2023 (USD THOUSAND)
- TABLE 14 EXPORT DATA RELATED TO HS CODE 390410-COMPLIANT PRODUCTS FOR TOP COUNTRIES, 2019–2023 (USD THOUSAND)
- TABLE 15 COOLING TOWER MARKET: KEY CONFERENCES AND EVENTS, 2024–2025
- TABLE 16 AVERAGE SELLING PRICE (ASP) TREND OF COOLING TOWERS OFFERED BY KEY PLAYERS, BY DESIGN (USD/UNIT)
- TABLE 17 AVERAGE SELLING PRICE (ASP) TREND OF COOLING TOWERS OFFERED BY KEY PLAYERS, BY TYPE (USD/UNIT)
- TABLE 18 AVERAGE SELLING PRICE (ASP) TREND OF COOLING TOWERS OFFERED BY KEY PLAYERS, BY APPLICATION (USD/UNIT)
- TABLE 19 PATENTS BY CNPC
- TABLE 20 PATENTS BY XI’AN THERMAL POWER RESEARCH INSTITUTE CO., LTD.
- TABLE 21 PATENTS BY SHANDONG LANXIANG ENVIRONMENTAL TECHNOLOGY CO., LTD.
- TABLE 22 TOP 10 PATENT OWNERS IN LAST 10 YEARS
- TABLE 23 COOLING TOWER MARKET, BY FLOW TYPE, 2021–2023 (USD MILLION)
- TABLE 24 COOLING TOWER MARKET, BY FLOW TYPE, 2024–2029 (USD MILLION)
- TABLE 25 COOLING TOWER MARKET, BY TECHNOLOGY, 2021–2023 (USD MILLION)
- TABLE 26 COOLING TOWER MARKET, BY TECHNOLOGY, 2024–2029 (USD MILLION)
- TABLE 27 COOLING TOWER MARKET, BY CONSTRUCTION MATERIAL, 2021–2023 (USD MILLION)
- TABLE 28 COOLING TOWER MARKET, BY CONSTRUCTION MATERIAL, 2024–2029 (USD MILLION)
- TABLE 29 COOLING TOWER MARKET, BY DESIGN, 2021–2023 (USD MILLION)
- TABLE 30 COOLING TOWER MARKET, BY DESIGN, 2024–2029 (USD MILLION)
- TABLE 31 COOLING TOWER MARKET, BY TYPE, 2021–2023 (USD MILLION)
- TABLE 32 COOLING TOWER MARKET, BY TYPE, 2024–2029 (USD MILLION)
- TABLE 33 COOLING TOWER MARKET, BY APPLICATION, 2021–2023 (USD MILLION)
- TABLE 34 COOLING TOWER MARKET, BY APPLICATION, 2024–2029 (USD MILLION)
- TABLE 35 COOLING TOWER MARKET, BY APPLICATION, 2021–2023 (UNITS)
- TABLE 36 COOLING TOWER MARKET, BY APPLICATION, 2024–2029 (UNITS)
- TABLE 37 COOLING TOWER MARKET, BY REGION, 2021–2023 (USD MILLION)
- TABLE 38 COOLING TOWER MARKET, BY REGION, 2024–2029 (USD MILLION)
- TABLE 39 COOLING TOWER MARKET, BY REGION, 2021–2023 (UNITS)
- TABLE 40 COOLING TOWER MARKET, BY REGION, 2024–2029 (UNITS)
- TABLE 41 ASIA PACIFIC: COOLING TOWER MARKET, BY COUNTRY, 2021–2023 (USD MILLION)
- TABLE 42 ASIA PACIFIC: COOLING TOWER MARKET, BY COUNTRY, 2024–2029 (USD MILLION)
- TABLE 43 ASIA PACIFIC: COOLING TOWER MARKET, BY COUNTRY, 2021–2023 (UNITS)
- TABLE 44 ASIA PACIFIC: COOLING TOWER MARKET, BY COUNTRY, 2024–2029 (UNITS)
- TABLE 45 ASIA PACIFIC: COOLING TOWER MARKET, BY FLOW TYPE, 2021–2023 (USD MILLION)
- TABLE 46 ASIA PACIFIC: COOLING TOWER MARKET, BY FLOW TYPE, 2024–2029 (USD MILLION)
- TABLE 47 ASIA PACIFIC: COOLING TOWER MARKET, BY TECHNOLOGY, 2021–2023 (USD MILLION)
- TABLE 48 ASIA PACIFIC: COOLING TOWER MARKET, BY TECHNOLOGY, 2024–2029 (USD MILLION)
- TABLE 49 ASIA PACIFIC: COOLING TOWER MARKET, BY DESIGN, 2021–2023 (USD MILLION)
- TABLE 50 ASIA PACIFIC: COOLING TOWER MARKET, BY DESIGN, 2024–2029 (USD MILLION)
- TABLE 51 ASIA PACIFIC: COOLING TOWER MARKET, BY TYPE, 2021–2023 (USD MILLION)
- TABLE 52 ASIA PACIFIC: COOLING TOWER MARKET, BY TYPE, 2024–2029 (USD MILLION)
- TABLE 53 ASIA PACIFIC: COOLING TOWER MARKET, BY APPLICATION, 2021–2023 (USD MILLION)
- TABLE 54 ASIA PACIFIC: COOLING TOWER MARKET, BY APPLICATION, 2024–2029 (USD MILLION)
- TABLE 55 ASIA PACIFIC: COOLING TOWER MARKET, BY APPLICATION, 2021–2023 (UNITS)
- TABLE 56 ASIA PACIFIC: COOLING TOWER MARKET, BY APPLICATION, 2024–2029 (UNITS)
- TABLE 57 CHINA: COOLING TOWER MARKET, BY APPLICATION, 2021–2023 (USD MILLION)
- TABLE 58 CHINA: COOLING TOWER MARKET, BY APPLICATION, 2024–2029 (USD MILLION)
- TABLE 59 CHINA: COOLING TOWER MARKET, BY APPLICATION, 2021–2023 (UNITS)
- TABLE 60 CHINA: COOLING TOWER MARKET, BY APPLICATION, 2024–2029 (UNITS)
- TABLE 61 INDIA: COOLING TOWER MARKET, BY APPLICATION, 2021–2023 (USD MILLION)
- TABLE 62 INDIA: COOLING TOWER MARKET, BY APPLICATION, 2024–2029 (USD MILLION)
- TABLE 63 INDIA: COOLING TOWER MARKET, BY APPLICATION, 2021–2023 (UNITS)
- TABLE 64 INDIA: COOLING TOWER MARKET, BY APPLICATION, 2024–2029 (UNITS)
- TABLE 65 JAPAN: COOLING TOWER MARKET, BY APPLICATION, 2021–2023 (USD MILLION)
- TABLE 66 JAPAN: COOLING TOWER MARKET, BY APPLICATION, 2024–2029 (USD MILLION)
- TABLE 67 JAPAN: COOLING TOWER MARKET, BY APPLICATION, 2021–2023 (UNITS)
- TABLE 68 JAPAN: COOLING TOWER MARKET, BY APPLICATION, 2024–2029 (UNITS)
- TABLE 69 SOUTH KOREA: COOLING TOWER MARKET, BY APPLICATION, 2021–2023 (USD MILLION)
- TABLE 70 SOUTH KOREA: COOLING TOWER MARKET, BY APPLICATION, 2024–2029 (USD MILLION)
- TABLE 71 SOUTH KOREA: COOLING TOWER MARKET, BY APPLICATION, 2021–2023 (UNITS)
- TABLE 72 SOUTH KOREA: COOLING TOWER MARKET, BY APPLICATION, 2024–2029 (UNITS)
- TABLE 73 AUSTRALIA: COOLING TOWER MARKET, BY APPLICATION, 2021–2023 (USD MILLION)
- TABLE 74 AUSTRALIA: COOLING TOWER MARKET, BY APPLICATION, 2024–2029 (USD MILLION)
- TABLE 75 AUSTRALIA: COOLING TOWER MARKET, BY APPLICATION, 2021–2023 (UNITS)
- TABLE 76 AUSTRALIA: COOLING TOWER MARKET, BY APPLICATION, 2024–2029 (UNITS)
- TABLE 77 REST OF ASIA PACIFIC: COOLING TOWER MARKET, BY APPLICATION, 2021–2023 (USD MILLION)
- TABLE 78 REST OF ASIA PACIFIC: COOLING TOWER MARKET, BY APPLICATION, 2024–2029 (USD MILLION)
- TABLE 79 REST OF ASIA PACIFIC: COOLING TOWER MARKET, BY APPLICATION, 2021–2023 (UNITS)
- TABLE 80 REST OF ASIA PACIFIC: COOLING TOWER MARKET, BY APPLICATION, 2024–2029 (UNITS)
- TABLE 81 EUROPE: COOLING TOWER MARKET, BY COUNTRY, 2021–2023 (USD MILLION)
- TABLE 82 EUROPE: COOLING TOWER MARKET, BY COUNTRY, 2024–2029 (USD MILLION)
- TABLE 83 EUROPE: COOLING TOWER MARKET, BY COUNTRY, 2021–2023 (UNITS)
- TABLE 84 EUROPE: COOLING TOWER MARKET, BY COUNTRY, 2024–2029 (UNITS)
- TABLE 85 EUROPE: COOLING TOWER MARKET, BY FLOW TYPE, 2021–2023 (USD MILLION)
- TABLE 86 EUROPE: COOLING TOWER MARKET, BY FLOW TYPE, 2024–2029 (USD MILLION)
- TABLE 87 EUROPE: COOLING TOWER MARKET, BY TECHNOLOGY, 2021–2023 (USD MILLION)
- TABLE 88 EUROPE: COOLING TOWER MARKET, BY TECHNOLOGY, 2024–2029 (USD MILLION)
- TABLE 89 EUROPE: COOLING TOWER MARKET, BY DESIGN, 2021–2023 (USD MILLION)
- TABLE 90 EUROPE: COOLING TOWER MARKET, BY DESIGN, 2024–2029 (USD MILLION)
- TABLE 91 EUROPE: COOLING TOWER MARKET, BY TYPE, 2021–2023 (USD MILLION)
- TABLE 92 EUROPE: COOLING TOWER MARKET, BY TYPE, 2024–2029 (USD MILLION)
- TABLE 93 EUROPE: COOLING TOWER MARKET, BY APPLICATION, 2021–2023 (USD MILLION)
- TABLE 94 EUROPE: COOLING TOWER MARKET, BY APPLICATION, 2024–2029 (USD MILLION)
- TABLE 95 EUROPE: COOLING TOWER MARKET, BY APPLICATION, 2021–2023 (UNITS)
- TABLE 96 EUROPE: COOLING TOWER MARKET, BY APPLICATION, 2024–2029 (UNITS)
- TABLE 97 GERMANY: COOLING TOWER MARKET, BY APPLICATION, 2021–2023 (USD MILLION)
- TABLE 98 GERMANY: COOLING TOWER MARKET, BY APPLICATION, 2024–2029 (USD MILLION)
- TABLE 99 GERMANY: COOLING TOWER MARKET, BY APPLICATION, 2021–2023 (UNITS)
- TABLE 100 GERMANY: COOLING TOWER MARKET, BY APPLICATION, 2024–2029 (UNITS)
- TABLE 101 ITALY: COOLING TOWER MARKET, BY APPLICATION, 2021–2023 (USD MILLION)
- TABLE 102 ITALY: COOLING TOWER MARKET, BY APPLICATION, 2024–2029 (USD MILLION)
- TABLE 103 ITALY: COOLING TOWER MARKET, BY APPLICATION, 2021–2023 (UNITS)
- TABLE 104 ITALY: COOLING TOWER MARKET, BY APPLICATION, 2024–2029 (UNITS)
- TABLE 105 FRANCE: COOLING TOWER MARKET, BY APPLICATION, 2021–2023 (USD MILLION)
- TABLE 106 FRANCE: COOLING TOWER MARKET, BY APPLICATION, 2024–2029 (USD MILLION)
- TABLE 107 FRANCE: COOLING TOWER MARKET, BY APPLICATION, 2021–2023 (UNITS)
- TABLE 108 FRANCE: COOLING TOWER MARKET, BY APPLICATION, 2024–2029 (UNITS)
- TABLE 109 SPAIN: COOLING TOWER MARKET, BY APPLICATION, 2021–2023 (USD MILLION)
- TABLE 110 SPAIN: COOLING TOWER MARKET, BY APPLICATION, 2024–2029 (USD MILLION)
- TABLE 111 SPAIN: COOLING TOWER MARKET, BY APPLICATION, 2021–2023 (UNITS)
- TABLE 112 SPAIN: COOLING TOWER MARKET, BY APPLICATION, 2024–2029 (UNITS)
- TABLE 113 UK: COOLING TOWER MARKET, BY APPLICATION, 2021–2023 (USD MILLION)
- TABLE 114 UK: COOLING TOWER MARKET, BY APPLICATION, 2024–2029 (USD MILLION)
- TABLE 115 UK: COOLING TOWER MARKET, BY APPLICATION, 2021–2023 (UNITS)
- TABLE 116 UK COOLING TOWER MARKET, BY APPLICATION, 2024–2029 (UNITS)
- TABLE 117 RUSSIA: COOLING TOWER MARKET, BY APPLICATION, 2021–2023 (USD MILLION)
- TABLE 118 RUSSIA: COOLING TOWER MARKET, BY APPLICATION, 2024–2029 (USD MILLION)
- TABLE 119 RUSSIA: COOLING TOWER MARKET, BY APPLICATION, 2021–2023 (UNITS)
- TABLE 120 RUSSIA: COOLING TOWER MARKET, BY APPLICATION, 2024–2029 (UNITS)
- TABLE 121 REST OF EUROPE: COOLING TOWER MARKET, BY APPLICATION, 2021–2023 (USD MILLION)
- TABLE 122 REST OF EUROPE: COOLING TOWER MARKET, BY APPLICATION, 2024–2029 (USD MILLION)
- TABLE 123 REST OF EUROPE: COOLING TOWER MARKET, BY APPLICATION, 2021–2023 (UNITS)
- TABLE 124 REST OF EUROPE: COOLING TOWER MARKET, BY APPLICATION, 2024–2029 (UNITS)
- TABLE 125 NORTH AMERICA: COOLING TOWER MARKET, BY COUNTRY, 2021–2023 (USD MILLION)
- TABLE 126 NORTH AMERICA: COOLING TOWER MARKET, BY COUNTRY, 2024–2029 (USD MILLION)
- TABLE 127 NORTH AMERICA: COOLING TOWER MARKET, BY COUNTRY, 2021–2023 (UNITS)
- TABLE 128 NORTH AMERICA: COOLING TOWER MARKET, BY COUNTRY, 2024–2029 (UNITS)
- TABLE 129 NORTH AMERICA: COOLING TOWER MARKET, BY FLOW TYPE, 2021–2023 (USD MILLION)
- TABLE 130 NORTH AMERICA: COOLING TOWER MARKET, BY FLOW TYPE, 2024–2029 (USD MILLION)
- TABLE 131 NORTH AMERICA: COOLING TOWER MARKET, BY TECHNOLOGY, 2021–2023 (USD MILLION)
- TABLE 132 NORTH AMERICA: COOLING TOWER MARKET, BY TECHNOLOGY, 2024–2029 (USD MILLION)
- TABLE 133 NORTH AMERICA: COOLING TOWER MARKET, BY DESIGN, 2021–2023 (USD MILLION)
- TABLE 134 NORTH AMERICA: COOLING TOWER MARKET, BY DESIGN, 2024–2029 (USD MILLION)
- TABLE 135 NORTH AMERICA: COOLING TOWER MARKET, BY TYPE, 2021–2023 (USD MILLION)
- TABLE 136 NORTH AMERICA: COOLING TOWER MARKET, BY TYPE, 2024–2029 (USD MILLION)
- TABLE 137 NORTH AMERICA: COOLING TOWER MARKET, BY APPLICATION, 2021–2023 (USD MILLION)
- TABLE 138 NORTH AMERICA: COOLING TOWER MARKET, BY APPLICATION, 2024–2029 (USD MILLION)
- TABLE 139 NORTH AMERICA: COOLING TOWER MARKET, BY APPLICATION, 2021–2023 (UNITS)
- TABLE 140 NORTH AMERICA: COOLING TOWER MARKET, BY APPLICATION, 2024–2029 (UNITS)
- TABLE 141 US: COOLING TOWER MARKET, BY APPLICATION, 2021–2023 (USD MILLION)
- TABLE 142 US: COOLING TOWER MARKET, BY APPLICATION, 2024–2029 (USD MILLION)
- TABLE 143 US: COOLING TOWER MARKET, BY APPLICATION, 2021–2023 (UNITS)
- TABLE 144 US: COOLING TOWER MARKET, BY APPLICATION, 2024–2029 (UNITS)
- TABLE 145 CANADA: COOLING TOWER MARKET, BY APPLICATION, 2021–2023 (USD MILLION)
- TABLE 146 CANADA: COOLING TOWER MARKET, BY APPLICATION, 2024–2029 (USD MILLION)
- TABLE 147 CANADA: COOLING TOWER MARKET, BY APPLICATION, 2021–2023 (UNITS)
- TABLE 148 CANADA: COOLING TOWER MARKET, BY APPLICATION, 2024–2029 (UNITS)
- TABLE 149 MEXICO: COOLING TOWER MARKET, BY APPLICATION, 2021–2023 (USD MILLION)
- TABLE 150 MEXICO: COOLING TOWER MARKET, BY APPLICATION, 2024–2029 (USD MILLION)
- TABLE 151 MEXICO: COOLING TOWER MARKET, BY APPLICATION, 2021–2023 (UNITS)
- TABLE 152 MEXICO: COOLING TOWER MARKET, BY APPLICATION, 2024–2029 (UNITS)
- TABLE 153 MIDDLE EAST & AFRICA: COOLING TOWER MARKET, BY COUNTRY, 2021–2023 (USD MILLION)
- TABLE 154 MIDDLE EAST & AFRICA: COOLING TOWER MARKET, BY COUNTRY, 2024–2029 (USD MILLION)
- TABLE 155 MIDDLE EAST & AFRICA: COOLING TOWER MARKET, BY COUNTRY, 2021–2023 (UNITS)
- TABLE 156 MIDDLE EAST & AFRICA: COOLING TOWER MARKET, BY COUNTRY, 2024–2029 (UNITS)
- TABLE 157 MIDDLE EAST & AFRICA: COOLING TOWER MARKET, BY FLOW TYPE, 2021–2023 (USD MILLION)
- TABLE 158 MIDDLE EAST & AFRICA: COOLING TOWER MARKET, BY FLOW TYPE, 2024–2029 (USD MILLION)
- TABLE 159 MIDDLE EAST & AFRICA: COOLING TOWER MARKET, BY TECHNOLOGY, 2021–2023 (USD MILLION)
- TABLE 160 MIDDLE EAST & AFRICA: COOLING TOWER MARKET, BY TECHNOLOGY, 2024–2029 (USD MILLION)
- TABLE 161 MIDDLE EAST & AFRICA: COOLING TOWER MARKET, BY DESIGN, 2021–2023 (USD MILLION)
- TABLE 162 MIDDLE EAST & AFRICA: COOLING TOWER MARKET, BY DESIGN, 2024–2029 (USD MILLION)
- TABLE 163 MIDDLE EAST & AFRICA: COOLING TOWER MARKET, BY TYPE, 2021–2023 (USD MILLION)
- TABLE 164 MIDDLE EAST & AFRICA: COOLING TOWER MARKET, BY TYPE, 2024–2029 (USD MILLION)
- TABLE 165 MIDDLE EAST & AFRICA: COOLING TOWER MARKET, BY APPLICATION, 2021–2023 (USD MILLION)
- TABLE 166 MIDDLE EAST & AFRICA: COOLING TOWER MARKET, BY APPLICATION, 2024–2029 (USD MILLION)
- TABLE 167 MIDDLE EAST & AFRICA: COOLING TOWER MARKET, BY APPLICATION, 2021–2023 (UNITS)
- TABLE 168 MIDDLE EAST & AFRICA: COOLING TOWER MARKET, BY APPLICATION, 2024–2029 (UNITS)
- TABLE 169 SAUDI ARABIA: COOLING TOWER MARKET, BY APPLICATION, 2021–2023 (USD MILLION)
- TABLE 170 SAUDI ARABIA: COOLING TOWER MARKET, BY APPLICATION, 2024–2029 (USD MILLION)
- TABLE 171 SAUDI ARABIA: COOLING TOWER MARKET, BY APPLICATION, 2021–2023 (UNITS)
- TABLE 172 SAUDI ARABIA: COOLING TOWER MARKET, BY APPLICATION, 2024–2029 (UNITS)
- TABLE 173 UAE: COOLING TOWER MARKET, BY APPLICATION, 2021–2023 (USD MILLION)
- TABLE 174 UAE: COOLING TOWER MARKET, BY APPLICATION, 2024–2029 (USD MILLION)
- TABLE 175 UAE: COOLING TOWER MARKET, BY APPLICATION, 2021–2023 (UNITS)
- TABLE 176 UAE: COOLING TOWER MARKET, BY APPLICATION, 2024–2029 (UNITS)
- TABLE 177 REST OF GCC: COOLING TOWER MARKET, BY APPLICATION, 2021–2023 (USD MILLION)
- TABLE 178 REST OF GCC: COOLING TOWER MARKET, BY APPLICATION, 2024–2029 (USD MILLION)
- TABLE 179 REST OF GCC: COOLING TOWER MARKET, BY APPLICATION, 2021–2023 (UNITS)
- TABLE 180 REST OF GCC: COOLING TOWER MARKET, BY APPLICATION, 2024–2029 (UNITS)
- TABLE 181 SOUTH AFRICA: COOLING TOWER MARKET, BY APPLICATION, 2021–2023 (USD MILLION)
- TABLE 182 SOUTH AFRICA: COOLING TOWER MARKET, BY APPLICATION, 2024–2029 (USD MILLION)
- TABLE 183 SOUTH AFRICA: COOLING TOWER MARKET, BY APPLICATION, 2021–2023 (UNITS)
- TABLE 184 SOUTH AFRICA: COOLING TOWER MARKET, BY APPLICATION, 2024–2029 (UNITS)
- TABLE 185 REST OF MIDDLE EAST & AFRICA: COOLING TOWER MARKET, BY APPLICATION, 2021–2023 (USD MILLION)
- TABLE 186 REST OF MIDDLE EAST & AFRICA: COOLING TOWER MARKET, BY APPLICATION, 2024–2029 (USD MILLION)
- TABLE 187 REST OF MIDDLE EAST & AFRICA: COOLING TOWER MARKET, BY APPLICATION, 2021–2023 (UNITS)
- TABLE 188 REST OF MIDDLE EAST & AFRICA: COOLING TOWER MARKET, BY APPLICATION, 2024–2029 (UNITS)
- TABLE 189 SOUTH AMERICA: COOLING TOWER MARKET, BY COUNTRY, 2021–2023 (USD MILLION)
- TABLE 190 SOUTH AMERICA: COOLING TOWER MARKET, BY COUNTRY, 2024–2029 (USD MILLION)
- TABLE 191 SOUTH AMERICA: COOLING TOWER MARKET, BY COUNTRY, 2021–2023 (UNITS)
- TABLE 192 SOUTH AMERICA: COOLING TOWER MARKET, BY COUNTRY, 2024–2029 (UNITS)
- TABLE 193 SOUTH AMERICA: COOLING TOWER MARKET, BY FLOW TYPE, 2021–2023 (USD MILLION)
- TABLE 194 SOUTH AMERICA: COOLING TOWER MARKET, BY FLOW TYPE, 2024–2029 (USD MILLION)
- TABLE 195 SOUTH AMERICA: COOLING TOWER MARKET, BY TECHNOLOGY, 2021–2023 (USD MILLION)
- TABLE 196 SOUTH AMERICA: COOLING TOWER MARKET, BY TECHNOLOGY, 2024–2029 (USD MILLION)
- TABLE 197 SOUTH AMERICA: COOLING TOWER MARKET, BY DESIGN, 2021–2023 (USD MILLION)
- TABLE 198 SOUTH AMERICA: COOLING TOWER MARKET, BY DESIGN, 2024–2029 (USD MILLION)
- TABLE 199 SOUTH AMERICA: COOLING TOWER MARKET, BY TYPE, 2021–2023 (USD MILLION)
- TABLE 200 SOUTH AMERICA: COOLING TOWER MARKET, BY TYPE, 2024–2029 (USD MILLION)
- TABLE 201 SOUTH AMERICA: COOLING TOWER MARKET, BY APPLICATION, 2021–2023 (USD MILLION)
- TABLE 202 SOUTH AMERICA: COOLING TOWER MARKET, BY APPLICATION, 2024–2029 (USD MILLION)
- TABLE 203 SOUTH AMERICA: COOLING TOWER MARKET, BY APPLICATION, 2021–2023 (UNITS)
- TABLE 204 SOUTH AMERICA: COOLING TOWER MARKET, BY APPLICATION, 2024–2029 (UNITS)
- TABLE 205 BRAZIL: COOLING TOWER MARKET, BY APPLICATION, 2021–2023 (USD MILLION)
- TABLE 206 BRAZIL: COOLING TOWER MARKET, BY APPLICATION, 2024–2029 (USD MILLION)
- TABLE 207 BRAZIL: COOLING TOWER MARKET, BY APPLICATION, 2021–2023 (UNITS)
- TABLE 208 BRAZIL: COOLING TOWER MARKET, BY APPLICATION, 2024–2029 (UNITS)
- TABLE 209 ARGENTINA: COOLING TOWER MARKET, BY APPLICATION, 2021–2023 (USD MILLION)
- TABLE 210 ARGENTINA: COOLING TOWER MARKET, BY APPLICATION, 2024–2029 (USD MILLION)
- TABLE 211 ARGENTINA: COOLING TOWER MARKET, BY APPLICATION, 2021–2023 (UNITS)
- TABLE 212 ARGENTINA: COOLING TOWER MARKET, BY APPLICATION, 2024–2029 (UNITS)
- TABLE 213 REST OF SOUTH AMERICA: COOLING TOWER MARKET, BY APPLICATION, 2021–2023 (USD MILLION)
- TABLE 214 REST OF SOUTH AMERICA: COOLING TOWER MARKET, BY APPLICATION, 2024–2029 (USD MILLION)
- TABLE 215 REST OF SOUTH AMERICA: COOLING TOWER MARKET, BY APPLICATION, 2021–2023 (UNITS)
- TABLE 216 REST OF SOUTH AMERICA: COOLING TOWER MARKET, BY APPLICATION, 2024–2029 (UNITS)
- TABLE 217 COOLING TOWER MARKET: DEGREE OF COMPETITION, 2023
- TABLE 218 COOLING TOWERS: REGION FOOTPRINT
- TABLE 219 COOLING TOWER MARKET: FLOW TYPE FOOTPRINT
- TABLE 220 COOLING TOWERS: TECHNOLOGY FOOTPRINT
- TABLE 221 COOLING TOWERS: CONSTRUCTION MATERIAL FOOTPRINT
- TABLE 222 COOLING TOWERS: DESIGN FOOTPRINT
- TABLE 223 COOLING TOWERS: TYPE FOOTPRINT
- TABLE 224 COOLING TOWERS: APPLICATION FOOTPRINT
- TABLE 225 COOLING TOWER MARKET: LIST OF KEY START-UPS/SMES
- TABLE 226 COOLING TOWERS: COMPETITIVE BENCHMARKING OF START-UPS/SMES
- TABLE 227 COOLING TOWER MARKET: PRODUCT LAUNCHES, MAY 2019–FEBRUARY 2024
- TABLE 228 COOLING TOWER MARKET: DEALS, MAY 2019–FEBRUARY 2024
- TABLE 229 COOLING TOWER MARKET: EXPANSIONS, MAY 2019–FEBRUARY 2024
- TABLE 230 COOLING TOWER MARKET: OTHERS, MAY 2019–FEBRUARY 2024
- TABLE 231 BALTIMORE AIRCOIL COMPANY, INC.: COMPANY OVERVIEW
- TABLE 232 BALTIMORE AIRCOIL COMPANY, INC.: PRODUCTS OFFERED
- TABLE 233 BALTIMORE AIRCOIL COMPANY, INC.: PRODUCT LAUNCHES
- TABLE 234 BALTIMORE AIRCOIL COMPANY, INC.: DEALS
- TABLE 235 SPX TECHNOLOGIES: COMPANY OVERVIEW
- TABLE 236 SPX TECHNOLOGIES: PRODUCTS OFFERED
- TABLE 237 SPX TECHNOLOGIES: DEALS
- TABLE 238 SPX TECHNOLOGIES: EXPANSIONS
- TABLE 239 JOHN COCKERILL: COMPANY OVERVIEW
- TABLE 240 JOHN COCKERILL: PRODUCTS OFFERED
- TABLE 241 JOHN COCKERILL: DEALS
- TABLE 242 EBARA CORPORATION: COMPANY OVERVIEW
- TABLE 243 EBARA CORPORATION: PRODUCTS OFFERED
- TABLE 244 EBARA CORPORATION: OTHERS
- TABLE 245 EVAPCO, INC.: COMPANY OVERVIEW
- TABLE 246 EVAPCO, INC.: PRODUCTS OFFERED
- TABLE 247 EVAPCO, INC.: PRODUCT LAUNCHES
- TABLE 248 EVAPCO, INC.: EXPANSIONS
- TABLE 249 ENEXIO MANAGEMENT GMBH: COMPANY OVERVIEW
- TABLE 250 ENEXIO MANAGEMENT GMBH: PRODUCTS OFFERED
- TABLE 251 ENEXIO MANAGEMENT GMBH: DEALS
- TABLE 252 BABCOCK & WILCOX ENTERPRISES, INC.: COMPANY OVERVIEW
- TABLE 253 BABCOCK & WILCOX ENTERPRISES, INC.: PRODUCTS OFFERED
- TABLE 254 KRONES AG: COMPANY OVERVIEW
- TABLE 255 KRONES AG: PRODUCTS OFFERED
- TABLE 256 SEAGULL COOLING TOWER CO., LTD.: COMPANY OVERVIEW
- TABLE 257 SEAGULL COOLING TOWER CO., LTD.: PRODUCTS OFFERED
- TABLE 258 PAHARPUR COOLING TOWERS LTD.: COMPANY OVERVIEW
- TABLE 259 PAHARPUR COOLING TOWERS LTD.: PRODUCTS OFFERED
- TABLE 260 AMCOT COOLING TOWER CORPORATION.: BUSINESS OVERVIEW
- TABLE 261 BELLCT: BUSINESS OVERVIEW
- TABLE 262 DONGAHE INDUSTRIAL COMPANY LTD.: BUSINESS OVERVIEW
- TABLE 263 BOLDROCCHI T.E. SRL.: BUSINESS OVERVIEW
- TABLE 264 HENG AN (HACST): BUSINESS OVERVIEW
- TABLE 265 MARLEY FLOW: BUSINESS OVERVIEW
- TABLE 266 MITA COOLING TECHNOLOGIES SRL: BUSINESS OVERVIEW
- TABLE 267 NIHON SPINDLE MANUFACTURING CO. LTD.: BUSINESS OVERVIEW
- TABLE 268 PERFECT COOLING TOWERS: BUSINESS OVERVIEW
- TABLE 269 STAR COOLING TOWERS PVT. LTD.: BUSINESS OVERVIEW
- TABLE 270 DELTA COOLING TOWERS, INC.: BUSINESS OVERVIEW
- TABLE 271 NATIONAL COOLING TOWERS: BUSINESS OVERVIEW
- TABLE 272 TOWER TECH COOLING SYSTEM PVT. LTD: BUSINESS OVERVIEW
- TABLE 273 WATCO GROUP: BUSINESS OVERVIEW
- TABLE 274 ROBSON INDUSTRIES INC.: BUSINESS OVERVIEW
- FIGURE 1 COOLING TOWER MARKET SEGMENTATION
- FIGURE 2 COOLING TOWER MARKET: RESEARCH DESIGN
- FIGURE 3 MARKET SIZE ESTIMATION APPROACH: DEMAND SIDE
- FIGURE 4 MARKET SIZE ESTIMATION: BOTTOM-UP APPROACH
- FIGURE 5 MARKET SIZE ESTIMATION: TOP-DOWN APPROACH
- FIGURE 6 DATA TRIANGULATION
- FIGURE 7 COUNTERFLOW SEGMENT TO ACCOUNT FOR LARGER MARKET SHARE IN 2029
- FIGURE 8 STEEL SEGMENT TO ACCOUNT FOR LARGEST MARKET SHARE IN 2029
- FIGURE 9 POWER GENERATION SEGMENT TO DOMINATE MARKET BETWEEN 2024 AND 2029
- FIGURE 10 ASIA PACIFIC LED COOLING TOWER MARKET IN 2023
- FIGURE 11 RISING DEMAND FOR COOLING TOWERS FROM VARIOUS INDUSTRIES IN EMERGING ECONOMIES TO DRIVE MARKET
- FIGURE 12 MECHANICAL DRAFT SEGMENT TO ACCOUNT FOR LARGER SHARE OF COOLING TOWER MARKET IN 2029
- FIGURE 13 EVAPORATIVE SEGMENT TO ACCOUNT FOR LARGEST SHARE OF COOLING TOWER MARKET IN 2029
- FIGURE 14 POWER GENERATION SEGMENT AND ASIA PACIFIC ACCOUNTED FOR LARGEST SHARES OF COOLING TOWER MARKET IN 2023
- FIGURE 15 INDIA TO BE FASTEST-GROWING COOLING TOWER MARKET DURING FORECAST PERIOD
- FIGURE 16 COOLING TOWER MARKET: DRIVERS, RESTRAINTS, OPPORTUNITIES, AND CHALLENGES
- FIGURE 17 COOLING TOWER MARKET: PORTER’S FIVE FORCES ANALYSIS
- FIGURE 18 INFLUENCE OF STAKEHOLDERS ON BUYING PROCESS, BY APPLICATION
- FIGURE 19 KEY BUYING CRITERIA, BY APPLICATION
- FIGURE 20 COOLING TOWER MARKET: VALUE CHAIN ANALYSIS
- FIGURE 21 COOLING TOWER MARKET: ECOSYSTEM ANALYSIS
- FIGURE 22 TRENDS/DISRUPTIONS IMPACTING CUSTOMERS’ BUSINESSES
- FIGURE 23 AVERAGE SELLING PRICE (ASP) TREND OF COOLING TOWERS, BY REGION, 2022, 2023, 2026, AND 2029 (USD/UNIT)
- FIGURE 24 INVESTMENT AND FUNDING SCENARIO, 2019–2023 (USD MILLION)
- FIGURE 25 GENERATIVE AI ADOPTION FOR THERMAL MANAGEMENT IN TOP COUNTRIES
- FIGURE 26 IMPACT OF AI ON COOLING TOWER MARKET
- FIGURE 27 LIMITED PATENTS ACCOUNTED FOR SIGNIFICANT SHARE OF TOTAL PATENTS RELATED TO COOLING TOWERS, 2013–2023
- FIGURE 28 NUMBER OF PATENTS GRANTED PER YEAR, 2013–2023
- FIGURE 29 JURISDICTION ANALYSIS
- FIGURE 30 APPLICANT ANALYSIS, 2013–2023
- FIGURE 31 COUNTERFLOW SEGMENT TO HOLD LARGER MARKET SHARE IN 2024
- FIGURE 32 OPEN CIRCUIT SEGMENT TO HOLD LARGEST MARKET SHARE IN 2024
- FIGURE 33 STEEL SEGMENT TO HOLD LARGEST MARKET SHARE IN 2024
- FIGURE 34 MECHANICAL DRAFT SEGMENT TO HOLD LARGER MARKET SHARE IN 2024
- FIGURE 35 EVAPORATIVE SEGMENT TO HOLD LARGEST MARKET SHARE IN 2024
- FIGURE 36 POWER GENERATION SEGMENT TO HOLD LARGEST MARKET SHARE IN 2024
- FIGURE 37 INDIA TO REGISTER HIGHEST CAGR IN COOLING TOWER MARKET DURING FORECAST PERIOD
- FIGURE 38 ASIA PACIFIC: COOLING TOWER MARKET SNAPSHOT
- FIGURE 39 EUROPE: COOLING TOWER MARKET SNAPSHOT
- FIGURE 40 NORTH AMERICA: COOLING TOWER MARKET SNAPSHOT
- FIGURE 41 COOLING TOWER MARKET: OVERVIEW OF STRATEGIES ADOPTED BY KEY PLAYERS, 2019–2024
- FIGURE 42 COOLING TOWER MARKET SHARE ANALYSIS OF KEY COMPANIES, 2023
- FIGURE 43 COOLING TOWER MARKET: TOTAL AND SEGMENTAL REVENUE ANALYSIS OF KEY COMPANIES, 2023 (USD BILLION)
- FIGURE 44 COOLING TOWER MARKET: REVENUE ANALYSIS OF KEY PLAYERS, 2021–2023 (USD BILLION)
- FIGURE 45 COOLING TOWER MARKET: COMPANY VALUATION OF LEADING COMPANIES, 2023 (USD BILLION)
- FIGURE 46 COOLING TOWER MARKET: FINANCIAL METRICS OF LEADING COMPANIES, 2023
- FIGURE 47 COOLING TOWER MARKET: BRAND/PRODUCT COMPARISON
- FIGURE 48 COOLING TOWER MARKET: COMPANY EVALUATION MATRIX (KEY PLAYERS), 2023
- FIGURE 49 COMPANY FOOTPRINT
- FIGURE 50 COOLING TOWER MARKET: COMPANY EVALUATION MATRIX (START-UPS/SMES), 2023
- FIGURE 51 SPX TECHNOLOGIES: COMPANY SNAPSHOT
- FIGURE 52 EBARA CORPORATION: COMPANY SNAPSHOT
- FIGURE 53 BABCOCK & WILCOX ENTERPRISES, INC.: COMPANY SNAPSHOT
- FIGURE 54 KRONES AG: COMPANY SNAPSHOT
The study involved four major activities in estimating the market size of the cooling tower market. Exhaustive secondary research was done to collect information on the market, the peer market, and the parent market. The next step was to validate these findings, assumptions, and sizing with industry experts across the value chain through primary research. Both top-down and bottom-up approaches were employed to estimate the complete market size. Thereafter, the market breakdown and data triangulation procedures were used to estimate the market size of the segments and subsegments.
Secondary Research
In the secondary research process, various secondary sources have been referred to for identifying and collecting information for this study. These secondary sources include annual reports, press releases, investor presentations of companies, corporate documents, white papers, certified publications, trade directories, certified publications, articles from recognized authors, associations, gold standard and silver standard websites, and databases.
Secondary research has been used to obtain key information about the value chain of the industry, monetary chain of the market, the total pool of key cooling tower, market classification and segmentation according to industry trends to the bottom-most level, and regional markets. It was also used to obtain information about the key developments from a market-oriented perspective.
Primary Research
The cooling tower market comprises several stakeholders in the value chain, which include raw material suppliers, component manufacturers, manufacturers and end consumers. Various primary sources from the supply and demand sides of the cooling tower market have been interviewed to obtain qualitative and quantitative information. The primary interviewees from the demand side include key opinion leaders in end-use sectors. The primary sources from the supply side include manufacturers, associations, and institutions involved in the cooling tower industry.
Primary interviews were conducted to gather insights such as market statistics, data of revenue collected from the products and services, market breakdowns, market size estimations, market forecasting, and data triangulation. Primary research also helped in understanding the various trends related to type, design, construction material, flow type, technology, application, and region. Stakeholders from the demand side, such as CIOs, CTOs, and CSOs were interviewed to understand the buyer’s perspective on the suppliers, products, component providers, and their current usage of cooling tower and future outlook of their business which will affect the overall market.
The breakdown of profiles of the primary interviewees is illustrated in the figure below:
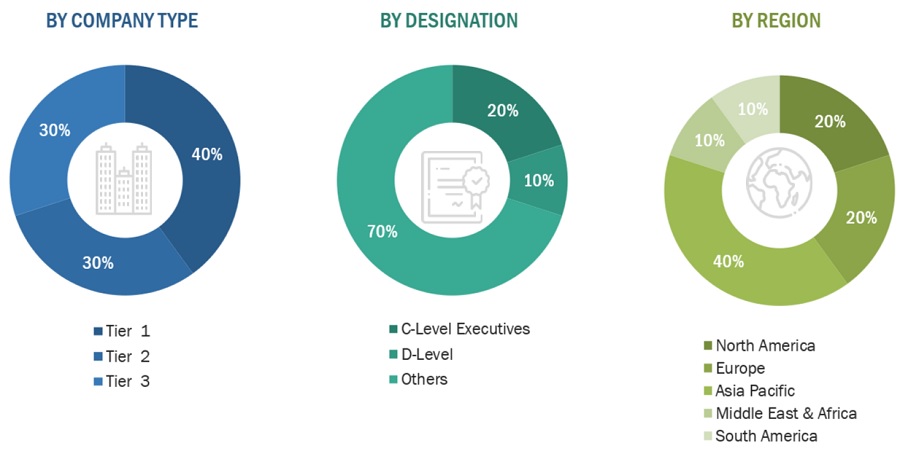
Note: Tier 1, Tier 2, and Tier 3 companies are classified based on their market revenue in 2023 available in the public domain, product portfolios, and geographical presence.
Other designations include sales representatives, production heads, and technicians.
To know about the assumptions considered for the study, download the pdf brochure
Market Size Estimation
The top-down approach was used to estimate and validate the size of various submarkets for cooling tower for each region. The research methodology used to estimate the market size included the following steps:
- The key players in the industry have been identified through extensive secondary research.
- The supply chain of the industry has been determined through primary and secondary research.
- The global market was then segmented into five major regions and validated by industry experts.
- All percentage shares, splits, and breakdowns based on type, design, construction material, flow type, technology, application, and region were determined using secondary sources and verified through primary sources.
- All possible parameters that affect the markets covered in this research study were accounted for, viewed in extensive detail, verified through primary research, and analyzed to get the final quantitative and qualitative data. This data was consolidated and added with detailed inputs and analysis and presented in this report.
Cooling Tower Market: Bottom-Up Approach
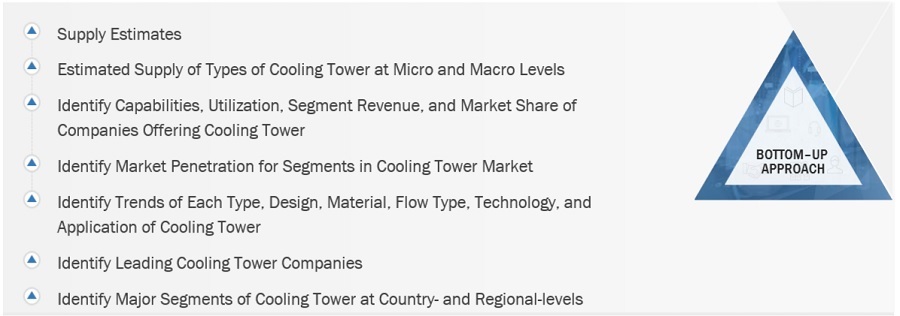
Source: Secondary Research, Interviews with Experts, and MarketsandMarkets Analysis
To know about the assumptions considered for the study, Request for Free Sample Report
Cooling Tower Market: Top-Down Approach
Source: Secondary Research, Interviews with Experts, and MarketsandMarkets Analysis
Data Triangulation
After arriving at the total market size from the estimation process of cooling tower above, the overall market has been split into several segments and sub-segments. To complete the overall market engineering process and arrive at the exact statistics for all the segments and sub-segments, the data triangulation and market breakdown procedures have been employed, wherever applicable. The data has been triangulated by studying various factors and trends from both the demand and supply sides. Along with this, the market size has been validated by using both the top-down and bottom-up approaches and primary interviews. Hence, for every data segment, there have been three sources—top-down approach, bottom-up approach, and expert interviews. The data was assumed correct when the values arrived from the three sources matched.
Market Definition
A cooling tower is a specialized heat exchange device that facilitates the removal of excess heat from industrial processes or building systems by transferring it to the surrounding air. By utilizing air and water as cooling mediums, these towers effectively dissipate heat and maintain optimal operating conditions, thereby enhancing system efficiency and longevity. They are commonly employed in power plants, petrochemical facilities, and HVAC systems to ensure reliable and sustainable heat management.
Key Stakeholders
- Cooling Tower Manufacturers
- Raw Material Suppliers
- Manufacturing Technology Providers
- Industry Associations
- Manufacturers in End-Use Industries
Report Objectives
- To define, describe, and forecast the size of the cooling tower market, in terms of value and volume.
- To provide detailed information regarding the major factors (drivers, opportunities, restraints, and challenges) influencing the growth of the market.
- To estimate and forecast the market size based on type, design, construction material, flow type, technology, application and region.
- To forecast the size of the market with respect to major regions, namely, Europe, North America, Asia Pacific, Middle East & Africa, and South America, along with their key countries.
- To strategically analyze micromarkets1 with respect to individual growth trends, prospects, and their contribution to the overall market.
- To analyze opportunities in the market for stakeholders and provide a competitive landscape of market leaders.
- To track and analyze recent developments such as expansions, new product launches, partnerships & agreements, and acquisitions in the market.
- To strategically profile key market players and comprehensively analyze their core competencies.
Available Customizations
Along with the given market data, MarketsandMarkets offers customizations according to the company’s specific needs. The following customization options are available for the report:
Regional Analysis
- Further breakdown of a region with respect to a particular country or additional application
Company Information
- Detailed analysis and profiles of additional market players
Tariff & Regulations
- Regulations and impact on cooling tower market
Growth opportunities and latent adjacency in Cooling Tower Market