Contrast Media Market by Type (Iodinated Contrast Media), Form (Liquid, Powder), Modality (X-ray, CT, MRI, Ultrasound), Route of Administration (Oral, Rectal), Indication (Cancer, Neurological, GI, Musculoskeletal Disorders) & Region - Global Forecast to 2029
Market Growth Outlook Summary
The global contrast media market growth forecasted to transform from $6.3 Billion in 2023 to $9.7 Billion by 2029, driven by a CAGR of 7.5%. The new research study consists of an industry trend analysis of the market. The new research study consists of industry trends, pricing analysis, patent analysis, conference and webinar materials, key stakeholders, and buying behaviour in the market.
The new research study consists of an industry trend analysis of the market. The new research study consists of industry trends, pricing analysis, patent analysis, conference and webinar materials, key stakeholders, and buying behaviour in the market. Market growth is largely driven by rising number of hospitals and diagnostic imaging centers, awareness regarding early diagnosis and rising prevalence of chronic conditions. On the other hand, the adverse effects associated with the use of contrast media will restrain the growth of this market to a certain extent.
Attractive Opportunities in the Contrast Media Market
To know about the assumptions considered for the study, Request for Free Sample Report
Contrast Media Market Dynamics
DRIVER: Increasing prevalence of chronic medical conditions
Globally, there has been a significant increase in the number of people suffering from cancer. In various countries across the globe, people are adopting a sedentary lifestyle, which is characterized by a high-calorie diet (that is rich in fat, refined carbohydrates, and animal protein) and low physical activity. With such changes in lifestyle, the number of people suffering from cancer is expected to increase.
Over the years, the prevalence of chronic diseases such as cardiovascular disease (CVD) and cancer has increased significantly. Some key statistics in this regard have been mentioned below:
- According to an article published by the Pan American Health Organization (PAHO), globally, there were 20 million new cancer cases and 10 million cancer deaths. Projections indicate a projected 60% increase in the cancer burden over the next two decades. The anticipated worldwide burden is set to rise to around 30 million new cancer cases by 2040, with the most significant increases expected in low- and middle-income countries.
- According to estimates from the International Agency for Research on Cancer (IARC), globally, new cancer cases are expected to grow to 27.5 million, and 16.3 million cancer deaths are expected to occur due to the growing population by 2040.
- According to the JACC Journals’ findings in 2021, elevated systolic blood pressure continues to stand as the primary modifiable risk factor worldwide for premature cardiovascular deaths. It contributed to approximately 10.8 million cardiovascular deaths and a total of 11.3 million deaths globally in 2021.
- According to the American Heart Association (AHA), by 2030, 40.5% of the US population is projected to have some form of CVD.
- According to the Centers for Disease Control and Prevention (CDC), in 2021, heart disease maintained its position as the foremost cause of mortality in the US. Approximately 695,000 individuals in the United States succumbed to heart disease in that year, representing 1 in every 5 deaths.
RESTRAINT: Side effects associated with the use of contrast media
Contrast media are generally considered safe to use for various diagnostic procedures, such as MRI and CT scans. However, their use might be limited in certain patients due to side effects and allergic reactions, which can hinder the growth of the market to a certain extent. Their adverse reactions range from mild to severe; however, severe reactions are very uncommon, and severe allergic responses to contrast materials are rare. For instance, as per an article published by the NIH, the incidence of immediate reactions to nonionic contrast media ranges from 0.01–0.04% (severe) to 3% (mild). Nonionic agents are associated with a decreased risk of adverse reactions.
OPPORTUNITY: Increasing research on contrast media
Rising R&D into novel contrast media, as well as the development of newer applications of contrast media, provide immense opportunities for market players. Companies, research institutes, and universities across the globe are undertaking projects to develop novel contrast media and expand their applications. In October 2022, researcher Stefan Glöggler devised an effective contrast agent technique for MRI, potentially enabling the differentiation between tumors and healthy tissue based on their metabolic activity. The ForTra GmbH für Forschungstransfer of the Else Kröner-Fresenius Foundation (ForTra) and the European Research Council (ERC) are now offering financial support to advance this method for clinical patient trials. Similarly, in 2020, a biochemistry and pharmacology professor, Dr. Gang Han, received USD 25,000 in seed funding from the UMass Technology Development Fund for research on MRI contrast media or gadolinium-based agents with fewer adverse effects.
CHALLENGE: Dearth of trained professionals
A high degree of technical skill and expertise is needed to conduct advanced and sophisticated diagnostic imaging procedures. As per data from the US Bureau of Labor Statistics, radiology technicians are anticipated to witness an employment growth of nearly 6% during between 2022 and 2032. While this growth is significant, the shortage of specialists and trained radiologists will challenge market growth.
- According to the Association of Radiologists of Nigeria, the number of radiologists in Nigeria is about 400 for 200 million people, which is grossly inadequate to meet the requirements of the people in the country.
- According to an article in October 2023, India is facing a concerning healthcare challenge with an inadequate ratio of radiologists to population. With only around 20,000 radiologists catering to a population exceeding 1.4 billion, the country has a striking ratio of one radiologist for every 1,00,000 individuals, significantly below global healthcare standards.
- According to an NIH article published in September 2023, Malaysia faces a pressing need for additional radiologists compared to more developed nations. With just 870 registered radiologists serving a population of 33.57 million, the ratio stands at 3.9 per 100,000 individuals.
- The World Health Organization (WHO) highlights a global challenge, revealing that over two-thirds of the world’s population lacks access to radiology. Developing nations, particularly in Africa, face a critical situation where 14 countries lack access to a single radiologist. Even in developed countries like the UK and Australia, there exists a notable disparity, with major cities having more radiologists compared to rural areas on a per capita basis.
Contrast Media Industry Ecosystem/Market Map
Radiology segment accounted for the largest share of the contrast media industry in 2022, by application.
Based on application, the contrast media market is segmented into radiology, interventional radiology, and interventional cardiology. Radiology accounted for the market’s largest share in 2022, by application. Radiology plays a crucial role in the early detection and monitoring of various medical conditions, contributing to the higher demand for radiology procedures. The large share of radiology applications can be attributed to factors such as the rising geriatric population, increasing prevalence of chronic diseases, and demand for minimally invasive procedures, among others.
Intravascular route segment accounted for the largest share in the contrast media industry in 2022, by route of administration.
On the basis of route of administration, the global contrast media market is categorized into intravascular route, oral route, rectal route, and other routes of administration. In 2022, the intravascular route segment held the largest share in the market, by route of administration. The growth of the segment can be attributed to the fact that most of the contrast media are available in the form of injectable and help in limiting the time needed to administer as compared to a powdered one.
Hospitals, Clinics, and Ambulatory Surgical Centers segment accounted for the largest share in the contrast media industry in 2022, by end user.
Based on end user, the contrast media market is segmented into hospitals, clinics, and ambulatory surgical centers and diagnostic imaging centers. In 2022, the hospitals, clinics, and ambulatory surgical centers segment accounted for the largest share of the global market. Hospitals usually invest more and maintain a broad range of advanced imaging equipment, such as CT scanners, MRI machines, and interventional radiology suites, hence accelerating the demand for contrast media.
North America accounted for the largest share of the contrast media industry in 2022.
The contrast media market is segmented into four major regions: North America, Europe, the Asia Pacific, and the Rest of the World. In 2022, North America emerged as the leading contributor, accounting for the largest share of the market. With the presence of major players in the region, the region has witnessed an increase in the number of product approvals. These companies based in North America have expertise, resources, and well-established sales networks, contributing to the region’s market dominance.
To know about the assumptions considered for the study, download the pdf brochure
The major players in contrast media market are GE Healthcare (US), Bracco Imaging SpA (Italy), Bayer AG (Germany), Guerbet (France), and Lantheus Medical Imaging, Inc. (US). These players’ market leadership is due to their comprehensive product portfolios and expansive global footprint. These dominant market players have several advantages, including strong research and development budgets, strong marketing and distribution networks, and well-established brand recognition.
Scope of the Contrast Media Industry
Report Metric |
Details |
Market Revenue in 2023 |
$6.3 Billion |
Projected Revenue by 2029 |
$9.7 Billion |
Revenue Rate |
Poised to Grow at a CAGR of 7.5% |
Market Driver |
Increasing prevalence of chronic medical conditions |
Market Opportunity |
Increasing research on contrast media |
This research report categorizes the Contrast Media Market to forecast revenue and analyze trends in each of the following submarkets:
By Region
- North America
- Europe
- Asia Pacific
- Rest of the World
By Type
- Iodinated Contrast Media
- Gadolinium-based Contrast Media
- Microbubble Contrast Media
- Barium-based Contrast Media
By Form
- Liquid
- Powder
- Other Forms
By Modality
- X-ray
- Computed Tomography
- Magnetic Resonance Imaging
- Ultrasound
By Route of Administration
- Intravascular Route
- Oral Route
- Rectal Route
- Other Routes of Administration
By Indication Split
- Cardiovascular Diseases
- Cancer
- Gastrointestinal Disorders
- Musculoskeletal Disorders
- Neurological Disorders
- Nephrological Disorders
By Application
- Radiology
- Interventional Radiology
- Interventional Cardiology
By End User
- Hospital, Clinics, and Ambulatory Surgical Centers
- Diagnostic Imaging Centers
Recent Developments of Contrast Media Industry:
- In October 2023, The European Commission granted Guerbet marketing authorization (MA) for Elucirem (Gadopiclenol) following the positive opinion from the European Medicines Agency’s Committee for Medicinal Products for Human Use (CHMP).
- In April 2023, GE HealthCare expanded its contrast media portfolio by introducing Pixxoscan (gadobutrol), a macrocyclic, non-ionic magnetic resonance imaging (MRI) gadolinium-based contrast agent (GBCA). Pixxoscan underwent regulatory review via a decentralized procedure (DCP), securing marketing authorization in Austria.
- In September 2022, The company received FDA approval for the VUEWAY Gadopiclenol contrast media injection for use in adult and pediatric patients aged two years and older during magnetic resonance imaging (MRI) scans.
- In December 2021, Bracco Diagnostics entered into a collaboration agreement with Guerbet for the production and research related to Gadopiclenol, a high-relaxivity macrocyclic contrast agent.
- In March 2021, Guerbet and Bracco Imaging entered into a global strategic collaboration agreement for Gadopiclenol. The companies will collaborate on manufacturing, research, and development for potential future indications. Upon regulatory approval, they will independently commercialize Gadopiclenol, an investigational GBCA, under separate brands.
Frequently Asked Questions (FAQ):
What is the projected market revenue value of the global contrast media Market?
The global contrast media market boasts a total revenue value of $9.7 Billion by 2029.
What is the estimated growth rate (CAGR) of the global contrast media Market?
The global contrast media market has an estimated compound annual growth rate (CAGR) of 7.5% and a revenue size in the region of $6.3 Billion in 2023. .
To speak to our analyst for a discussion on the above findings, click Speak to Analyst
Exclusive indicates content/data unique to MarketsandMarkets and not available with any competitors.
- 5.1 INTRODUCTION
-
5.2 MARKET DYNAMICSDRIVERS- Rising prevalence of chronic diseases- Growing number of approvals of contrast media- Rising volume of CT and MRI examinations performed- Growing number of diagnostic centers and hospitals- Availability of reimbursement- Increasing demand for early disease diagnosis- Increasing funding by public-private organizationsRESTRAINTS- Side-effects and risks of allergic reactions associated with contrast mediaOPPORTUNITIES- Generic contrast media- Increasing research on contrast media- Growth opportunities in emerging economies- Increasing demand for minimally invasive imaging proceduresCHALLENGES- Preference for alternative modalities of imaging that do not require contrast media- Restriction of linear gadolinium-based contrast media and product recalls- Dearth of trained professionals- Shortage of contrast media
- 5.3 VALUE CHAIN ANALYSIS
- 5.4 SUPPLY CHAIN ANALYSIS
- 5.5 TECHNOLOGY ANALYSIS
-
5.6 PORTER’S FIVE FORCES ANALYSISTHREAT OF NEW ENTRANTSINTENSITY OF COMPETITIVE RIVALRYBARGAINING POWER OF BUYERSBARGAINING POWER OF SUPPLIERSTHREAT OF SUBSTITUTES
-
5.7 REGULATORY LANDSCAPEEU REGULATIONSFDA REGULATIONSJPMA REGULATIONS
- 5.8 PATENT ANALYSIS
- 5.9 KEY CONFERENCES & EVENTS IN 2024–2025
- 5.10 PRICING ANALYSIS
- 5.11 TRADE ANALYSIS
- 5.12 ECOSYSTEM ANALYSIS
- 5.13 TRENDS/DISRUPTIONS IMPACTING CUSTOMER’S BUSINESS
-
5.14 KEY STAKEHOLDERS AND BUYING CRITERIAKEY STAKEHOLDERS IN BUYING PROCESSBUYING CRITERIA
- 6.1 INTRODUCTION
-
6.2 IODINATED CONTRAST MEDIAHIGH DEMAND FOR IODINATED CONTRAST MEDIA DUE TO HIGHER DOSAGE REQUIRED IN CT SCANS—KEY FACTOR DRIVING MARKET GROWTH
-
6.3 GADOLINIUM-BASED CONTRAST MEDIASUSPICION REGARDING SAFETY PROFILE TO CHALLENGE MARKET GROWTH
-
6.4 MICROBUBBLE CONTRAST MEDIAEXTREMELY POPULAR AMONG PHYSICIANS WORLDWIDE
-
6.5 BARIUM-BASED CONTRAST MEDIAADVERSE EFFECTS ASSOCIATED WITH USE TO NEGATIVELY IMPACT MARKET
- 7.1 INTRODUCTION
-
7.2 LIQUIDINCREASING ADOPTION OF EASY-TO-USE LIQUID FORM OF CONTRAST MEDIA ACROSS HOSPITALS AND DIAGNOSTIC CENTERS TO DRIVE MARKET
-
7.3 POWDEREASE OF HANDLING, STORAGE, AND TRANSPORTATION TO FAVOR ADOPTION
- 7.4 OTHER FORMS
- 8.1 INTRODUCTION
-
8.2 X-RAYPRODUCTION OF HIGH-QUALITY IMAGES TO DRIVE MARKET
-
8.3 CTINCREASING NUMBER OF CT EXAMINATIONS TO PROPEL MARKET
-
8.4 MRIADVANTAGES OF MRI OVER OTHER IMAGING MODALITIES TO SUPPORT MARKET GROWTH
-
8.5 ULTRASOUNDFLEXIBLE AND LOW-COST DIAGNOSTIC IMAGING MODALITY–KEY FACTORS DRIVING MARKET GROWTH
- 9.1 INTRODUCTION
-
9.2 INTRAVASCULAR ROUTEWIDESPREAD USE OF INTRAVASCULAR ROUTE IN IMAGING MODALITIES TO DRIVE MARKET- Intravenous (IV) route- Intra-arterial (IA) route
-
9.3 ORAL ROUTEUSE OF ORAL CONTRAST MEDIA CAN LEAD TO PERFORATIONS IN GIT, LEADING TO PERITONITIS
-
9.4 RECTAL ROUTEMILD DISCOMFORT ASSOCIATED WITH RECTAL CONTRAST MEDIA TO LIMIT MARKET GROWTH
- 9.5 OTHER ROUTES
- 10.1 INTRODUCTION
-
10.2 CARDIOVASCULAR DISEASEHIGH BURDEN OF CVD TO DRIVE MARKET
-
10.3 CANCERASIA PACIFIC MARKET TO REGISTER RELATIVELY HIGHER GROWTH OWING TO HIGH CANCER PREVALENCE IN REGION
-
10.4 GASTROINTESTINAL DISORDERSRISING PREVALENCE OF GI DISORDERS TO SUPPORT MARKET GROWTH
-
10.5 MUSCULOSKELETAL DISORDERSRISING INCIDENCE OF WORK-RELATED MUSCULOSKELETAL DISORDERS TO SUPPORT MARKET GROWTH
-
10.6 NEUROLOGICAL DISORDERSRISING PREVALENCE OF DEMENTIA TO DRIVE MARKET
-
10.7 NEPHROLOGICAL DISORDERSRISING PREVALENCE OF ESRD TO DRIVE DEMAND FOR DIAGNOSTIC TOOLS
- 11.1 INTRODUCTION
-
11.2 RADIOLOGYGROWING NUMBER OF DIAGNOSTIC PROCEDURES TO DRIVE MARKET
-
11.3 INTERVENTIONAL RADIOLOGYINCREASING POPULARITY OF MINIMALLY INVASIVE PROCEDURES TO SUPPORT MARKET GROWTH
-
11.4 INTERVENTIONAL CARDIOLOGYRISING INCIDENCE OF CARDIAC DISEASES TO DRIVE MARKET
- 12.1 INTRODUCTION
-
12.2 HOSPITALS, CLINICS, AND AMBULATORY SURGERY CENTERSINCREASING ADOPTION OF DIAGNOSTIC IMAGING MODALITIES TO DRIVE MARKET
-
12.3 DIAGNOSTIC IMAGING CENTERSINCREASING NUMBER OF PRIVATE IMAGING CENTERS TO PROPEL MARKET
- 13.1 INTRODUCTION
-
13.2 NORTH AMERICAUS- Rising incidence of chronic diseases to drive marketCANADA- Increasing investments in improving medical imaging to drive marketRECESSION IMPACT ON NORTH AMERICAN CONTRAST MEDIA MARKET
-
13.3 EUROPEGERMANY- Presence of well-developed diagnostic imaging infrastructure to support market growthFRANCE- Increasing prevalence of cancer to propel marketUK- Increasing investments in diagnostic imaging to boost market growthITALY- Rising geriatric population to drive demand for diagnostic proceduresSPAIN- Shortage of radiologists to restrain market growthREST OF EUROPERECESSION IMPACT ON EUROPEAN CONTRAST MEDIA MARKET
-
13.4 ASIA PACIFICCHINA- High incidence of cancer and stroke to support market growthJAPAN- Strong healthcare sector and high disease incidence to favor market growthINDIA- Growing investments in radiology to propel market growthAUSTRALIA- Increasing research activities to drive marketREST OF ASIA PACIFICRECESSION IMPACT ON ASIA PACIFIC CONTRAST MEDIA MARKET
-
13.5 REST OF THE WORLDLATIN AMERICA- Lack of adequate healthcare infrastructure and poor insurance coverage to limit market growthMIDDLE EAST & AFRICA- High burden of chronic diseases to drive marketGCC COUNTRIES- Increasing government investments in healthcare sector and growing pharmaceuticals industry to drive marketRECESSION IMPACT ON REST OF THE WORLD CONTRAST MEDIA MARKET
- 14.1 OVERVIEW
- 14.2 STRATEGIES ADOPTED BY KEY PLAYERS
- 14.3 REVENUE ANALYSIS OF TOP MARKET PLAYERS
- 14.4 MARKET SHARE ANALYSIS
-
14.5 COMPANY EVALUATION MATRIXSTARSEMERGING LEADERSPERVASIVE PLAYERSPARTICIPANTSCOMPETITIVE BENCHMARKING OF KEY PLAYERS
-
14.6 STARTUP/SME EVALUATION MATRIXPROGRESSIVE COMPANIESRESPONSIVE COMPANIESDYNAMIC COMPANIESSTARTING BLOCKS
- 14.7 COMPETITIVE BENCHMARKING
-
14.8 COMPETITIVE SCENARIOPRODUCT LAUNCHES & APPROVALSDEALSOTHER DEVELOPMENTS
- 14.9 BRAND/PRODUCT COMPARISON: CONTRAST MEDIA MARKET
-
15.1 KEY PLAYERSGE HEALTHCARE- Business overview- Products offered- Recent developments- MnM viewBRACCO IMAGING SPA- Business overview- Products offered- Recent developments- MnM viewBAYER AG- Business overview- Products offered- Recent developments- MnM viewGUERBET- Business overview- Products offered- Recent developmentsLANTHEUS MEDICAL IMAGING- Business overview- Products offered- Recent developments- Pipeline productsUNIJULES LIFE SCIENCES LTD.- Business overview- Products offeredJ.B. CHEMICALS & PHARMACEUTICALS LIMITED- Business overview- Products offeredSANOCHEMIA PHARMAZEUTIKA- Business overview- Products offeredTAEJOON PHARM CO., LTD.- Business overview- Products offeredJODAS EXPOIM- Business overview- Products offeredIMAX DIAGNOSTIC IMAGING LIMITED- Business overview- Products offered- Pipeline productsYANGTZE RIVER PHARMACEUTICAL GROUP- Business overview- Products offeredLIVEALTH BIOPHARMA- Business overview- Products offeredBEIJING BEILU PHARMACEUTICAL CO., LTD.- Business overview- Products offered- Recent developments
-
15.2 OTHER PLAYERSUNISPIRE BIOPHARMA PRIVATE LIMITEDARCO LIFESCIENCES (I) PVT. LTD.STANEX DRUGS & CHEMICALS PVT. LTD.REGE IMAGING & CINE FILMS PRIVATE LIMITEDK DIAM EXIMONKO ILAÇ SAN. VE TIC. A.S.FRESENIUS KABIBIEM ILAÇ SAN. VE TIC. A.S.ADVACARE PHARMA
- 16.1 DISCUSSION GUIDE
- 16.2 KNOWLEDGESTORE: MARKETSANDMARKETS’ SUBSCRIPTION PORTAL
- 16.3 CUSTOMIZATION OPTIONS
- 16.4 RELATED REPORTS
- 16.5 AUTHOR DETAILS
- TABLE 1 RISK ASSESSMENT ANALYSIS
- TABLE 2 CANCER INCIDENCE, BY REGION, 2020 VS. 2030 VS. 2040 (MILLION)
- TABLE 3 PROJECTED INCREASE IN GLOBAL NUMBER OF CANCER PATIENTS, 2020 VS. 2030 VS. 2040
- TABLE 4 NUMBER OF MRI EXAMS PERFORMED PER 1,000 INHABITANTS, BY COUNTRY, 2019–2021
- TABLE 5 NUMBER OF CT EXAMS PERFORMED PER 1,000 INHABITANTS, BY COUNTRY, 2019–2021
- TABLE 6 LIST OF BENEFICIARY HOSPITALS OF NHS WALES
- TABLE 7 LIST OF SIDE-EFFECTS/REACTIONS TO CONTRAST MEDIA
- TABLE 8 INDICATIVE LIST OF RESEARCH STUDIES
- TABLE 9 US: METROPOLITAN AREAS WITH HIGH EMPLOYMENT LEVELS FOR RADIOLOGY TECHNOLOGISTS AND TECHNICIANS, 2022
- TABLE 10 INDICATIVE LIST OF REGULATORY AUTHORITIES GOVERNING CONTRAST MEDIA MARKET
- TABLE 11 LIST OF CONFERENCES & EVENTS IN CONTRAST MEDIA MARKET
- TABLE 12 AVERAGE SELLING PRICE OF CONTRAST MEDIA
- TABLE 13 IMPORT DATA FOR OPACIFYING PREPARATIONS FOR X-RAY EXAMINATIONS AND DIAGNOSTIC REAGENTS FOR ADMINISTRATION TO PATIENTS, BY COUNTRY, 2018–2022 (USD MILLION)
- TABLE 14 EXPORT DATA FOR OPACIFYING PREPARATIONS FOR X-RAY EXAMINATIONS AND DIAGNOSTIC REAGENTS FOR ADMINISTRATION TO PATIENTS, BY COUNTRY, 2018–2022 (USD MILLION)
- TABLE 15 ROLE IN ECOSYSTEM
- TABLE 16 INFLUENCE OF STAKEHOLDERS ON BUYING PROCESS FOR END USERS (%)
- TABLE 17 KEY BUYING CRITERIA FOR END USERS
- TABLE 18 CONTRAST MEDIA MARKET, BY TYPE, 2021–2029 (USD MILLION)
- TABLE 19 IODINATED CONTRAST MEDIA MARKET, BY REGION, 2021–2029 (USD MILLION)
- TABLE 20 IODINATED CONTRAST MEDIA MARKET, BY COUNTRY, 2021–2029 (USD MILLION)
- TABLE 21 GADOLINIUM-BASED CONTRAST MEDIA MARKET, BY REGION, 2021–2029 (USD MILLION)
- TABLE 22 GADOLINIUM-BASED CONTRAST MEDIA MARKET, BY COUNTRY, 2021–2029 (USD MILLION)
- TABLE 23 MICROBUBBLE CONTRAST MEDIA MARKET, BY REGION, 2021–2029 (USD MILLION)
- TABLE 24 MICROBUBBLE CONTRAST MEDIA MARKET, BY COUNTRY, 2021–2029 (USD MILLION)
- TABLE 25 BARIUM-BASED CONTRAST MEDIA MARKET, BY REGION, 2021–2029 (USD MILLION)
- TABLE 26 BARIUM-BASED CONTRAST MEDIA MARKET, BY COUNTRY, 2021–2029 (USD MILLION)
- TABLE 27 CONTRAST MEDIA MARKET, BY FORM, 2021–2029 (USD MILLION)
- TABLE 28 LIQUID CONTRAST MEDIA MARKET, BY REGION, 2021–2029 (USD MILLION)
- TABLE 29 POWDER CONTRAST MEDIA MARKET, BY REGION, 2021–2029 (USD MILLION)
- TABLE 30 CONTRAST MEDIA MARKET FOR OTHER FORMS, BY REGION, 2021–2029 (USD MILLION)
- TABLE 31 NUMBER OF PROCEDURES PERFORMED, BY MODALITY, 2017–2020
- TABLE 32 CONTRAST MEDIA/CONTRAST AGENTS MARKET, BY MODALITY, 2021–2029 (MILLION LITERS)
- TABLE 33 CONTRAST MEDIA MARKET, BY MODALITY, 2021–2029 (USD MILLION)
- TABLE 34 UK: NUMBER OF X-RAY TESTS PERFORMED, 2012–2020
- TABLE 35 CONTRAST MEDIA MARKET FOR X-RAY, BY REGION, 2021–2029 (USD MILLION)
- TABLE 36 CONTRAST MEDIA MARKET FOR X-RAY, BY COUNTRY, 2021–2029 (USD MILLION)
- TABLE 37 NUMBER OF CT SCANNERS PER 1,000 INHABITANTS, BY COUNTRY, 2020 VS. 2021
- TABLE 38 UK: NUMBER OF CT SCANS PERFORMED, 2012–2020
- TABLE 39 CONTRAST MEDIA MARKET FOR CT, BY REGION, 2021–2029 (USD MILLION)
- TABLE 40 CONTRAST MEDIA MARKET FOR CT, BY COUNTRY, 2021–2029 (USD MILLION)
- TABLE 41 NUMBER OF MRI UNITS PER 1,000 INHABITANTS, BY COUNTRY, 2019 VS. 2020 VS. 2021
- TABLE 42 UK: NUMBER OF MRI TESTS PERFORMED, 2012–2020
- TABLE 43 CONTRAST MEDIA MARKET FOR MRI, BY REGION, 2021–2029 (USD MILLION)
- TABLE 44 CONTRAST MEDIA MARKET FOR MRI, BY COUNTRY, 2021–2029 (USD MILLION)
- TABLE 45 UK: NUMBER OF ULTRASOUND TESTS PERFORMED, 2012–2020
- TABLE 46 CONTRAST MEDIA MARKET FOR ULTRASOUND, BY REGION, 2021–2029 (USD MILLION)
- TABLE 47 CONTRAST MEDIA MARKET FOR ULTRASOUND, BY COUNTRY, 2021–2029 (USD MILLION)
- TABLE 48 CONTRAST MEDIA MARKET, BY ROUTE OF ADMINISTRATION, 2021–2029 (USD MILLION)
- TABLE 49 CONTRAST MEDIA MARKET FOR INTRAVASCULAR ROUTE, BY REGION, 2021–2029 (USD MILLION)
- TABLE 50 CONTRAST MEDIA MARKET FOR INTRAVASCULAR ROUTE, BY COUNTRY, 2021–2029 (USD MILLION)
- TABLE 51 CONTRAST MEDIA MARKET FOR ORAL ROUTE, BY REGION, 2021–2029 (USD MILLION)
- TABLE 52 CONTRAST MEDIA MARKET FOR ORAL ROUTE, BY COUNTRY, 2021–2029 (USD MILLION)
- TABLE 53 CONTRAST MEDIA MARKET FOR RECTAL ROUTE, BY REGION, 2021–2029 (USD MILLION)
- TABLE 54 CONTRAST MEDIA MARKET FOR RECTAL ROUTE, BY COUNTRY, 2021–2029 (USD MILLION)
- TABLE 55 CONTRAST MEDIA MARKET FOR OTHER ROUTES, BY REGION, 2021–2029 (USD MILLION)
- TABLE 56 CONTRAST MEDIA MARKET FOR OTHER ROUTES, BY COUNTRY, 2021–2029 (USD MILLION)
- TABLE 57 CONTRAST MEDIA MARKET, BY INDICATION, 2021–2029 (USD MILLION)
- TABLE 58 CONTRAST MEDIA MARKET FOR CARDIOVASCULAR DISEASE, BY REGION, 2021–2029 (USD MILLION)
- TABLE 59 CONTRAST MEDIA MARKET FOR CARDIOVASCULAR DISEASE, BY COUNTRY, 2021–2029 (USD MILLION)
- TABLE 60 CANCER INCIDENCE, BY REGION, 2020 VS. 2035 (MILLION)
- TABLE 61 CONTRAST MEDIA MARKET FOR CANCER, BY REGION, 2021–2029 (USD MILLION)
- TABLE 62 CONTRAST MEDIA MARKET FOR CANCER, BY COUNTRY, 2021–2029 (USD MILLION)
- TABLE 63 CONTRAST MEDIA MARKET FOR GASTROINTESTINAL DISORDERS, BY REGION, 2021–2029 (USD MILLION)
- TABLE 64 CONTRAST MEDIA MARKET FOR GASTROINTESTINAL DISORDERS, BY COUNTRY, 2021–2029 (USD MILLION)
- TABLE 65 CONTRAST MEDIA MARKET FOR MUSCULOSKELETAL DISORDERS, BY REGION, 2021–2029 (USD MILLION)
- TABLE 66 CONTRAST MEDIA MARKET FOR MUSCULOSKELETAL DISORDERS, BY COUNTRY, 2021–2029 (USD MILLION)
- TABLE 67 CONTRAST MEDIA MARKET FOR NEUROLOGICAL DISORDERS, BY REGION, 2021–2029 (USD MILLION)
- TABLE 68 CONTRAST MEDIA MARKET FOR NEUROLOGICAL DISORDERS, BY COUNTRY, 2021–2029 (USD MILLION)
- TABLE 69 CONTRAST MEDIA MARKET FOR NEPHROLOGICAL DISORDERS, BY REGION, 2021–2029 (USD MILLION)
- TABLE 70 CONTRAST MEDIA MARKET FOR NEPHROLOGICAL DISORDERS, BY COUNTRY, 2021–2029 (USD MILLION)
- TABLE 71 CONTRAST MEDIA MARKET, BY APPLICATION, 2021–2029 (USD MILLION)
- TABLE 72 CONTRAST MEDIA MARKET FOR RADIOLOGY, BY REGION, 2021–2029 (USD MILLION)
- TABLE 73 CONTRAST MEDIA MARKET FOR RADIOLOGY, BY COUNTRY, 2021–2029 (USD MILLION)
- TABLE 74 CONTRAST MEDIA MARKET FOR INTERVENTIONAL RADIOLOGY, BY REGION, 2021–2029 (USD MILLION)
- TABLE 75 CONTRAST MEDIA MARKET FOR INTERVENTIONAL RADIOLOGY, BY COUNTRY, 2021–2029 (USD MILLION)
- TABLE 76 CONTRAST MEDIA MARKET FOR INTERVENTIONAL CARDIOLOGY, BY REGION, 2021–2029 (USD MILLION)
- TABLE 77 CONTRAST MEDIA MARKET FOR INTERVENTIONAL CARDIOLOGY, BY COUNTRY, 2021–2029 (USD MILLION)
- TABLE 78 CONTRAST MEDIA MARKET, BY END USER, 2021–2029 (USD MILLION)
- TABLE 79 CONTRAST MEDIA MARKET FOR HOSPITALS, CLINICS, AND AMBULATORY SURGERY CENTERS, BY REGION, 2021–2029 (USD MILLION)
- TABLE 80 CONTRAST MEDIA MARKET FOR HOSPITALS, CLINICS, AND AMBULATORY SURGERY CENTERS, BY COUNTRY, 2021–2029 (USD MILLION)
- TABLE 81 CONTRAST MEDIA MARKET FOR DIAGNOSTIC IMAGING CENTERS, BY REGION, 2021–2029 (USD MILLION)
- TABLE 82 CONTRAST MEDIA MARKET FOR DIAGNOSTIC IMAGING CENTERS, BY COUNTRY, 2021–2029 (USD MILLION)
- TABLE 83 CONTRAST MEDIA MARKET, BY REGION, 2021–2029 (USD MILLION)
- TABLE 84 NORTH AMERICA: CONTRAST MEDIA MARKET, BY COUNTRY, 2021–2029 (USD MILLION)
- TABLE 85 NORTH AMERICA: CONTRAST MEDIA MARKET, BY TYPE, 2021–2029 (USD MILLION)
- TABLE 86 NORTH AMERICA: CONTRAST MEDIA MARKET, BY FORM, 2021–2029 (USD MILLION)
- TABLE 87 NORTH AMERICA: CONTRAST MEDIA MARKET, BY MODALITY, 2021–2029 (USD MILLION)
- TABLE 88 NORTH AMERICA: CONTRAST MEDIA MARKET, BY ROUTE OF ADMINISTRATION, 2021–2029 (USD MILLION)
- TABLE 89 NORTH AMERICA: CONTRAST MEDIA MARKET, BY INDICATION, 2021–2029 (USD MILLION)
- TABLE 90 NORTH AMERICA: CONTRAST MEDIA MARKET, BY APPLICATION, 2021–2029 (USD MILLION)
- TABLE 91 NORTH AMERICA: CONTRAST MEDIA MARKET, BY END USER, 2021–2029 (USD MILLION)
- TABLE 92 US: KEY MACROINDICATORS
- TABLE 93 US: CONTRAST MEDIA MARKET, BY TYPE, 2021–2029 (USD MILLION)
- TABLE 94 US: CONTRAST MEDIA MARKET, BY MODALITY, 2021–2029 (USD MILLION)
- TABLE 95 US: CONTRAST MEDIA MARKET, BY ROUTE OF ADMINISTRATION, 2021–2029 (USD MILLION)
- TABLE 96 US: CONTRAST MEDIA MARKET, BY APPLICATION, 2021–2029 (USD MILLION)
- TABLE 97 US: CONTRAST MEDIA MARKET, BY INDICATION, 2021–2029 (USD MILLION)
- TABLE 98 US: CONTRAST MEDIA MARKET, BY END USER, 2021–2029 (USD MILLION)
- TABLE 99 CANADA: KEY MACROINDICATORS
- TABLE 100 CANADA: CONTRAST MEDIA MARKET, BY TYPE, 2021–2029 (USD MILLION)
- TABLE 101 CANADA: CONTRAST MEDIA MARKET, BY MODALITY, 2021–2029 (USD MILLION)
- TABLE 102 CANADA: CONTRAST MEDIA MARKET, BY ROUTE OF ADMINISTRATION, 2021–2029 (USD MILLION)
- TABLE 103 CANADA: CONTRAST MEDIA MARKET, BY INDICATION, 2021–2029 (USD MILLION)
- TABLE 104 CANADA: CONTRAST MEDIA MARKET, BY APPLICATION, 2021–2029 (USD MILLION)
- TABLE 105 CANADA: CONTRAST MEDIA MARKET, BY END USER, 2021–2029 (USD MILLION)
- TABLE 106 EUROPE: NUMBER OF MRI UNITS PER 1,000,000 INHABITANTS, BY COUNTRY, 2021
- TABLE 107 EUROPE: NUMBER OF MRI EXAMS PER 1,000 INHABITANTS, BY COUNTRY, 2021
- TABLE 108 EUROPE: CONTRAST MEDIA MARKET, BY COUNTRY, 2021–2029 (USD MILLION)
- TABLE 109 EUROPE: CONTRAST MEDIA MARKET, BY TYPE, 2021–2029 (USD MILLION)
- TABLE 110 EUROPE: CONTRAST MEDIA MARKET, BY FORM, 2021–2029 (USD MILLION)
- TABLE 111 EUROPE: CONTRAST MEDIA MARKET, BY MODALITY, 2021–2029 (USD MILLION)
- TABLE 112 EUROPE: CONTRAST MEDIA MARKET, BY ROUTE OF ADMINISTRATION, 2021–2029 (USD MILLION)
- TABLE 113 EUROPE: CONTRAST MEDIA MARKET, BY INDICATION, 2021–2029 (USD MILLION)
- TABLE 114 EUROPE: CONTRAST MEDIA MARKET, BY APPLICATION, 2021–2029 (USD MILLION)
- TABLE 115 EUROPE: CONTRAST MEDIA MARKET, BY END USER, 2021–2029 (USD MILLION)
- TABLE 116 GERMANY: KEY MACROINDICATORS
- TABLE 117 GERMANY: CONTRAST MEDIA MARKET, BY TYPE, 2021–2029 (USD MILLION)
- TABLE 118 GERMANY: CONTRAST MEDIA MARKET, BY MODALITY, 2021–2029 (USD MILLION)
- TABLE 119 GERMANY: CONTRAST MEDIA MARKET, BY ROUTE OF ADMINISTRATION, 2021–2029 (USD MILLION)
- TABLE 120 GERMANY: CONTRAST MEDIA MARKET, BY INDICATION, 2021–2029 (USD MILLION)
- TABLE 121 GERMANY: CONTRAST MEDIA MARKET, BY APPLICATION, 2021–2029 (USD MILLION)
- TABLE 122 GERMANY: CONTRAST MEDIA MARKET, BY END USER, 2021–2029 (USD MILLION)
- TABLE 123 FRANCE: KEY MACROINDICATORS
- TABLE 124 FRANCE: CONTRAST MEDIA MARKET, BY TYPE, 2021–2029 (USD MILLION)
- TABLE 125 FRANCE: CONTRAST MEDIA MARKET, BY MODALITY, 2021–2029 (USD MILLION)
- TABLE 126 FRANCE: CONTRAST MEDIA MARKET, BY ROUTE OF ADMINISTRATION, 2021–2029 (USD MILLION)
- TABLE 127 FRANCE: CONTRAST MEDIA MARKET, BY INDICATION, 2021–2029 (USD MILLION)
- TABLE 128 FRANCE: CONTRAST MEDIA MARKET, BY APPLICATION, 2021–2029 (USD MILLION)
- TABLE 129 FRANCE: CONTRAST MEDIA MARKET, BY END USER, 2021–2029 (USD MILLION)
- TABLE 130 UK: KEY MACROINDICATORS
- TABLE 131 UK: CONTRAST MEDIA MARKET, BY TYPE, 2021–2029 (USD MILLION)
- TABLE 132 UK: CONTRAST MEDIA MARKET, BY MODALITY, 2021–2029 (USD MILLION)
- TABLE 133 UK: CONTRAST MEDIA MARKET, BY ROUTE OF ADMINISTRATION, 2021–2029 (USD MILLION)
- TABLE 134 UK: CONTRAST MEDIA MARKET, BY INDICATION, 2021–2029 (USD MILLION)
- TABLE 135 UK: CONTRAST MEDIA MARKET, BY APPLICATION, 2021–2029 (USD MILLION)
- TABLE 136 UK: CONTRAST MEDIA MARKET, BY END USER, 2021–2029 (USD MILLION)
- TABLE 137 ITALY: KEY MACROINDICATORS
- TABLE 138 ITALY: CONTRAST MEDIA MARKET, BY TYPE, 2021–2029 (USD MILLION)
- TABLE 139 ITALY: CONTRAST MEDIA MARKET, BY MODALITY, 2021–2029 (USD MILLION)
- TABLE 140 ITALY: CONTRAST MEDIA MARKET, BY ROUTE OF ADMINISTRATION, 2021–2029 (USD MILLION)
- TABLE 141 ITALY: CONTRAST MEDIA MARKET, BY INDICATION, 2021–2029 (USD MILLION)
- TABLE 142 ITALY: CONTRAST MEDIA MARKET, BY APPLICATION, 2021–2029 (USD MILLION)
- TABLE 143 ITALY: CONTRAST MEDIA MARKET, BY END USER, 2021–2029 (USD MILLION)
- TABLE 144 SPAIN: KEY MACROINDICATORS
- TABLE 145 SPAIN: CONTRAST MEDIA MARKET, BY TYPE, 2021–2029 (USD MILLION)
- TABLE 146 SPAIN: CONTRAST MEDIA MARKET, BY MODALITY, 2021–2029 (USD MILLION)
- TABLE 147 SPAIN: CONTRAST MEDIA MARKET, BY ROUTE OF ADMINISTRATION, 2021–2029 (USD MILLION)
- TABLE 148 SPAIN: CONTRAST MEDIA MARKET, BY INDICATION, 2021–2029 (USD MILLION)
- TABLE 149 SPAIN: CONTRAST MEDIA MARKET, BY APPLICATION, 2021–2029 (USD MILLION)
- TABLE 150 SPAIN: CONTRAST MEDIA MARKET, BY END USER, 2021–2029 (USD MILLION)
- TABLE 151 REST OF EUROPE: HEALTHCARE EXPENDITURE PER CAPITA, BY COUNTRY, 2021 VS. 2022
- TABLE 152 REST OF EUROPE: NUMBER OF MRI AND CT UNITS AND SCANS, BY COUNTRY, 2021
- TABLE 153 REST OF EUROPE: CONTRAST MEDIA MARKET, BY TYPE, 2021–2029 (USD MILLION)
- TABLE 154 REST OF EUROPE: CONTRAST MEDIA MARKET, BY MODALITY, 2021–2029 (USD MILLION)
- TABLE 155 REST OF EUROPE: CONTRAST MEDIA MARKET, BY ROUTE OF ADMINISTRATION, 2021–2029 (USD MILLION)
- TABLE 156 REST OF EUROPE: CONTRAST MEDIA MARKET, BY INDICATION, 2021–2029 (USD MILLION)
- TABLE 157 REST OF EUROPE: CONTRAST MEDIA MARKET, BY APPLICATION, 2021–2029 (USD MILLION)
- TABLE 158 REST OF EUROPE: CONTRAST MEDIA MARKET, BY END USER, 2021–2029 (USD MILLION)
- TABLE 159 ASIA PACIFIC: CONTRAST MEDIA MARKET, BY COUNTRY, 2021–2029 (USD MILLION)
- TABLE 160 ASIA PACIFIC: CONTRAST MEDIA MARKET, BY TYPE, 2021–2029 (USD MILLION)
- TABLE 161 ASIA PACIFIC: CONTRAST MEDIA MARKET, BY FORM, 2021–2029 (USD MILLION)
- TABLE 162 ASIA PACIFIC: CONTRAST MEDIA MARKET, BY MODALITY, 2021–2029 (USD MILLION)
- TABLE 163 ASIA PACIFIC: CONTRAST MEDIA MARKET, BY ROUTE OF ADMINISTRATION, 2021–2029 (USD MILLION)
- TABLE 164 ASIA PACIFIC: CONTRAST MEDIA MARKET, BY APPLICATION, 2021–2029 (USD MILLION)
- TABLE 165 ASIA PACIFIC: CONTRAST MEDIA MARKET, BY INDICATION, 2021–2029 (USD MILLION)
- TABLE 166 ASIA PACIFIC: CONTRAST MEDIA MARKET, BY END USER, 2021–2029 (USD MILLION)
- TABLE 167 CHINA: KEY MACROINDICATORS
- TABLE 168 CHINA: CONTRAST MEDIA MARKET, BY TYPE, 2021–2029 (USD MILLION)
- TABLE 169 CHINA: CONTRAST MEDIA MARKET, BY MODALITY, 2021–2029 (USD MILLION)
- TABLE 170 CHINA: CONTRAST MEDIA MARKET, BY ROUTE OF ADMINISTRATION, 2021–2029 (USD MILLION)
- TABLE 171 CHINA: CONTRAST MEDIA MARKET, BY APPLICATION, 2021–2029 (USD MILLION)
- TABLE 172 CHINA: CONTRAST MEDIA MARKET, BY INDICATION, 2021–2029 (USD MILLION)
- TABLE 173 CHINA: CONTRAST MEDIA MARKET, BY END USER, 2021–2029 (USD MILLION)
- TABLE 174 JAPAN: KEY MACROINDICATORS
- TABLE 175 JAPAN: CONTRAST MEDIA MARKET, BY TYPE, 2021–2029 (USD MILLION)
- TABLE 176 JAPAN: CONTRAST MEDIA MARKET, BY MODALITY, 2021–2029 (USD MILLION)
- TABLE 177 JAPAN: CONTRAST MEDIA MARKET, BY ROUTE OF ADMINISTRATION, 2021–2029 (USD MILLION)
- TABLE 178 JAPAN: CONTRAST MEDIA MARKET, BY APPLICATION, 2021–2029 (USD MILLION)
- TABLE 179 JAPAN: CONTRAST MEDIA MARKET, BY INDICATION, 2021–2029 (USD MILLION)
- TABLE 180 JAPAN: CONTRAST MEDIA MARKET, BY END USER, 2021–2029 (USD MILLION)
- TABLE 181 INDIA: KEY MACROINDICATORS
- TABLE 182 INDIA: CONTRAST MEDIA MARKET, BY TYPE, 2021–2029 (USD MILLION)
- TABLE 183 INDIA: CONTRAST MEDIA MARKET, BY MODALITY, 2021–2029 (USD MILLION)
- TABLE 184 INDIA: CONTRAST MEDIA MARKET, BY ROUTE OF ADMINISTRATION, 2021–2029 (USD MILLION)
- TABLE 185 INDIA: CONTRAST MEDIA MARKET, BY APPLICATION, 2021–2029 (USD MILLION)
- TABLE 186 INDIA: CONTRAST MEDIA MARKET, BY INDICATION, 2021–2029 (USD MILLION)
- TABLE 187 INDIA: CONTRAST MEDIA MARKET, BY END USER, 2021–2029 (USD MILLION)
- TABLE 188 AUSTRALIA: KEY MACROINDICATORS
- TABLE 189 AUSTRALIA: CONTRAST MEDIA MARKET, BY TYPE, 2021–2029 (USD MILLION)
- TABLE 190 AUSTRALIA: CONTRAST MEDIA MARKET, BY MODALITY, 2021–2029 (USD MILLION)
- TABLE 191 AUSTRALIA: CONTRAST MEDIA MARKET, BY ROUTE OF ADMINISTRATION, 2021–2029 (USD MILLION)
- TABLE 192 AUSTRALIA: CONTRAST MEDIA MARKET, BY APPLICATION, 2021–2029 (USD MILLION)
- TABLE 193 AUSTRALIA: CONTRAST MEDIA MARKET, BY INDICATION, 2021–2029 (USD MILLION)
- TABLE 194 AUSTRALIA: CONTRAST MEDIA MARKET, BY END USER, 2021–2029 (USD MILLION)
- TABLE 195 NUMBER OF MRI AND CT UNITS PER MILLION POPULATION, BY COUNTRY, 2021
- TABLE 196 REST OF ASIA PACIFIC: CONTRAST MEDIA MARKET, BY TYPE, 2021–2029 (USD MILLION)
- TABLE 197 REST OF ASIA PACIFIC: CONTRAST MEDIA MARKET, BY MODALITY, 2021–2029 (USD MILLION)
- TABLE 198 REST OF ASIA PACIFIC: CONTRAST MEDIA MARKET, BY ROUTE OF ADMINISTRATION, 2021–2029 (USD MILLION)
- TABLE 199 REST OF ASIA PACIFIC: CONTRAST MEDIA MARKET, BY APPLICATION, 2021–2029 (USD MILLION)
- TABLE 200 REST OF ASIA PACIFIC: CONTRAST MEDIA MARKET, BY INDICATION, 2021–2029 (USD MILLION)
- TABLE 201 REST OF ASIA PACIFIC: CONTRAST MEDIA MARKET, BY END USER, 2021–2029 (USD MILLION)
- TABLE 202 REST OF THE WORLD: CONTRAST MEDIA MARKET, BY REGION, 2021–2029 (USD MILLION)
- TABLE 203 REST OF THE WORLD: CONTRAST MEDIA MARKET, BY TYPE, 2021–2029 (USD MILLION)
- TABLE 204 REST OF THE WORLD: CONTRAST MEDIA MARKET, BY FORM, 2021–2029 (USD MILLION)
- TABLE 205 REST OF THE WORLD: CONTRAST MEDIA MARKET, BY MODALITY, 2021–2029 (USD MILLION)
- TABLE 206 REST OF THE WORLD: CONTRAST MEDIA MARKET, BY ROUTE OF ADMINISTRATION, 2021–2029 (USD MILLION)
- TABLE 207 REST OF THE WORLD: CONTRAST MEDIA MARKET, BY INDICATION, 2021–2029 (USD MILLION)
- TABLE 208 REST OF THE WORLD: CONTRAST MEDIA MARKET, BY APPLICATION, 2021–2029 (USD MILLION)
- TABLE 209 REST OF THE WORLD: CONTRAST MEDIA MARKET, BY END USER, 2021–2029 (USD MILLION)
- TABLE 210 LATIN AMERICA: CONTRAST MEDIA MARKET, BY TYPE, 2021–2029 (USD MILLION)
- TABLE 211 LATIN AMERICA: CONTRAST MEDIA MARKET, BY MODALITY, 2021–2029 (USD MILLION)
- TABLE 212 LATIN AMERICA: CONTRAST MEDIA MARKET, BY ROUTE OF ADMINISTRATION, 2021–2029 (USD MILLION)
- TABLE 213 LATIN AMERICA: CONTRAST MEDIA MARKET, BY INDICATION, 2021–2029 (USD MILLION)
- TABLE 214 LATIN AMERICA: CONTRAST MEDIA MARKET, BY APPLICATION, 2021–2029 (USD MILLION)
- TABLE 215 LATIN AMERICA: CONTRAST MEDIA MARKET, BY END USER, 2021–2029 (USD MILLION)
- TABLE 216 ISRAEL: DIAGNOSTIC IMAGING DATA, 2022
- TABLE 217 MIDDLE EAST & AFRICA: CONTRAST MEDIA MARKET, BY TYPE, 2021–2029 (USD MILLION)
- TABLE 218 MIDDLE EAST & AFRICA: CONTRAST MEDIA MARKET, BY MODALITY, 2021–2029 (USD MILLION)
- TABLE 219 MIDDLE EAST & AFRICA: CONTRAST MEDIA MARKET, BY ROUTE OF ADMINISTRATION, 2021–2029 (USD MILLION)
- TABLE 220 MIDDLE EAST & AFRICA: CONTRAST MEDIA MARKET, BY INDICATION, 2021–2029 (USD MILLION)
- TABLE 221 MIDDLE EAST & AFRICA: CONTRAST MEDIA MARKET, BY APPLICATION, 2021–2029 (USD MILLION)
- TABLE 222 MIDDLE EAST & AFRICA: CONTRAST MEDIA MARKET, BY END USER, 2021–2029 (USD MILLION)
- TABLE 223 GCC COUNTRIES: CONTRAST MEDIA MARKET, BY TYPE, 2021–2029 (USD MILLION)
- TABLE 224 GCC COUNTRIES: CONTRAST MEDIA MARKET, BY MODALITY, 2021–2029 (USD MILLION)
- TABLE 225 GCC COUNTRIES: CONTRAST MEDIA MARKET, BY ROUTE OF ADMINISTRATION, 2021–2029 (USD MILLION)
- TABLE 226 GCC COUNTRIES: CONTRAST MEDIA MARKET, BY INDICATION, 2021–2029 (USD MILLION)
- TABLE 227 GCC COUNTRIES: CONTRAST MEDIA MARKET, BY APPLICATION, 2021–2029 (USD MILLION)
- TABLE 228 GCC COUNTRIES: CONTRAST MEDIA MARKET, BY END USER, 2021–2029 (USD MILLION)
- TABLE 229 OVERVIEW OF STRATEGIES ADOPTED BY KEY PLAYERS IN CONTRAST MEDIA MARKET
- TABLE 230 CONTRAST MEDIA MARKET: DEGREE OF COMPETITION
- TABLE 231 FOOTPRINT ANALYSIS
- TABLE 232 TYPE FOOTPRINT
- TABLE 233 REGIONAL FOOTPRINT
- TABLE 234 CONTRAST MEDIA MARKET: KEY STARTUPS/SMES
- TABLE 235 CONTRAST MEDIA MARKET: PRODUCT LAUNCHES & APPROVALS, JANUARY 2020–DECEMBER 2023
- TABLE 236 CONTRAST MEDIA MARKET: DEALS, JANUARY 2020–DECEMBER 2023
- TABLE 237 CONTRAST MEDIA MARKET: OTHER DEVELOPMENTS, JANUARY 2020–DECEMBER 2023
- TABLE 238 BRAND/PRODUCT COMPARISON (IODINATED CONTRAST MEDIA)
- TABLE 239 BRAND/PRODUCT COMPARISON (GADOLINIUM-BASED CONTRAST MEDIA)
- TABLE 240 GE HEALTHCARE: BUSINESS OVERVIEW
- TABLE 241 BRACCO IMAGING SPA: BUSINESS OVERVIEW
- TABLE 242 BAYER AG: BUSINESS OVERVIEW
- TABLE 243 GUERBET: BUSINESS OVERVIEW
- TABLE 244 LANTHEUS MEDICAL IMAGING: BUSINESS OVERVIEW
- TABLE 245 UNIJULES LIFE SCIENCES LTD.: BUSINESS OVERVIEW
- TABLE 246 J.B. CHEMICALS & PHARMACEUTICALS LIMITED: BUSINESS OVERVIEW
- TABLE 247 SANOCHEMIA PHARMAZEUTIKA: BUSINESS OVERVIEW
- TABLE 248 TAEJOON PHARM CO., LTD.: BUSINESS OVERVIEW
- TABLE 249 JODAS EXPOIM: BUSINESS OVERVIEW
- TABLE 250 IMAX DIAGNOSTIC IMAGING LIMITED: BUSINESS OVERVIEW
- TABLE 251 YANGTZE RIVER PHARMACEUTICAL GROUP: BUSINESS OVERVIEW
- TABLE 252 LIVEALTH BIOPHARMA PVT. LTD.: BUSINESS OVERVIEW
- TABLE 253 BEIJING BEILU PHARMACEUTICAL CO., LTD.: BUSINESS OVERVIEW
- FIGURE 1 CONTRAST MEDIA MARKET SEGMENTATION
- FIGURE 2 RESEARCH DESIGN
- FIGURE 3 BREAKDOWN OF PRIMARY INTERVIEWS: SUPPLY-SIDE AND DEMAND-SIDE PARTICIPANTS
- FIGURE 4 BREAKDOWN OF PRIMARY INTERVIEWS: BY COMPANY TYPE, DESIGNATION, AND REGION
- FIGURE 5 REVENUE SHARE ANALYSIS
- FIGURE 6 CAGR PROJECTIONS: SUPPLY-SIDE ANALYSIS
- FIGURE 7 CONTRAST MEDIA MARKET: TOP-DOWN APPROACH
- FIGURE 8 DATA TRIANGULATION METHODOLOGY
- FIGURE 9 CONTRAST MEDIA MARKET, BY TYPE, 2023 VS. 2029 (USD BILLION)
- FIGURE 10 CONTRAST MEDIA MARKET, BY FORM, 2023 VS. 2029 (USD BILLION)
- FIGURE 11 CONTRAST MEDIA MARKET, BY MODALITY, 2023 VS. 2029 (USD BILLION)
- FIGURE 12 CONTRAST MEDIA MARKET, BY ROUTE OF ADMINISTRATION, 2023 VS. 2029 (USD BILLION)
- FIGURE 13 CONTRAST MEDIA MARKET, BY INDICATION, 2023 VS. 2029 (USD BILLION)
- FIGURE 14 CONTRAST MEDIA MARKET, BY APPLICATION, 2023 VS. 2029 (USD BILLION)
- FIGURE 15 CONTRAST MEDIA MARKET, BY END USER, 2023 VS. 2029 (USD BILLION)
- FIGURE 16 GEOGRAPHICAL SNAPSHOT OF CONTRAST MEDIA MARKET
- FIGURE 17 RISING PREVALENCE OF CHRONIC DISEASES TO DRIVE MARKET
- FIGURE 18 HOSPITALS, CLINICS, & AMBULATORY SURGERY CENTERS ACCOUNTED FOR LARGEST SHARE OF NORTH AMERICAN MARKET IN 2022
- FIGURE 19 ASIA PACIFIC TO WITNESS HIGHEST GROWTH DURING FORECAST PERIOD
- FIGURE 20 DEVELOPING MARKETS TO REGISTER HIGHER GROWTH DURING FORECAST PERIOD
- FIGURE 21 CHINA AND INDIA TO WITNESS HIGHEST GROWTH DURING FORECAST PERIOD
- FIGURE 22 CONTRAST MEDIA MARKET: DRIVERS, RESTRAINTS, OPPORTUNITIES, AND CHALLENGES
- FIGURE 23 VALUE CHAIN ANALYSIS: CONTRAST MEDIA MARKET
- FIGURE 24 SUPPLY CHAIN ANALYSIS: CONTRAST MEDIA MARKET
- FIGURE 25 PATENT ANALYSIS: IODINATED CONTRAST MEDIA
- FIGURE 26 PATENT ANALYSIS: GADOLINIUM-BASED CONTRAST MEDIA
- FIGURE 27 ECOSYSTEM ANALYSIS: CONTRAST MEDIA MARKET
- FIGURE 28 KEY PLAYERS OPERATING IN CONTRAST MEDIA MARKET
- FIGURE 29 INFLUENCE OF STAKEHOLDERS ON BUYING PROCESS FOR END USERS
- FIGURE 30 KEY BUYING CRITERIA FOR TOP END USERS
- FIGURE 31 NORTH AMERICA: CONTRAST MEDIA MARKET SNAPSHOT
- FIGURE 32 ASIA PACIFIC: CONTRAST MEDIA MARKET SNAPSHOT
- FIGURE 33 REVENUE ANALYSIS OF KEY PLAYERS IN CONTRAST MEDIA MARKET
- FIGURE 34 CONTRAST MEDIA MARKET SHARE, BY KEY PLAYER (2022)
- FIGURE 35 CONTRAST MEDIA MARKET: COMPANY EVALUATION MATRIX, 2022
- FIGURE 36 CONTRAST MEDIA MARKET: STARTUP/SME EVALUATION MATRIX, 2022
- FIGURE 37 GE HEALTHCARE: COMPANY SNAPSHOT (2022)
- FIGURE 38 BAYER AG: COMPANY SNAPSHOT (2022)
- FIGURE 39 GUERBET: COMPANY SNAPSHOT (2022)
- FIGURE 40 LANTHEUS MEDICAL IMAGING: COMPANY SNAPSHOT (2022)
- FIGURE 41 J.B. CHEMICALS & PHARMACEUTICALS LIMITED: COMPANY SNAPSHOT (2023)
The objective of the study is to analyze the key market dynamics such as drivers, opportunities, challenges, restraints, and key player strategies. To track company developments such as product launches and approvals, expansions, and collaborations of the leading players, the competitive landscape of the contrast media market to analyze market players on various parameters within the broad categories of business and product strategy. Top-down and bottom-up approaches were used to estimate the market size. To estimate the market size of segments and subsegments the market breakdown and data triangulation were used.
The four steps involved in estimating the market size are
Collecting Secondary Data
The secondary research data collection process involves the usage of secondary sources, directories, databases (such as Bloomberg Businessweek, Factiva, and D&B), annual reports, investor presentations, and SEC filings of companies. Secondary research was used to identify and collect information useful for the extensive, technical, market-oriented, and commercial study of the contrast media market. A database of the key industry leaders was also prepared using secondary research.
Collecting Primary Data
The primary research data was conducted after acquiring knowledge about the contrast media market scenario through secondary research. A significant number of primary interviews were conducted with stakeholders from both the demand side (such as doctors, nurses, and hospital purchase managers) and supply side (such as included various industry experts, such as Directors, Chief X Officers (CXOs), Vice Presidents (VPs) from business development, marketing and product development teams, product manufacturers, wholesalers, channel partners, and distributors) across major countries of North America, Europe, Asia Pacific, and Rest of the World. Approximately 45% of the primary interviews were conducted with stakeholders from the demand side while those from the supply side accounted for the remaining 55%. Primary data for this report was collected through questionnaires, emails, and telephonic interviews.
A breakdown of the primary respondents is provided below:
Breakdown of Primary Participants:
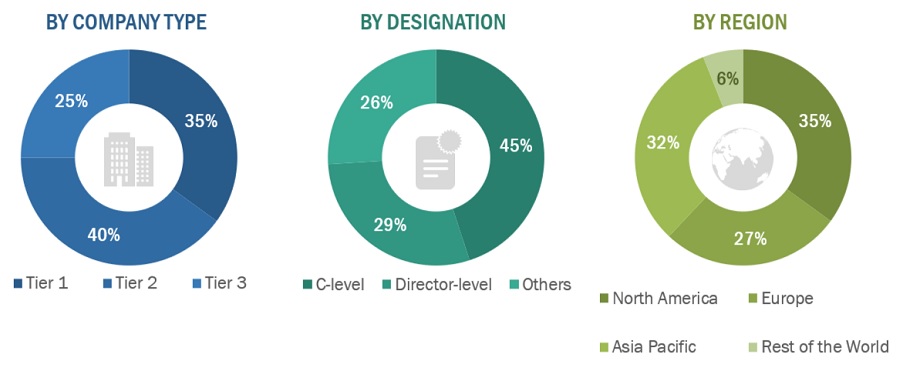
Note 1: Others include sales managers, marketing managers, and product managers.
Note 2: Tiers of companies are defined based on their total revenue. As of 2022, Tier 1 = >USD 5 billion, Tier 2 = USD 500 million to USD 5 billion, and Tier 3 = <USD 500 million.
To know about the assumptions considered for the study, download the pdf brochure
COMPANY NAME |
DESIGNATION |
Bracco Imaging S.p.A (Italy) |
Regional Sales Manager |
GE Healthcare (US) |
VP Marketing |
Guerbet (France) |
Product Manager |
Trivitron Healthcare (India) |
Distribution Head |
Market Size Estimation
All major product manufacturers offering various contrast media were identified at the global/regional level. Revenue mapping was done for the major players and was extrapolated to arrive at the global market value of each type of segment. The market value contrast media market was also split into various segments and subsegments at the region and country level based on:
- Product mapping of various manufacturers for each type of contrast media market at the regional and country-level
- Relative adoption pattern of each contrast media market among key application segments at the regional and/or country-level
- Detailed primary research to gather qualitative and quantitative information related to segments and subsegments at the regional and/or country level.
- Detailed secondary research to gauge the prevailing market trends at the regional and/or country level
Global Contrast Media Market Size: Bottom Up Approach
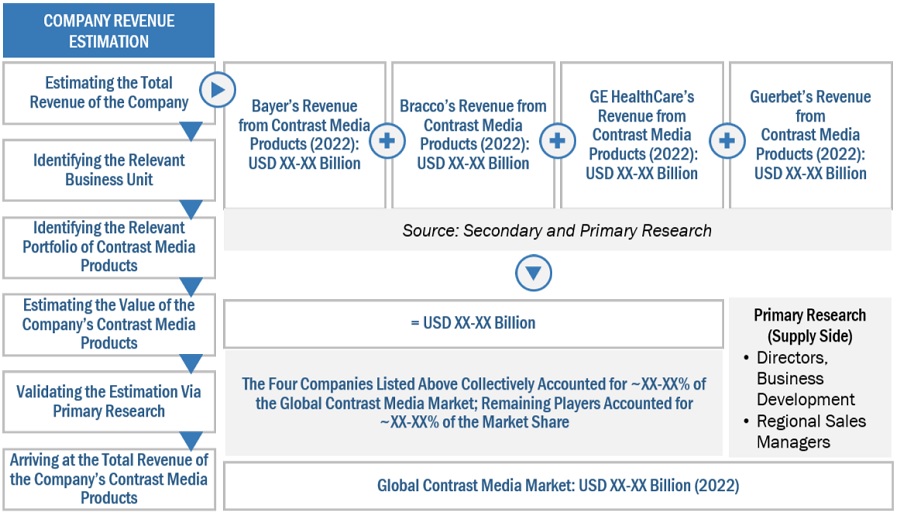
To know about the assumptions considered for the study, Request for Free Sample Report
Global Contrast Media Market Size: Top Down Approach
Data Triangulation
After arriving at the overall market size—using the market size estimation processes—the market was split into several segments and subsegments. To complete the overall market engineering process and arrive at the exact statistics of each market segment and subsegment, the data triangulation, and market breakdown procedures were employed, wherever applicable. The data was triangulated by studying various factors and trends from both the demand and supply sides in the contrast media industry.
Market Definition
Contrast media are chemical agents used in diagnostic imaging procedures. These formulations help in enhancing the images of body structures and organs when visualized during medical procedures like X-ray, CT, MRI, and ultrasound.
Key Stakeholders
- Senior Management
- End User
- Finance/Procurement Department
- R&D Department
Report Objectives
- To provide detailed information about the factors influencing the market growth (such as drivers, restraints, opportunities, and challenges)
- To define, describe, segment, and forecast the contrast media market by type, form, modality, route of administration, indication, application, end user, and region
- To analyze market opportunities for stakeholders and provide details of the competitive landscape for key players
- To analyze micromarkets with respect to individual growth trends, prospects, and contributions to the overall contrast media market
- To forecast the size of the contrast media market in four main regions along with their respective key countries, namely, North America, Europe, the Asia Pacific and Rest of the World
- To profile key players in the contrast media market and comprehensively analyze their core competencies and market shares
- To track and analyze competitive developments, such as product launches and approvals; expansions; and collaborations, of the leading players in the contrast media market
- To benchmark players within the contrast media market using the Competitive Leadership Mapping framework, which analyzes market players on various parameters within the broad categories of business and product strategy
Available Customizations
MarketsandMarkets offers the following customizations for this market report
Country Information
- Additional country-level analysis of the contrast media market
Company profiles
- Additional three company profiles of players operating in the contrast media market.
Product Analysis
- Product matrix, which provides a detailed comparison of the product portfolio of each company in the contrast media market
Growth opportunities and latent adjacency in Contrast Media Market
1) The contrast media/contrast agents market is segmented into barium-based contrast media, iodinated contrast media, gadolinium-based contrast media, and microbubble contrast media. In 2020, the iodinated contrast media segment accounted for the largest share of XX of the contrast media/contrast agents market. The large share of this segment can be attributed to the increasing demand for early disease diagnosis and image-guided procedures (resulting in a rising volume of CT and Xray procedures). 2) The barium-based contrast media market is expected to register low growth due to its limited use in various procedures and the associated adverse effects of these agents on organs. 3) Microbubble contrast agents are generally regarded as safe to use and are gaining popularity because of the large number of ongoing academic research activities exploring various attributes of microbubbles in off-label indications (in diagnosis as well as drug delivery). The growing number of approvals for microbubble contrast agents in major markets is also driving the growth of this market segment.
We need the list of vendors in Contrast Media Market. Please help
Can you please help us with study related to contrast media injectors market ?
We intend to import and sale to our customer non ionic contract media, X-Ray, Angiography, CT, MRI users, Please send us price list. M.Y.Zahid, [email protected]