Cloud Native Storage Market by Offering (Solutions and Services), Deployment Mode (Public and Private), Application (Backup & Recovery, Content Delivery & Distribution), Vertical (BFSI, Retail & Consumer Goods) and Region - Global Forecast to 2028
[296 Pages Report] The global cloud native storage market size is anticipated to grow at a CAGR of 23.3% during the forecast period, from USD 16.0 billion in 2023 to USD 45.8 billion by 2028. Automation and orchestration capabilities became essential for managing storage resources in dynamic cloud-native environments. Tools that could automatically provision, scale, and manage storage resources were in high demand.
To know about the assumptions considered for the study, Request for Free Sample Report
To know about the assumptions considered for the study, download the pdf brochure
Cloud Native Storage Market Dynamics
Drivers: Increase in data volume across enterprises
The automation of application updates has ushered in a new era of agility and efficiency in the world of cloud computing. As applications constantly evolve to meet user demands and adapt to changing environments, the need for cloud-native storage solutions has become increasingly apparent. Cloud-native storage is designed to seamlessly integrate with modern cloud-native applications' dynamic and automated nature. It offers scalability, resilience, and performance characteristics that traditional storage systems often struggle to provide in rapidly changing landscapes.
Restraints: Loss of data due to persistent data storing
Cloud-native storage solutions are designed to provide scalability, resilience, and flexibility to modern applications in cloud environments. However, one critical concern that needs to be addressed is the potential loss of data due to persistent data sorting. When data is constantly moved, distributed, or reorganized within a cloud-native storage system, there is a risk of inadvertent data loss or corruption. This can occur during data migrations, upgrades, or other maintenance activities. To mitigate this risk, it is crucial for organizations to implement robust data management strategies that include regular backups, versioning, and data integrity checks.
Opportunities: Proliferation of Kubernetes and containerization
Kubernetes adoption is increasing rapidly, making it more important to address ongoing operations and management at scale. Huge numbers of stateful applications mean that the management burden for applications is expected to grow along with the capacity needed to support them. Organizations need tools to help mitigate Kubernetes-based workloads’ complexity to prepare for ongoing operations and scalability. Several companies are implementing containerization to enhance their application’s portability and data from across computing environments. The containers help virtualize storage and other computing resources at the OS level and help developers in the logical isolation of applications. Cloud storage providers, including IBM, AWS, Alibaba Cloud, Microsoft, HPE, Dell, and Google, have added container technology in their cloud storage and cloud native storage solutions to enable persistent storage, with which running applications can easily consume the data on demand. Thus, containers combined with DevOps and cloud storage completely modernize application development, which is expected to create opportunities for cloud native storage providers.
Challenges: Lack of visibility in a distributed system
Cloud-native storage solutions, a significant challenge arises in the form of limited visibility. Unlike traditional on-premises storage setups where administrators enjoy a centralized view of their storage infrastructure, cloud-native environments scatter data across a multitude of containers, microservices, and cloud instances. This decentralized nature makes it exceedingly difficult to obtain a comprehensive understanding of storage performance, health, and resource utilization. Consequently, this lack of visibility can impede the timely resolution of issues, result in inefficient resource allocation, and complicate the identification and management of problems.
Cloud Native Storage Market Ecosystem
By Application, the Backup and Recovery segment holds the largest market size during the forecast period.
Backup and recovery play a crucial role in safeguarding data and ensuring business continuity. These applications are purpose-built to address the unique challenges of modern, dynamic, and often distributed IT environments. By seamlessly integrating with cloud-native technologies and containerized workloads, they provide a layer of resilience that ensures data is protected against loss, corruption, or disasters. These solutions enable organizations to efficiently create backups, perform granular recoveries, and maintain data integrity, thereby supporting the reliable and uninterrupted operation of cloud-native applications and services.
By Vertical, the BFSI segment holds the largest market size during the forecast period.
Cloud-native storage solutions for the Banking, Financial Services, and Insurance (BFSI) sector are designed to seamlessly integrate with modern cloud infrastructure, providing secure, scalable, and highly available data storage and management capabilities. These solutions leverage containerization, microservices, and orchestration technologies to ensure rapid deployment, efficient resource utilization, and flexibility in handling the diverse data needs of BFSI organizations. With built-in data encryption, compliance controls, and data replication features, cloud-native storage in BFSI ensures data integrity, disaster recovery, and regulatory compliance while enabling agile and cost-effective operations in the ever-evolving financial landscape.
North America to hold the largest market size during the forecast period.
The geographic analysis of the cloud native storage market is segmented into regions, including North America, Europe, Asia Pacific, Middle East & Africa, and Latin America. Cloud-native storage solutions in North America have rapidly evolved to meet the dynamic demands of modern applications and infrastructure. With a focus on scalability, agility, and resilience, these technologies leverage cloud-based platforms and containerization to efficiently store, manage, and access data. From popular solutions like Amazon EBS and S3 in AWS to Azure Blob Storage and Google Cloud Storage in GCP, organizations across North America are embracing these cloud-native storage options to ensure seamless data handling, high availability, and disaster recovery capabilities, enabling them to thrive in an increasingly digital and data-driven landscape.
Key Market Players
Some of the major cloud native storage market vendors are Microsoft (US), IBM (US), AWS (US), Google (US), Alibaba Cloud (China), VMWare (US), Huawei (China), Citrix (US), Scality (US), Splunk (US), Linbit (US), Rackspace (US), and Robin.Io (US) among others.
Want to explore hidden markets that can drive new revenue in Cloud Native Storage Market?
Scope of the Report
Want to explore hidden markets that can drive new revenue in Cloud Native Storage Market?
Report Metrics |
Details |
Market size available for years |
2017–2028 |
Base year considered |
2022 |
Forecast period |
2023–2028 |
Forecast units |
Million/Billion (USD) |
Segments Covered |
Offering, Application, Verticals, and Regions |
Geographies covered |
North America, Europe, APAC, Middle East & Africa, and Latin America |
Companies covered |
Microsoft (US), IBM (US), AWS (US), Google (US), Alibaba Cloud (China), VMWare (US), Huawei (China), Citrix (US), Tencent Cloud (China), Scality (US), Splunk (US), Linbit (US), Rackspace (US), and Robin.Io (US), MayaData (US), Diamanti (US), Minio (US), Rook (US), Ondat (UK), Ionir (US), Trilio (US), Upcloud (Finland), Arrikto (US). |
This research report categorizes the Cloud Native Storage Market to forecast revenue and analyze trends in each of the following submarkets:
By Offering:
-
Solutions
- File Storage
- Block Storage
- Object Storage
-
Solutions by deployment mode
- Public cloud
- Private cloud
-
Services
- Training & Consulting Services
- System Integration & Implementation Services
- Support & Maintenance
By Verticals:
- Banking, Financial Services, & Insurance (BFSI)
- Government & Public Sector
- Healthcare & Life Sciences
- Telecom
- IT & ITeS
- Manufacturing
- Energy & Utilities
- Media & Entertainment
- Retail & Consumer Goods
- Other Verticals
By Region:
-
North America
- US
- Canada
-
Europe
- UK
- Germany
- France
- Spain
- Italy
- Rest of Europe
-
Asia Pacific
- China
- Japan
- India
- South Korea
- Australia and New Zealand (ANZ)
- ASEAN Countries
- Rest of Asia Pacific
-
Middle East & Africa
- Saudi Arabia
- UAE
- South Africa
- Israel
- Rest of the Middle East & Africa
-
Latin America
- Brazil
- Mexico
- Argentina
- Rest of Latin America
Recent Developments
- In August 2023, Microsoft enhanced the Azure Elastic SAN service by introducing support for private endpoints and enabling volume sharing through SCSI (Small Computer System Interface) Persistent Reservation.
- In August 2023, AWS announced the launch of the AWS Israel (Tel Aviv) Region. This launch signifies that developers, startups, entrepreneurs, enterprises, as well as government, education, and nonprofit entities, have an expanded array of options for hosting their applications and serving their end users within Israel's borders.
- In August 2023, Google recently introduced three innovative cloud storage solutions: Cloud Storage FUSE, designed to support Artificial Intelligence (AI) applications needing file system semantics; Parallelstore, a parallel file system tailored for demanding AI and High-Performance Computing (HPC) applications leveraging GPUs; and NetApp.
- In May 2023, IBM introduced IBM Hybrid Cloud Mesh, a Software as a Service (SaaS) solution tailored to empower enterprises in managing their hybrid multi-cloud infrastructure effectively. By adopting IBM Hybrid Cloud Mesh, modern enterprises can streamline their infrastructure operations across hybrid multi-cloud and diverse environments, enhancing overall efficiency and adaptability.
- In November 2022, AWS introduced three new Amazon Elastic Compute Cloud (EC2) instances featuring AWS-designed chips, providing improved compute performance at a lower cost across a variety of workloads.
- In September 2022, IBM announced the general availability of IBM LinuxONE Bare Metal Servers. With this new solution, the LinuxONE platform may now be deployed in an off-premises Infrastructure as a Service (IaaS) model while enjoying all the advantages, including core consolidation, resultant software license savings, and decreased energy consumption to support sustainability goals.
- In September 2022, A new feature from Google Cloud allows users to significantly reduce the cold start time of Cloud Run and Cloud Functions. This is named startup CPU boost for Cloud Run and Cloud Functions 2nd gen.
Frequently Asked Questions (FAQ):
What is cloud native storage?
Cloud-native storage solutions are a category of storage technologies and services designed specifically to support the principles and practices of cloud-native application development and deployment. These solutions are engineered to meet the unique requirements of cloud-native applications, which are typically containerized, highly scalable, and designed to run in dynamic, distributed environments like Kubernetes.
Which countries in Europe are early adopters of cloud native storage?
In Europe, the UK, Germany, and France are initially adopting Cloud Native Storage.
Which are the top 3 key verticals adopting cloud native storage?
The top 3 verticals are BFSI, Manufacturing, and telecom.
Which are the top 5 key vendors exploring cloud native storage?
The top 5 key vendors exploring cloud native storage include Microsoft (US), IBM (US), AWS (US), Google (US), and Alibaba Cloud (China).
Which solution type is covered under the cloud native storage market?
The cloud native storage solutions are bifurcated to file, block, and object storage in the market.
To speak to our analyst for a discussion on the above findings, click Speak to Analyst
Exclusive indicates content/data unique to MarketsandMarkets and not available with any competitors.
- 5.1 INTRODUCTION
-
5.2 MARKET DYNAMICSDRIVERS- Increased data volumes across enterprises- Ease of switching from on-premises to cloud native storage- Increased automation in application updatesRESTRAINTS- Loss of data due to persistent data storing- Latency and network outage issues associated with public cloud environmentsOPPORTUNITIES- Need for faster recovery and data backup- Proliferation of Kubernetes and containerizationCHALLENGES- Complexity associated with cloud native concepts- Lack of visibility in distributed systems in cloud native storage
-
5.3 CASE STUDY ANALYSISCASE STUDY 1: TRILIO ENABLED CSI-PIEMONTE OFFER NATIVE DATA PROTECTION AND MANAGEMENT SERVICES TO ITS CLIENTSCASE STUDY 2: ROBIN.IO ENABLED MNO ACCELERATE DEPLOYMENT OF 5G SERVICESCASE STUDY 3: ARISTA USED MAYADATA’S OPENEBS WITH KUBERNETES TO SIMPLIFY DEVELOPERS’ RESPONSIBILITIESCASE STUDY 4: MILLENNIUM SELECTED PORTWORX FOR RELIABLE, FLEXIBLE STORAGE FOUNDATIONCASE STUDY 5: BIRDZ IMPROVED PERFORMANCE THROUGH GOOGLE’S CLOUD STORAGE SOLUTION
- 5.4 BRIEF HISTORY OF CLOUD NATIVE STORAGE/EVOLUTION
- 5.5 ECOSYSTEM ANALYSIS/MARKET MAP
- 5.6 SUPPLY CHAIN ANALYSIS
-
5.7 PRICING ANALYSISAVERAGE SELLING PRICE OF KEY PLAYERS, BY OFFERINGAVERAGE SELLING PRICE TRENDS
- 5.8 PATENT ANALYSIS
-
5.9 TECHNOLOGY ANALYSISKEY TECHNOLOGY- AI & ML- Edge computing- Security and encryption- Blockchain technology- ContainerizationADJACENT TECHNOLOGY- Data analytics and business intelligence- Compliance and governance- Data processing- Infrastructure as Code (IaC)- Monitoring and observability
-
5.10 TARIFF AND REGULATORY LANDSCAPEREGULATORY BODIES, GOVERNMENT AGENCIES, AND OTHER ORGANIZATIONS
- 5.11 KEY CONFERENCES AND EVENTS
-
5.12 PORTER’S FIVE FORCES ANALYSISTHREAT OF NEW ENTRANTSTHREAT OF SUBSTITUTESBARGAINING POWER OF SUPPLIERSBARGAINING POWER OF BUYERSINTENSITY OF COMPETITIVE RIVALRY
-
5.13 KEY STAKEHOLDERS & BUYING CRITERIAKEY STAKEHOLDERS IN BUYING PROCESSBUYING CRITERIA
- 5.14 TRENDS/DISRUPTIONS IMPACTING BUYERS
-
6.1 INTRODUCTIONOFFERING: MARKET DRIVERS
-
6.2 SOLUTIONSOBJECT STORAGE- Object storage systems to offer performance, scalability, and durability- S3-compatible object storage- Swift-compatible object storageBLOCK STORAGE- Block storage to offer automatic replication within same zone- SSD block storage- HDD block storageFILE STORAGE- Shared file system to enable forward integration without changing codes- NFS-based file storage- SMB-based file storage
-
6.3 DEPLOYMENT MODEPRIVATE CLOUD- Private cloud to offer better flexibility and tighter securityPUBLIC CLOUD- Accessibility and deployment speed to drive adoption of public clouds
-
6.4 SERVICESTRAINING & CONSULTING SERVICES- Cloud storage consulting services to help minimize risksSYSTEM INTEGRATION & IMPLEMENTATION SERVICES- Cloud native storage solutions to ensure data persistence and scalability for containerized applicationsSUPPORT & MAINTENANCE- Support services to ensure proper functioning of cloud native storage solutions
-
7.1 INTRODUCTIONAPPLICATION: MARKET DRIVERS
-
7.2 BACKUP & RECOVERYBACKUP & RECOVERY APPLICATIONS TO HELP ORGANIZATIONS PERFORM GRANULAR RECOVERIES AND MAINTAIN DATA INTEGRITY
-
7.3 DATA ARCHIVINGBUSINESSES TO OPTIMIZE DATA LIFECYCLE MANAGEMENT AND REDUCE EXPENSES USING DATA ARCHIVING APPLICATIONS
-
7.4 BIG DATA & ANALYTICSBIG DATA & ANALYTICS APPLICATIONS TO ENABLE DATA-DRIVEN DECISION-MAKING AND FOSTER INNOVATION
-
7.5 CONTENT DELIVERY & DISTRIBUTIONDISTRIBUTED, CONTAINERIZED ENVIRONMENTS TO HELP CONTENT PROVIDERS OPTIMIZE CONTENT DELIVERY STRATEGIES
-
7.6 DATABASE STORAGE MANAGEMENTDATABASE STORAGE MANAGEMENT APPLICATIONS TO FACILITATE MANAGEMENT OF DISTRIBUTED DATABASES AND ENSURE DATA PERSISTENCE
- 7.7 OTHER APPLICATIONS
-
8.1 INTRODUCTIONVERTICAL: MARKET DRIVERS
-
8.2 BANKING, FINANCIAL SERVICES, AND INSURANCECLOUD-NATIVE STORAGE TO ALLOW BFSI ORGANIZATIONS SEAMLESSLY SCALE STORAGE RESOURCES
-
8.3 TELECOMADOPTION OF CLOUD NATIVE TECHNOLOGY IN TELECOM INDUSTRY TO PROVIDE VIRTUALIZATION-BASED RESOURCE FLEXIBILITY, ROBUSTNESS, AND AGILITY
-
8.4 RETAIL & CONSUMER GOODSCLOUD NATIVE STORAGE SOLUTIONS TO ENHANCE ONLINE EXPERIENCE AND TRACK INVENTORIES IN REAL TIME
-
8.5 IT & ITESCLOUD NATIVE STORAGE SERVICES TO REDUCE COSTS AND PROVIDE END-TO-END SERVICE-LEVEL MONITORING
-
8.6 HEALTHCARE & LIFE SCIENCESADOPTION OF CLOUD NATIVE STORAGE SOLUTIONS TO IMPROVE PATIENT EXPERIENCE AND EMPOWER HEALTH TEAM COLLABORATION
-
8.7 MANUFACTURINGCLOUD NATIVE STORAGE SOLUTION TO HELP MANUFACTURERS IMPROVE AGILITY, EFFICIENCY, QUALITY, AND SUSTAINABILITY
-
8.8 MEDIA & ENTERTAINMENTCLOUD NATIVE STORAGE SOLUTIONS TO STREAMLINE CONTENT PRODUCTION, TRANSFORM CONTENT INTELLIGENCE, AND ENHANCE CREATIVITY
-
8.9 GOVERNMENT & PUBLIC SECTORCLOUD NATIVE INFRASTRUCTURE TO ACHIEVE ECONOMIC GROWTH AND DEVELOPMENT, ENABLE PERSONALIZED DIGITAL EXPERIENCE, AND DELIVER SECURE SERVICES
-
8.10 ENERGY & UTILITIESCLOUD NATIVE STORAGE SOLUTIONS TO MANAGE COMPLEX OPERATIONS, MEET REGULATORY COMPLIANCES, AND HANDLE LARGE VOLUMES OF DATA
- 8.11 OTHER VERTICALS
- 9.1 INTRODUCTION
-
9.2 NORTH AMERICANORTH AMERICA: MARKET DRIVERSNORTH AMERICA: RECESSION IMPACTUS- Presence of cloud native storage providers to drive marketCANADA- Government initiatives and technological advancements to fuel adoption of cloud native storage
-
9.3 EUROPEEUROPE: MARKET DRIVERSEUROPE: RECESSION IMPACTUK- Growing need for comprehensive technologies to manage data and business-critical applications to propel market growthGERMANY- Adoption of cloud native storage services to ensure data resilience, scalability, and availability to boost marketFRANCE- Robust economic infrastructure, increasing cloud adoption, and high internet penetration to accelerate market growthSPAIN- Adoption of innovative storage approaches to drive digital transformationITALY- Increasing adoption of cloud computing technologies and platforms to accelerate digital transformationREST OF EUROPE
-
9.4 ASIA PACIFICASIA PACIFIC: MARKET DRIVERSASIA PACIFIC: RECESSION IMPACTCHINA- Simplification of storage and reduction in operational expenses to boost marketINDIA- Scalability, flexibility, and agility in managing data to drive marketJAPAN- Increasing involvement of SMEs in cloud adoption to accelerate market growthAUSTRALIA & NEW ZEALAND- Prevalence of numerous channel partners to fuel market growthSOUTH KOREA- Growing investments in new technologies to drive marketASEAN COUNTRIES- Growing investments in new technologies to boost marketREST OF ASIA PACIFIC
-
9.5 MIDDLE EAST & AFRICAMIDDLE EAST & AFRICA: MARKET DRIVERSMIDDLE EAST & AFRICA: RECESSION IMPACTSAUDI ARABIA- Rising digital transformation to fuel growth of marketSOUTH AFRICA- Rising adoption of cloud services by startups due to low costs and on-demand availability to propel market growthUAE- Rising government investments and economic development to fuel market growthISRAEL- Rapid digital transformation across various industries to boost marketREST OF MIDDLE EAST & AFRICA
-
9.6 LATIN AMERICALATIN AMERICA: MARKET DRIVERSLATIN AMERICA: RECESSION IMPACTBRAZIL- Rise in foreign direct investments and presence of large global enterprises to fuel market growthMEXICO- Growing focus of government and local organizations on digital transformation and digital literacy to drive marketARGENTINA- Increasing adoption of modern cloud native architectures and technologies to accelerate market growthREST OF LATIN AMERICA
- 10.1 INTRODUCTION
- 10.2 KEY PLAYER STRATEGIES
- 10.3 BUSINESS SEGMENT REVENUE ANALYSIS OF TOP VENDORS
- 10.4 MARKET SHARE ANALYSIS
-
10.5 COMPANY EVALUATION MATRIXSTARSEMERGING LEADERSPERVASIVE PLAYERSPARTICIPANTSCOMPANY EVALUATION MATRIX: COMPANY FOOTPRINT
-
10.6 STARTUP/SME EVALUATION MATRIXRESPONSIVE VENDORSPROGRESSIVE VENDORSDYNAMIC COMPANIESSTARTING BLOCKSCOMPETITIVE BENCHMARKING
- 10.7 COMPETITIVE SCENARIO
- 11.1 INTRODUCTION
-
11.2 KEY PLAYERSMICROSOFT- Business overview- Products/Solutions/Services offered- Recent developments- MnM viewIBM- Business overview- Products/Solutions/Services offered- Recent developments- MnM viewAWS- Business overview- Products/Solutions/Services offered- Recent developments- MnM viewGOOGLE- Business overview- Products/Solutions/Services offered- Recent developments- MnM viewALIBABA CLOUD- Business overview- Products/Solutions/Services offered- Recent developments- MnM viewHEWLETT PACKARD ENTERPRISE- Business overview- Products/Solutions/Services offered- Recent developments- MnM viewDELL TECHNOLOGIES- Business overview- Recent developments- MnM viewNETAPP- Business overview- Products/Solutions/Services offered- Recent developmentsPURE STORAGE- Business overview- Products/Solutions/Services offered- Recent developmentsSUSE- Business overview- Products/Solutions/Services offered- Recent developments
-
11.3 OTHER KEY PLAYERSINTRODUCTIONVMWAREORACLEHUAWEICITRIXTENCENT CLOUDSCALITYSPLUNKLINBITRACKSPACE
-
11.4 STARTUP/SME PLAYERSROBIN.IOMAYADATADIAMANTIMINIOROOKONDATIONIRTRILIOUPCLOUDARRIKTO
-
12.1 INTRODUCTIONRELATED MARKETSLIMITATIONS
-
12.2 CLOUD COMPUTING MARKETINTRODUCTIONCLOUD COMPUTING MARKET, BY SERVICE MODEL- Infrastructure-as-a-Service- Platform-as-a-Service- Software-as-a-ServiceCLOUD COMPUTING MARKET, BY VERTICAL- Banking, financial services, and insurance- Telecommunications- IT & ITeS- Government & public sector- Retail & consumer goods- Manufacturing- Energy & utilities- Media & entertainment- Healthcare & life sciences- Others
-
12.3 CLOUD STORAGE MARKETINTRODUCTION
- 13.1 DISCUSSION GUIDE
- 13.2 KNOWLEDGESTORE: MARKETSANDMARKETS’ SUBSCRIPTION PORTAL
- 13.3 CUSTOMIZATION OPTIONS
- 13.4 RELATED REPORTS
- 13.5 AUTHOR DETAILS
- TABLE 1 FACTOR ANALYSIS
- TABLE 2 IMPACT OF RECESSION ON GLOBAL CLOUD NATIVE STORAGE MARKET
- TABLE 3 GLOBAL MARKET SIZE AND GROWTH RATE, 2017–2022 (USD MILLION, Y-O-Y %)
- TABLE 4 GLOBAL MARKET SIZE AND GROWTH RATE, 2023–2028 (USD MILLION, Y-O-Y %)
- TABLE 5 MARKET: ECOSYSTEM
- TABLE 6 MARKET: OBJECT AND BLOCK STORAGE AVERAGE PRICING LEVELS
- TABLE 7 MARKET: FILE HOSTING CLOUD STORAGE PRICING LEVELS
- TABLE 8 MARKET: INDICATIVE PRICING
- TABLE 9 TOP 20 PATENT OWNERS
- TABLE 10 LIST OF FEW MAJOR PATENTS IN MARKET, 2019-2023
- TABLE 11 NORTH AMERICA: LIST OF REGULATORY BODIES, GOVERNMENT AGENCIES, AND OTHER ORGANIZATIONS
- TABLE 12 EUROPE: LIST OF REGULATORY BODIES, GOVERNMENT AGENCIES, AND OTHER ORGANIZATIONS
- TABLE 13 ASIA PACIFIC: LIST OF REGULATORY BODIES, GOVERNMENT AGENCIES, AND OTHER ORGANIZATIONS
- TABLE 14 ROW: LIST OF REGULATORY BODIES, GOVERNMENT AGENCIES, AND OTHER ORGANIZATIONS
- TABLE 15 CLOUD NATIVE STORAGE MARKET: DETAILED LIST OF CONFERENCES AND EVENTS, 2023–2024
- TABLE 16 MARKET: PORTER’S FIVE FORCES ANALYSIS
- TABLE 17 INFLUENCE OF STAKEHOLDERS ON BUYING PROCESS FOR TOP VERTICALS
- TABLE 18 KEY BUYING CRITERIA FOR TOP THREE VERTICALS
- TABLE 19 MARKET, BY OFFERING, 2017–2022 (USD MILLION)
- TABLE 20 MARKET, BY OFFERING, 2023–2028 (USD MILLION)
- TABLE 21 CLOUD NATIVE STORAGE SOLUTIONS MARKET, BY TYPE, 2017–2022 (USD MILLION)
- TABLE 22 CLOUD NATIVE STORAGE SOLUTIONS MARKET, BY TYPE, 2023–2028 (USD MILLION)
- TABLE 23 OBJECT STORAGE: CLOUD NATIVE STORAGE MARKET, BY REGION, 2017–2022 (USD MILLION)
- TABLE 24 OBJECT STORAGE: MARKET, BY REGION, 2023–2028 (USD MILLION)
- TABLE 25 BLOCK STORAGE: MARKET, BY REGION, 2017–2022 (USD MILLION)
- TABLE 26 BLOCK STORAGE: MARKET, BY REGION, 2023–2028 (USD MILLION)
- TABLE 27 FILE STORAGE: MARKET, BY REGION, 2017–2022 (USD MILLION)
- TABLE 28 FILE STORAGE: MARKET, BY REGION, 2023–2028 (USD MILLION)
- TABLE 29 MARKET, BY DEPLOYMENT MODE, 2017–2022 (USD MILLION)
- TABLE 30 MARKET, BY DEPLOYMENT MODE, 2023–2028 (USD MILLION)
- TABLE 31 PRIVATE CLOUD: MARKET, BY REGION, 2017–2022 (USD MILLION)
- TABLE 32 PRIVATE CLOUD: MARKET, BY REGION, 2023–2028 (USD MILLION)
- TABLE 33 PUBLIC CLOUD: MARKET, BY REGION, 2017–2022 (USD MILLION)
- TABLE 34 PUBLIC CLOUD: MARKET, BY REGION, 2023–2028 (USD MILLION)
- TABLE 35 SERVICES: MARKET, BY REGION, 2017–2022 (USD MILLION)
- TABLE 36 SERVICES: MARKET, BY REGION, 2023–2028 (USD MILLION)
- TABLE 37 MARKET, BY APPLICATION, 2017–2022 (USD MILLION)
- TABLE 38 MARKET, BY APPLICATION, 2023–2028 (USD MILLION)
- TABLE 39 BACKUP & RECOVERY: MARKET, BY REGION, 2017–2022 (USD MILLION)
- TABLE 40 BACKUP & RECOVERY: MARKET, BY REGION, 2023–2028 (USD MILLION)
- TABLE 41 DATA ARCHIVING: MARKET, BY REGION, 2017–2022 (USD MILLION)
- TABLE 42 DATA ARCHIVING: MARKET, BY REGION, 2023–2028 (USD MILLION)
- TABLE 43 BIG DATA & ANALYTICS: MARKET, BY REGION, 2017–2022 (USD MILLION)
- TABLE 44 BIG DATA & ANALYTICS: MARKET, BY REGION, 2023–2028 (USD MILLION)
- TABLE 45 CONTENT DELIVERY & DISTRIBUTION: MARKET, BY REGION, 2017–2022 (USD MILLION)
- TABLE 46 CONTENT DELIVERY & DISTRIBUTION: MARKET, BY REGION, 2023–2028 (USD MILLION)
- TABLE 47 DATABASE STORAGE MANAGEMENT: MARKET, BY REGION, 2017–2022 (USD MILLION)
- TABLE 48 DATABASE STORAGE MANAGEMENT: MARKET, BY REGION, 2023–2028 (USD MILLION)
- TABLE 49 OTHER APPLICATIONS: MARKET, BY REGION, 2017–2022 (USD MILLION)
- TABLE 50 OTHER APPLICATIONS: MARKET, BY REGION, 2023–2028 (USD MILLION)
- TABLE 51 MARKET, BY VERTICAL, 2017–2022 (USD MILLION)
- TABLE 52 MARKET, BY VERTICAL, 2023–2028 (USD MILLION)
- TABLE 53 BANKING, FINANCIAL SERVICES, AND INSURANCE: MARKET, BY REGION, 2017–2022 (USD MILLION)
- TABLE 54 BANKING, FINANCIAL SERVICES, AND INSURANCE: MARKET, BY REGION, 2023–2028 (USD MILLION)
- TABLE 55 TELECOM: MARKET, BY REGION, 2017–2022 (USD MILLION)
- TABLE 56 TELECOM: MARKET, BY REGION, 2023–2028 (USD MILLION)
- TABLE 57 RETAIL & CONSUMER GOODS: MARKET, BY REGION, 2017–2022 (USD MILLION)
- TABLE 58 RETAIL & CONSUMER GOODS: MARKET, BY REGION, 2023–2028 (USD MILLION)
- TABLE 59 IT & ITES: MARKET, BY REGION, 2017–2022 (USD MILLION)
- TABLE 60 IT & ITES: MARKET, BY REGION, 2023–2028 (USD MILLION)
- TABLE 61 HEALTHCARE & LIFE SCIENCES: MARKET, BY REGION, 2017–2022 (USD MILLION)
- TABLE 62 HEALTHCARE & LIFE SCIENCES: MARKET, BY REGION, 2023–2028 (USD MILLION)
- TABLE 63 MANUFACTURING: MARKET, BY REGION, 2017–2022 (USD MILLION)
- TABLE 64 MANUFACTURING: MARKET, BY REGION, 2023–2028 (USD MILLION)
- TABLE 65 MEDIA & ENTERTAINMENT: MARKET, BY REGION, 2017–2022 (USD MILLION)
- TABLE 66 MEDIA & ENTERTAINMENT: MARKET, BY REGION, 2023–2028 (USD MILLION)
- TABLE 67 GOVERNMENT & PUBLIC SECTOR: MARKET, BY REGION, 2017–2022 (USD MILLION)
- TABLE 68 GOVERNMENT & PUBLIC SECTOR: MARKET, BY REGION, 2023–2028 (USD MILLION)
- TABLE 69 ENERGY & UTILITIES: MARKET, BY REGION, 2017–2022 (USD MILLION)
- TABLE 70 ENERGY & UTILITIES: MARKET, BY REGION, 2023–2028 (USD MILLION)
- TABLE 71 OTHER VERTICALS: MARKET, BY REGION, 2017–2022 (USD MILLION)
- TABLE 72 OTHER VERTICALS: MARKET, BY REGION, 2023–2028 (USD MILLION)
- TABLE 73 MARKET, BY REGION, 2017–2022 (USD MILLION)
- TABLE 74 MARKET, BY REGION, 2023–2028 (USD MILLION)
- TABLE 75 NORTH AMERICA: MARKET, BY OFFERING, 2017–2022 (USD MILLION)
- TABLE 76 NORTH AMERICA: MARKET, BY OFFERING, 2023–2028 (USD MILLION)
- TABLE 77 NORTH AMERICA: CLOUD NATIVE STORAGE SOLUTIONS MARKET, BY TYPE, 2017–2022 (USD MILLION)
- TABLE 78 NORTH AMERICA: CLOUD NATIVE STORAGE SOLUTIONS MARKET, BY TYPE, 2023–2028 (USD MILLION)
- TABLE 79 NORTH AMERICA: CLOUD NATIVE STORAGE SOLUTIONS MARKET, BY DEPLOYMENT MODE, 2017–2022 (USD MILLION)
- TABLE 80 NORTH AMERICA: CLOUD NATIVE STORAGE SOLUTIONS MARKET, BY DEPLOYMENT MODE, 2023–2028 (USD MILLION)
- TABLE 81 NORTH AMERICA: MARKET, BY APPLICATION, 2017–2022 (USD MILLION)
- TABLE 82 NORTH AMERICA: MARKET, BY APPLICATION, 2023–2028 (USD MILLION)
- TABLE 83 NORTH AMERICA: MARKET, BY VERTICAL, 2017–2022 (USD MILLION)
- TABLE 84 NORTH AMERICA: MARKET, BY VERTICAL, 2023–2028 (USD MILLION)
- TABLE 85 NORTH AMERICA: MARKET, BY COUNTRY, 2017–2022 (USD MILLION)
- TABLE 86 NORTH AMERICA: MARKET, BY COUNTRY, 2023–2028 (USD MILLION)
- TABLE 87 US: CLOUD NATIVE STORAGE SOLUTIONS MARKET, BY DEPLOYMENT MODE, 2017–2022 (USD MILLION)
- TABLE 88 US: CLOUD NATIVE STORAGE SOLUTIONS MARKET, BY DEPLOYMENT MODE, 2023–2028 (USD MILLION)
- TABLE 89 CANADA: CLOUD NATIVE STORAGE SOLUTIONS MARKET, BY DEPLOYMENT MODE, 2017–2022 (USD MILLION)
- TABLE 90 CANADA: CLOUD NATIVE STORAGE SOLUTIONS MARKET, BY DEPLOYMENT MODE, 2023–2028 (USD MILLION)
- TABLE 91 EUROPE: MARKET, BY OFFERING, 2017–2022 (USD MILLION)
- TABLE 92 EUROPE: MARKET, BY OFFERING, 2023–2028 (USD MILLION)
- TABLE 93 EUROPE: CLOUD NATIVE STORAGE SOLUTIONS MARKET, BY TYPE, 2017–2022 (USD MILLION)
- TABLE 94 EUROPE: CLOUD NATIVE STORAGE SOLUTIONS MARKET, BY TYPE, 2023–2028 (USD MILLION)
- TABLE 95 EUROPE: CLOUD NATIVE STORAGE SOLUTIONS MARKET, BY DEPLOYMENT MODE, 2017–2022 (USD MILLION)
- TABLE 96 EUROPE: CLOUD NATIVE STORAGE SOLUTIONS MARKET, BY DEPLOYMENT MODE, 2023–2028 (USD MILLION)
- TABLE 97 EUROPE: MARKET, BY APPLICATION, 2017–2022 (USD MILLION)
- TABLE 98 EUROPE: MARKET, BY APPLICATION, 2023–2028 (USD MILLION)
- TABLE 99 EUROPE: MARKET, BY VERTICAL, 2017–2022 (USD MILLION)
- TABLE 100 EUROPE: MARKET, BY VERTICAL, 2023–2028 (USD MILLION)
- TABLE 101 EUROPE: MARKET, BY COUNTRY, 2017–2022 (USD MILLION)
- TABLE 102 EUROPE: MARKET, BY COUNTRY, 2023–2028 (USD MILLION)
- TABLE 103 UK: CLOUD NATIVE STORAGE SOLUTIONS MARKET, BY DEPLOYMENT MODE, 2017–2022 (USD MILLION)
- TABLE 104 UK: CLOUD NATIVE STORAGE SOLUTIONS MARKET, BY DEPLOYMENT MODE, 2023–2028 (USD MILLION)
- TABLE 105 GERMANY: CLOUD NATIVE STORAGE SOLUTIONS MARKET, BY DEPLOYMENT MODE, 2017–2022 (USD MILLION)
- TABLE 106 GERMANY: CLOUD NATIVE STORAGE SOLUTIONS MARKET, BY DEPLOYMENT MODE, 2023–2028 (USD MILLION)
- TABLE 107 FRANCE: CLOUD NATIVE STORAGE SOLUTIONS MARKET, BY DEPLOYMENT MODE, 2017–2022 (USD MILLION)
- TABLE 108 FRANCE: CLOUD NATIVE STORAGE SOLUTIONS MARKET, BY DEPLOYMENT MODE, 2023–2028 (USD MILLION)
- TABLE 109 SPAIN: CLOUD NATIVE STORAGE SOLUTIONS MARKET, BY DEPLOYMENT MODE, 2017–2022 (USD MILLION)
- TABLE 110 SPAIN: CLOUD NATIVE STORAGE SOLUTIONS MARKET, BY DEPLOYMENT MODE, 2023–2028 (USD MILLION)
- TABLE 111 ITALY: CLOUD NATIVE STORAGE SOLUTIONS MARKET, BY DEPLOYMENT MODE, 2017–2022 (USD MILLION)
- TABLE 112 ITALY: CLOUD NATIVE STORAGE SOLUTIONS MARKET, BY DEPLOYMENT MODE, 2023–2028 (USD MILLION)
- TABLE 113 REST OF EUROPE: CLOUD NATIVE STORAGE SOLUTIONS MARKET, BY DEPLOYMENT MODE, 2017–2022 (USD MILLION)
- TABLE 114 REST OF EUROPE: CLOUD NATIVE STORAGE SOLUTIONS MARKET, BY DEPLOYMENT MODE, 2023–2028 (USD MILLION)
- TABLE 115 ASIA PACIFIC: MARKET, BY OFFERING, 2017–2022 (USD MILLION)
- TABLE 116 ASIA PACIFIC: MARKET, BY OFFERING, 2023–2028 (USD MILLION)
- TABLE 117 ASIA PACIFIC: CLOUD NATIVE STORAGE SOLUTIONS MARKET, BY TYPE, 2017–2022 (USD MILLION)
- TABLE 118 ASIA PACIFIC: CLOUD NATIVE STORAGE SOLUTIONS MARKET, BY TYPE, 2023–2028 (USD MILLION)
- TABLE 119 ASIA PACIFIC: CLOUD NATIVE STORAGE SOLUTIONS MARKET, BY DEPLOYMENT MODE, 2017–2022 (USD MILLION)
- TABLE 120 ASIA PACIFIC: CLOUD NATIVE STORAGE SOLUTIONS MARKET, BY DEPLOYMENT MODE, 2023–2028 (USD MILLION)
- TABLE 121 ASIA PACIFIC: MARKET, BY APPLICATION, 2017–2022 (USD MILLION)
- TABLE 122 ASIA PACIFIC: MARKET, BY APPLICATION, 2023–2028 (USD MILLION)
- TABLE 123 ASIA PACIFIC: MARKET, BY VERTICAL, 2017–2022 (USD MILLION)
- TABLE 124 ASIA PACIFIC: MARKET, BY VERTICAL, 2023–2028 (USD MILLION)
- TABLE 125 ASIA PACIFIC: MARKET, BY REGION, 2017–2022 (USD MILLION)
- TABLE 126 ASIA PACIFIC: MARKET, BY REGION, 2023–2028 (USD MILLION)
- TABLE 127 CHINA: CLOUD NATIVE STORAGE SOLUTIONS MARKET, BY DEPLOYMENT MODE, 2017–2022 (USD MILLION)
- TABLE 128 CHINA: CLOUD NATIVE STORAGE SOLUTIONS MARKET, BY DEPLOYMENT MODE, 2023–2028 (USD MILLION)
- TABLE 129 INDIA: CLOUD NATIVE STORAGE SOLUTIONS MARKET, BY DEPLOYMENT MODE, 2017–2022 (USD MILLION)
- TABLE 130 INDIA: CLOUD NATIVE STORAGE SOLUTIONS MARKET, BY DEPLOYMENT MODE, 2023–2028 (USD MILLION)
- TABLE 131 JAPAN: CLOUD NATIVE STORAGE SOLUTIONS MARKET, BY DEPLOYMENT MODE, 2017–2022 (USD MILLION)
- TABLE 132 JAPAN: CLOUD NATIVE STORAGE SOLUTIONS MARKET, BY DEPLOYMENT MODE, 2023–2028 (USD MILLION)
- TABLE 133 AUSTRALIA & NEW ZEALAND: CLOUD NATIVE STORAGE SOLUTIONS MARKET, BY DEPLOYMENT MODE, 2017–2022 (USD MILLION)
- TABLE 134 AUSTRALIA & NEW ZEALAND: CLOUD NATIVE STORAGE SOLUTIONS MARKET, BY DEPLOYMENT MODE, 2023–2028 (USD MILLION)
- TABLE 135 SOUTH KOREA: CLOUD NATIVE STORAGE SOLUTIONS MARKET, BY DEPLOYMENT MODE, 2017–2022 (USD MILLION)
- TABLE 136 SOUTH KOREA: CLOUD NATIVE STORAGE SOLUTIONS MARKET, BY DEPLOYMENT MODE, 2023–2028 (USD MILLION)
- TABLE 137 ASEAN COUNTRIES: CLOUD NATIVE STORAGE SOLUTIONS MARKET, BY DEPLOYMENT MODE, 2017–2022 (USD MILLION)
- TABLE 138 ASEAN COUNTRIES: CLOUD NATIVE STORAGE SOLUTIONS MARKET, BY DEPLOYMENT MODE, 2023–2028 (USD MILLION)
- TABLE 139 REST OF ASIA PACIFIC: CLOUD NATIVE STORAGE SOLUTIONS MARKET, BY DEPLOYMENT MODE, 2017–2022 (USD MILLION)
- TABLE 140 REST OF ASIA PACIFIC: CLOUD NATIVE STORAGE SOLUTIONS MARKET, BY DEPLOYMENT MODE, 2023–2028 (USD MILLION)
- TABLE 141 MIDDLE EAST & AFRICA: MARKET, BY OFFERING, 2017–2022 (USD MILLION)
- TABLE 142 MIDDLE EAST & AFRICA: MARKET, BY OFFERING, 2023–2028 (USD MILLION)
- TABLE 143 MIDDLE EAST & AFRICA: CLOUD NATIVE STORAGE SOLUTIONS MARKET, BY TYPE, 2017–2022 (USD MILLION)
- TABLE 144 MIDDLE EAST & AFRICA: CLOUD NATIVE STORAGE SOLUTIONS MARKET, BY TYPE, 2023–2028 (USD MILLION)
- TABLE 145 MIDDLE EAST & AFRICA: CLOUD NATIVE STORAGE SOLUTIONS MARKET, BY DEPLOYMENT MODE, 2017–2022 (USD MILLION)
- TABLE 146 MIDDLE EAST & AFRICA: CLOUD NATIVE STORAGE SOLUTIONS MARKET, BY DEPLOYMENT MODE, 2023–2028 (USD MILLION)
- TABLE 147 MIDDLE EAST & AFRICA: MARKET, BY APPLICATION, 2017–2022 (USD MILLION)
- TABLE 148 MIDDLE EAST & AFRICA: MARKET, BY APPLICATION, 2023–2028 (USD MILLION)
- TABLE 149 MIDDLE EAST & AFRICA: MARKET, BY VERTICAL, 2017–2022 (USD MILLION)
- TABLE 150 MIDDLE EAST & AFRICA: MARKET, BY VERTICAL, 2023–2028 (USD MILLION)
- TABLE 151 MIDDLE EAST & AFRICA: MARKET, BY COUNTRY, 2017–2022 (USD MILLION)
- TABLE 152 MIDDLE EAST & AFRICA: MARKET, BY COUNTRY, 2023–2028 (USD MILLION)
- TABLE 153 SAUDI ARABIA: CLOUD NATIVE STORAGE SOLUTIONS MARKET, BY DEPLOYMENT MODE, 2017–2022 (USD MILLION)
- TABLE 154 SAUDI ARABIA: CLOUD NATIVE STORAGE SOLUTIONS MARKET, BY DEPLOYMENT MODE, 2023–2028 (USD MILLION)
- TABLE 155 SOUTH AFRICA: CLOUD NATIVE STORAGE SOLUTIONS MARKET, BY DEPLOYMENT MODE, 2017–2022 (USD MILLION)
- TABLE 156 SOUTH AFRICA: CLOUD NATIVE STORAGE SOLUTIONS MARKET, BY DEPLOYMENT MODE, 2023–2028 (USD MILLION)
- TABLE 157 UAE: CLOUD NATIVE STORAGE SOLUTIONS MARKET, BY DEPLOYMENT MODE, 2017–2022 (USD MILLION)
- TABLE 158 UAE: CLOUD NATIVE STORAGE SOLUTIONS MARKET, BY DEPLOYMENT MODE, 2023–2028 (USD MILLION)
- TABLE 159 ISRAEL: CLOUD NATIVE STORAGE SOLUTIONS MARKET, BY DEPLOYMENT MODE, 2017–2022 (USD MILLION)
- TABLE 160 ISRAEL: CLOUD NATIVE STORAGE SOLUTIONS MARKET, BY DEPLOYMENT MODE, 2023–2028 (USD MILLION)
- TABLE 161 REST OF MIDDLE EAST & AFRICA: CLOUD NATIVE STORAGE SOLUTIONS MARKET, BY DEPLOYMENT MODE, 2017–2022 (USD MILLION)
- TABLE 162 REST OF MIDDLE EAST & AFRICA: CLOUD NATIVE STORAGE SOLUTIONS MARKET, BY DEPLOYMENT MODE, 2023–2028 (USD MILLION)
- TABLE 163 LATIN AMERICA: MARKET, BY OFFERING, 2017–2022 (USD MILLION)
- TABLE 164 LATIN AMERICA: MARKET, BY OFFERING, 2023–2028 (USD MILLION)
- TABLE 165 LATIN AMERICA: CLOUD NATIVE STORAGE SOLUTIONS MARKET, BY TYPE, 2017–2022 (USD MILLION)
- TABLE 166 LATIN AMERICA: CLOUD NATIVE STORAGE SOLUTIONS MARKET, BY TYPE, 2023–2028 (USD MILLION)
- TABLE 167 LATIN AMERICA: CLOUD NATIVE STORAGE SOLUTIONS MARKET, BY DEPLOYMENT MODE, 2017–2022 (USD MILLION)
- TABLE 168 LATIN AMERICA: CLOUD NATIVE STORAGE SOLUTIONS MARKET, BY DEPLOYMENT MODE, 2023–2028 (USD MILLION)
- TABLE 169 LATIN AMERICA: MARKET, BY APPLICATION, 2017–2022 (USD MILLION)
- TABLE 170 LATIN AMERICA: MARKET, BY APPLICATION, 2023–2028 (USD MILLION)
- TABLE 171 LATIN AMERICA: MARKET, BY VERTICAL, 2017–2022 (USD MILLION)
- TABLE 172 LATIN AMERICA: MARKET, BY VERTICAL, 2023–2028 (USD MILLION)
- TABLE 173 LATIN AMERICA: MARKET, BY COUNTRY, 2017–2022 (USD MILLION)
- TABLE 174 LATIN AMERICA: MARKET, BY COUNTRY, 2023–2028 (USD MILLION)
- TABLE 175 BRAZIL: CLOUD NATIVE STORAGE SOLUTIONS MARKET, BY DEPLOYMENT MODE, 2017–2022 (USD MILLION)
- TABLE 176 BRAZIL: CLOUD NATIVE STORAGE SOLUTIONS MARKET, BY DEPLOYMENT MODE, 2023–2028 (USD MILLION)
- TABLE 177 MEXICO: CLOUD NATIVE STORAGE SOLUTIONS MARKET, BY DEPLOYMENT MODE, 2017–2022 (USD MILLION)
- TABLE 178 MEXICO: CLOUD NATIVE STORAGE SOLUTIONS MARKET, BY DEPLOYMENT MODE, 2023–2028 (USD MILLION)
- TABLE 179 ARGENTINA: CLOUD NATIVE STORAGE SOLUTIONS MARKET, BY DEPLOYMENT MODE, 2017–2022 (USD MILLION)
- TABLE 180 ARGENTINA: CLOUD NATIVE STORAGE SOLUTIONS MARKET, BY DEPLOYMENT MODE, 2023–2028 (USD MILLION)
- TABLE 181 REST OF LATIN AMERICA: CLOUD NATIVE STORAGE SOLUTIONS MARKET, BY DEPLOYMENT MODE, 2017–2022 (USD MILLION)
- TABLE 182 REST OF LATIN AMERICA: CLOUD NATIVE STORAGE SOLUTIONS MARKET, BY DEPLOYMENT MODE, 2023–2028 (USD MILLION)
- TABLE 183 OVERVIEW OF STRATEGIES ADOPTED BY KEY CLOUD NATIVE STORAGE VENDORS
- TABLE 184 MARKET: BUSINESS SEGMENT REVENUE ANALYSIS
- TABLE 185 MARKET: DEGREE OF COMPETITION
- TABLE 186 COMPANY OFFERING FOOTPRINT
- TABLE 187 COMPANY EVALUATION MATRIX: COMPANY REGIONAL FOOTPRINT
- TABLE 188 COMPANY EVALUATION MATRIX: COMPANY OVERALL FOOTPRINT
- TABLE 189 STARTUP EVALUATION MATRIX: COMPANY OFFERING FOOTPRINT
- TABLE 190 STARTUP EVALUATION MATRIX: COMPANY REGIONAL FOOTPRINT
- TABLE 191 STARTUP EVALUATION MATRIX: COMPANY OVERALL FOOTPRINT
- TABLE 192 MARKET: DETAILED LIST OF KEY STARTUPS/SMES
- TABLE 193 CLOUD NATIVE STORAGE MARKET: PRODUCT LAUNCHES, 2020–2023
- TABLE 194 MARKET: DEALS, 2019–2021
- TABLE 195 MICROSOFT: BUSINESS OVERVIEW
- TABLE 196 MICROSOFT: PRODUCTS/SOLUTIONS/SERVICES OFFERED
- TABLE 197 MICROSOFT: PRODUCT LAUNCHES AND ENHANCEMENTS
- TABLE 198 MICROSOFT: DEALS
- TABLE 199 IBM: BUSINESS OVERVIEW
- TABLE 200 IBM: PRODUCTS/SOLUTIONS/SERVICES OFFERED
- TABLE 201 IBM: PRODUCT LAUNCHES AND ENHANCEMENTS
- TABLE 202 IBM: DEALS
- TABLE 203 AWS: BUSINESS OVERVIEW
- TABLE 204 AWS: PRODUCTS/SOLUTIONS/SERVICES OFFERED
- TABLE 205 AWS: PRODUCT LAUNCHES AND ENHANCEMENTS
- TABLE 206 AWS: DEALS
- TABLE 207 AWS: OTHERS
- TABLE 208 GOOGLE: BUSINESS OVERVIEW
- TABLE 209 GOOGLE: PRODUCTS/SOLUTIONS/SERVICES OFFERED
- TABLE 210 GOOGLE: PRODUCT LAUNCHES AND ENHANCEMENTS
- TABLE 211 GOOGLE: DEALS
- TABLE 212 GOOGLE: OTHERS
- TABLE 213 ALIBABA CLOUD: BUSINESS OVERVIEW
- TABLE 214 ALIBABA CLOUD: PRODUCTS/SOLUTIONS/SERVICES OFFERED
- TABLE 215 ALIBABA CLOUD: PRODUCT LAUNCHES AND ENHANCEMENTS
- TABLE 216 ALIBABA CLOUD: DEALS
- TABLE 217 ALIBABA CLOUD: OTHERS
- TABLE 218 HPE: BUSINESS OVERVIEW
- TABLE 219 HPE: PRODUCTS/SOLUTIONS/SERVICES OFFERED
- TABLE 220 HPE: PRODUCT LAUNCHES AND ENHANCEMENTS
- TABLE 221 HPE: DEALS
- TABLE 222 HPE: OTHERS
- TABLE 223 DELL TECHNOLOGIES: BUSINESS OVERVIEW
- TABLE 224 DELL TECHNOLOGIES: PRODUCT LAUNCHES
- TABLE 225 DELL TECHNOLOGIES: DEALS
- TABLE 226 NETAPP: BUSINESS OVERVIEW
- TABLE 227 NETAPP: PRODUCTS/SOLUTIONS/SERVICES OFFERED
- TABLE 228 NETAPP: PRODUCT LAUNCHES AND ENHANCEMENTS
- TABLE 229 NETAPP: DEALS
- TABLE 230 PURE STORAGE: BUSINESS OVERVIEW
- TABLE 231 PURE STORAGE: PRODUCTS/SOLUTIONS/SERVICES OFFERED
- TABLE 232 PURE STORAGE: PRODUCT LAUNCHES AND ENHANCEMENTS
- TABLE 233 PURE STORAGE: DEALS
- TABLE 234 SUSE: BUSINESS OVERVIEW
- TABLE 235 SUSE: PRODUCTS/SOLUTIONS/SERVICES OFFERED
- TABLE 236 SUSE: PRODUCT LAUNCHES AND ENHANCEMENTS
- TABLE 237 SUSE: DEALS
- TABLE 238 RELATED MARKETS
- TABLE 239 CLOUD COMPUTING MARKET, BY SERVICE MODEL, 2015–2020 (USD BILLION)
- TABLE 240 CLOUD COMPUTING MARKET, BY SERVICE MODEL, 2021–2026 (USD BILLION)
- TABLE 241 INFRASTRUCTURE-AS-A-SERVICE: CLOUD COMPUTING MARKET, BY REGION, 2015–2020 (USD BILLION)
- TABLE 242 INFRASTRUCTURE-AS-A-SERVICE: CLOUD COMPUTING MARKET, BY REGION, 2021–2026 (USD BILLION)
- TABLE 243 PLATFORM-AS-A-SERVICE: CLOUD COMPUTING MARKET, BY REGION, 2015–2020 (USD BILLION)
- TABLE 244 PLATFORM-AS-A-SERVICE: CLOUD COMPUTING MARKET, BY REGION, 2021–2026 (USD BILLION)
- TABLE 245 SOFTWARE-AS-A-SERVICE: CLOUD COMPUTING MARKET, BY REGION, 2015–2020 (USD BILLION)
- TABLE 246 SOFTWARE-AS-A-SERVICE: CLOUD COMPUTING MARKET, BY REGION, 2021–2026 (USD BILLION)
- TABLE 247 CLOUD COMPUTING MARKET, BY VERTICAL, 2015–2020 (USD BILLION)
- TABLE 248 CLOUD COMPUTING MARKET, BY VERTICAL, 2021–2026 (USD BILLION)
- TABLE 249 BANKING, FINANCIAL SERVICES, AND INSURANCE: CLOUD COMPUTING MARKET, BY REGION, 2015–2020 (USD BILLION)
- TABLE 250 BANKING, FINANCIAL SERVICES, AND INSURANCE: CLOUD COMPUTING MARKET, BY REGION, 2021–2026 (USD BILLION)
- TABLE 251 TELECOMMUNICATIONS: CLOUD COMPUTING MARKET, BY REGION, 2015–2020 (USD BILLION)
- TABLE 252 TELECOMMUNICATIONS: CLOUD COMPUTING MARKET, BY REGION, 2021–2026 (USD BILLION)
- TABLE 253 IT & ITES: CLOUD COMPUTING MARKET, BY REGION, 2015–2020 (USD BILLION)
- TABLE 254 IT & ITES: CLOUD COMPUTING MARKET, BY REGION, 2021–2026 (USD BILLION)
- TABLE 255 GOVERNMENT & PUBLIC SECTOR: CLOUD COMPUTING MARKET, BY REGION, 2015–2020 (USD BILLION)
- TABLE 256 GOVERNMENT & PUBLIC SECTOR: CLOUD COMPUTING MARKET, BY REGION, 2021–2026 (USD BILLION)
- TABLE 257 RETAIL & CONSUMER GOODS: CLOUD COMPUTING MARKET, BY REGION, 2015–2020 (USD BILLION)
- TABLE 258 RETAIL & CONSUMER GOODS: CLOUD COMPUTING MARKET, BY REGION, 2021–2026 (USD BILLION)
- TABLE 259 MANUFACTURING: CLOUD COMPUTING MARKET, BY REGION, 2015–2020 (USD BILLION)
- TABLE 260 MANUFACTURING: CLOUD COMPUTING MARKET, BY REGION, 2021–2026 (USD BILLION)
- TABLE 261 ENERGY & UTILITIES: CLOUD COMPUTING MARKET, BY REGION, 2015–2020 (USD BILLION)
- TABLE 262 ENERGY & UTILITIES: CLOUD COMPUTING MARKET, BY REGION, 2021–2026 (USD BILLION)
- TABLE 263 MEDIA & ENTERTAINMENT: CLOUD COMPUTING MARKET, BY REGION, 2015–2020 (USD BILLION)
- TABLE 264 MEDIA & ENTERTAINMENT: CLOUD COMPUTING MARKET, BY REGION, 2021–2026 (USD BILLION)
- TABLE 265 HEALTHCARE & LIFE SCIENCES: CLOUD COMPUTING MARKET, BY REGION, 2015–2020 (USD BILLION)
- TABLE 266 HEALTHCARE & LIFE SCIENCES: CLOUD COMPUTING MARKET, BY REGION, 2021–2026 (USD BILLION)
- TABLE 267 OTHERS: CLOUD COMPUTING MARKET, BY REGION, 2015–2020 (USD BILLION)
- TABLE 268 OTHERS: CLOUD COMPUTING MARKET, BY REGION, 2021–2026 (USD BILLION)
- TABLE 269 CLOUD STORAGE MARKET, BY COMPONENT, 2018–2021 (USD MILLION)
- TABLE 270 CLOUD STORAGE MARKET, BY COMPONENT, 2022–2027 (USD MILLION)
- TABLE 271 CLOUD STORAGE MARKET, BY APPLICATION, 2018–2021 (USD MILLION)
- TABLE 272 CLOUD STORAGE MARKET, BY APPLICATION, 2022–2027 (USD MILLION)
- TABLE 273 CLOUD STORAGE MARKET, BY ORGANIZATION SIZE, 2018–2021 (USD MILLION)
- TABLE 274 CLOUD STORAGE MARKET, BY ORGANIZATION SIZE, 2022–2027 (USD MILLION)
- TABLE 275 CLOUD STORAGE MARKET, BY VERTICAL, 2018–2021 (USD MILLION)
- TABLE 276 CLOUD STORAGE MARKET, BY VERTICAL, 2022–2027 (USD MILLION)
- FIGURE 1 CLOUD NATIVE STORAGE MARKET: RESEARCH DESIGN
- FIGURE 2 DATA TRIANGULATION
- FIGURE 3 MARKET: TOP-DOWN AND BOTTOM-UP APPROACHES
- FIGURE 4 MARKET SIZE ESTIMATION METHODOLOGY—APPROACH 1 (SUPPLY SIDE): REVENUE FROM SOLUTIONS/SERVICES OF MARKET
- FIGURE 5 MARKET SIZE ESTIMATION METHODOLOGY—APPROACH 2, BOTTOM-UP (SUPPLY SIDE): COLLECTIVE REVENUE FROM ALL SOLUTIONS/SERVICES OF MARKET
- FIGURE 6 MARKET SIZE ESTIMATION METHODOLOGY-APPROACH 3, BOTTOM-UP (SUPPLY SIDE): COLLECTIVE REVENUE FROM ALL SOLUTIONS/SERVICES OF MARKET
- FIGURE 7 MARKET SIZE ESTIMATION METHODOLOGY, BOTTOM-UP APPROACH (SUPPLY SIDE): COLLECTIVE REVENUE OF CLOUD NATIVE STORAGE VENDORS
- FIGURE 8 MARKET SIZE ESTIMATION METHODOLOGY (SUPPLY SIDE): CAGR PROJECTIONS FROM SUPPLY SIDE
- FIGURE 9 MARKET SIZE ESTIMATION METHODOLOGY-APPROACH 4, BOTTOM-UP (DEMAND SIDE): SHARE OF CLOUD NATIVE STORAGE THROUGH OVERALL CLOUD NATIVE STORAGE SPENDING
- FIGURE 10 TOP MARKET SEGMENTS IN TERMS OF GROWTH RATE
- FIGURE 11 CLOUD NATIVE STORAGE SOLUTIONS TO DOMINATE MARKET DURING FORECAST PERIOD
- FIGURE 12 PUBLIC CLOUD TO HOLD LARGER MARKET SHARE DURING FORECAST PERIOD
- FIGURE 13 BACKUP & RECOVERY TO HOLD LARGEST MARKET SHARE IN 2023
- FIGURE 14 TOP VERTICALS IN CLOUD NATIVE STORAGE MARKET, 2023–2028 (USD MILLION)
- FIGURE 15 NORTH AMERICA TO HOLD LARGEST MARKET SHARE AND ASIA PACIFIC TO GROW AT HIGHEST CAGR DURING FORECAST PERIOD
- FIGURE 16 EASE OF SWITCHING FROM ON-PREMISES TO CLOUD NATIVE STORAGE FOR FASTER RECOVERY AND DATA BACKUP TO DRIVE MARKET GROWTH
- FIGURE 17 MARKET TO WITNESS MINOR DECLINE IN Y-O-Y GROWTH IN 2023
- FIGURE 18 SOLUTIONS SEGMENT TO DOMINATE MARKET DURING FORECAST PERIOD
- FIGURE 19 BLOCK STORAGE TO HOLD LARGEST MARKET SHARE IN 2023
- FIGURE 20 PUBLIC CLOUD TO HOLD LARGEST MARKET SHARE DURING FORECAST PERIOD
- FIGURE 21 BACKUP & RECOVERY TO HOLD LARGEST MARKET SHARE DURING FORECAST PERIOD
- FIGURE 22 BFSI SEGMENT TO HOLD LARGEST MARKET SHARE DURING FORECAST PERIOD
- FIGURE 23 ASIA PACIFIC TO EMERGE AS BEST MARKET FOR INVESTMENT IN NEXT FIVE YEARS
- FIGURE 24 MARKET: DRIVERS, RESTRAINTS, OPPORTUNITIES, AND CHALLENGES
- FIGURE 25 CLOUD NATIVE STORAGE MARKET: EVOLUTION
- FIGURE 26 MARKET: ECOSYSTEM
- FIGURE 27 MARKET: SUPPLY CHAIN
- FIGURE 28 NUMBER OF PATENTS PUBLISHED, 2013–2023
- FIGURE 29 TOP TEN PATENT OWNERS, 2013–2023
- FIGURE 30 MARKET: PORTER’S FIVE FORCES ANALYSIS
- FIGURE 31 INFLUENCE OF STAKEHOLDERS ON BUYING PROCESS FOR TOP VERTICALS
- FIGURE 32 KEY BUYING CRITERIA FOR TOP THREE VERTICALS
- FIGURE 33 CLOUD NATIVE STORAGE MARKET: TRENDS/DISRUPTIONS IMPACTING BUYERS
- FIGURE 34 CLOUD NATIVE STORAGE SOLUTIONS TO DOMINATE MARKET DURING FORECAST PERIOD
- FIGURE 35 BLOCK STORAGE TO GROW AT HIGHEST CAGR DURING FORECAST PERIOD
- FIGURE 36 BACKUP & RECOVERY TO ACCOUNT FOR LARGEST MARKET IN 2023
- FIGURE 37 RETAIL & CONSUMER GOODS TO BE FASTEST-GROWING SEGMENT DURING FORECAST PERIOD
- FIGURE 38 ASIA PACIFIC TO GROW AT HIGHEST RATE DURING FORECAST PERIOD
- FIGURE 39 INDIA TO REGISTER HIGHEST GROWTH RATE DURING FORECAST PERIOD
- FIGURE 40 NORTH AMERICA: MARKET SNAPSHOT
- FIGURE 41 ASIA PACIFIC: MARKET SNAPSHOT
- FIGURE 42 BUSINESS SEGMENT REVENUE ANALYSIS
- FIGURE 43 MARKET SHARE ANALYSIS FOR KEY COMPANIES IN 2022
- FIGURE 44 CLOUD NATIVE STORAGE MARKET (GLOBAL): COMPANY EVALUATION MATRIX, 2022
- FIGURE 45 MARKET: STARTUP EVALUATION MATRIX, 2022
- FIGURE 46 MICROSOFT: COMPANY SNAPSHOT
- FIGURE 47 IBM: COMPANY SNAPSHOT
- FIGURE 48 AWS: COMPANY SNAPSHOT
- FIGURE 49 GOOGLE: COMPANY SNAPSHOT
- FIGURE 50 HPE: COMPANY SNAPSHOT
- FIGURE 51 DELL TECHNOLOGIES: COMPANY SNAPSHOT
- FIGURE 52 NETAPP: COMPANY SNAPSHOT
- FIGURE 53 PURE STORAGE: COMPANY SNAPSHOT
- FIGURE 54 SUSE: COMPANY SNAPSHOT
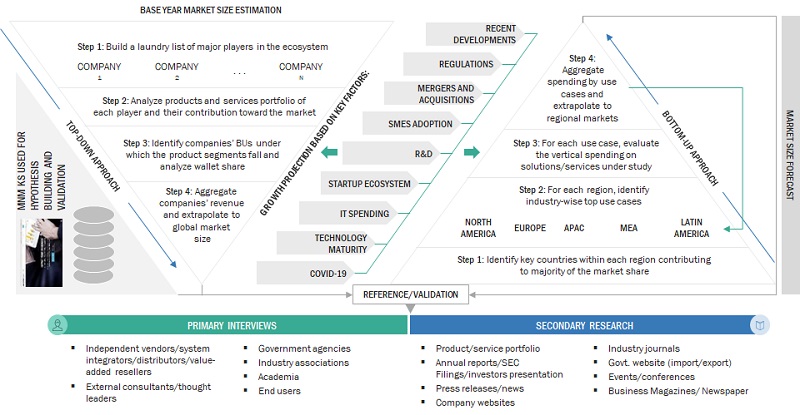
The study involved four major activities in estimating the size of the cloud native storage market. Exhaustive secondary research was done to collect information on the market, peer market, and parent market. The next step was to validate these findings, assumptions, and sizing with industry experts across value chains through primary research. The bottom-up approach was employed to estimate the overall market size. After that, market breakdown and data triangulation were used to estimate the market size of segments and subsegments.
Secondary Research
In the secondary research process, various secondary sources were referred to for identifying and collecting information for this study. The secondary sources included annual reports, press releases, investor presentations of companies, and whitepapers; certified publications; and articles from recognized associations and government publishing sources, such as the Cloud Native Computing Foundation (CNCF), Kubernetes and Cloud Native Associate (KCNA), Storage Networking Industry Association (SNIA) and Distributed Management Task Force (DMTF).
Secondary research was mainly used to obtain key information about the industry’s value chain, the total pool of key players, market classification and segmentation according to industry trends to the bottom-most level, and key developments from both market- and technology-oriented perspectives.
Primary Research
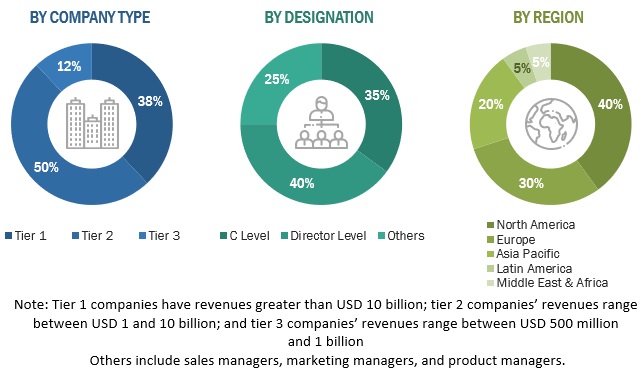
In the primary research process, various primary sources from both the supply and demand sides of the cloud native storage market ecosystem were interviewed to obtain qualitative and quantitative information for this study. The primary sources from the supply side included industry experts, such as Chief Executive Officers (CEOs), Vice Presidents (VPs), marketing directors, technology and innovation directors, and related key executives from various vendors providing cloud native storage offerings; associated service providers; and SIs operating in the targeted countries. All possible parameters that affect the market covered in this research study have been accounted for, viewed in extensive detail, verified through primary research, and analyzed to arrive at the final quantitative and qualitative data.
The following is the breakup of primary profiles:
To know about the assumptions considered for the study, download the pdf brochure
Market Size Estimation
To make the estimates and forecasts for the cloud native storage market and other dependent submarkets, both top-down and bottom-up approaches were used. The bottom-up procedure was deployed to arrive at the overall market size using the revenues and offerings of the key companies in the market. With data triangulation methods and validation through primary interviews, the exact value of the overall parent market size was determined and confirmed using this study. The overall market size was then used in the top-down procedure to estimate the size of the other individual markets via percentage splits of the market segments.
Global Cloud Native Storage Market Size: Bottom-Up and Top-Down Approach
Data Triangulation
After arriving at the overall market size—using the market size estimation processes as explained above—the market was split into several segments and subsegments. In order to complete the overall market engineering process and arrive at the exact statistics of each market segment and subsegment, data triangulation and market breakdown procedures were employed, wherever applicable. The data was triangulated by studying various factors and trends from both, the demand and supply sides, in the BFSI, government & public sector, healthcare & life sciences, telecom, IT & ITeS, manufacturing, energy & utilities, retail & consumer goods, media & entertainment, and other verticals. Others include education, and travel & hospitality.
Market Definition
- Cloud-native technologies empower organizations to build and run scalable applications in modern, dynamic environments such as public, private, and hybrid clouds. Containers, service meshes, microservices, immutable infrastructure, and declarative APIs exemplify this approach.
- Cloud-native architecture and technologies are an approach to designing, constructing, and operating workloads that are built in the cloud and take full advantage of the cloud computing model.
Stakeholders
- Cloud native storage vendors
- Cloud native storage service vendors
- Managed service providers
- Support and maintenance service providers
- System Integrators (SIs)/migration service providers
- Value-Added Resellers (VARs) and distributors
- Distributors and Value-added Resellers (VARs)
- System Integrators (SIs)
- Independent Software Vendors (ISV)
- Third-party providers
- Technology providers
- Independent software vendors
- Value-added resellers and distributors
Report Objectives
- To describe and forecast the cloud native storage market market based on offering, application, verticals, and regions
- To forecast the market size of five main regions: North America, Europe, Asia Pacific, Middle East & Africa, and Latin America
- To analyze subsegments with respect to individual growth trends, prospects, and contributions to the total market
- To provide detailed information about the major factors (drivers, restraints, opportunities, and challenges) influencing the growth of the market
- To analyze the opportunities in the market for stakeholders and provide details of the competitive landscape of the major players
- To comprehensively analyze the core competencies of the key players in the market
Available Customizations
With the given market data, MarketsandMarkets offers customizations as per your company’s specific needs. The following customization options are available for the report:
Product Analysis
- Product quadrant, which gives a detailed comparison of the product portfolio of each company.
Geographic Analysis
- Further breakup of the North American cloud native storage market
- Further breakup of the European market
- Further breakup of the Asia Pacific market
- Further breakup of the Middle Eastern & African market
- Further breakup of the Latin America cloud native storage market
Company Information
- Detailed analysis and profiling of additional market players (up to five)
Growth opportunities and latent adjacency in Cloud Native Storage Market