Climate Adaptation Market Size, Share & Trends

Climate Adaptation Market by Solution (Technology-based (BESS, CCS, DACCS), Early Climate Warning & Environmental Monitoring), End User (Government Agencies, Academia & Research Institutions, Industries), and Region - Global Forecast to 2030

Report Code: EP 9070 Jul, 2024, by marketsandmarkets.com

Climate Adaptation Market Size Share and Industry Trends

[255 Pages Report] The global climate adaptation market in terms of revenue was estimated to be worth $23.2 billion in 2024 and is poised to reach $40.4 billion by 2030, growing at a CAGR of 9.7% from 2024 to 2030. Government policies and regulations are pivotal drivers shaping the market for climate adaptation, particularly in the context of addressing pressing environmental challenges and increasing carbon emissions. Across the globe, governments are increasingly recognizing the urgent need to curb greenhouse gas emissions and mitigate the impacts of climate change.

Climate Adaptation Market

To know about the assumptions considered for the study, Request for Free Sample Report

Climate Adaptation Market

To know about the assumptions considered for the study, download the pdf brochure

Climate Adaptation Market Dynamics

Driver: Increasing extreme weather events

The world is experiencing extreme weather events, such as heatwaves, droughts, and floods. Recently, many regions have faced severe conditions. For example, according to Frontline, the Northern Hemisphere had its hottest summer in 2023; globally, 2024 is expected to be even warmer. In 2024, the US was hit by a high number of tornadoes. Over 100 tornadoes struck the Midwest and the Great Plains in just four days, causing significant damage and loss of life.

According to the Center for Science and Environment (CSE), between January 2023 and September 2023, extreme weather events in India resulted in 2,923 deaths, destruction of almost two million hectares of crops, 80,000 destroyed homes, and the death of over 92,000 animals. These weather events, caused by climate change, can lead to significant damage and loss of life.

Urgent climate adaptation measures are needed to mitigate these impacts. The Jet Propulsion Laboratory reports that the sea level is rising at an increasing rate. From 2022 to 2023, the sea level has increased by approximately 0.3 inches (0.76 centimeters). Rising sea levels may pose threats to coastal communities, disrupt coastal wetlands, and worsen the impact of storms. The primary cause for the rise in sea levels is the increasing temperature of the environment. Therefore, the rising sea level, a major consequence of climate change, augments the adoption of climate adaptation solutions.

Restraint: High upfront and operational cost

The significant investment needed is a major hindrance to adopting climate adaptation solutions, such as direct air capture and carbon Storage (DACCS), Bioenergy with Carbon Capture and Storage (BECCS), and various early climate warning and environmental monitoring solutions.

According to the Environmental Defense Fund (EDF), DAC has high upfront and operational costs. In addition, the cost of carbon removal, including storage, must decrease from USD 500–1,000 per ton to below USD 100 per ton for the technology to be widely adopted, as noted by the World Economic Forum (WEF). The substantial upfront investment required, which includes acquiring and integrating hardware and software, conducting workforce training, and potentially retrofitting existing infrastructure, can pose a barrier for end users of early climate warning and environmental monitoring solutions.

End users operating within tight budgets or facing economic uncertainties may find committing substantial funds to these technologies challenging. The perceived risk associated with uncertainty regarding the return on investment further contributes to hesitation in embracing these technologies.

Opportunities: Mounting investment in carbon removal technologies

Various countries and companies have been investing in climate tech to combat climate change. For instance, India’s climate-tech sector has seen a 29% increase in overall funding from 2019 to 2022, reaching a total investment of over USD 5 billion. This demonstrates strong confidence in the sector’s potential for impact.

In the US, the Department of Energy (DOE) has announced a USD 1.2 billion investment under the Bipartisan Infrastructure Law to support the development of two commercial-scale direct air capture facilities in Texas and Louisiana. Additionally, the Inflation Reduction Act has allocated USD 14.36 million to fund ten projects under the National Oceanic and Atmospheric Administration (NOAA’s) US Integrated Ocean Observing System Office as part of the Investing in Coastal Communities and Climate Resilience provision. Furthermore, the European Union’s Horizon Europe funding program for research and innovation plans to announce a tender for BECCS and DAC projects in September 2024.

Moreover, the US has allocated approximately USD 100 million for Carbon Dioxide Removal (CDR) pilot projects, which include Bioenergy with Carbon Capture and Storage (BECCS), as announced in February 2024). Investment in these technologies creates lucrative opportunities for climate adaptation.

Challenges: Complexities associated with integrating climate adaptation solutions in industrial sector

The United Nations Industrial Development Organization (UNIDO) reported a 2.3% growth in global industrial sectors in 2023, including manufacturing, mining, electricity, water supply, waste management, and other utilities. However, many of these industries contribute significantly to climate change.

For example, in 2023, the manufacturing sector in India became the second-largest source of greenhouse gas emissions. IBM refers to the current era as the fourth industrial revolution (Industry 4.0), characterized by automation, digitalization, and data exchange in manufacturing technologies. The adoption of these advanced technologies drives the manufacturing sector and increases productivity.

As industrialization surges, it has a pronounced impact on the climate, which requires integrating climate adaptation solutions within the industrial sector. However, adopting these solutions faces numerous challenges, including high implementation costs, technological complexity, regulatory uncertainties, and the need to align adaptation strategies with existing business models and objectives.

Climate adaptation market Ecosystem

In the climate adaptation sector, key companies are recognized for their stability and strong financial foundation. These firms offer a broad range of products, leveraging state-of-the-art technologies and extensive marketing networks. Their solid industry reputation makes them reliable and trusted partners for those seeking climate adaptation solutions. They have consistently demonstrated an ability to respond to market shifts and deliver superior products and services. Prominent companies in this market are Baker Hughes Company (US), Exxon Mobil Corporation (US), Climeworks (Switzerland), INTERNATIONAL BUSINESS MACHINES CORPORATION (US), and Vaisala (Finland).

Top Companies in Climate Adaptation Market

The early climate warning & environmental monitoring solutions segment, by solution, is expected to be the largest market during the forecast period.

This report segments the climate adaptation market based on solution into two categories: technology-based solution and early climate warning & environmental monitoring solutions. The climate adaptation market is seeing a surge in demand for early climate warning systems and environmental monitoring. This growth is driven by the need to proactively address the escalating impacts of climate change. By gathering real-time data and issuing timely alerts, these solutions empower communities and businesses to prepare for extreme weather events, rising sea levels, and other climate-related disruptions. This proactive approach helps minimize damage and fosters resilience in a changing environment.

By end user, industries segment is expected to be the largest segment share during the forecast period.

This report segments the climate adaptation market size based on end user into three segments: government agencies, academia & research institutions, and industries. The rise in global temperatures is primarily driven by increasing carbon dioxide (CO2) and greenhouse gases (GHGs). The industrial sector was responsible for nearly 23% of total GHG emissions in the US in 2022, according to the US Environmental Protection Agency (US EPA).

To address this issue and mitigate climate change, it is crucial to implement climate adaptation technologies, such as DAC, CCS, BECCS, afforestation, and reforestation, to capture emissions caused by industries. The International Energy Agency (IEA) suggests that carbon capture, utilization, and storage (CCUS) technology can be added to existing power and industrial plants to continue their operation while reducing emissions, particularly in hard-to-abate sectors, including heavy industries. Additionally, bioenergy with carbon capture & storage (BECCS) can help capture CO2 from processes where biomass is converted into fuels or directly burned for energy generation.

North America: The second largest region in the Climate adaptation market.

North America is expected to be the second largest market in the climate adaptation market size between 2024–2030. Climate adaptation in North America increasingly relies on innovative technology-based solutions and advanced early warning and monitoring systems to mitigate the impacts of climate change. Additionally, integrating renewable energy sources, such as solar and wind power, is crucial in transitioning to sustainable energy systems.

Climate Adaptation Market  Size, and Share

Key Market Players

The market is dominated by a few major players that have a wide regional presence. The major players in the climate adaptation market include Baker Hughes Company (US), Exxon Mobil Corporation (US), Climeworks (Switzerland), INTERNATIONAL BUSINESS MACHINES CORPORATION (US), and Vaisala (Finland).  Between 2020 and 2024, Strategies such as new product launches, contracts, agreements, partnerships, collaborations, acquisitions, and expansions are followed by these companies to capture a larger climate adaptation market share.

Want to explore hidden markets that can drive new revenue in Climate Adaptation Market?

Scope of the Report

Report Metric

Details

Market Size available for years

2020–2030

Base year considered

2023

Forecast period

2024–20

Forecast units

Value (USD Million)

Segments covered

By Solution, and By End user

Geographies covered

Asia Pacific, North America, Europe, Middle East and Africa, and South America 

Companies covered

INTERNATIONAL BUSINESS MACHINES CORPORATION (US), AccuWeather, Inc. (US), Earth Networks (US), DTN (US), Campbell Scientific, Inc. (US), Vaisala (Finland), Esri (US), OnSolve (US), Metasensing (Italy), METER Group (US), AEM (US), Nielsen-Kellerman Co. (US), BARANI DESIGN Technologies s. r. o. (Slovakia), Adolf Thies GmbH & Co. KG (Germany),  Previsico Limited (UK), Climeworks (Switzerland), Carbon Engineering ULC. (Canada), Global Thermostat (US), Heirloom Carbon Technologies (US), Soletair Power (Finland), SLB (US), Baker Hughes Company (US), Fluor Corporation (US), Exxon Mobil Corporation (US), Equinor ASA (Norway), Drax Group plc (UK), Clean Energy Systems (US), Babcock & Wilcox Enterprises, Inc (US), CRYOCOLLECT (France), and Carbon Clean Solutions Limited (UK)

The market is classified in this research report based on Solution, end user, and region.

Based on solution, the Climate adaptation market has been segmented as follows:
  • Nature-Based Solutions (Afforestation & Reforestation and Coastal & Marine Habitat Restoration)
  • Enhanced Natural Process Solutions (Land Management, Enhanced Weathering, and Ocean Fertilization)
  • Technology-based Solutions [Bioenergy with Carbon Capture & Storage (BECCS), Direct Air Capture & Carbon Storage (DACCS), and Carbon Capture & Storage (CCS)]
  • Early Climate Warning & Environment Monitoring Solutions (Solution and Application)
Based on End user, the Climate adaptation market has been segmented as follows:
  • Government Agencies
  • Academia and Research institutions
  • Industries (Oil & Gas, Power Generation, Chemical & Petrochemical, and Other Industries)
Based on regions, the climate adaptation market has been segmented as follows:
  • North America
  • Asia Pacific
  • South America
  • Europe
  • Middle East and Africa  

Recent Developments

  • In May 2024, Pertamina (the natural energy company of Indonesia), the national energy company, and Exxon Mobil Corporation collaborated to conduct appraisal drilling for a carbon capture and storage (CCS) hub in Indonesia, with the companies signing an initial storage deal with South Korea's KNOC in 2024. Indonesia, which estimates its depleted oil and gas reservoirs and saline aquifers could provide storage for hundreds of gigatons of CO2.
  • In April 2024, AccuWeather and Ambient Weather, a modern weather station technology leader, entered an exclusive partnership to offer superior real-time hyperlocal weather data and private weather station networks for local TV stations for the first time at NAB.
  • In March 2024, CGG, a multinational geoscience technology services company, signed a Memorandum of Understanding with Baker Hughes, an energy technology company, to explore jointly offered carbon capture & storage (CCS) solutions. The collaboration aims to support the growth of CCS projects by providing integrated solutions for screening, selecting, and monitoring carbon storage sites globally.

Frequently Asked Questions (FAQ):

To speak to our analyst for a discussion on the above findings, click Speak to Analyst

TABLE OF CONTENTS
 
1 INTRODUCTION (Page No. - 34)
    1.1 STUDY OBJECTIVES 
    1.2 MARKET DEFINITION 
    1.3 STUDY SCOPE 
           1.3.1 MARKETS COVERED
                    FIGURE 1 CLIMATE ADAPTATION MARKET SEGMENTATION
           1.3.2 INCLUSIONS AND EXCLUSIONS
           1.3.3 YEARS CONSIDERED
    1.4 CURRENCY CONSIDERED 
    1.5 UNITS CONSIDERED 
    1.6 LIMITATIONS 
    1.7 STAKEHOLDERS 
    1.8 IMPACT OF RECESSION 
 
2 RESEARCH METHODOLOGY (Page No. - 39)
    2.1 RESEARCH DATA 
           FIGURE 2 CLIMATE ADAPTATION MARKET: RESEARCH DESIGN
           2.1.1 PRIMARY AND SECONDARY RESEARCH
           2.1.2 SECONDARY DATA
                    2.1.2.1 List of key secondary sources
                    2.1.2.2 Key data from secondary sources
           2.1.3 PRIMARY DATA
                    2.1.3.1 List of primary interview participants
                    2.1.3.2 Key data from primary sources
                    2.1.3.3 Key industry insights
                    2.1.3.4 Breakdown of primaries
    2.2 MARKET BREAKDOWN AND DATA TRIANGULATION 
           FIGURE 3 MARKET: DATA TRIANGULATION
    2.3 MARKET SIZE ESTIMATION METHODOLOGY 
           2.3.1 BOTTOM-UP APPROACH
                    FIGURE 4 MARKET: BOTTOM-UP APPROACH
           2.3.2 TOP-DOWN APPROACH
                    FIGURE 5 MARKET: TOP-DOWN APPROACH
    2.4 DEMAND-SIDE ANALYSIS 
           2.4.1 DEMAND-SIDE METRICS
                    FIGURE 6 KEY METRICS CONSIDERED TO ANALYZE DEMAND FOR CLIMATE ADAPTATION SOLUTIONS
                    2.4.1.1 Demand-side assumptions
                    2.4.1.2 Demand-side calculations
    2.5 SUPPLY-SIDE ANALYSIS 
           2.5.1 SUPPLY-SIDE METRICS
                    FIGURE 7 KEY METRICS CONSIDERED TO ANALYZE SUPPLY OF CLIMATE  ADAPTATION SOLUTIONS
                    FIGURE 8 MARKET: SUPPLY-SIDE ANALYSIS
                    2.5.1.1 Supply-side assumptions
                    2.5.1.2 Supply-side calculations
    2.6 FORECAST 
    2.7 RESEARCH ASSUMPTIONS 
           FIGURE 9 MARKET: RESEARCH ASSUMPTIONS
    2.8 RISK ASSESSMENT 
           TABLE 1 MARKET: RISK ASSESSMENT
    2.9 RECESSION IMPACT 
 
3 EXECUTIVE SUMMARY (Page No. - 53)
    TABLE 2 CLIMATE ADAPTATION MARKET SNAPSHOT 
    FIGURE 10 EARLY CLIMATE WARNING & ENVIRONMENT MONITORING SOLUTIONS TO HOLD LARGER CLIMATE ADAPTATION MARKET SHARE IN 2030 
    FIGURE 11 INDUSTRIES SEGMENT TO DOMINATE CLIMATE ADAPTATION MARKET DURING FORECAST PERIOD 
    FIGURE 12 ASIA PACIFIC HELD LARGEST SHARE OF GLOBAL CLIMATE ADAPTATION MARKET  IN 2023 
 
4 PREMIUM INSIGHTS (Page No. - 56)
    4.1 ATTRACTIVE OPPORTUNITIES FOR PLAYERS IN CLIMATE ADAPTATION MARKET 
           FIGURE 13 RISING FOCUS ON ACHIEVING NET-ZERO CARBON EMISSION TARGETS TO CONTRIBUTE TO MARKET GROWTH
    4.2 CLIMATE ADAPTATION MARKET, BY SOLUTION 
           FIGURE 14 EARLY CLIMATE WARNING & ENVIRONMENT MONITORING SOLUTIONS SEGMENT TO ACCOUNT FOR LARGER MARKET SHARE IN 2030
    4.3 CLIMATE ADAPTATION MARKET, BY END USER 
           FIGURE 15 INDUSTRIES SEGMENT TO HOLD LARGEST SHARE OF MARKET IN 2030
    4.4 CLIMATE ADAPTATION MARKET, BY REGION 
           FIGURE 16 EUROPE TO WITNESS HIGHEST CAGR IN MARKET DURING FORECAST PERIOD
 
5 MARKET OVERVIEW (Page No. - 58)
    5.1 INTRODUCTION 
    5.2 MARKET DYNAMICS 
           FIGURE 17 CLIMATE ADAPTATION MARKET: DRIVERS, RESTRAINTS, OPPORTUNITIES,  AND CHALLENGES
           5.2.1 DRIVERS
                    5.2.1.1 Increasing extreme weather events
                    5.2.1.2 Rising commitment to combating climate change
           5.2.2 RESTRAINTS
                    5.2.2.1 High upfront and operational costs
           5.2.3 OPPORTUNITIES
                    5.2.3.1 Mounting investment in carbon removal technologies
           5.2.4 CHALLENGES
                    5.2.4.1 Complexities associated with deploying Climate Adaptation solutions in industrial sector
                    5.2.4.2 Lack of commercialization of Climate Adaptation technologies
    5.3 TRENDS/DISRUPTIONS IMPACTING CUSTOMERS’ BUSINESSES 
           FIGURE 18 TRENDS/DISRUPTIONS IMPACTING CUSTOMERS’ BUSINESSES
    5.4 INVESTMENT AND FUNDING SCENARIO 
           FIGURE 19 INVESTMENT AND FUNDING SCENARIO
    5.5 PRICING ANALYSIS 
           5.5.1 INDICATIVE PRICING TREND, BY TECHNOLOGY-BASED SOLUTION
                    TABLE 3 INDICATIVE PRICING TREND OF CO2 CAPTURING SOLUTIONS, BY TECHNOLOGY- BASED SOLUTION (USD/TON)
           5.5.2 INDICATIVE PRICING TREND, BY REGION
                    TABLE 4 INDICATIVE PRICING TREND OF CO2 CAPTURING SOLUTIONS, BY REGION (USD/TON)
    5.6 SUPPLY CHAIN ANALYSIS 
           FIGURE 20 SUPPLY CHAIN ANALYSIS
    5.7 ECOSYSTEM ANALYSIS 
           FIGURE 21 ECOSYSTEM ANALYSIS
           TABLE 5 ROLE OF COMPANIES IN CLIMATE ADAPTATION ECOSYSTEM
    5.8 REGULATORY LANDSCAPE 
           5.8.1 REGULATORY BODIES, GOVERNMENT AGENCIES, AND OTHER ORGANIZATIONS
                    TABLE 6 ASIA PACIFIC: LIST OF REGULATORY BODIES, GOVERNMENT AGENCIES,  AND OTHER ORGANIZATIONS
                    TABLE 7 NORTH AMERICA: LIST OF REGULATORY BODIES, GOVERNMENT AGENCIES, AND OTHER ORGANIZATIONS
                    TABLE 8 EUROPE: LIST OF REGULATORY BODIES, GOVERNMENT AGENCIES, AND OTHER ORGANIZATIONS
                    TABLE 9 MIDDLE EAST & AFRICA: LIST OF REGULATORY BODIES, GOVERNMENT AGENCIES, AND OTHER ORGANIZATIONS
                    TABLE 10 SOUTH AMERICA: LIST OF REGULATORY BODIES, GOVERNMENT AGENCIES, AND OTHER ORGANIZATIONS
           5.8.2 REGULATORY FRAMEWORK/POLICIES
    5.9 PATENT ANALYSIS 
           FIGURE 22 PATENTS APPLIED AND GRANTED, 2013–2023
           TABLE 11 LIST OF MAJOR PATENTS, 2019–2024
    5.1 CASE STUDY ANALYSIS 
           5.10.1 GROWY ADOPTS SKYTREE’S ONSITE DIRECT AIR CAPTURE TECHNOLOGY TO ENABLE SUSTAINABLE FARMING
           5.10.2 OIZOM INSTRUMENTS PVT. LTD. IMPLEMENTS POLLUDRONEXT SOLUTIONS TO ADDRESS ENVIRONMENTAL CONCERNS IN KAKINADA CITY
           5.10.3 COLOCATION SERVICE PROVIDER ADOPTS PACKET POWER’S COST-EFFECTIVE AND RELIABLE SOLUTION TO MONITOR ENVIRONMENTAL CONDITIONS
    5.11 TECHNOLOGY ANALYSIS 
           5.11.1 KEY TECHNOLOGIES
                    5.11.1.1 Direct air capture (DAC)
                    5.11.1.2 Remote sensing and satellite
           5.11.2 COMPLEMENTARY TECHNOLOGIES
                    5.11.2.1 Internet of Things (IoT)
                    5.11.2.2 Advanced analytics and artificial intelligence (AI)
           5.11.3 ADJACENT TECHNOLOGIES
                    5.11.3.1 Cell broadcast
                    5.11.3.2 Biotechnology
    5.12 KEY CONFERENCES AND EVENTS, 2024–2025 
                    TABLE 12 LIST OF KEY CONFERENCES AND EVENTS, 2024–2025
    5.13 TRADE ANALYSIS 
           5.13.1 IMPORT SCENARIO (HS CODE 281121)
                    TABLE 13 IMPORT DATA FOR HS CODE 281121-COMPLIANT PRODUCTS, BY COUNTRY,  2021–2023 (USD THOUSAND)
                    FIGURE 23 IMPORT DATA FOR HS CODE 281121-COMPLIANT PRODUCTS  FOR TOP 5 COUNTRIES, 2021–2023
           5.13.2 EXPORT SCENARIO (HS CODE 281121)
                    TABLE 14 EXPORT DATA FOR HS CODE 281121-COMPLIANT PRODUCTS, BY COUNTRY,  2021–2023 (USD THOUSAND)
                    FIGURE 24 EXPORT DATA FOR HS CODE 281121-COMPLIANT PRODUCTS FOR  TOP 5 COUNTRIES, 2021–2023
    5.14 PORTER’S FIVE FORCES ANALYSIS 
                    FIGURE 25 PORTER’S FIVE FORCES ANALYSIS
                    TABLE 15 PORTER’S FIVE FORCES ANALYSIS
           5.14.1 THREAT OF NEW ENTRANTS
           5.14.2 THREAT OF SUBSTITUTES
           5.14.3 BARGAINING POWER OF SUPPLIERS
           5.14.4 BARGAINING POWER OF BUYERS
           5.14.5 INTENSITY OF COMPETITIVE RIVALRY
    5.15 KEY STAKEHOLDERS AND BUYING CRITERIA 
           5.15.1 KEY STAKEHOLDERS IN BUYING PROCESS
                    FIGURE 26 INFLUENCE OF KEY STAKEHOLDERS ON BUYING PROCESS, BY END USER
                    TABLE 16 INFLUENCE OF STAKEHOLDERS ON BUYING PROCESS, BY END USER (%)
           5.15.2 BUYING CRITERIA
                    FIGURE 27 KEY BUYING CRITERIA, BY END USER
                    TABLE 17 KEY BUYING CRITERIA, BY END USER
 
6 CLIMATE ADAPTATION MARKET, BY SOLUTION (Page No. - 83)
    6.1 INTRODUCTION 
           FIGURE 28 CLIMATE ADAPTATION MARKET SHARE, BY SOLUTION, 2023
           TABLE 18 MARKET, BY SOLUTION, 2020–2023 (USD MILLION)
           TABLE 19 MARKET, BY SOLUTION, 2024–2030 (USD MILLION)
    6.2 NATURE-BASED SOLUTIONS (QUALITATIVE) 
           6.2.1 AFFORESTATION & REFORESTATION
           6.2.2 COASTAL & MARINE HABITAT RESTORATION
    6.3 ENHANCED NATURAL PROCESSES (QUALITATIVE) 
           6.3.1 LAND MANAGEMENT
           6.3.2 ENHANCED WEATHERING
           6.3.3 OCEAN FERTILIZATION
    6.4 TECHNOLOGY-BASED SOLUTIONS 
           TABLE 20 CLIMATE ADAPTATION MARKET, BY TECHNOLOGY-BASED SOLUTION,  2020–2023 (KILO TONS)
           TABLE 21 MARKET, BY TECHNOLOGY-BASED SOLUTION,  2024–2030 (KILO TONS)
           TABLE 22 MARKET, BY TECHNOLOGY-BASED SOLUTION,  2020–2023 (USD MILLION)
           TABLE 23 MARKET, BY TECHNOLOGY-BASED SOLUTION,  2024–2030 (USD MILLION)
           TABLE 24 TECHNOLOGY-BASED SOLUTIONS: MARKET,  BY REGION, 2020–2023 (USD MILLION)
           TABLE 25 TECHNOLOGY-BASED SOLUTIONS: MARKET, BY REGION,  2024–2030 (USD MILLION)
           6.4.1 BIOENERGY WITH CARBON CAPTURE & STORAGE (BECCS)
                    6.4.1.1 Government-led investments in achieving net-zero emission targets to foster segmental growth
           6.4.2 DIRECT AIR CAPTURE & CARBON STORAGE (DACCS)
                    6.4.2.1 Introduction of policies and tax credits to support carbon-capturing plant development to fuel segmental growth
           6.4.3 CARBON CAPTURE & STORAGE (CCS)
                    6.4.3.1 Emphasis on mitigating greenhouse gas emissions to facilitate segmental growth
    6.5 EARLY CLIMATE WARNING & ENVIRONMENT MONITORING SOLUTIONS 
           TABLE 26 EARLY CLIMATE WARNING & ENVIRONMENT MONITORING SOLUTIONS: CLIMATE ADAPTATION MARKET, BY SOLUTION TYPE, 2020–2023 (USD MILLION)
           TABLE 27 EARLY CLIMATE WARNING & ENVIRONMENT MONITORING SOLUTIONS: MARKET, BY SOLUTION TYPE, 2024–2030 (USD MILLION)
           6.5.1 BY SOLUTION TYPE
                    6.5.1.1 Data acquisition & transmission
                               6.5.1.1.1 Use to provide data for monitoring environmental conditions to boost segmental growth
                    6.5.1.2 Data processing & analysis
                               6.5.1.2.1 Ability to enhance environmental risk prediction to augment segmental growth
                    6.5.1.3 Data communication
                               6.5.1.3.1 Adoption to facilitate data dissemination for enhanced environmental decision-making to fuel segmental growth
                               TABLE 28 EARLY CLIMATE WARNING & ENVIRONMENT MONITORING SOLUTIONS: CLIMATE ADAPTION MARKET, BY APPLICATION, 2020–2023 (USD MILLION)
                               TABLE 29 EARLY CLIMATE WARNING & ENVIRONMENT MONITORING SOLUTIONS: MARKET, BY APPLICATION, 2024–2030 (USD MILLION)
                               TABLE 30 EARLY CLIMATE WARNING & ENVIRONMENT MONITORING SOLUTIONS: MARKET, BY REGION, 2020–2023 (USD MILLION)
                               TABLE 31 EARLY CLIMATE WARNING & ENVIRONMENT MONITORING SOLUTIONS: MARKET, BY REGION, 2024–2030 (USD MILLION)
           6.5.2 BY APPLICATION
                    6.5.2.1 Environmental monitoring systems
                               TABLE 32 ENVIRONMENTAL MONITORING SYSTEMS: MARKET, BY APPLICATION TYPE, 2020–2023 (USD MILLION)
                               TABLE 33 ENVIRONMENTAL MONITORING SYSTEMS: MARKET, BY APPLICATION TYPE, 2024–2030 (USD MILLION)
                               6.5.2.1.1 Air quality monitoring systems
                                             6.5.2.1.1.1 Rising focus on climate resilience and public health protection to foster segmental growth
                               6.5.2.1.2 Water quality monitoring systems
                                             6.5.2.1.2.1 Pressing need to avoid growth of harmful algae and bacteria to drive market
                               6.5.2.1.3 Land cover monitoring systems
                                             6.5.2.1.3.1 Growing focus on safeguarding biodiversity to augment segmental growth
                               6.5.2.1.4 Weather monitoring systems
                                             6.5.2.1.4.1 Rising need for periodic observation of atmospheric conditions to foster segmental growth
                    6.5.2.2 Early warning systems
                               TABLE 34 EARLY WARNING SYSTEMS: MARKET, BY TYPE,  2020–2023 (USD MILLION)
                               TABLE 35 EARLY WARNING SYSTEMS: MARKET, BY TYPE,  2024–2030 (USD MILLION)
                               6.5.2.2.1 Flood early warning systems
                                             6.5.2.2.1.1 Increasing damage due to natural disasters to boost segmental growth
                               6.5.2.2.2 Heatwave early warning systems
                                             6.5.2.2.2.1 Rising emphasis on effective planning and resource allocation in power sector to accelerate segmental growth
                               6.5.2.2.3 Drought early warning systems
                                             6.5.2.2.3.1 Increasing focus on crop management to facilitate segmental growth
 
7 CLIMATE ADAPTATION MARKET, BY END USER (Page No. - 97)
    7.1 INTRODUCTION 
           FIGURE 29 CLIMATE ADAPTATION MARKET SHARE, BY END USER, 2023
           TABLE 36 MARKET, BY END USER, 2020–2023 (USD MILLION)
           TABLE 37 MARKET, BY END USER, 2024–2030 (USD MILLION)
    7.2 GOVERNMENT AGENCIES 
           7.2.1 RISING EMPHASIS ON PROMOTING SUSTAINABLE LAND MANAGEMENT AND BIODIVERSITY CONSERVATION TO BOOST SEGMENTAL GROWTH
                    TABLE 38 GOVERNMENT AGENCIES: MARKET, BY REGION,  2020–2023 (USD MILLION)
                    TABLE 39 GOVERNMENT AGENCIES: MARKET, BY REGION,  2024–2030 (USD MILLION)
    7.3 ACADEMIA & RESEARCH INSTITUTIONS 
           7.3.1 GROWING NEED FOR EVIDENCE-BASED POLICIES ON CLIMATE CHANGE AND ENVIRONMENTAL PROTECTION TO DRIVE MARKET
                    TABLE 40 ACADEMIA & RESEARCH INSTITUTIONS: MARKET, BY REGION,  2020–2023 (USD MILLION)
                    TABLE 41 ACADEMIA & RESEARCH INSTITUTIONS: MARKET, BY REGION,  2024–2030 (USD MILLION)
    7.4 INDUSTRIES 
           TABLE 42 CLIMATE ADAPTATION MARKET, BY INDUSTRY, 2020–2023 (USD MILLION)
           TABLE 43 MARKET, BY INDUSTRY, 2024–2030 (USD MILLION)
           TABLE 44 INDUSTRIES: MARKET, BY REGION, 2020–2023 (USD MILLION)
           TABLE 45 INDUSTRIES: MARKET, BY REGION, 2024–2030 (USD MILLION)
           7.4.1 OIL & GAS
                    7.4.1.1 Increasing need to mitigate greenhouse gas emissions to boost segmental growth
           7.4.2 POWER GENERATION
                    7.4.2.1 Rising focus on preventing grid failures due to weather conditions to drive market
           7.4.3 CHEMICALS & PETROCHEMICALS
                    7.4.3.1 Increasing demand for carbon capture & storage technologies to fuel segmental growth
           7.4.4 OTHER INDUSTRIES
 
8 CLIMATE ADAPTATION MARKET, BY REGION (Page No. - 104)
    8.1 INTRODUCTION 
           FIGURE 30 EUROPE TO WITNESS HIGHEST CAGR IN GLOBAL CLIMATE ADAPTATION MARKET DURING FORECAST PERIOD
           FIGURE 31 CLIMATE ADAPTATION MARKET SHARE, BY REGION, 2023
           TABLE 46 CARBON DIOXIDE CAPTURED: MARKET, BY REGION,  2020–2023 (KILO TONS)
           TABLE 47 CARBON DIOXIDE CAPTURED: MARKET, BY REGION,  2024–2030 (KILO TONS)
           TABLE 48 MARKET, BY REGION, 2020–2023 (USD MILLION)
           TABLE 49 MARKET, BY REGION, 2024–2030 (USD MILLION)
    8.2 ASIA PACIFIC 
           FIGURE 32 ASIA PACIFIC: MARKET SNAPSHOT
           8.2.1 RECESSION IMPACT ON MARKET IN ASIA PACIFIC
                    TABLE 50 ASIA PACIFIC: CLIMATE ADAPTATION MARKET, BY SOLUTION, 2020–2023 (USD MILLION)
                    TABLE 51 ASIA PACIFIC: MARKET, BY SOLUTION, 2024–2030 (USD MILLION)
                    TABLE 52 ASIA PACIFIC: MARKET, BY END USER, 2020–2023 (USD MILLION)
                    TABLE 53 ASIA PACIFIC: MARKET, BY END USER, 2024–2030 (USD MILLION)
                    TABLE 54 ASIA PACIFIC: MARKET, BY COUNTRY, 2020–2023 (USD MILLION)
                    TABLE 55 ASIA PACIFIC: MARKET, BY COUNTRY, 2024–2030 (USD MILLION)
           8.2.2 CHINA
                    8.2.2.1 Growing adoption of climate warning systems to respond to extreme weather events to facilitate market growth
                               TABLE 56 CHINA: CARBON DIOXIDE EMISSION, 2016–2023 (MILLION TONS)
                               TABLE 57 CHINA: INSTALLED RENEWABLE ENERGY, BY SOURCE, 2019–2023 (MW)
                               TABLE 58 CHINA: MARKET, BY END USER, 2020–2023 (USD MILLION)
                               TABLE 59 CHINA: MARKET, BY END USER, 2024–2030 (USD MILLION)
           8.2.3 JAPAN
                    8.2.3.1 Rising focus on disaster preparedness to contribute to market growth
                               TABLE 60 JAPAN: CARBON DIOXIDE EMISSION, 2016–2023 (MILLION TONS)
                               TABLE 61 JAPAN: INSTALLED RENEWABLE ENERGY, BY SOURCE, 2019–2023 (MW)
                               TABLE 62 JAPAN: CLIMATE ADAPTATION MARKET, BY END USER, 2020–2023 (USD MILLION)
                               TABLE 63 JAPAN: MARKET, BY END USER, 2024–2030 (USD MILLION)
           8.2.4 INDIA
                    8.2.4.1 Increasing implementation of advanced energy efficiency technologies in industrial sector to boost market growth
                               TABLE 64 INDIA: CARBON DIOXIDE EMISSION, 2016–2023 (MILLION TONS)
                               TABLE 65 INDIA: INSTALLED RENEWABLE ENERGY, BY SOURCE, 2019–2023 (MW)
                               TABLE 66 INDIA: MARKET, BY END USER, 2020–2023 (USD MILLION)
                               TABLE 67 INDIA: MARKET, BY END USER, 2024–2030 (USD MILLION)
           8.2.5 AUSTRALIA
                    8.2.5.1 Rising government initiatives to reduce carbon emissions to accelerate market growth
                               TABLE 68 AUSTRALIA: CARBON DIOXIDE EMISSION, 2016–2023 (MILLION TONS)
                               TABLE 69 AUSTRALIA: INSTALLED RENEWABLE ENERGY, BY SOURCE, 2019–2023 (MW)
                               TABLE 70 AUSTRALIA: MARKET, BY END USER, 2020–2023 (USD MILLION)
                               TABLE 71 AUSTRALIA: MARKET, BY END USER, 2024–2030 (USD MILLION)
           8.2.6 REST OF ASIA PACIFIC
                    TABLE 72 REST OF ASIA PACIFIC: MARKET, BY END USER,  2020–2023 (USD MILLION)
                    TABLE 73 REST OF ASIA PACIFIC: MARKET, BY END USER,  2024–2030 (USD MILLION)
    8.3 NORTH AMERICA 
           8.3.1 RECESSION IMPACT ON MARKET IN NORTH AMERICA
                    FIGURE 33 NORTH AMERICA: MARKET SNAPSHOT
                    TABLE 74 NORTH AMERICA: CLIMATE ADAPTATION MARKET, BY SOLUTION,  2020–2023 (USD MILLION)
                    TABLE 75 NORTH AMERICA: MARKET, BY SOLUTION, 2024–2030 (USD MILLION)
                    TABLE 76 NORTH AMERICA: MARKET, BY END USER,  2020–2023 (USD MILLION)
                    TABLE 77 NORTH AMERICA: MARKET, BY END USER,  2024–2030 (USD MILLION)
                    TABLE 78 NORTH AMERICA: MARKET, BY COUNTRY,  2020–2023 (USD MILLION)
                    TABLE 79 NORTH AMERICA: MARKET, BY COUNTRY,  2024–2030 (USD MILLION)
           8.3.2 US
                    8.3.2.1 Increased funding to implement direct air capture technology to facilitate market growth
                               TABLE 80 US: CARBON DIOXIDE EMISSION, 2016–2023 (MILLION TONS)
                               TABLE 81 US: INSTALLED RENEWABLE ENERGY, BY SOURCE, 2019–2023 (MW)
                               TABLE 82 US: MARKET, BY END USER, 2020–2023 (USD MILLION)
                               TABLE 83 US: MARKET, BY END USER, 2024–2030 (USD MILLION)
           8.3.3 CANADA
                    8.3.3.1 Rising adoption of carbon management strategies to contribute to market growth
                               TABLE 84 CANADA: CARBON DIOXIDE EMISSION, 2016–2023 (MILLION TONS)
                               TABLE 85 CANADA: INSTALLED RENEWABLE ENERGY, BY SOURCE, 2019–2023 (MW)
                               TABLE 86 CANADA: MARKET, BY END USER, 2020–2023 (USD MILLION)
                               TABLE 87 CANADA: MARKET, BY END USER, 2024–2030 (USD MILLION)
           8.3.4 MEXICO
                    8.3.4.1 High emphasis on forest conservation and restoration efforts to boost market growth
                               TABLE 88 MEXICO: CARBON DIOXIDE EMISSION, 2016–2023 (MILLION TONS)
                               TABLE 89 MEXICO: INSTALLED RENEWABLE ENERGY, BY SOURCE, 2019–2023 (MW)
                               TABLE 90 MEXICO: MARKET, BY END USER, 2020–2023 (USD MILLION)
                               TABLE 91 MEXICO: MARKET, BY END USER, 2024–2030 (USD MILLION)
    8.4 EUROPE 
           8.4.1 RECESSION IMPACT ON MARKET IN EUROPE
                    TABLE 92 EUROPE: CLIMATE ADAPTATION MARKET, BY SOLUTION, 2020–2023 (USD MILLION)
                    TABLE 93 EUROPE: MARKET, BY SOLUTION, 2024–2030 (USD MILLION)
                    TABLE 94 EUROPE: MARKET, BY END USER, 2020–2023 (USD MILLION)
                    TABLE 95 EUROPE: MARKET, BY END USER, 2024–2030 (USD MILLION)
                    TABLE 96 EUROPE: MARKET, BY COUNTRY, 2020–2023 (USD MILLION)
                    TABLE 97 EUROPE: MARKET, BY COUNTRY, 2024–2030 (USD MILLION)
           8.4.2 NETHERLANDS
                    8.4.2.1 Rising vertical indoor farming and agricultural exports to fuel market growth
                               TABLE 98 NETHERLANDS: CARBON DIOXIDE EMISSION, 2016–2023 (MILLION TONS)
                               TABLE 99 NETHERLANDS: INSTALLED RENEWABLE ENERGY, BY SOURCE, 2019–2023 (MW)
                               TABLE 100 NETHERLANDS: MARKET, BY END USER, 2020–2023 (USD MILLION)
                               TABLE 101 NETHERLANDS: MARKET, BY END USER, 2024–2030 (USD MILLION)
           8.4.3 ITALY
                    8.4.3.1 Increasing need for real-time data to monitor weather patterns to boost market growth
                               TABLE 102 ITALY: CARBON DIOXIDE EMISSION, 2016–2023 (MILLION TONS)
                               TABLE 103 ITALY: MARKET, BY END USER, 2020–2023 (USD MILLION)
                               TABLE 104 ITALY: MARKET, BY END USER, 2024–2030 (USD MILLION)
           8.4.4 FRANCE
                    8.4.4.1 Mounting deployment of DAC technology to combat climate change to foster market growth
                               TABLE 105 FRANCE: CARBON DIOXIDE EMISSION, 2016–2023 (MILLION TONS)
                               TABLE 106 FRANCE: MARKET, BY END USER, 2020–2023 (USD MILLION)
                               TABLE 107 FRANCE: MARKET, BY END USER, 2024–2030 (USD MILLION)
           8.4.5 UK
                    8.4.5.1 Increasing investment in early warning systems to identify potential climate-related risks to drive market
                               TABLE 108 UK: CARBON DIOXIDE EMISSION, 2016–2022 (MILLION TONS)
                               TABLE 109 UK: CLIMATE ADAPTATION MARKET, BY END USER, 2020–2023 (USD MILLION)
                               TABLE 110 UK: MARKET, BY END USER, 2024–2030 (USD MILLION)
           8.4.6 NORWAY
                    8.4.6.1 Mounting demand for renewable power to augment market growth
                               TABLE 111 NORWAY: CARBON DIOXIDE EMISSION, 2016–2023 (MILLION TONS)
                               TABLE 112 NORWAY: MARKET, BY END USER, 2020–2023 (USD MILLION)
                               TABLE 113 NORWAY: MARKET, BY END USER, 2024–2030 (USD MILLION)
           8.4.7 REST OF EUROPE
                    TABLE 114 REST OF EUROPE: MARKET, BY END USER,  2020–2023 (USD MILLION)
                    TABLE 115 REST OF EUROPE: MARKET, BY END USER,  2024–2030 (USD MILLION)
    8.5 MIDDLE EAST & AFRICA 
           8.5.1 RECESSION IMPACT ON MARKET IN MIDDLE EAST & AFRICA
                    TABLE 116 MIDDLE EAST & AFRICA: CLIMATE ADAPTATION MARKET, BY SOLUTION,  2020–2023 (USD MILLION)
                    TABLE 117 MIDDLE EAST & AFRICA: MARKET, BY SOLUTION,  2024–2030 (USD MILLION)
                    TABLE 118 MIDDLE EAST & AFRICA: MARKET, BY END USER,  2020–2023 (USD MILLION)
                    TABLE 119 MIDDLE EAST & AFRICA: MARKET, BY END USER,  2024–2030 (USD MILLION)
                    TABLE 120 MIDDLE EAST & AFRICA: MARKET, BY COUNTRY,  2020–2023 (USD MILLION)
                    TABLE 121 MIDDLE EAST & AFRICA: MARKET, BY COUNTRY,  2024–2030 (USD MILLION)
           8.5.2 GCC COUNTRIES
                    8.5.2.1 UAE
                               8.5.2.1.1 Increasing initiatives to combat climate change to boost market growth
                               TABLE 122 UAE: CARBON DIOXIDE EMISSION, 2016–2023 (MILLION TONS)
                               TABLE 123 UAE: INSTALLED RENEWABLE ENERGY, BY SOURCE, 2019–2023 (MW)
                               TABLE 124 UAE: MARKET, BY END USER, 2020–2023 (USD MILLION)
                               TABLE 125 UAE: MARKET, BY END USER, 2024–2030 (USD MILLION)
                    8.5.2.2 Saudi Arabia
                               8.5.2.2.1 Rising commitment to achieving net-zero carbon footprint to augment market growth
                               TABLE 126 SAUDI ARABIA: CARBON DIOXIDE EMISSION, 2016–2023 (MILLION TONS)
                               TABLE 127 SAUDI ARABIA: INSTALLED RENEWABLE ENERGY, BY SOURCE, 2019–2023 (MW)
                               TABLE 128 SAUDI ARABIA: MARKET, BY END USER, 2020–2023 (USD MILLION)
                               TABLE 129 SAUDI ARABIA: MARKET, BY END USER, 2024–2030 (USD MILLION)
                    8.5.2.3 Rest of GCC countries
                               TABLE 130 REST OF GCC COUNTRIES: MARKET, BY END USER,  2020–2023 (USD MILLION)
                               TABLE 131 REST OF GCC COUNTRIES: MARKET, BY END USER,  2024–2030 (USD MILLION)
           8.5.3 AFRICA & REST OF MIDDLE EAST
                    TABLE 132 AFRICA & REST OF MIDDLE EAST: MARKET, BY END USER,  2020–2023 (USD MILLION)
                    TABLE 133 AFRICA & REST OF MIDDLE EAST: MARKET, BY END USER,  2024–2030 (USD MILLION)
    8.6 SOUTH AMERICA 
           8.6.1 RECESSION IMPACT ON MARKET IN SOUTH AMERICA
                    TABLE 134 SOUTH AMERICA: CLIMATE ADAPTATION MARKET, BY SOLUTION,  2020–2023 (USD MILLION)
                    TABLE 135 SOUTH AMERICA: MARKET, BY SOLUTION,  2024–2030 (USD MILLION)
                    TABLE 136 SOUTH AMERICA: MARKET, BY END USER,  2020–2023 (USD MILLION)
                    TABLE 137 SOUTH AMERICA: MARKET, BY END USER,  2024–2030 (USD MILLION)
                    TABLE 138 SOUTH AMERICA: MARKET, BY COUNTRY, 2020–2023 (USD MILLION)
                    TABLE 139 SOUTH AMERICA: MARKET, BY COUNTRY, 2024–2030 (USD MILLION)
           8.6.2 BRAZIL
                    8.6.2.1 Growing emphasis on addressing deforestation and promoting sustainable land use to boost market growth
                               TABLE 140 BRAZIL: CARBON DIOXIDE EMISSION, 2016–2023 (MILLION TONS)
                               TABLE 141 BRAZIL: INSTALLED RENEWABLE ENERGY, BY SOURCE, 2019–2023 (MW)
                               TABLE 142 BRAZIL: MARKET, BY END USER, 2020–2023 (USD MILLION)
                               TABLE 143 BRAZIL: MARKET, BY END USER, 2024–2030 (USD MILLION)
           8.6.3 CHILE
                    8.6.3.1 Increasing focus on reducing carbon emissions from power sector and chemicals industry to drive market
                               TABLE 144 CHILE: CARBON DIOXIDE EMISSION, 2016–2023 (MILLION TONS)
                               TABLE 145 CHILE: INSTALLED RENEWABLE ENERGY, BY SOURCE, 2019–2023 (MW)
                               TABLE 146 CHILE: MARKET, BY END USER, 2020–2023 (USD MILLION)
                               TABLE 147 CHILE: MARKET, BY END USER, 2024–2030 (USD MILLION)
           8.6.4 ARGENTINA
                    8.6.4.1 Rising construction of carbon capture and storage plants to foster market growth
                               TABLE 148 ARGENTINA: CARBON DIOXIDE EMISSION, 2016–2023 (MILLION TONS)
                               TABLE 149 ARGENTINA: INSTALLED RENEWABLE ENERGY, BY SOURCE, 2019–2023 (MW)
                               TABLE 150 ARGENTINA: MARKET, BY END USER, 2020–2023 (USD MILLION)
                               TABLE 151 ARGENTINA: MARKET, BY END USER, 2024–2030 (USD MILLION)
           8.6.5 REST OF SOUTH AMERICA
                    TABLE 152 REST OF SOUTH AMERICA: MARKET, BY END USER,  2020–2023 (USD MILLION)
                    TABLE 153 REST OF SOUTH AMERICA: MARKET, BY END USER,  2024–2030 (USD MILLION)
 
9 COMPETITIVE LANDSCAPE (Page No. - 148)
    9.1 OVERVIEW 
    9.2 KEY PLAYER STRATEGIES/RIGHT TO WIN, 2020–2024 
           TABLE 154 MARKET: OVERVIEW OF STRATEGIES ADOPTED BY KEY PLAYERS, 2020–2024
    9.3 MARKET SHARE ANALYSIS, 2023 
           TABLE 155 MARKET: DEGREE OF COMPETITION
           FIGURE 34 CLIMATE ADAPTATION MARKET SHARE ANALYSIS, 2023
    9.4 REVENUE ANALYSIS, 2019–2023 
           FIGURE 35 CLIMATE ADAPTATION MARKET: REVENUE ANALYSIS OF FOUR KEY PLAYERS,  2019–2023
    9.5 COMPANY VALUATION AND FINANCIAL METRICS 
           FIGURE 36 COMPANY VALUATION (USD BILLION)
           FIGURE 37 FINANCIAL METRICS (EV/EBITDA)
    9.6 BRAND/PRODUCT COMPARISON 
           FIGURE 38 BRAND/PRODUCT COMPARISON
    9.7 COMPANY EVALUATION MATRIX: TECHNOLOGY-BASED SOLUTION PROVIDERS, 2023 
           9.7.1 STARS
           9.7.2 EMERGING LEADERS
           9.7.3 PERVASIVE PLAYERS
           9.7.4 PARTICIPANTS
                    FIGURE 39 MARKET: COMPANY EVALUATION MATRIX (TECHNOLOGY-BASED SOLUTION PROVIDERS), 2023
           9.7.5 COMPANY FOOTPRINT: TECHNOLOGY-BASED SOLUTION  PROVIDERS, 2023
                    9.7.5.1 Company footprint
                               FIGURE 40 MARKET (TECHNOLOGY-BASED SOLUTION PROVIDERS): COMPANY FOOTPRINT
                    9.7.5.2 Region footprint
                               TABLE 156 MARKET (TECHNOLOGY-BASED SOLUTION PROVIDERS):  REGION FOOTPRINT
                    9.7.5.3 Technology-based solution footprint
                               TABLE 157 MARKET (TECHNOLOGY-BASED SOLUTION PROVIDERS): TECHNOLOGY-BASED SOLUTION FOOTPRINT
                    9.7.5.4 End user footprint
                               TABLE 158 MARKET (TECHNOLOGY-BASED SOLUTION PROVIDERS):  END USER FOOTPRINT
    9.8 COMPANY EVALUATION MATRIX: EARLY CLIMATE WARNING & ENVIRONMENT MONITORING SOLUTION PROVIDERS, 2023 
           9.8.1 STARS
           9.8.2 EMERGING LEADERS
           9.8.3 PERVASIVE PLAYERS
           9.8.4 PARTICIPANTS
                    FIGURE 41 CLIMATE ADAPTATION MARKET: COMPANY EVALUATION MATRIX (EARLY CLIMATE WARNING & ENVIRONMENT MONITORING SOLUTION PROVIDERS), 2023
           9.8.5 COMPANY FOOTPRINT: EARLY CLIMATE WARNING & ENVIRONMENT MONITORING SOLUTION PROVIDERS, 2023
                    9.8.5.1 Company footprint
                               FIGURE 42 MARKET (EARLY CLIMATE WARNING & ENVIRONMENT MONITORING SOLUTION PROVIDERS): COMPANY FOOTPRINT
                    9.8.5.2 Region footprint
                               TABLE 159 MARKET (EARLY CLIMATE WARNING & ENVIRONMENT MONITORING SOLUTION PROVIDERS): REGION FOOTPRINT
                    9.8.5.3 Early climate warning & environment monitoring solution footprint
                               TABLE 160 MARKET (EARLY CLIMATE WARNING & ENVIRONMENT MONITORING SOLUTION PROVIDERS): EARLY CLIMATE WARNING & ENVIRONMENT MONITORING SOLUTION FOOTPRINT
                    9.8.5.4 Application footprint
                               TABLE 161 MARKET (EARLY CLIMATE WARNING & ENVIRONMENT MONITORING SOLUTION PROVIDERS): APPLICATION FOOTPRINT
                    9.8.5.5 End user footprint
                               TABLE 162 MARKET (EARLY CLIMATE WARNING & ENVIRONMENT MONITORING SOLUTION PROVIDERS): END USER FOOTPRINT
    9.9 COMPETITIVE SCENARIO AND TRENDS 
           9.9.1 DEALS
                    TABLE 163 MARKET: DEALS, MAY 2020–MAY 2024
           9.9.2 EXPANSIONS
                    TABLE 164 MARKET: EXPANSIONS, MAY 2020–MAY 2024
           9.9.3 OTHERS
                    TABLE 165 MARKET: OTHERS, MAY 2020–MAY 2024
 
10 COMPANY PROFILES (Page No. - 173)
(Business overview, Products/Services/Solutions offered, Recent Developments, MNM view)*
     10.1 TECHNOLOGY-BASED SOLUTION PROVIDERS 
             10.1.1 BAKER HUGHES COMPANY
                       TABLE 166 BAKER HUGHES COMPANY: COMPANY OVERVIEW
                       FIGURE 43 BAKER HUGHES COMPANY: COMPANY SNAPSHOT
                       TABLE 167 BAKER HUGHES COMPANY: PRODUCTS/SERVICES/SOLUTIONS OFFERED
                       TABLE 168 BAKER HUGHES COMPANY: DEALS
                       TABLE 169 BAKER HUGHES COMPANY: OTHERS
             10.1.2 EXXON MOBIL CORPORATION
                       TABLE 170 EXXON MOBIL CORPORATION: COMPANY OVERVIEW
                       FIGURE 44 EXXON MOBIL CORPORATION: COMPANY SNAPSHOT
                       TABLE 171 EXXON MOBIL CORPORATION: PRODUCTS/SERVICES/SOLUTIONS OFFERED
                       TABLE 172 EXXON MOBIL CORPORATION: DEALS
                       TABLE 173 EXXON MOBIL CORPORATION: EXPANSIONS
             10.1.3 CLIMEWORKS
                       TABLE 174 CLIMEWORKS: COMPANY OVERVIEW
                       TABLE 175 CLIMEWORKS: PRODUCTS/SERVICES/SOLUTIONS OFFERED
                       TABLE 176 CLIMEWORKS: DEALS
                       TABLE 177 CLIMEWORKS: EXPANSIONS
             10.1.4 SLB
                       TABLE 178 SLB: COMPANY OVERVIEW
                       FIGURE 45 SLB: COMPANY SNAPSHOT
                       TABLE 179 SLB: PRODUCTS/SERVICES/SOLUTIONS OFFERED
                       TABLE 180 SLB: DEALS
             10.1.5 FLUOR CORPORATION
                       TABLE 181 FLUOR CORPORATION: COMPANY OVERVIEW
                       FIGURE 46 FLUOR CORPORATION: COMPANY SNAPSHOT
                       TABLE 182 FLUOR CORPORATION: PRODUCTS/SERVICES/SOLUTIONS OFFERED
                       TABLE 183 FLUOR CORPORATION: DEALS
                       TABLE 184 FLUOR CORPORATION: OTHERS
             10.1.6 EQUINOR ASA
                       TABLE 185 EQUINOR ASA: COMPANY OVERVIEW
                       FIGURE 47 EQUINOR ASA: COMPANY SNAPSHOT
                       TABLE 186 EQUINOR ASA: PRODUCTS/SERVICES/SOLUTIONS OFFERED
                       TABLE 187 EQUINOR ASA: DEALS
             10.1.7 DRAX GROUP PLC
                       TABLE 188 DRAX GROUP PLC: COMPANY OVERVIEW
                       FIGURE 48 DRAX GROUP PLC: COMPANY SNAPSHOT
                       TABLE 189 DRAX GROUP PLC: PRODUCTS/SERVICES/SOLUTIONS OFFERED
                       TABLE 190 DRAX GROUP PLC: DEALS
                       TABLE 191 DRAX GROUP PLC: OTHERS
             10.1.8 BABCOCK & WILCOX ENTERPRISES, INC.
                       TABLE 192 BABCOCK & WILCOX ENTERPRISES, INC.: COMPANY OVERVIEW
                       FIGURE 49 BABCOCK & WILCOX ENTERPRISES, INC.: COMPANY SNAPSHOT
                       TABLE 193 BABCOCK & WILCOX ENTERPRISES, INC.: PRODUCTS/SERVICES/SOLUTIONS OFFERED
                       TABLE 194 BABCOCK & WILCOX ENTERPRISES, INC.: DEALS
             10.1.9 CLEAN ENERGY SYSTEMS
                       TABLE 195 CLEAN ENERGY SYSTEMS: COMPANY OVERVIEW
                       TABLE 196 CLEAN ENERGY SYSTEMS: PRODUCTS/SERVICES/SOLUTIONS OFFERED
                       TABLE 197 CLEAN ENERGY SYSTEMS: DEALS
               10.1.10 CARBON ENGINEERING ULC.
                                   TABLE 198 CARBON ENGINEERING ULC.: COMPANY OVERVIEW
                                   TABLE 199 CARBON ENGINEERING ULC.: PRODUCTS/SERVICES/SOLUTIONS OFFERED
                                   TABLE 200 CARBON ENGINEERING ULC.: DEALS
                                   TABLE 201 CARBON ENGINEERING ULC.: EXPANSIONS
               10.1.11 GLOBAL THERMOSTAT
                                   TABLE 202 GLOBAL THERMOSTAT: COMPANY OVERVIEW
                                   TABLE 203 GLOBAL THERMOSTAT: PRODUCTS/SERVICES/SOLUTIONS OFFERED
                                   TABLE 204 GLOBAL THERMOSTAT: DEALS
                                   TABLE 205 GLOBAL THERMOSTAT: EXPANSIONS
               10.1.12 HEIRLOOM CARBON TECHNOLOGIES
                                   TABLE 206 HEIRLOOM CARBON TECHNOLOGIES: COMPANY OVERVIEW
                                   TABLE 207 HEIRLOOM CARBON TECHNOLOGIES: PRODUCTS/SERVICES/SOLUTIONS OFFERED
                                   TABLE 208 HEIRLOOM CARBON TECHNOLOGIES: DEALS
                                   TABLE 209 HEIRLOOM CARBON TECHNOLOGIES: EXPANSIONS
               10.1.13 SOLETAIR POWER
                                   TABLE 210 SOLETAIR POWER: COMPANY OVERVIEW
                                   TABLE 211 SOLETAIR POWER: PRODUCTS/SERVICES/SOLUTIONS OFFERED
                                   TABLE 212 SOLETAIR POWER: DEALS
                                   TABLE 213 SOLETAIR POWER: OTHERS
     10.2 EARLY CLIMATE WARNING & ENVIRONMENT MONITORING SOLUTION PROVIDERS 
             10.2.1 INTERNATIONAL BUSINESS MACHINES CORPORATION
                       TABLE 214 INTERNATIONAL BUSINESS MACHINES CORPORATION: COMPANY OVERVIEW
                       FIGURE 50 INTERNATIONAL BUSINESS MACHINES CORPORATION: COMPANY SNAPSHOT
                       TABLE 215 INTERNATIONAL BUSINESS MACHINES CORPORATION: PRODUCTS/SERVICES/SOLUTIONS OFFERED
                       TABLE 216 INTERNATIONAL BUSINESS MACHINES CORPORATION: PRODUCT LAUNCHES
                       TABLE 217 INTERNATIONAL BUSINESS MACHINES CORPORATION: DEALS
             10.2.2 VAISALA
                       TABLE 218 VAISALA: COMPANY OVERVIEW
                       FIGURE 51 VAISALA: COMPANY SNAPSHOT
                       TABLE 219 VAISALA: PRODUCTS/SERVICES/SOLUTIONS OFFERED
                       TABLE 220 VAISALA: DEALS
             10.2.3 ACCUWEATHER, INC.
                       TABLE 221 ACCUWEATHER, INC.: COMPANY OVERVIEW
                       TABLE 222 ACCUWEATHER, INC.: PRODUCTS/SERVICES/SOLUTIONS OFFERED
                       TABLE 223 ACCUWEATHER, INC: DEALS
             10.2.4 EARTH NETWORKS
                       TABLE 224 EARTH NETWORKS: COMPANY OVERVIEW
                       TABLE 225 EARTH NETWORKS: PRODUCTS/SERVICES/SOLUTIONS OFFERED
                       TABLE 226 EARTH NETWORKS: DEALS
             10.2.5 DTN
                       TABLE 227 DTN: COMPANY OVERVIEW
                       TABLE 228 DTN: PRODUCTS/SERVICES/SOLUTIONS OFFERED
                       TABLE 229 DTN: DEALS
             10.2.6 CAMPBELL SCIENTIFIC, INC.
                       TABLE 230 CAMPBELL SCIENTIFIC, INC.: COMPANY OVERVIEW
                       TABLE 231 CAMPBELL SCIENTIFIC, INC.: PRODUCTS/SERVICES/SOLUTIONS OFFERED
                       TABLE 232 CAMPBELL SCIENTIFIC, INC.: PRODUCT LAUNCHES
                       TABLE 233 CAMPBELL SCIENTIFIC, INC.: DEALS
             10.2.7 ESRI
                       TABLE 234 ESRI: COMPANY OVERVIEW
                       TABLE 235 ESRI: PRODUCTS/SERVICES/SOLUTIONS OFFERED
                       TABLE 236 ESRI: DEALS
             10.2.8 AEM
                       TABLE 237 AEM: COMPANY OVERVIEW
                       TABLE 238 AEM: PRODUCTS/SERVICES/SOLUTIONS OFFERED
                       TABLE 239 AEM: OTHERS
     10.3 OTHER PLAYERS 
             10.3.1 OTHER TECHNOLOGY-BASED SOLUTION PROVIDERS
                       10.3.1.1 Carbon Clean
                                   TABLE 240 CARBON CLEAN: COMPANY OVERVIEW
                       10.3.1.2 CRYOCOLLECT
                                   TABLE 241 CRYOCOLLECT: COMPANY OVERVIEW
             10.3.2 OTHER EARLY CLIMATE WARNING & ENVIRONMENT MONITORING SOLUTION PROVIDERS
                       10.3.2.1 OnSolve
                                   TABLE 242 ONSOLVE: COMPANY OVERVIEW
                       10.3.2.2 Metasensing
                                   TABLE 243 METASENSING: COMPANY OVERVIEW
                       10.3.2.3 METER Group
                                   TABLE 244 METER GROUP: COMPANY OVERVIEW
                       10.3.2.4 Nielsen-Kellerman Co.
                                   TABLE 245 NIELSEN-KELLERMAN CO.: COMPANY OVERVIEW
                       10.3.2.5 Barani Design Technologies s. r. o.
                                   TABLE 246 BARANI DESIGN TECHNOLOGIES S. R. O.: COMPANY OVERVIEW
                       10.3.2.6 Adolf Thies GMBH & Co. KG
                                   TABLE 247 ADOLF THIES GMBH & CO. KG: COMPANY OVERVIEW
                       10.3.2.7 Previsico Limited
                                   TABLE 248 PREVISICO LIMITED: COMPANY OVERVIEW
*Details on Business overview, Products/Services/Solutions offered, Recent Developments, MNM view might not be captured in case of unlisted companies.
 
11 APPENDIX (Page No. - 247)
     11.1 INSIGHTS FROM INDUSTRY EXPERTS 
     11.2 DISCUSSION GUIDE 
     11.3 KNOWLEDGESTORE: MARKETSANDMARKETS’  SUBSCRIPTION PORTAL 
     11.4 CUSTOMIZATION OPTIONS 
     11.5 RELATED REPORTS 
     11.6 AUTHOR DETAILS 

This study encompasses significant efforts in determining the present climate adaptation market size. It commenced with a thorough secondary research process to gather data related to the market, similar markets, and the overarching industry. Subsequently, these findings, assumptions, and market size calculations were rigorously validated by consulting industry experts across the entire supply chain through primary research. The total market size was assessed by conducting an analysis specific to each country. Following that, the market was further dissected, and the data was cross-referenced to estimate the size of various segments and sub-segments within the market.

Secondary Research

In this research study, a wide range of secondary sources were utilized, including directories, databases, and reputable references such as, Factiva, World Bank, International Monetary Fund (IMF), the US Department of Energy (DOE), Our world in Data, and the International Energy Agency (IEA). These sources played a crucial role in gathering valuable data for a comprehensive analysis of the global Climate adaptation market, covering technical, market-oriented, and commercial aspects. Additional secondary sources included annual reports, press releases, investor presentations, whitepapers, authoritative publications, articles authored by well-respected experts, information from industry associations, trade directories, and various database resources.

Primary Research

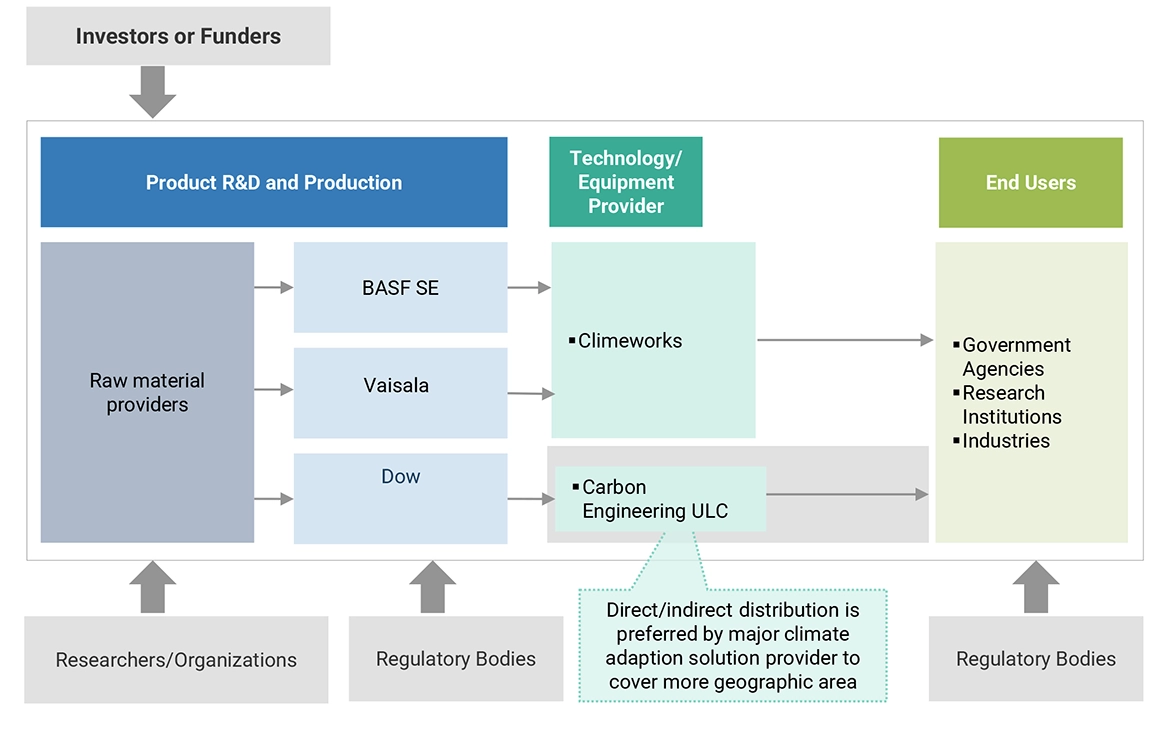
The market involves a range of stakeholders, including raw material suppliers/components, manufacturers/assemblers, climate adaptation solution providers, and distributors/end users. Fluctuations in raw material prices, industrial growth rate, and changes in manufacturing regulations affect the supply chain of the climate adaptation market.  The demand for this market is primarily driven by end users such as Industries, Academia and Research Institutions, and Government agencies. On the supply side, there is a notable trend of heightened demand for contracts from the industrial sector and a significant presence of investments and expansions among major players.

To gather qualitative and quantitative insights, various primary sources from both the supply and demand sides of the market were interviewed. The following breakdown presents the primary respondents involved in the research study.

Climate Adaptation Market  Size, and Share

To know about the assumptions considered for the study, download the pdf brochure

Market Size Estimation

The estimation and validation of the Climate adaptation market size have been conducted using a bottom-up approach. This approach was rigorously employed to ascertain the dimensions of multiple subsegments within the market. The research process comprises the following key stages.

  • Thorough secondary and primary research has been conducted to gain a comprehensive understanding of the global market landscape for various segments of market.
  • Numerous primary interviews have been undertaken with key experts in the field of Climate adaptation development.
  • When calculating and forecasting the market size, qualitative factors such as market drivers, limitations, opportunities, and challenges have been taken into account.

Global Climate Adaptation Market Size: Bottom-Up Approach

Climate Adaptation Market  Bottom Up Approach

To know about the assumptions considered for the study, Request for Free Sample Report

Data Triangulation

The process of determining the overall market size involved the methodologies described earlier, followed by segmenting the market into multiple segments and subsegments. To finalize the comprehensive market analysis and obtain precise statistics for each market segment and subsegment, data triangulation and market segmentation techniques were applied, as appropriate. Data triangulation was accomplished by examining various factors and trends from both the demand and supply perspectives within the ecosystem of the market.

Market Definition

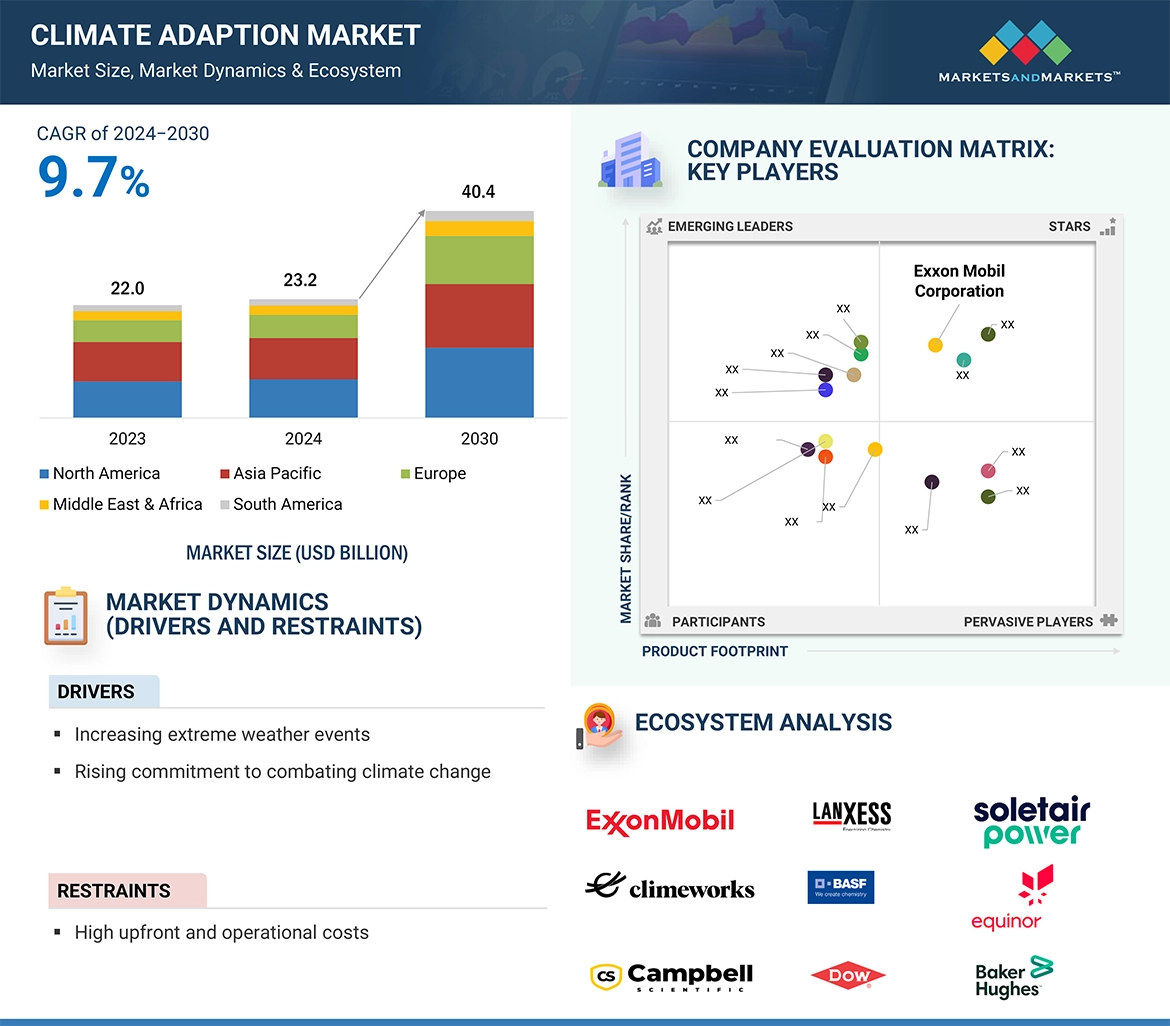
The climate adaptation market is defined as the sum of the revenues generated by global companies offering climate adaptation solutions for end users, such as government agencies, research institutes, and industries. The market has been studied for five key regions, such as North America, Europe, Asia Pacific, the Middle East & Africa, and South America.

Key Stakeholders

  • Environmental Agencies
  • Direct Air Capture System Manufacturers
  • Climate Adaptation Solution Providers
  • Carbon Capture Technology Providers
  • Energy & Power Sector Consulting Companies
  • Energy Regulators
  • Government & Research Organizations
  • State & National Regulators
  • Investment Banks
  • Repair & Maintenance Service Providers
  • Oil & Gas, Power Generation, Chemical & Petrochemical Industries

Objectives of the Study

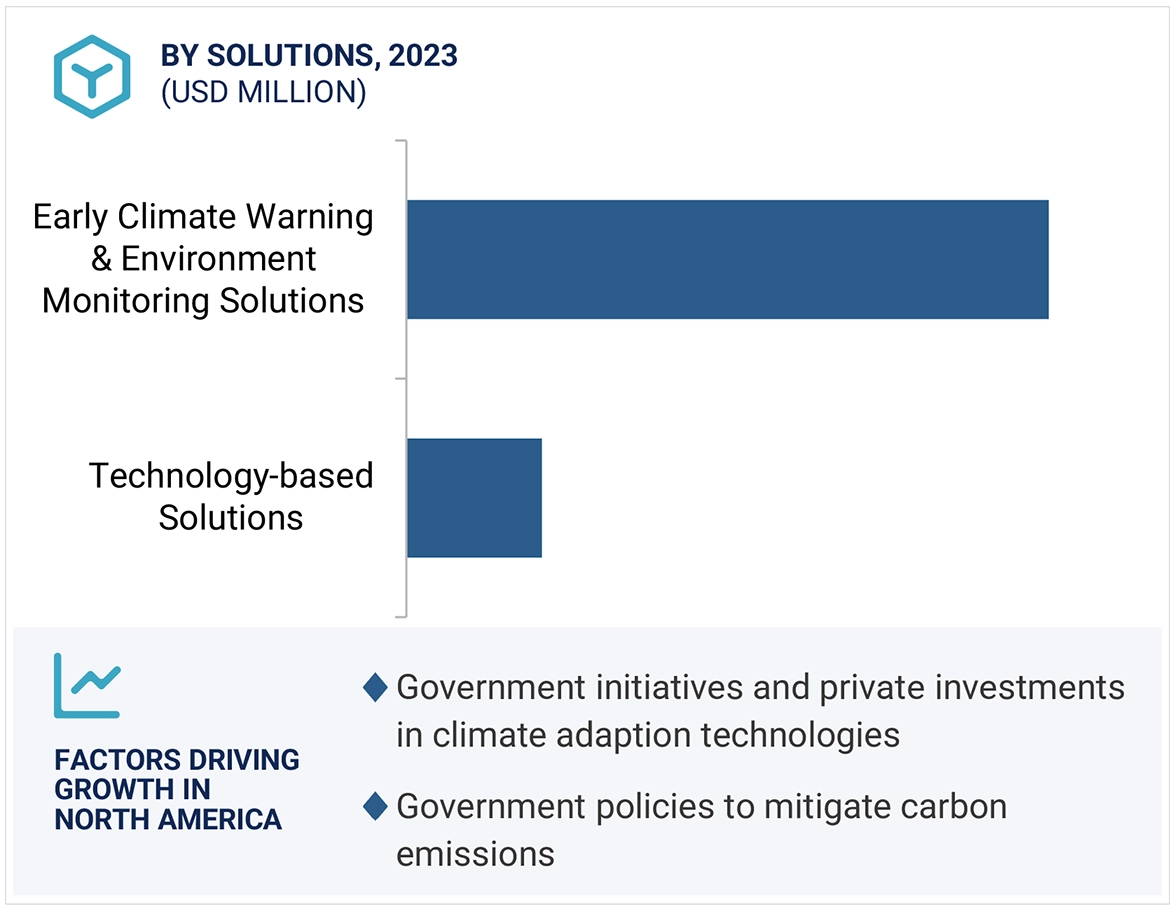
  • To define, describe, and forecast the climate adaptation market by solution, end-user, and region, in terms of value
  • To describe and forecast the market for five key regions, namely, North America, Europe, Asia Pacific, the Middle East & Africa, and South America, in terms of volume and value, along with their country-level market sizes, in terms of value
  • To forecast the market by technology-based solution, in terms of volume
  • To provide detailed information regarding key drivers, restraints, opportunities, and challenges influencing the growth of the market
  • To strategically analyze the micromarkets1 with respect to individual growth trends, prospects, and contributions to the overall market size
  • To provide the supply chain analysis, trends/disruptions impacting customers’ businesses, ecosystem/market map, pricing analysis, patent analysis, case study analysis, technology analysis, key conferences and events, trade analysis, Porter’s five forces analysis, key stakeholders and buying criteria, and regulatory analysis of the market
  • To analyze opportunities for stakeholders in the market and draw a competitive landscape of the market
  • To benchmark players within the market using the company evaluation matrix, which analyzes market players on several parameters within the broad categories of business and product strategies
  • To compare key market players with respect to product specifications and applications
  • To strategically profile key players and comprehensively analyze their market rankings and core competencies2
  • To analyze competitive developments, such as contracts & agreements, investments & expansions, acquisitions, new product launches, partnerships, joint ventures & collaborations, in the market

Available Customization

With the given market data, MarketsandMarkets offers customizations based on the company’s specific needs. The following customization options are available for the report:

Product Analysis

  • Product Matrix, which provides a detailed comparison of the product portfolio of each company

Company Information

  • Detailed analyses and profiling of additional market players (up to 5)
Custom Market Research Services

We will customize the research for you, in case the report listed above does not meet with your exact requirements. Our custom research will comprehensively cover the business information you require to help you arrive at strategic and profitable business decisions.

Request Customization
Report Code
EP 9070
Published ON
Jul, 2024
Choose License Type
BUY NOW
  • SHARE
X
Request Customization
Speak to Analyst
Speak to Analyst
OR FACE-TO-FACE MEETING
PERSONALIZE THIS RESEARCH
  • Triangulate with your Own Data
  • Get Data as per your Format and Definition
  • Gain a Deeper Dive on a Specific Application, Geography, Customer or Competitor
  • Any level of Personalization
REQUEST A FREE CUSTOMIZATION
LET US HELP YOU!
  • What are the Known and Unknown Adjacencies Impacting the Climate Adaptation Market
  • What will your New Revenue Sources be?
  • Who will be your Top Customer; what will make them switch?
  • Defend your Market Share or Win Competitors
  • Get a Scorecard for Target Partners
CUSTOMIZED WORKSHOP REQUEST
  • Call Us
  • +1-888-600-6441 (Corporate office hours)
  • +1-888-600-6441 (US/Can toll free)
  • +44-800-368-9399 (UK office hours)
CONNECT WITH US
ABOUT TRUST ONLINE
©2024 MarketsandMarkets Research Private Ltd. All rights reserved
DMCA.com Protection Status
Website Feedback