Ceramic Fiber Market by Type {Refractory Ceramic Fiber (RCF), Alkaline Earth Silicate (AES) Wool}, Product Form (Blanket, Board, Paper, Module), End-use Industry (Refining & Petrochemical, Metal, Power Generation), and Region - Global Forecast to 2029
Ceramic Fiber Market
The global ceramic fiber market is valued at USD 2.3 billion in 2024 and is projected to reach USD 3.5 billion by 2029, growing at 8.6% cagr from 2024 to 2029. The major factors driving the ceramic fiber market are the mounting demand for ceramic fiber insulation, growing infrastructural projects and urbanization, and increasing industrial expansion in the Asia Pacific. Technological advancements in ceramic fiber, such as the melt spinning, sizing & coating treatments, and sol-gel processes, are driving the market. Among these, the melt spinning technology can be economically scaled up to large scale. For instance, the key players are utilizing the same technology to manufacture ceramic fiber materials to support the rising demand from end-use industries such as oil & gas and transportation. Due to these factors, the consumption of ceramic fiber has grown significantly.
To know about the assumptions considered for the study, Request for Free Sample Report
Ceramic Fiber Market Dynamics
Driver: Mounting demand for ceramic fiber insulation
The mounting usage of ceramic fiber insulation is playing a significant role in the growth of the ceramic fiber market in many industries. Some industries with rising demand include the steel industry, cement manufacturers, and petrochemicals; these industries require high and sustainable temperature-resistant insulation. The environmental aspect is also a primary concern, which is creating demand, as ceramic fiber insulation aids in energy conservation and meets most regulations on emanated heat. New developments in the area of ceramic fiber materials and their increasing use in construction, as well as for high-temperature applications, contribute to the growth of the market. Economic and infrastructure developments, especially in the emerging markets, have increased pressure on the need to develop better insulation systems, which, in turn, fuels the growth of the ceramic fiber market.
Restraints: Rising regulations on hazardous raw materials used in ceramic fiber manufacturing
Regulations that have been devised to solve environmental and health problems in the community are gradually forcing manufacturers to be more responsible for their processes and the materials they use. Significant caution is required toward certain raw materials used in manufacturing processes that are prohibited or restricted due to their detrimental health effects, such as asbestos and other toxic substances; this requires innovations to discover more environmentally friendly materials. Adherence to these regulations may require sourcing new products, such as technologies and materials, to enhance production expenditure while, at the same time, expanding on innovations, which is restraining market growth.
Opportunities: Rising demand from alternative energy industries
Rising demand from other energy sectors as a result of the shift toward the usage of ceramic fiber is also contributing to the growth of the market. For example, as energy forms, such as wind, solar, and bioenergy, are becoming popular all over the world, these industries need materials that can withstand harsh environments and improve efficiency. Ceramic fibers, which have outstanding thermal stability and high-temperature strength, are well suited for applications in parts and components, including turbine blades, heat exchangers, and insulating materials for solar thermal applications. There is a high pace in the application of improved and durable ceramic fiber products to meet the required competencies and strengths in such applications. This trend not only enables the development of ceramic fiber applications in new energy fields but also drives innovations and investments in high-value-added insulation materials.
Challenges: Changing policies regarding import tariffs
Policies relating to import tariffs remain a major threat to the ceramic fiber market since they affect cost structures and trade regulations across the world. Short-term fluctuations include fluctuating tariffs, which lead to the fluctuating costs of raw materials and even the finished products, affecting profitability for manufacturers and, therefore cause changes in the prices of their products. Higher tariffs on imported ceramic fibers or their components may lead to changing supply sources by forcing firms to find local sources, which may be costly and time-consuming. This is associated with risks such as interruptions in supply chains and escalation of the prices of the final products, hence reducing their demand.
Ceramic Fiber Market Ecosystem
Prominent companies in this market include well-established, financially stable manufacturers of ceramic fiber. These companies have been in the business for a while and offer a broad range of products, cutting-edge technologies, and robust international sales and marketing networks. The leading companies in this market include Morgan Advanced Materials plc (UK), Alkegen (US), IBIDEN Co., Ltd. (Japan), NUTEC Incorporated (Mexico), HarbisonWalker International Inc. (US), Isolite Insulating Products Co. Ltd. (Japan), YESO INSULATING PRODUCTS COMPANY LIMITED (China), RATH Group (Austria), and ZIRCAR Ceramics Inc. (US), among others.
Based on type, the AES wool segment is projected to register the highest CAGR in the ceramic fiber market, in terms of value, during the forecast period
The AES wool type of ceramic fiber is projected to be the fastest-growing segment in the ceramic fiber market as it can provide better thermal performance compared with other materials and also has higher flame and heat resistance. AES wool is safer for health than traditional ceramic fibers, and in a way, is friendlier to the environment and meets the present higher safety standards. Technical progress has also contributed to the lower price of AES wool, while its application range – from industrial insulation to fire protection – also adds to its versatility. Rising consumption from the aerospace, automotive, and construction industries also contributes to the increased use of AES wool, thus making it a preferred option in the ceramic fiber market.
Based on end-use industry, refining & petrochemical is projected to be the largest segment in the ceramic fiber market, in terms of value, during the forecast period
The largest market for ceramic fiber is the refining and petrochemical end-use, as this industry demands high-quality thermal insulation for high-temperature processes. In this industry, ceramic fibers are vital since they help reduce heat transfer rates and are heat resistant. They last long and are also chemically immune to acute chemicals and are thus suitable for the rigorous working environments in refineries and petrochemical companies. In addition, FDA guidelines concerning safety/environmental standards state that inhaling ceramic fibers triggers the increased use of these improved ceramic raw materials. One of the main reasons for the continuous rise in demand is the ongoing improvements of LNG facilities, as well as the construction of new facilities. Enhancements in the refining and petrochemical sector is another factor that guarantees that this sector remains the largest consumer of ceramic fibers.
Asia Pacific was the largest and is projected to be the fastest-growing region, in terms of value, during the forecast period in the ceramic fiber market.
The Asia Pacific region accounts for the largest market and is expected to grow at the highest CAGR in the ceramic fiber market because of some influential factors. Primarily, rapid industrialization and urbanization across countries such as China, India, and the Southeast Asian region are expected to considerably boost the demand for ceramic fibers across various end-uses, that too, within a short span of time in sectors such as construction, automotive, and manufacturing. Government policies and afforestation schemes, along with increased spending on industrial structures and energy-saving technologies, drive the market further. Coupled with the increasing growth of the region as a manufacturing hub and the expanding industrial applications make Asia Pacific the leading ceramic fiber market.
To know about the assumptions considered for the study, download the pdf brochure
Ceramic Fiber Market Players
Morgan Advanced Materials plc (UK), Alkegen (US), IBIDEN Co., Ltd. (Japan), NUTEC Incorporated (Mexico), HarbisonWalker International Inc. (US), Isolite Insulating Products Co. Ltd. (Japan), YESO INSULATING PRODUCTS COMPANY LIMITED (China), RATH Group (Austria), and ZIRCAR Ceramics Inc. (US), among others, are the key manufacturers that secured major market share during the last few years.
Ceramic Fiber Market Scope Report
Report Metric |
Details |
Years considered for the study |
2018–2029 |
Base year considered |
2023 |
Forecast period |
2024–2029 |
Units considered |
Volume (Kiloton) and Value (USD Million) |
Segments covered |
Type, Product Form, End-use Industry, and Region |
Regions covered |
Asia Pacific, North America, Europe, Middle East & Africa, and South America |
Companies profiled |
The key players profiled in the report include Morgan Advanced Materials plc. (UK), Alkegen (US), IBIDEN Co., Ltd. (Japan), NUTEC Incorporated (Mexico), HarbisonWalker International Inc. (US), Isolite Insulating Products Co. Ltd. (Japan), YESO INSULATING PRODUCTS COMPANY LIMITED (China), RATH Group (Austria), ZIRCAR Ceramics Inc. (US), and others. |
This report categorizes the global Ceramic Fiber Market based on material type, application, and region.
On the basis of type, the Ceramic Fiber Market has been segmented as follows:
- RCF
- AES Wool
- Other Types
On the basis of Product Form, the Ceramic Fiber Market has been segmented as follows:
- Blanket
- Module
- Board
- Paper
- Other Product Forms
On the basis of End-use Industry, the Ceramic Fiber Market has been segmented as follows:
- Refining & Petrochemical
- Metals
- Power Generation
- Other End-use Industries
On the basis of Region , the Ceramic Fiber Market has been segmented as follows:
- Asia Pacific
- Europe
- North America
- Middle East & Arica
- South America
Recent Developments
- In July 2023, Morgan Advanced Materials expanded its Yixing plant, increasing its capacity by over 50%. The facility produces TJM Insulating Firebricks (IFBs), including specialty thermal joint material (TJM) Bubble Alumina bricks used in high-temperature industrial applications.
- In April 2024, Alkegen announced that it will supply advanced thermal protection solutions for JLR’s (Jaguar Land Rover) next-generation electric vehicles.
- In February 2023, the complete acquisition of HarbisonWalker International was announced by Platinum Equity. Platinum Equity is a multinational investment company that manages assets of about USD 36 billion and has approximately 50 products in its portfolio.
Frequently Asked Questions (FAQ):
Which are the major players in the ceramic fiber market?
The key players profiled in the report are Morgan Advanced Materials plc. (UK), Alkegen (US), IBIDEN Co., Ltd. (Japan), NUTEC Incorporated (Mexico), HarbisonWalker International Inc. (US), Isolite Insulating Products Co. Ltd. (Japan), YESO INSULATING PRODUCTS COMPANY LIMITED (China), RATH Group (Austria), and ZIRCAR Ceramics Inc. (US), among others.
What are the drivers and opportunities for the ceramic fiber market?
The rising demand from alternative energy industries and mounting demand from the transportation industry are the major drivers for this market.
What are the strategies key players are focusing on in the ceramic fiber market?
Product launches, expansions, and partnerships are some of the strategies adopted by the key players to expand their global presence.
What is expected to be the CAGR of the ceramic fiber market for the next five years?
The market is projected to grow at a CAGR of 8.6% in terms of value, during the forecast period.
What are the major factors restraining the growth of the ceramic fiber market during the forecast period?
Rising regulations on hazardous raw materials used in ceramic fiber are expected to restrict market demand. .
To speak to our analyst for a discussion on the above findings, click Speak to Analyst
Exclusive indicates content/data unique to MarketsandMarkets and not available with any competitors.
- 5.1 INTRODUCTION
-
5.2 MARKET DYNAMICSDRIVERS- Rising demand for ceramic fiber insulation due to superior thermal properties- Rapid urbanization and increased infrastructural projects- Industrial expansion in Asia PacificRESTRAINTS- Regulations on production of ceramic fibers and use of carcinogenic insulation materials- Energy-intensive and expensive production processOPPORTUNITIES- Increasing demand from aerospace and alternative energy industries- Expanding transportation industry- Growing construction industryCHALLENGES- Policy shifts on import tariffs and export barriers
-
5.3 MACROECONOMIC INDICATORSGDP TRENDS AND FORECAST
-
6.1 SUPPLY CHAIN ANALYSISRAW MATERIALMANUFACTURERSDISTRIBUTION NETWORKEND-USE INDUSTRIES
-
6.2 PORTER’S FIVE FORCES ANALYSISTHREAT OF SUBSTITUTESBARGAINING POWER OF SUPPLIERSBARGAINING POWER OF BUYERSTHREAT OF NEW ENTRANTSINTENSITY OF COMPETITIVE RIVALRY
-
6.3 KEY STAKEHOLDERS & BUYING CRITERIAKEY STAKEHOLDERS IN BUYING PROCESSBUYING CRITERIA
-
6.4 PRICING ANALYSISAVERAGE SELLING PRICE TREND OF KEY PLAYERS, BY END-USE INDUSTRYAVERAGE SELLING PRICE TREND, BY REGION
- 6.5 TRENDS/DISRUPTIONS IMPACTING CUSTOMER BUSINESS
- 6.6 ECOSYSTEM ANALYSIS
-
6.7 TECHNOLOGY ANALYSISKEY TECHNOLOGIES- Sol-gel process- Melt spinningCOMPLEMENTARY TECHNOLOGIES- Sizing and coating treatments
-
6.8 CASE STUDY ANALYSISINSULATION CHALLENGES FACED BY ROLLS ROYCE, HOWMET GEORGETOWN CASTING, AIREX, AND HALLIBURTONPRODUCT UTILIZATION BY MORGAN ADVANCED MATERIALS PLCALKEGEN’S CARBOWALL SYSTEM AT PETROBRAS REFINERIES
-
6.9 TRADE DATA STATISTICSIMPORT SCENARIO OF CERAMIC FIBEREXPORT SCENARIO OF CERAMIC FIBER
-
6.10 REGULATORY LANDSCAPEREGULATORY BODIES, GOVERNMENT AGENCIES, AND OTHER ORGANIZATIONS
- 6.11 KEY CONFERENCES AND & EVENTS, 2024–2025
- 6.12 INVESTMENT AND FUNDING SCENARIO
-
6.13 PATENT ANALYSISAPPROACHDOCUMENT TYPETOP APPLICANTSJURISDICTION ANALYSIS
- 6.14 IMPACT OF AI/GEN AI ON CERAMIC FIBER MARKET
- 7.1 INTRODUCTION
-
7.2 REFRACTORY CERAMIC FIBER (RCF)SIGNIFICANT REDUCTION IN ENERGY CONSUMPTION COMPARED TO ALTERNATIVE PRODUCTS TO DRIVE MARKET
-
7.3 ALKALINE EARTH SILICATE (AES) WOOLSTRINGENT GOVERNMENT REGULATIONS TO DRIVE MARKET
- 7.4 OTHER TYPES
- 8.1 INTRODUCTION
-
8.2 BLANKETINCREASING DEMAND FROM METAL AND AUTOMOTIVE SECTORS TO DRIVE MARKET
-
8.3 MODULEUPCOMING PROJECTS IN IRON & STEEL INDUSTRIES TO DRIVE MARKET
-
8.4 BOARDCONSISTENT DENSITY, EXCELLENT CHEMICAL ATTACK, AND THERMAL SHOCK RESISTANCE TO FUEL MARKET
-
8.5 PAPERRISING DEMAND FOR FURNACES, AEROSPACE, AND CERAMIC & GLASS MELTING APPLICATIONS TO DRIVE MARKET
- 8.6 OTHER PRODUCT FORMS
- 9.1 INTRODUCTION
-
9.2 REFINING & PETROCHEMICALRISING DEMAND FOR BOILERS, FIRED HEATERS, AND FLUID CATALYTIC CRACKING UNITS TO FUEL MARKET
-
9.3 METALSLOW COST AND HIGH PRODUCTION TO DRIVE MARKET
-
9.4 POWER GENERATIONINCREASING USE FOR THERMAL AND SOUND INSULATION TO BOOST MARKET
- 9.5 OTHER END-USE INDUSTRIES
- 10.1 INTRODUCTION
-
10.2 ASIA PACIFICCHINA- Strong growth of refining & petrochemical sector to drive marketJAPAN- Technological developments, fiscal support, and continued increase in trade to drive marketINDIA- Industrialization and urbanization to fuel market growth
-
10.3 EUROPEGERMANY- Superior R&D infrastructure and robust manufacturing base to propel marketITALY- Growing demand from construction, refining & petrochemical, and automotive industries to drive marketRUSSIA- Demand from power generation, construction, and transport sectors to drive market
-
10.4 NORTH AMERICAUS- Significant demand from automotive, military, and construction industries to drive marketCANADA- Abundant availability of feedstock to boost marketMEXICO- Growing power generation and steel sectors to drive market
-
10.5 MIDDLE EAST & AFRICAGCC- Saudi ArabiaIRAN- Growing natural resources and petrochemical industries to fuel market
-
10.6 SOUTH AMERICABRAZIL- Refining & petrochemical industry and rapid urbanization tofuel marketARGENTINA- Rising population and increasing per capita consumption of plastics to boost market
- 11.1 INTRODUCTION
- 11.2 KEY PLAYER STRATEGIES/RIGHT TO WIN, JANUARY 2020–AUGUST 2024
- 11.3 MARKET SHARE ANALYSIS, JANUARY 2020–AUGUST 2024
- 11.4 REVENUE ANALYSIS, 2019–2023
-
11.5 COMPANY EVALUATION MATRIX: KEY PLAYERS, 2023STARSEMERGING LEADERSPERVASIVE PLAYERSPARTICIPANTSCOMPANY FOOTPRINT: KEY PLAYERS, 2023- Company footprint- Region footprint- Type footprint- Product form footprint- End-use industry footprint
-
11.6 COMPANY EVALUATION MATRIX: STARTUPS/SMES, 2023PROGRESSIVE COMPANIESRESPONSIVE COMPANIESDYNAMIC COMPANIESSTARTING BLOCKSCOMPETITIVE BENCHMARKING: STARTUPS/SMES, 2023- Detailed list of key startups/SMEs- Competitive benchmarking of key startups/SMEs
- 11.7 BRAND/PRODUCT COMPARISON ANALYSIS
- 11.8 COMPANY VALUATION AND FINANCIAL METRICS
-
11.9 COMPETITIVE SCENARIOPRODUCT LAUNCHESDEALSEXPANSIONSOTHER DEVELOPMENTS
-
12.1 KEY PLAYERSMORGAN ADVANCED MATERIALS PLC- Business overview- Products/Solutions/Services offered- Recent developments- MnM viewALKEGEN- Business overview- Products/Solutions/Services offered- Recent developments- MnM viewIBIDEN CO., LTD.- Business overview- Products/Solutions/Services offered- MnM viewNUTEC INCORPORATED- Business overview- Products/Solutions/Services offered- MnM viewISOLITE INSULATING PRODUCTS CO., LTD.- Business overview- Products/Solutions/Services offered- MnM viewHARBISONWALKER INTERNATIONAL INC.- Business overview- Products/Solutions/Services offered- Recent developments- MnM viewYESO INSULATING PRODUCTS COMPANY LIMITED- Business overview- Products/Solutions/Services offered- MnM viewRATH GROUP- Business overview- Products/Solutions/Services offered- Recent developments- MnM viewDOUBLE EGRET THERMAL INSULATION CO., LTD.- Business overview- Products/Solutions/Services offered- MnM viewZIRCAR CERAMICS, INC.- Business overview- Products/Solutions/Services offered- MnM view
-
12.2 OTHER PLAYERSFIBRECAST INC.PROMAT INC.PYROTEK INC.CERAMSOURCE INC.ADL INSULFLEX INC.SIMOND FIBERTECH LIMITED3M COMPANYM.E. SCHUPP INDUSTRIEKERAMIK GMBHMINERAL SEAL CORPORATIONGLT PRODUCTSMARSHALL PACKINGS AND INSULATIONS INDUSTRIESSHREE CERAMIC FIBERS PVT. LTD.THERMAL PRODUCTS COMPANY INC.REFMON INDUSTRIESGALAXY ENTERPRISE
- 13.1 INTRODUCTION
- 13.2 LIMITATIONS
-
13.3 CERAMIC MATRIX COMPOSITES MARKETMARKET DEFINITIONMARKET OVERVIEWCERAMIC MATRIX COMPOSITES MARKET, BY REGION- Asia Pacific- Europe- Middle East & Africa- North America- Latin America
- 14.1 DISCUSSION GUIDE
- 14.2 KNOWLEDGESTORE: MARKETSANDMARKETS’ SUBSCRIPTION PORTAL
- 14.3 CUSTOMIZATION OPTIONS
- 14.4 RELATED REPORTS
- 14.5 AUTHOR DETAILS
- TABLE 1 MARKET DEFINITION AND INCLUSIONS, BY TYPE
- TABLE 2 MARKET DEFINITION AND INCLUSIONS, BY PRODUCT FORM
- TABLE 3 MARKET DEFINITION AND INCLUSIONS, BY END-USE INDUSTRY
- TABLE 4 CERAMIC FIBER MARKET: RISK ASSESSMENT
- TABLE 5 EMERGING APPLICATIONS OF CERAMIC FIBERS
- TABLE 6 GDP TRENDS AND FORECAST OF MAJOR ECONOMIES, 2021–2029 (USD BILLION)
- TABLE 7 CERAMIC FIBER MARKET: PORTER’S FIVE FORCES ANALYSIS
- TABLE 8 INFLUENCE OF STAKEHOLDERS ON BUYING PROCESS FOR TOP 3 END-USE INDUSTRIES (%)
- TABLE 9 KEY BUYING CRITERIA FOR TOP 3 END-USE INDUSTRIES
- TABLE 10 AVERAGE SELLING PRICE TREND OF KEY PLAYERS FOR TOP 3 END-USE INDUSTRIES (USD/KG)
- TABLE 11 AVERAGE SELLING PRICE TREND, BY REGION (USD/KG)
- TABLE 12 CERAMIC FIBER MARKET: ECOSYSTEM
- TABLE 13 IMPORT OF CERAMIC FIBER, BY REGION, 2018–2022 (USD MILLION)
- TABLE 14 EXPORT OF CERAMIC FIBER, BY REGION, 2018–2022 (USD MILLION)
- TABLE 15 NORTH AMERICA: REGULATIONS RELATED TO CERAMIC FIBER
- TABLE 16 EUROPE: REGULATIONS RELATED TO CERAMIC FIBER
- TABLE 17 ASIA PACIFIC: REGULATIONS RELATED TO CERAMIC FIBER
- TABLE 18 MIDDLE EAST & AFRICA: REGULATIONS RELATED TO CERAMIC FIBER
- TABLE 19 SOUTH AMERICA: REGULATIONS RELATED TO CERAMIC FIBER
- TABLE 20 CERAMIC FIBER: REGULATORY BODIES, GOVERNMENT AGENCIES, AND OTHER ORGANIZATIONS
- TABLE 21 CERAMIC FIBER MARKET: LIST OF CONFERENCES & EVENTS, 2024–2025
- TABLE 22 CERAMIC FIBER MARKET: FUNDING/INVESTMENT
- TABLE 23 GRANTED PATENTS ACCOUNTED FOR 61% OF TOTAL COUNT
- TABLE 24 MAJOR CERAMIC FIBER PATENTS
- TABLE 25 PATENTS BY 3M COMPANY
- TABLE 26 PATENTS BY GENERAL ELECTRIC COMPANY
- TABLE 27 TOP 10 PATENT OWNERS IN US, 2013–2023
- TABLE 28 CERAMIC FIBER MARKET, BY TYPE, 2018–2023 (USD MILLION)
- TABLE 29 CERAMIC FIBER MARKET, BY TYPE, 2024–2029 (USD MILLION)
- TABLE 30 CERAMIC FIBER MARKET, BY TYPE, 2018–2023 (KILOTON)
- TABLE 31 CERAMIC FIBER MARKET, BY TYPE, 2024–2029 (KILOTON)
- TABLE 32 CHARACTERISTICS OF RCF AND ASBESTOS
- TABLE 33 RCF: CERAMIC FIBER MARKET, BY REGION, 2018–2023 (USD MILLION)
- TABLE 34 RCF: CERAMIC FIBER MARKET, BY REGION, 2024–2029 (USD MILLION)
- TABLE 35 RCF: CERAMIC FIBER MARKET, BY REGION, 2018–2023 (KILOTON)
- TABLE 36 RCF: CERAMIC FIBER MARKET, BY REGION, 2024–2029 (KILOTON)
- TABLE 37 AES WOOL: CERAMIC FIBER MARKET, BY REGION, 2018–2023 (USD MILLION)
- TABLE 38 AES WOOL: CERAMIC FIBER MARKET, BY REGION, 2024–2029 (USD MILLION)
- TABLE 39 AES WOOL: CERAMIC FIBER MARKET, BY REGION, 2018–2023 (KILOTON)
- TABLE 40 AES WOOL: CERAMIC FIBER MARKET, BY REGION, 2024–2029 (KILOTON)
- TABLE 41 CHARACTERISTICS OF POLYCRYSTALLINE AND VITREOUS ALUMINA-SILICA CERAMIC FIBERS
- TABLE 42 OTHER TYPES: CERAMIC FIBER MARKET, BY REGION, 2018–2023 (USD MILLION)
- TABLE 43 OTHER TYPES: CERAMIC FIBER MARKET, BY REGION, 2024–2029 (USD MILLION)
- TABLE 44 OTHER TYPES: CERAMIC FIBER MARKET, BY REGION, 2018–2023 (KILOTON)
- TABLE 45 OTHER TYPES: CERAMIC FIBER MARKET, BY REGION, 2024–2029 (KILOTON)
- TABLE 46 CERAMIC FIBER MARKET, BY PRODUCT FORM, 2018–2023 (USD MILLION)
- TABLE 47 CERAMIC FIBER MARKET, BY PRODUCT FORM, 2024–2029 (USD MILLION)
- TABLE 48 CERAMIC FIBER MARKET, BY PRODUCT FORM, 2018–2023 (KILOTON)
- TABLE 49 CERAMIC FIBER MARKET, BY PRODUCT FORM, 2024–2029 (KILOTON)
- TABLE 50 BLANKET: CERAMIC FIBER MARKET, BY REGION, 2018–2023 (USD MILLION)
- TABLE 51 BLANKET: CERAMIC FIBER MARKET, BY REGION, 2024–2029 (USD MILLION)
- TABLE 52 BLANKET: CERAMIC FIBER MARKET, BY REGION, 2018–2023 (KILOTON)
- TABLE 53 BLANKET: CERAMIC FIBER MARKET, BY REGION, 2024–2029 (KILOTON)
- TABLE 54 MODULE: CERAMIC FIBER MARKET, BY REGION, 2018–2023 (USD MILLION)
- TABLE 55 MODULE: CERAMIC FIBER MARKET, BY REGION, 2024–2029 (USD MILLION)
- TABLE 56 MODULE: CERAMIC FIBER MARKET, BY REGION, 2018–2023 (KILOTON)
- TABLE 57 MODULE: CERAMIC FIBER MARKET, BY REGION, 2024–2029 (KILOTON)
- TABLE 58 BOARD: CERAMIC FIBER MARKET, BY REGION, 2018–2023 (USD MILLION)
- TABLE 59 BOARD: CERAMIC FIBER MARKET, BY REGION, 2024–2029 (USD MILLION)
- TABLE 60 BOARD: CERAMIC FIBER MARKET, BY REGION, 2018–2023 (KILOTON)
- TABLE 61 BOARD: CERAMIC FIBER MARKET, BY REGION, 2024–2029 (KILOTON)
- TABLE 62 PAPER: CERAMIC FIBER MARKET, BY REGION, 2018–2023 (USD MILLION)
- TABLE 63 PAPER: CERAMIC FIBER MARKET, BY REGION, 2024–2029 (USD MILLION)
- TABLE 64 PAPER: CERAMIC FIBER MARKET, BY REGION, 2018–2023 (KILOTON)
- TABLE 65 PAPER: CERAMIC FIBER MARKET, BY REGION, 2024–2029 (KILOTON)
- TABLE 66 OTHER PRODUCT FORMS: CERAMIC FIBER MARKET, BY REGION, 2018–2023 (USD MILLION)
- TABLE 67 OTHER PRODUCT FORMS: CERAMIC FIBER MARKET, BY REGION, 2024–2029 (USD MILLION)
- TABLE 68 OTHER PRODUCT FORMS: CERAMIC FIBER MARKET, BY REGION, 2018–2023 (KILOTON)
- TABLE 69 OTHER PRODUCT FORMS: CERAMIC FIBER MARKET, BY REGION, 2024–2029 (KILOTON)
- TABLE 70 CERAMIC FIBER MARKET, BY END-USE INDUSTRY, 2018–2023 (USD MILLION)
- TABLE 71 CERAMIC FIBER MARKET, BY END-USE INDUSTRY, 2024–2029 (USD MILLION)
- TABLE 72 CERAMIC FIBER MARKET, BY END-USE INDUSTRY, 2018–2023 (KILOTON)
- TABLE 73 CERAMIC FIBER MARKET, BY END-USE INDUSTRY, 2024–2029 (KILOTON)
- TABLE 74 REFINING & PETROCHEMICAL: CERAMIC FIBER MARKET, BY REGION, 2018–2023 (USD MILLION)
- TABLE 75 REFINING & PETROCHEMICAL: CERAMIC FIBER MARKET, BY REGION, 2024–2029 (USD MILLION)
- TABLE 76 REFINING & PETROCHEMICAL: CERAMIC FIBER MARKET, BY REGION, 2018–2023 (KILOTON)
- TABLE 77 REFINING & PETROCHEMICAL: CERAMIC FIBER MARKET, BY REGION, 2024–2029 (KILOTON)
- TABLE 78 METALS: CERAMIC FIBER MARKET, BY REGION, 2018–2023 (USD MILLION)
- TABLE 79 METALS: CERAMIC FIBER MARKET, BY REGION, 2024–2029 (USD MILLION)
- TABLE 80 METALS: CERAMIC FIBER MARKET, BY REGION, 2018–2023 (KILOTON)
- TABLE 81 METALS: CERAMIC FIBER MARKET, BY REGION, 2024–2029 (KILOTON)
- TABLE 82 POWER GENERATION: CERAMIC FIBER MARKET, BY REGION, 2018–2023 (USD MILLION)
- TABLE 83 POWER GENERATION: CERAMIC FIBER MARKET, BY REGION, 2024–2029 (USD MILLION)
- TABLE 84 POWER GENERATION: CERAMIC FIBER MARKET, BY REGION, 2018–2023 (KILOTON)
- TABLE 85 POWER GENERATION: CERAMIC FIBER MARKET, BY REGION, 2024–2029 (KILOTON)
- TABLE 86 OTHER END-USE INDUSTRIES: CERAMIC FIBER MARKET, BY REGION, 2018–2023 (USD MILLION)
- TABLE 87 OTHER END-USE INDUSTRIES: CERAMIC FIBER MARKET, BY REGION, 2024–2029 (USD MILLION)
- TABLE 88 OTHER END-USE INDUSTRIES: CERAMIC FIBER MARKET, BY REGION, 2018–2023 (KILOTON)
- TABLE 89 OTHER END-USE INDUSTRIES: CERAMIC FIBER MARKET, BY REGION, 2024–2029 (KILOTON)
- TABLE 90 CERAMIC FIBER MARKET, BY REGION, 2018–2023 (USD MILLION)
- TABLE 91 CERAMIC FIBER MARKET, BY REGION, 2024–2029 (USD MILLION)
- TABLE 92 CERAMIC FIBER MARKET, BY REGION, 2018–2023 (KILOTON)
- TABLE 93 CERAMIC FIBER MARKET, BY REGION, 2024–2029 (KILOTON)
- TABLE 94 ASIA PACIFIC: CERAMIC FIBER MARKET, BY TYPE, 2018–2023 (USD MILLION)
- TABLE 95 ASIA PACIFIC: CERAMIC FIBER MARKET, BY TYPE, 2024–2029 (USD MILLION)
- TABLE 96 ASIA PACIFIC: CERAMIC FIBER MARKET, BY TYPE, 2018–2023 (KILOTON)
- TABLE 97 ASIA PACIFIC: CERAMIC FIBER MARKET, BY TYPE, 2024–2029 (KILOTON)
- TABLE 98 ASIA PACIFIC: CERAMIC FIBER MARKET, BY PRODUCT FORM, 2018–2023 (USD MILLION)
- TABLE 99 ASIA PACIFIC: CERAMIC FIBER MARKET, BY PRODUCT FORM, 2024–2029 (USD MILLION)
- TABLE 100 ASIA PACIFIC: CERAMIC FIBER MARKET, BY PRODUCT FORM, 2018–2023 (KILOTON)
- TABLE 101 ASIA PACIFIC: CERAMIC FIBER MARKET, BY PRODUCT FORM, 2024–2029 (KILOTON)
- TABLE 102 ASIA PACIFIC: CERAMIC FIBER MARKET, BY END-USE INDUSTRY, 2018–2023 (USD MILLION)
- TABLE 103 ASIA PACIFIC: CERAMIC FIBER MARKET, BY END-USE INDUSTRY, 2024–2029 (USD MILLION)
- TABLE 104 ASIA PACIFIC: CERAMIC FIBER MARKET, BY END-USE INDUSTRY, 2018–2023 (KILOTON)
- TABLE 105 ASIA PACIFIC: CERAMIC FIBER MARKET, BY END-USE INDUSTRY, 2024–2029 (KILOTON)
- TABLE 106 ASIA PACIFIC: CERAMIC FIBER MARKET, BY COUNTRY, 2018–2023 (USD MILLION)
- TABLE 107 ASIA PACIFIC: CERAMIC FIBER MARKET, BY COUNTRY, 2024–2029 (USD MILLION)
- TABLE 108 ASIA PACIFIC: CERAMIC FIBER MARKET, BY COUNTRY, 2018–2023 (KILOTON)
- TABLE 109 ASIA PACIFIC: CERAMIC FIBER MARKET, BY COUNTRY, 2024–2029 (KILOTON)
- TABLE 110 CHINA: CERAMIC FIBER MARKET, BY TYPE, 2018–2023 (USD MILLION)
- TABLE 111 CHINA: CERAMIC FIBER MARKET, BY TYPE, 2024–2029 (USD MILLION)
- TABLE 112 CHINA: CERAMIC FIBER MARKET, BY TYPE, 2018–2023 (KILOTON)
- TABLE 113 CHINA: CERAMIC FIBER MARKET, BY TYPE, 2024–2029 (KILOTON)
- TABLE 114 JAPAN: CERAMIC FIBER MARKET, BY TYPE, 2018–2023 (USD MILLION)
- TABLE 115 JAPAN: CERAMIC FIBER MARKET, BY TYPE, 2024–2029 (USD MILLION)
- TABLE 116 JAPAN: CERAMIC FIBER MARKET, BY TYPE, 2018–2023 (KILOTON)
- TABLE 117 JAPAN: CERAMIC FIBER MARKET, BY TYPE, 2024–2029 (KILOTON)
- TABLE 118 INDIA: CERAMIC FIBER MARKET, BY TYPE, 2018–2023 (USD MILLION)
- TABLE 119 INDIA: CERAMIC FIBER MARKET, BY TYPE, 2024–2029 (USD MILLION)
- TABLE 120 INDIA: CERAMIC FIBER MARKET, BY TYPE, 2018–2023 (KILOTON)
- TABLE 121 INDIA: CERAMIC FIBER MARKET, BY TYPE, 2024–2029 (KILOTON)
- TABLE 122 EUROPE: CERAMIC FIBER MARKET, BY TYPE, 2018–2023 (USD MILLION)
- TABLE 123 EUROPE: CERAMIC FIBER MARKET, BY TYPE, 2024–2029 (USD MILLION)
- TABLE 124 EUROPE: CERAMIC FIBER MARKET, BY TYPE, 2018–2023 (KILOTON)
- TABLE 125 EUROPE: CERAMIC FIBER MARKET, BY TYPE, 2024–2029 (KILOTON)
- TABLE 126 EUROPE: CERAMIC FIBER MARKET, BY PRODUCT FORM, 2018–2023 (USD MILLION)
- TABLE 127 EUROPE: CERAMIC FIBER MARKET, BY PRODUCT FORM, 2024–2029 (USD MILLION)
- TABLE 128 EUROPE: CERAMIC FIBER MARKET, BY PRODUCT FORM, 2018–2023 (KILOTON)
- TABLE 129 EUROPE: CERAMIC FIBER MARKET, BY PRODUCT FORM, 2024–2029 (KILOTON)
- TABLE 130 EUROPE: CERAMIC FIBER MARKET, BY END-USE INDUSTRY, 2018–2023 (USD MILLION)
- TABLE 131 EUROPE: CERAMIC FIBER MARKET, BY END-USE INDUSTRY, 2024–2029 (USD MILLION)
- TABLE 132 EUROPE: CERAMIC FIBER MARKET, BY END-USE INDUSTRY, 2018–2023 (KILOTON)
- TABLE 133 EUROPE: CERAMIC FIBER MARKET, BY END-USE INDUSTRY, 2024–2029 (KILOTON)
- TABLE 134 EUROPE: CERAMIC FIBER MARKET, BY COUNTRY, 2018–2023 (USD MILLION)
- TABLE 135 EUROPE: CERAMIC FIBER MARKET, BY COUNTRY, 2024–2029 (USD MILLION)
- TABLE 136 EUROPE: CERAMIC FIBER MARKET, BY COUNTRY, 2018–2023 (KILOTON)
- TABLE 137 EUROPE: CERAMIC FIBER MARKET, BY COUNTRY, 2024–2029 (KILOTON)
- TABLE 138 GERMANY: CERAMIC FIBER MARKET, BY TYPE, 2018–2023 (USD MILLION)
- TABLE 139 GERMANY: CERAMIC FIBER MARKET, BY TYPE, 2024–2029 (USD MILLION)
- TABLE 140 GERMANY: CERAMIC FIBER MARKET, BY TYPE, 2018–2023 (KILOTON)
- TABLE 141 GERMANY: CERAMIC FIBER MARKET, BY TYPE, 2024–2029 (KILOTON)
- TABLE 142 ITALY: CERAMIC FIBER MARKET, BY TYPE, 2018–2023 (USD MILLION)
- TABLE 143 ITALY: CERAMIC FIBER MARKET, BY TYPE, 2024–2029 (USD MILLION)
- TABLE 144 ITALY: CERAMIC FIBER MARKET, BY TYPE, 2018–2023 (KILOTON)
- TABLE 145 ITALY: CERAMIC FIBER MARKET, BY TYPE, 2024–2029 (KILOTON)
- TABLE 146 RUSSIA: CERAMIC FIBER MARKET, BY TYPE, 2018–2023 (USD MILLION)
- TABLE 147 RUSSIA: CERAMIC FIBER MARKET, BY TYPE, 2024–2029 (USD MILLION)
- TABLE 148 RUSSIA: CERAMIC FIBER MARKET, BY TYPE, 2018–2023 (KILOTON)
- TABLE 149 RUSSIA: CERAMIC FIBER MARKET, BY TYPE, 2024–2029 (KILOTON)
- TABLE 150 NORTH AMERICA: CERAMIC FIBER MARKET, BY TYPE, 2018–2023 (USD MILLION)
- TABLE 151 NORTH AMERICA: CERAMIC FIBER MARKET, BY TYPE, 2024–2029 (USD MILLION)
- TABLE 152 NORTH AMERICA: CERAMIC FIBER MARKET, BY TYPE, 2018–2023 (KILOTON)
- TABLE 153 NORTH AMERICA: CERAMIC FIBER MARKET, BY TYPE, 2024–2029 (KILOTON)
- TABLE 154 NORTH AMERICA: CERAMIC FIBER MARKET, BY PRODUCT FORM, 2018–2023 (USD MILLION)
- TABLE 155 NORTH AMERICA: CERAMIC FIBER MARKET, BY PRODUCT FORM, 2024–2029 (USD MILLION)
- TABLE 156 NORTH AMERICA: CERAMIC FIBER MARKET, BY PRODUCT FORM, 2018–2023 (KILOTON)
- TABLE 157 NORTH AMERICA: CERAMIC FIBER MARKET, BY PRODUCT FORM, 2024–2029 (KILOTON)
- TABLE 158 NORTH AMERICA: CERAMIC FIBER MARKET, BY END-USE INDUSTRY, 2018–2023 (USD MILLION)
- TABLE 159 NORTH AMERICA: CERAMIC FIBER MARKET, BY END-USE INDUSTRY, 2024–2029 (USD MILLION)
- TABLE 160 NORTH AMERICA: CERAMIC FIBER MARKET, BY END-USE INDUSTRY, 2018–2023 (KILOTON)
- TABLE 161 NORTH AMERICA: CERAMIC FIBER MARKET, BY END-USE INDUSTRY, 2024–2029 (KILOTON)
- TABLE 162 NORTH AMERICA: CERAMIC FIBER MARKET, BY COUNTRY, 2018–2023 (USD MILLION)
- TABLE 163 NORTH AMERICA: CERAMIC FIBER MARKET, BY COUNTRY, 2024–2029 (USD MILLION)
- TABLE 164 NORTH AMERICA: CERAMIC FIBER MARKET, BY COUNTRY, 2018–2023 (KILOTON)
- TABLE 165 NORTH AMERICA: CERAMIC FIBER MARKET, BY COUNTRY, 2024–2029 (KILOTON)
- TABLE 166 US: CERAMIC FIBER MARKET, BY TYPE, 2018–2023 (USD MILLION)
- TABLE 167 US: CERAMIC FIBER MARKET, BY TYPE, 2024–2029 (USD MILLION)
- TABLE 168 US: CERAMIC FIBER MARKET, BY TYPE, 2018–2023 (KILOTON)
- TABLE 169 US: CERAMIC FIBER MARKET, BY TYPE, 2024–2029 (KILOTON)
- TABLE 170 CANADA: CERAMIC FIBER MARKET, BY TYPE, 2018–2023 (USD MILLION)
- TABLE 171 CANADA: CERAMIC FIBER MARKET, BY TYPE, 2024–2029 (USD MILLION)
- TABLE 172 CANADA: CERAMIC FIBER MARKET, BY TYPE, 2018–2023 (KILOTON)
- TABLE 173 CANADA: CERAMIC FIBER MARKET, BY TYPE, 2024–2029 (KILOTON)
- TABLE 174 MEXICO: CERAMIC FIBER MARKET, BY TYPE, 2018–2023 (USD MILLION)
- TABLE 175 MEXICO: CERAMIC FIBER MARKET, BY TYPE, 2024–2029 (USD MILLION)
- TABLE 176 MEXICO: CERAMIC FIBER MARKET, BY TYPE, 2018–2023 (KILOTON)
- TABLE 177 MEXICO: CERAMIC FIBER MARKET, BY TYPE, 2024–2029 (KILOTON)
- TABLE 178 MIDDLE EAST & AFRICA: CERAMIC FIBER MARKET, BY TYPE, 2018–2023 (USD MILLION)
- TABLE 179 MIDDLE EAST & AFRICA: CERAMIC FIBER MARKET, BY TYPE, 2024–2029 (USD MILLION)
- TABLE 180 MIDDLE EAST & AFRICA: CERAMIC FIBER MARKET, BY TYPE, 2018–2023 (KILOTON)
- TABLE 181 MIDDLE EAST & AFRICA: CERAMIC FIBER MARKET, BY TYPE, 2024–2029 (KILOTON)
- TABLE 182 MIDDLE EAST & AFRICA: CERAMIC FIBER MARKET, BY PRODUCT FORM, 2018–2023 (USD MILLION)
- TABLE 183 MIDDLE EAST & AFRICA: CERAMIC FIBER MARKET, BY PRODUCT FORM, 2024–2029 (USD MILLION)
- TABLE 184 MIDDLE EAST & AFRICA: CERAMIC FIBER MARKET, BY PRODUCT FORM, 2018–2023 (KILOTON)
- TABLE 185 MIDDLE EAST & AFRICA: CERAMIC FIBER MARKET, BY PRODUCT FORM, 2024–2029 (KILOTON)
- TABLE 186 MIDDLE EAST & AFRICA: CERAMIC FIBER MARKET, BY END-USE INDUSTRY, 2018–2023 (USD MILLION)
- TABLE 187 MIDDLE EAST & AFRICA: CERAMIC FIBER MARKET, BY END-USE INDUSTRY, 2024–2029 (USD MILLION)
- TABLE 188 MIDDLE EAST & AFRICA: CERAMIC FIBER MARKET, BY END-USE INDUSTRY, 2018–2023 (KILOTON)
- TABLE 189 MIDDLE EAST & AFRICA: CERAMIC FIBER MARKET, BY END-USE INDUSTRY, 2024–2029 (KILOTON)
- TABLE 190 MIDDLE EAST & AFRICA: CERAMIC FIBER MARKET, BY COUNTRY, 2018–2023 (USD MILLION)
- TABLE 191 MIDDLE EAST & AFRICA: CERAMIC FIBER MARKET, BY COUNTRY, 2024–2029 (USD MILLION)
- TABLE 192 MIDDLE EAST & AFRICA: CERAMIC FIBER MARKET, BY COUNTRY, 2018–2023 (KILOTON)
- TABLE 193 MIDDLE EAST & AFRICA: CERAMIC FIBER MARKET, BY COUNTRY, 2024–2029 (KILOTON)
- TABLE 194 SAUDI ARABIA: CERAMIC FIBER MARKET, BY TYPE, 2018–2023 (USD MILLION)
- TABLE 195 SAUDI ARABIA: CERAMIC FIBER MARKET, BY TYPE, 2024–2029 (USD MILLION)
- TABLE 196 SAUDI ARABIA: CERAMIC FIBER MARKET, BY TYPE, 2018–2023 (KILOTON)
- TABLE 197 SAUDI ARABIA: CERAMIC FIBER MARKET, BY TYPE, 2024–2029 (KILOTON)
- TABLE 198 IRAN: CERAMIC FIBER MARKET, BY TYPE, 2018–2023 (USD MILLION)
- TABLE 199 IRAN: CERAMIC FIBER MARKET, BY TYPE, 2024–2029 (USD MILLION)
- TABLE 200 IRAN: CERAMIC FIBER MARKET, BY TYPE, 2018–2023 (KILOTON)
- TABLE 201 IRAN: CERAMIC FIBER MARKET, BY TYPE, 2024–2029 (KILOTON)
- TABLE 202 SOUTH AMERICA: CERAMIC FIBER MARKET, BY TYPE, 2018–2023 (USD MILLION)
- TABLE 203 SOUTH AMERICA: CERAMIC FIBER MARKET, BY TYPE, 2024–2029 (USD MILLION)
- TABLE 204 SOUTH AMERICA: CERAMIC FIBER MARKET, BY TYPE, 2018–2023 (KILOTON)
- TABLE 205 SOUTH AMERICA: CERAMIC FIBER MARKET, BY TYPE, 2024–2029 (KILOTON)
- TABLE 206 SOUTH AMERICA: CERAMIC FIBER MARKET, BY PRODUCT FORM, 2018–2023 (USD MILLION)
- TABLE 207 SOUTH AMERICA: CERAMIC FIBER MARKET, BY PRODUCT FORM, 2024–2029 (USD MILLION)
- TABLE 208 SOUTH AMERICA: CERAMIC FIBER MARKET, BY PRODUCT FORM, 2018–2023 (KILOTON)
- TABLE 209 SOUTH AMERICA: CERAMIC FIBER MARKET, BY PRODUCT FORM, 2024–2029 (KILOTON)
- TABLE 210 SOUTH AMERICA: CERAMIC FIBER MARKET, BY END-USE INDUSTRY, 2018–2023 (USD MILLION)
- TABLE 211 SOUTH AMERICA: CERAMIC FIBER MARKET, BY END-USE INDUSTRY, 2024–2029 (USD MILLION)
- TABLE 212 SOUTH AMERICA: CERAMIC FIBER MARKET, BY END-USE INDUSTRY, 2018–2023 (KILOTON)
- TABLE 213 SOUTH AMERICA: CERAMIC FIBER MARKET, BY END-USE INDUSTRY, 2024–2029 (KILOTON)
- TABLE 214 SOUTH AMERICA: CERAMIC FIBER MARKET, BY COUNTRY, 2018–2023 (USD MILLION)
- TABLE 215 SOUTH AMERICA: CERAMIC FIBER MARKET, BY COUNTRY, 2024–2029 (USD MILLION)
- TABLE 216 SOUTH AMERICA: CERAMIC FIBER MARKET, BY COUNTRY, 2018–2023 (KILOTON)
- TABLE 217 SOUTH AMERICA: CERAMIC FIBER MARKET, BY COUNTRY, 2024–2029 (KILOTON)
- TABLE 218 BRAZIL: CERAMIC FIBER MARKET, BY TYPE, 2018–2023 (USD MILLION)
- TABLE 219 BRAZIL: CERAMIC FIBER MARKET, BY TYPE, 2024–2029 (USD MILLION)
- TABLE 220 BRAZIL: CERAMIC FIBER MARKET, BY TYPE, 2018–2023 (KILOTON)
- TABLE 221 BRAZIL: CERAMIC FIBER MARKET, BY TYPE, 2024–2029 (KILOTON)
- TABLE 222 ARGENTINA: CERAMIC FIBER MARKET, BY TYPE, 2018–2023 (USD MILLION)
- TABLE 223 ARGENTINA: CERAMIC FIBER MARKET, BY TYPE, 2024–2029 (USD MILLION)
- TABLE 224 ARGENTINA: CERAMIC FIBER MARKET, BY TYPE, 2018–2023 (KILOTON)
- TABLE 225 ARGENTINA: CERAMIC FIBER MARKET, BY TYPE, 2024–2029 (KILOTON)
- TABLE 226 OVERVIEW OF STRATEGIES ADOPTED BY KEY CERAMIC FIBER MANUFACTURERS, JANUARY 2020–AUGUST 2024
- TABLE 227 CERAMIC FIBER MARKET: DEGREE OF COMPETITION
- TABLE 228 CERAMIC FIBER MARKET: REGION FOOTPRINT
- TABLE 229 CERAMIC FIBER MARKET: TYPE FOOTPRINT
- TABLE 230 CERAMIC FIBER MARKET: PRODUCT FORM FOOTPRINT
- TABLE 231 CERAMIC FIBER MARKET: END-USE INDUSTRY FOOTPRINT
- TABLE 232 CERAMIC FIBER MARKET: DETAILED LIST OF KEY STARTUPS/SMES
- TABLE 233 CERAMIC FIBER MARKET: COMPETITIVE BENCHMARKING OF KEY STARTUPS/SMES
- TABLE 234 CERAMIC FIBER MARKET: PRODUCT LAUNCHES, JANUARY 2020–AUGUST 2024
- TABLE 235 CERAMIC FIBER MARKET: DEALS, JANUARY 2020–AUGUST 2024
- TABLE 236 CERAMIC FIBER MARKET: EXPANSIONS, JANUARY 2020–AUGUST 2024
- TABLE 237 CERAMIC FIBER MARKET: OTHER DEVELOPMENTS, JANUARY 2020–AUGUST 2024
- TABLE 238 MORGAN ADVANCED MATERIALS PLC: COMPANY OVERVIEW
- TABLE 239 MORGAN ADVANCED MATERIALS PLC: PRODUCTS/SOLUTIONS/SERVICES OFFERED
- TABLE 240 MORGAN ADVANCED MATERIALS PLC: EXPANSIONS, JANUARY 2020–AUGUST 2024
- TABLE 241 MORGAN ADVANCED MATERIALS PLC: OTHER DEVELOPMENTS, JANUARY 2020–AUGUST 2024
- TABLE 242 ALKEGEN: COMPANY OVERVIEW
- TABLE 243 ALKEGEN: PRODUCTS/SOLUTIONS/SERVICES/OFFERED
- TABLE 244 ALKEGEN: PRODUCT LAUNCHES, JANUARY 2020–AUGUST 2024
- TABLE 245 ALKEGEN: DEALS, JANUARY 2020–AUGUST 2024
- TABLE 246 IBIDEN CO., LTD.: COMPANY OVERVIEW
- TABLE 247 IBIDEN CO., LTD.: PRODUCTS/SOLUTIONS/SERVICES OFFERED
- TABLE 248 NUTEC INCORPORATED: COMPANY OVERVIEW
- TABLE 249 NUTEC INCORPORATED: PRODUCTS/SOLUTIONS/SERVICES OFFERED
- TABLE 250 ISOLITE INSULATING PRODUCTS CO., LTD.: COMPANY OVERVIEW
- TABLE 251 ISOLITE INSULATING PRODUCTS CO., LTD.: PRODUCTS/SOLUTIONS/SERVICES OFFERED
- TABLE 252 HARBISONWALKER INTERNATIONAL INC.: COMPANY OVERVIEW
- TABLE 253 HARBISONWALKER INTERNATIONAL INC.: PRODUCTS/SOLUTIONS/SERVICES OFFERED
- TABLE 254 HARBISONWALKER INTERNATIONAL INC.: DEALS, JANUARY 2020–AUGUST 2024
- TABLE 255 YESO INSULATING PRODUCTS COMPANY LIMITED: COMPANY OVERVIEW
- TABLE 256 YESO INSULATING PRODUCTS COMPANY LIMITED: PRODUCTS/SOLUTIONS/ SERVICES OFFERED
- TABLE 257 RATH GROUP: COMPANY OVERVIEW
- TABLE 258 RATH GROUP: PRODUCTS/SOLUTIONS/SERVICES OFFERED
- TABLE 259 RATH GROUP: DEALS, JANUARY 2020–AUGUST 2024
- TABLE 260 DOUBLE EGRET THERMAL INSULATION CO., LTD.: COMPANY OVERVIEW
- TABLE 261 DOUBLE EGRET THERMAL INSULATION CO., LTD.: PRODUCTS/SOLUTIONS/ SERVICES OFFERED
- TABLE 262 ZIRCAR CERAMICS, INC.: COMPANY OVERVIEW
- TABLE 263 ZIRCAR CERAMICS, INC.: PRODUCTS/SOLUTIONS/SERVICES OFFERED
- TABLE 264 FIBRECAST INC.: COMPANY OVERVIEW
- TABLE 265 PROMAT INC.: COMPANY OVERVIEW
- TABLE 266 PYROTEK INC.: COMPANY OVERVIEW
- TABLE 267 CERAMSOURCE INC.: COMPANY OVERVIEW
- TABLE 268 ADL INSULFLEX INC.: COMPANY OVERVIEW
- TABLE 269 SIMOND FIBERTECH LIMITED: COMPANY OVERVIEW
- TABLE 270 3M COMPANY: COMPANY OVERVIEW
- TABLE 271 M.E. SCHUPP INDUSTRIEKERAMIK GMBH: COMPANY OVERVIEW
- TABLE 272 MINERAL SEAL CORPORATION: COMPANY OVERVIEW
- TABLE 273 GLT PRODUCTS: COMPANY OVERVIEW
- TABLE 274 MARSHALL PACKINGS AND INSULATIONS INDUSTRIES: COMPANY OVERVIEW
- TABLE 275 SHREE CERAMIC FIBERS PVT. LTD.: COMPANY OVERVIEW
- TABLE 276 THERMAL PRODUCTS COMPANY INC.: COMPANY OVERVIEW
- TABLE 277 REFMON INDUSTRIES: COMPANY OVERVIEW
- TABLE 278 GALAXY ENTERPRISE: COMPANY OVERVIEW
- TABLE 279 CERAMIC MATRIX COMPOSITES MARKET, BY REGION, 2019–2023 (KILOTON)
- TABLE 280 CERAMIC MATRIX COMPOSITES MARKET, BY REGION, 2019–2023 (USD MILLION)
- TABLE 281 CERAMIC MATRIX COMPOSITES MARKET, BY REGION, 2024–2031 (KILOTON)
- TABLE 282 CERAMIC MATRIX COMPOSITES MARKET, BY REGION, 2024–2031 (USD MILLION)
- TABLE 283 ASIA PACIFIC: CERAMIC MATRIX COMPOSITES MARKET, BY COUNTRY, 2019–2023 (KILOTON)
- TABLE 284 ASIA PACIFIC: CERAMIC MATRIX COMPOSITES MARKET, BY COUNTRY, 2019–2023 (USD MILLION)
- TABLE 285 ASIA PACIFIC: CERAMIC MATRIX COMPOSITES MARKET, BY COUNTRY, 2024–2031 (KILOTON)
- TABLE 286 ASIA PACIFIC: CERAMIC MATRIX COMPOSITES MARKET, BY COUNTRY, 2024–2031 (USD MILLION)
- TABLE 287 EUROPE: CERAMIC MATRIX COMPOSITES MARKET, BY COUNTRY, 2019–2023 (KILOTON)
- TABLE 288 EUROPE: CERAMIC MATRIX COMPOSITES MARKET, BY COUNTRY, 2019–2023 (USD MILLION)
- TABLE 289 EUROPE: CERAMIC MATRIX COMPOSITES MARKET, BY COUNTRY, 2024–2031 (KILOTON)
- TABLE 290 EUROPE: CERAMIC MATRIX COMPOSITES MARKET, BY COUNTRY, 2024–2031 (USD MILLION)
- TABLE 291 MIDDLE EAST & AFRICA: CERAMIC MATRIX COMPOSITES MARKET, BY COUNTRY, 2019–2023 (KILOTON)
- TABLE 292 MIDDLE EAST & AFRICA: CERAMIC MATRIX COMPOSITES MARKET, BY COUNTRY, 2019–2023 (USD MILLION)
- TABLE 293 MIDDLE EAST & AFRICA: CERAMIC MATRIX COMPOSITES MARKET, BY COUNTRY, 2024–2031 (KILOTON)
- TABLE 294 MIDDLE EAST & AFRICA: CERAMIC MATRIX COMPOSITES MARKET, BY COUNTRY, 2024–2031 (USD MILLION)
- TABLE 295 NORTH AMERICA: CERAMIC MATRIX COMPOSITES MARKET, BY COUNTRY, 2019–2023 (KILOTON)
- TABLE 296 NORTH AMERICA: CERAMIC MATRIX COMPOSITES MARKET, BY COUNTRY, 2019–2023 (USD MILLION)
- TABLE 297 NORTH AMERICA: CERAMIC MATRIX COMPOSITES MARKET, BY COUNTRY, 2024–2031 (KILOTON)
- TABLE 298 NORTH AMERICA: CERAMIC MATRIX COMPOSITES MARKET, BY COUNTRY, 2024–2031 (USD MILLION)
- TABLE 299 LATIN AMERICA: CERAMIC MATRIX COMPOSITES MARKET, BY COUNTRY, 2019–2023 (KILOTON)
- TABLE 300 LATIN AMERICA: CERAMIC MATRIX COMPOSITES MARKET, BY COUNTRY, 2019–2023 (USD MILLION)
- TABLE 301 LATIN AMERICA: CERAMIC MATRIX COMPOSITES MARKET, BY COUNTRY, 2024–2031 (KILOTON)
- TABLE 302 LATIN AMERICA: CERAMIC MATRIX COMPOSITES MARKET, BY COUNTRY, 2024–2031 (USD MILLION)
- FIGURE 1 CERAMIC FIBER MARKET: RESEARCH DESIGN
- FIGURE 2 MARKET SIZE ESTIMATION METHODOLOGY: APPROACH 1 (SUPPLY SIDE): COLLECTIVE SHARE OF MAJOR PLAYERS
- FIGURE 3 MARKET SIZE ESTIMATION METHODOLOGY: APPROACH 2 - BOTTOM-UP (SUPPLY SIDE): COLLECTIVE REVENUE OF ALL PRODUCTS
- FIGURE 4 MARKET SIZE ESTIMATION METHODOLOGY: APPROACH 3 – BOTTOM-UP(DEMAND SIDE)
- FIGURE 5 MARKET SIZE ESTIMATION METHODOLOGY: APPROACH 3 – TOP-DOWN
- FIGURE 6 CERAMIC FIBER MARKET: DATA TRIANGULATION
- FIGURE 7 SUPPLY-SIDE MARKET CAGR PROJECTIONS
- FIGURE 8 DEMAND-SIDE MARKET GROWTH PROJECTIONS: DRIVERS AND OPPORTUNITIES
- FIGURE 9 REFINING & PETROCHEMICAL TO BE LARGEST END-USE INDUSTRY OF CERAMIC FIBER DURING FORECAST PERIOD
- FIGURE 10 RCF SEGMENT TO LEAD CERAMIC FIBER MARKET DURING FORECAST PERIOD
- FIGURE 11 BLANKET TO BE LARGEST PRODUCT FORM OF CERAMIC FIBER DURING FORECAST PERIOD
- FIGURE 12 ASIA PACIFIC ACCOUNTED FOR LARGEST SHARE OF CERAMIC FIBER MARKET IN 2023
- FIGURE 13 ASIA PACIFIC TO REGISTER HIGHEST GROWTH DURING FORECAST PERIOD
- FIGURE 14 ASIA PACIFIC TO LEAD MARKET DURING FORECAST PERIOD
- FIGURE 15 CHINA AND BLANKET PRODUCT FORM ACCOUNTED FOR LARGEST MARKET SHARE
- FIGURE 16 REFINING & PETROCHEMICAL SEGMENT LED CERAMIC FIBER MARKET ACROSS REGIONS
- FIGURE 17 INDIA TO BE FASTEST-GROWING MARKET DURING FORECAST PERIOD
- FIGURE 18 DRIVERS, RESTRAINTS, OPPORTUNITIES, AND CHALLENGES IN CERAMIC FIBER MARKET
- FIGURE 19 CERAMIC FIBER MARKET: SUPPLY CHAIN
- FIGURE 20 CERAMIC FIBER MARKET: PORTER’S FIVE FORCES ANALYSIS
- FIGURE 21 INFLUENCE OF STAKEHOLDERS ON BUYING PROCESS FOR TOP 3 END-USE INDUSTRIES
- FIGURE 22 KEY BUYING CRITERIA FOR TOP 3 END-USE INDUSTRIES
- FIGURE 23 AVERAGE SELLING PRICE FOR TOP THREE END-USE INDUSTRIES, BY KEY PLAYER
- FIGURE 24 AVERAGE SELLING PRICE TREND OF CERAMIC FIBER, BY REGION
- FIGURE 25 CERAMIC FIBER MARKET: TRENDS/DISRUPTIONS IMPACTING CUSTOMER BUSINESS
- FIGURE 26 CERAMIC FIBER MARKET: ECOSYSTEM
- FIGURE 27 IMPORT OF CERAMIC FIBER, BY KEY COUNTRY (2018–2022)
- FIGURE 28 EXPORT OF CERAMIC FIBER, BY KEY COUNTRY (2018–2022)
- FIGURE 29 PATENTS REGISTERED IN CERAMIC FIBER MARKET, 2013–2023
- FIGURE 30 PATENT PUBLICATION TRENDS, 2013–2023
- FIGURE 31 TOP PATENT OWNERS IN LAST 11 YEARS
- FIGURE 32 LEGAL STATUS OF PATENTS
- FIGURE 33 MAXIMUM PATENTS FILED BY COMPANIES IN US
- FIGURE 34 IMPACT OF AI/GEN AI ON CERAMIC FIBER MARKET
- FIGURE 35 AES WOOL TO BE FASTEST-GROWING SEGMENT DURING FORECAST PERIOD
- FIGURE 36 APPLICATIONS OF RCF
- FIGURE 37 APPLICATIONS OF AES WOOL
- FIGURE 38 BLANKET PROJECTED TO BE FASTEST-GROWING PRODUCT FORM DURING FORECAST PERIOD
- FIGURE 39 APPLICATIONS OF CERAMIC FIBER BLANKET, BY INDUSTRY
- FIGURE 40 APPLICATIONS OF CERAMIC FIBER MODULES, BY INDUSTRY
- FIGURE 41 APPLICATIONS OF CERAMIC FIBER BOARD, BY INDUSTRY
- FIGURE 42 APPLICATIONS OF CERAMIC FIBER PAPER, BY INDUSTRY
- FIGURE 43 APPLICATIONS OF OTHER CERAMIC FIBER PRODUCT FORMS, BY INDUSTRY
- FIGURE 44 REFINING & PETROCHEMICAL END-USE INDUSTRY TO LEAD MARKET DURING FORECAST PERIOD
- FIGURE 45 ASIA PACIFIC PROJECTED TO REGISTER HIGHEST CAGR DURING FORECAST PERIOD
- FIGURE 46 ASIA PACIFIC: CERAMIC FIBER MARKET SNAPSHOT
- FIGURE 47 EUROPE: CERAMIC FIBER MARKET SNAPSHOT
- FIGURE 48 NORTH AMERICA: CERAMIC FIBER MARKET SNAPSHOT
- FIGURE 49 CERAMIC FIBER MARKET SHARE ANALYSIS, 2023
- FIGURE 50 CERAMIC FIBER MARKET: REVENUE ANALYSIS OF KEY PLAYERS, 2019–2023
- FIGURE 51 CERAMIC FIBER MARKET: COMPANY EVALUATION MATRIX (KEY PLAYERS), 2023
- FIGURE 52 CERAMIC FIBER MARKET: COMPANY FOOTPRINT
- FIGURE 53 CERAMIC FIBER MARKET: COMPANY EVALUATION MATRIX (STARTUPS/SMES), 2023
- FIGURE 54 BRAND/PRODUCT COMPARISON
- FIGURE 55 EV/EBITDA OF KEY MANUFACTURERS OF CERAMIC FIBER
- FIGURE 56 ENTERPRISE VALUATION (EV) OF KEY PLAYERS IN CERAMIC FIBER MARKET
- FIGURE 57 MORGAN ADVANCED MATERIALS PLC: COMPANY SNAPSHOT
- FIGURE 58 IBIDEN CO., LTD.: COMPANY SNAPSHOT
- FIGURE 59 RATH GROUP: COMPANY SNAPSHOT
The study involved four major activities in estimating the market size for ceramic fiber market. Exhaustive secondary research was done to collect information on the market, the peer market, and the parent market. The next step was to validate these findings, assumptions, and sizing with industry experts across the value chain through primary research. Both top-down and bottom-up approaches were employed to estimate the complete market size. After that, the market breakdown and data triangulation procedures were used to estimate the market size of the segments and subsegments.
Secondary Research
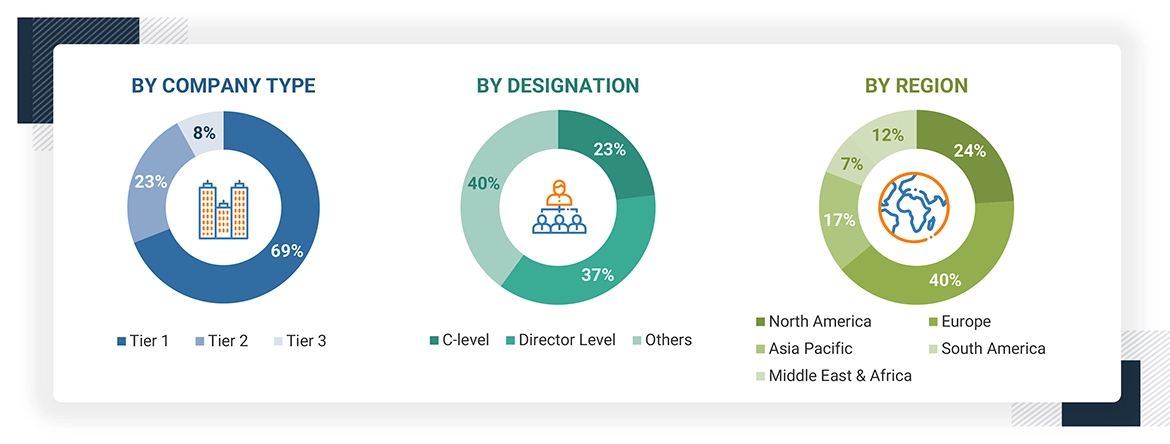
Secondary sources used in this study included annual reports, press releases, and investor presentations of companies; white papers; certified publications; articles from recognized authors; and gold standard & silver standard websites such as Factiva, ICIS, Bloomberg, and others. The findings of this study were verified through primary research by conducting extensive interviews with key officials such as CEOs, VPs, directors, and other executives. The breakdown of profiles of the primary interviewees is illustrated in the figure below:
Primary Research
The ceramic fiber market comprises several stakeholders, such as raw material suppliers, end-product manufacturers, and regulatory organizations in the supply chain. The demand side of this market is characterized by RCF, AES Wool, and other types. The supply side is characterized by advancements in technology and diverse application industries. Various primary sources from both the supply and demand sides of the market were interviewed to obtain qualitative and quantitative information.
Note: Tier 1, Tier 2, and Tier 3 companies are classified based on their market revenue in 2023, available in the public domain, product portfolios, and geographical presence.
Other designations include consultants and sales, marketing, and procurement managers.
To know about the assumptions considered for the study, download the pdf brochure
COMPANY NAME |
DESIGNATION |
Alkegen |
Senior Manager |
Rath Group |
Innovation Manager |
Refmon Industries |
Vice-President |
Morgan Advanced Materials plc |
Production Supervisor |
IBIDEN Co., Ltd. |
Sales Manager |
MARKET SIZE ESTIMATION
Both top-down and bottom-up approaches were used to estimate and validate the total size of the ceramic fiber market. These methods were also used extensively to estimate the size of various subsegments in the market. The research methodology used to estimate the market size includes the following:
- The key players in the industry have been identified through extensive secondary research.
- The supply chain of the industry has been determined through primary and secondary research.
- All percentage shares, splits, and breakdowns have been determined using secondary sources and verified through primary sources.
- All possible parameters that affect the markets covered in this research study have been accounted for, viewed in extensive detail, verified through primary research, and analyzed to obtain the final quantitative and qualitative data.
Ceramic Fiber Market: Bottom-Up Approach
To know about the assumptions considered for the study, Request for Free Sample Report
Ceramic Fiber Market: Top-Down Approach
Data Triangulation
After arriving at the overall market size—using the market size estimation processes as explained above—the market was split into several segments and subsegments. To complete the overall market engineering process and arrive at the exact statistics of each market segment and subsegment, data triangulation, and market breakdown procedures were employed, wherever applicable. The data was triangulated by studying various factors and trends from both the demand and supply sides in the ceramic fiber industry.
Market Definition
The ceramic fiber market can be defined as the segment of the industry that deals with manufacturing and supply of ceramic fibers as well as the use of the fibers as insulation products derived from ceramic materials. Such fibers are characterised by high thermal stability, low coefficient of thermal expansion and high thermal conductivity and ageless at high temperatures. The market consists of various types of ceramic fibers products including RCF, AES Wool, and others, Product forms like blankets, boards, papers, module and others among others.
Key Stakeholders
- Ceramic fiber manufacturers
- Ceramic fiber suppliers
- Raw material suppliers
- Service providers
- End-use companies
- Government bodies
Report Objectives
- To define, describe, and forecast the ceramic fiber market in terms of value and volume
- To provide detailed information regarding the drivers, opportunities, restraints, and challenges influencing market growth
- To estimate and forecast the market size by type, product form, end-use industries, and region
- To forecast the size of the market for five main regions: Asia Pacific, Europe, North America, South America, and the Middle East & Africa, along with their key countries
- To strategically analyze micromarkets1 with respect to their growth trends, prospects, and contribution to the overall market
- To analyze opportunities in the market for stakeholders and provide a competitive landscape for market leaders
- To analyze competitive developments, such as deals and expansions, in the market
- To analyze the impact of the recession on the market
- To analyze the impact of COVID-19 on the market and end-use industry
- To strategically profile key players and comprehensively analyze their growth strategies
Available Customizations
Along with the given market data, MarketsandMarkets offers customizations according to the company’s specific needs. The following customization options are available for the report:
Regional Analysis
- Further breakdown of a region with respect to a particular country or additional application type
Company Information
- Detailed analysis and profiles of additional market players (up to five)
Growth opportunities and latent adjacency in Ceramic Fiber Market
Market feasibility on ceramic fiber board
ceramic fiber paper market
Data on market size and share by region of Ceramic Fibres, market drivers and opportunities.
Market information on global Cermaic fiber market
Global Market Opportunity Study study on Alumino Silicate Wool (ASW) also known as Refractory Ceramic Fibre (RCF) – H.S. Code 6806 68 06 00 00.
Information on ceramic fiber blanket roll pricing