TABLE OF CONTENTS
1 INTRODUCTION (Page No. - 25)
1.1 STUDY OBJECTIVES
1.2 MARKET DEFINITION
1.3 STUDY SCOPE
1.3.1 INCLUSIONS AND EXCLUSIONS
1.3.2 MARKETS COVERED
1.3.3 REGIONAL SCOPE
1.3.4 YEARS CONSIDERED
1.4 CURRENCY CONSIDERED
1.5 UNITS CONSIDERED
1.6 LIMITATIONS
1.7 STAKEHOLDERS
1.8 RECESSION IMPACT
2 RESEARCH METHODOLOGY (Page No. - 30)
2.1 RESEARCH DATA
2.1.1 SECONDARY DATA
2.1.1.1 Key data from secondary sources
2.1.1.2 List of major secondary sources
2.1.2 PRIMARY DATA
2.1.2.1 Key data from primary sources
2.1.2.2 List of primary interview participants/Key opinion leaders
2.1.2.3 Breakdown of primary interviews
2.1.2.4 Key industry insights
2.2 MARKET SIZE ESTIMATION METHODOLOGY
2.2.1 SUPPLY-SIDE APPROACH
2.2.2 DEMAND-SIDE APPROACH
2.3 FORECAST
2.3.1 SUPPLY SIDE
2.3.2 DEMAND SIDE
2.4 MARKET SIZE ESTIMATION
2.4.1 BOTTOM-UP APPROACH
2.4.2 TOP-DOWN APPROACH
2.5 DATA TRIANGULATION
2.6 RESEARCH ASSUMPTIONS
2.7 RECESSION IMPACT ANALYSIS
2.8 HISTORICAL TREND AND GROWTH FORECAST
2.9 RISK ASSESSMENT
2.10 FACTOR ANALYSIS
3 EXECUTIVE SUMMARY (Page No. - 42)
4 PREMIUM INSIGHTS (Page No. - 48)
4.1 ATTRACTIVE OPPORTUNITIES FOR PLAYERS IN CARBONIZATION FURNACE MARKET
4.2 CARBONIZATION FURNACE MARKET, BY APPLICATION
4.3 CARBONIZATION FURNACE MARKET, BY TYPE
4.4 CARBONIZATION FURNACE MARKET, BY COUNTRY
5 MARKET OVERVIEW (Page No. - 51)
5.1 INTRODUCTION
5.2 MARKET DYNAMICS
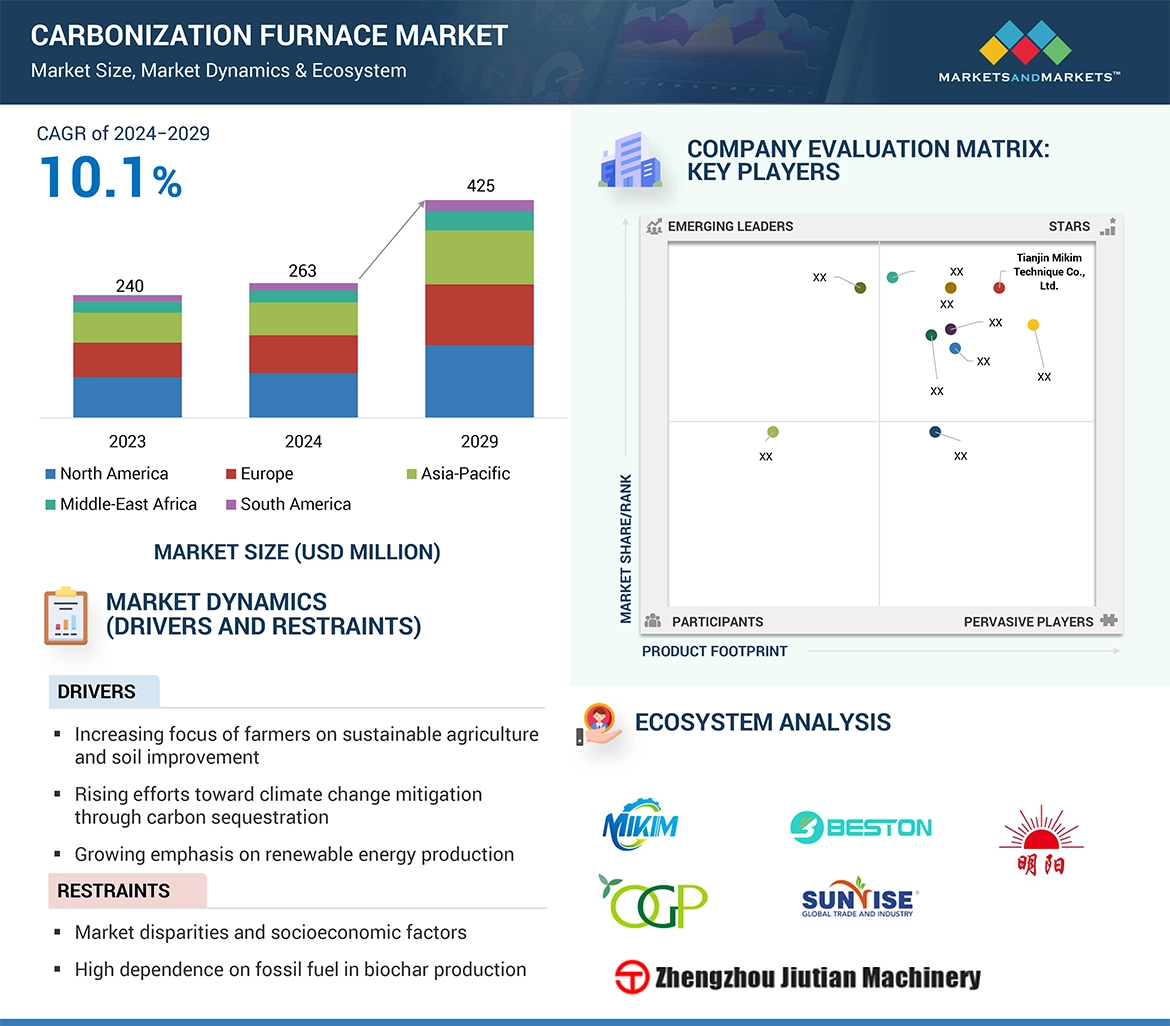
5.2.1 DRIVERS
5.2.1.1 Increasing focus of farmers on sustainable agriculture and soil improvement
5.2.1.2 Rising efforts toward climate change mitigation through carbon sequestration
5.2.1.3 Growing emphasis on renewable energy production
5.2.2 RESTRAINTS
5.2.2.1 Market disparities and socioeconomic factors
5.2.2.2 High dependence on fossil fuel in biochar production
5.2.3 OPPORTUNITIES
5.2.3.1 Harnessing carbonization technology to transform waste into wealth
5.2.3.2 Soil remediation, sustainable land management, and environmental restoration efforts
5.2.4 CHALLENGES
5.2.4.1 Limited awareness about benefits of carbonization technology
6 INDUSTRY TRENDS (Page No. - 57)
6.1 INTRODUCTION
6.2 TRENDS/DISRUPTIONS IMPACTING CUSTOMER BUSINESS
6.3 SUPPLY CHAIN ANALYSIS
6.4 PRICING ANALYSIS
6.4.1 AVERAGE SELLING PRICE TREND, BY REGION
6.4.2 AVERAGE SELLING PRICE TREND OF CARBONIZATION FURNACE, BY TYPE
6.4.3 AVERAGE SELLING PRICE TREND OF KEY PLAYERS, BY TYPE
6.5 ECOSYSTEM ANALYSIS
6.6 TECHNOLOGY ANALYSIS
6.6.1 KEY TECHNOLOGIES
6.6.1.1 Pyrolysis
6.6.2 COMPLEMENTARY TECHNOLOGIES
6.6.2.1 Gasification
6.6.2.2 Emission control
6.6.3 ADJACENT TECHNOLOGIES
6.6.3.1 Biomass pretreatment
6.6.3.2 Bio-oil upgrading
6.6.3.3 Syngas utilization
6.7 PATENT ANALYSIS
6.7.1 METHODOLOGY
6.7.2 TOTAL PATENTS, 2013–2023
6.7.2.1 Patent publication trends, 2013–2023
6.7.3 INSIGHTS
6.7.4 LEGAL STATUS
6.7.5 JURISDICTION ANALYSIS
6.7.6 TOP APPLICANTS
6.7.7 KEY PATENTS RELATED TO CARBONIZATION FURNACE TECHNOLOGY
6.8 TRADE ANALYSIS
6.8.1 IMPORT SCENARIO (HS CODE 841780)
6.8.2 EXPORT SCENARIO (HS CODE 841780)
6.9 KEY CONFERENCES AND EVENTS, 2024–2025
6.10 TARIFF AND REGULATORY LANDSCAPE
6.10.1 TARIFF ANALYSIS
6.10.2 REGULATORY BODIES, GOVERNMENT AGENCIES, AND OTHER ORGANIZATIONS
6.10.3 REGULATIONS AND STANDARDS
6.11 PORTER’S FIVE FORCES ANALYSIS
6.11.1 THREAT OF NEW ENTRANTS
6.11.2 THREAT OF SUBSTITUTES
6.11.3 BARGAINING POWER OF SUPPLIERS
6.11.4 BARGAINING POWER OF BUYERS
6.11.5 INTENSITY OF COMPETITIVE RIVALRY
6.12 KEY STAKEHOLDERS AND BUYING CRITERIA
6.12.1 KEY STAKEHOLDERS IN BUYING PROCESS
6.12.2 BUYING CRITERIA
6.13 MACROECONOMIC INDICATORS
6.13.1 GDP TRENDS AND FORECASTS, BY COUNTRY
6.14 CASE STUDY ANALYSIS
6.14.1 JAPAN-BASED STEEL PRODUCER DEPLOYED CARBONIZATION FURNACES TO CONVERT BIOMASS INTO BIO-COKE
6.14.2 UNIVERSITY OF WASHINGTON EXAMINED NEWLY DESIGNED CARBONIZATION FURNACES TO ENSURE SUSTAINABLE BIOCHAR PRODUCTION
6.14.3 THYSSENKRUPP ROTHE ERDE INSTALLED CARBONIZATION PLANT IN LIPPSTADT TO REDUCE OPERATIONAL COST AND C02 EMISSIONS
7 CARBONIZATION FURNACE MARKET, BY FEEDSTOCK (Page No. - 86)
7.1 INTRODUCTION
7.2 AGRICULTURAL WASTE
7.2.1 ENVIRONMENTAL AND ECONOMIC ADVANTAGES TO BOOST UTILIZATION OF AGRICULTURAL WASTE IN BIOCHAR PRODUCTION
7.2.2 CORN STALKS
7.2.3 WHEAT STRAW
7.2.4 RICE HUSKS
7.2.5 SUGARCANE BAGASSE
7.3 FORESTRY WASTE
7.3.1 HIGH ADOPTION OF RENEWABLE ENERGY SOURCES TO FUEL SEGMENTAL GROWTH
7.3.2 SAWDUST AND WOOD CHIPS
7.3.3 BAMBOO
7.3.4 TRUNKS AND BRANCHES
7.4 NUTSHELLS
7.4.1 SIGNIFICANT DEMAND FOR HIGH-QUALITY CHARCOAL TO FOSTER SEGMENTAL GROWTH
7.4.2 COCONUT SHELLS
7.4.3 PALM SHELLS
7.4.4 OLIVE SHELLS
7.4.5 HAZELNUT SHELLS
7.5 OTHER FEEDSTOCKS
8 CARBONIZATION FURNACE MARKET, BY APPLICATION (Page No. - 93)
8.1 INTRODUCTION
8.2 CHARCOAL
8.2.1 CEMENT, BRICK, AND BOILER FACTORIES TO CONTRIBUTE TO MARKET GROWTH
8.2.1.1 Charcoal applications
8.2.1.1.1 Smelter
8.2.1.1.2 Fuel
8.2.1.1.3 Purifier
8.2.1.1.4 Fertilizer
8.2.1.1.5 Insulating material
8.3 WOOD VINEGAR
8.3.1 RISING DEMAND FROM AGRICULTURAL, INDUSTRIAL, WASTE TREATMENT, AND LIVESTOCK APPLICATIONS TO SUPPORT SEGMENTAL GROWTH
8.3.1.1 Wood vinegar applications
8.3.1.1.1 Soil enhancer
8.3.1.1.2 Deodorizer
8.3.1.1.3 Fertilizer
8.3.1.1.4 Additive
8.3.1.1.5 Food preservative
8.4 TAR
8.4.1 VERSATILE APPLICATIONS IN CONSTRUCTION, FUEL GENERATION, AND WOOD PRESERVATION TO BOOST DEMAND
8.4.1.1 Tar applications
8.4.1.1.1 Fuel
8.4.1.1.2 Waterproof feedstock
8.4.1.1.3 Carbon black
9 CARBONIZATION FURNACE MARKET, BY CAPACITY (Page No. - 101)
9.1 INTRODUCTION
9.2 <1,000 KG/H
9.2.1 FARMERS, SMALL-SCALE COOPERATIVES, AND RESEARCH FACILITIES TO CONTRIBUTE TO SEGMENTAL GROWTH
9.3 1,000–2,000 KG/H
9.3.1 SEMI-CONTINUOUS OPERATIONAL MODE AND ABILITY TO ACCOMMODATE DIVERSE BIOMASS MATERIALS TO BOOST DEMAND
9.4 2,000–3,000 KG/H
9.4.1 SIGNIFICANT DEMAND FROM FORESTRY AND WASTE MANAGEMENT INDUSTRIES TO SUPPORT MARKET GROWTH
9.5 >3,000 KG/H
9.5.1 HIGH CAPACITY AND ADVANCED AUTOMATION AND EMISSION CONTROL FEATURES TO DRIVE ADOPTION
10 CARBONIZATION FURNACE MARKET, BY TYPE (Page No. - 105)
10.1 INTRODUCTION
10.2 CONTINUOUS CARBONIZATION FURNACE
10.2.1 YEARS CONSIDERED
10.3 HORIZONTAL CHARCOAL FURNACE
10.3.1 UNITS CONSIDERED
10.4 SKID-MOUNTED CARBONIZATION FURNACE
10.4.1 STAKEHOLDERS
10.5 OTHER TYPES
11 CARBONIZATION FURNACE MARKET, BY REGION (Page No. - 110)
11.1 INTRODUCTION
11.2 ASIA PACIFIC
11.2.1 Key data from secondary sources
11.2.2 List of major secondary sources
11.2.2.1 Climate change mitigation and waste management initiatives to drive market
11.2.3 Key data from primary sources
11.2.3.1 Focus on developing innovative carbonization solutions to fuel market growth
11.2.4 Breakdown of primary interviews
11.2.4.1 Increasing adoption of sustainable farming techniques to accelerate market growth
11.2.5 MARKET SIZE ESTIMATION METHODOLOGY
11.2.5.1 Government subsidies for biomass utilization, soil improvement projects, and sustainable agricultural practices to promote market growth
11.2.6 DEMAND-SIDE APPROACH
11.3 NORTH AMERICA
11.3.1 SUPPLY SIDE
11.3.2 DEMAND SIDE
11.3.2.1 Growing use of precision farming techniques to augment market growth
11.3.3 BOTTOM-UP APPROACH
11.3.3.1 Robust agricultural and forestry sectors to support market growth
11.3.4 DATA TRIANGULATION
11.3.4.1 Commitment to sustainability and environmental responsibility to create market growth opportunities
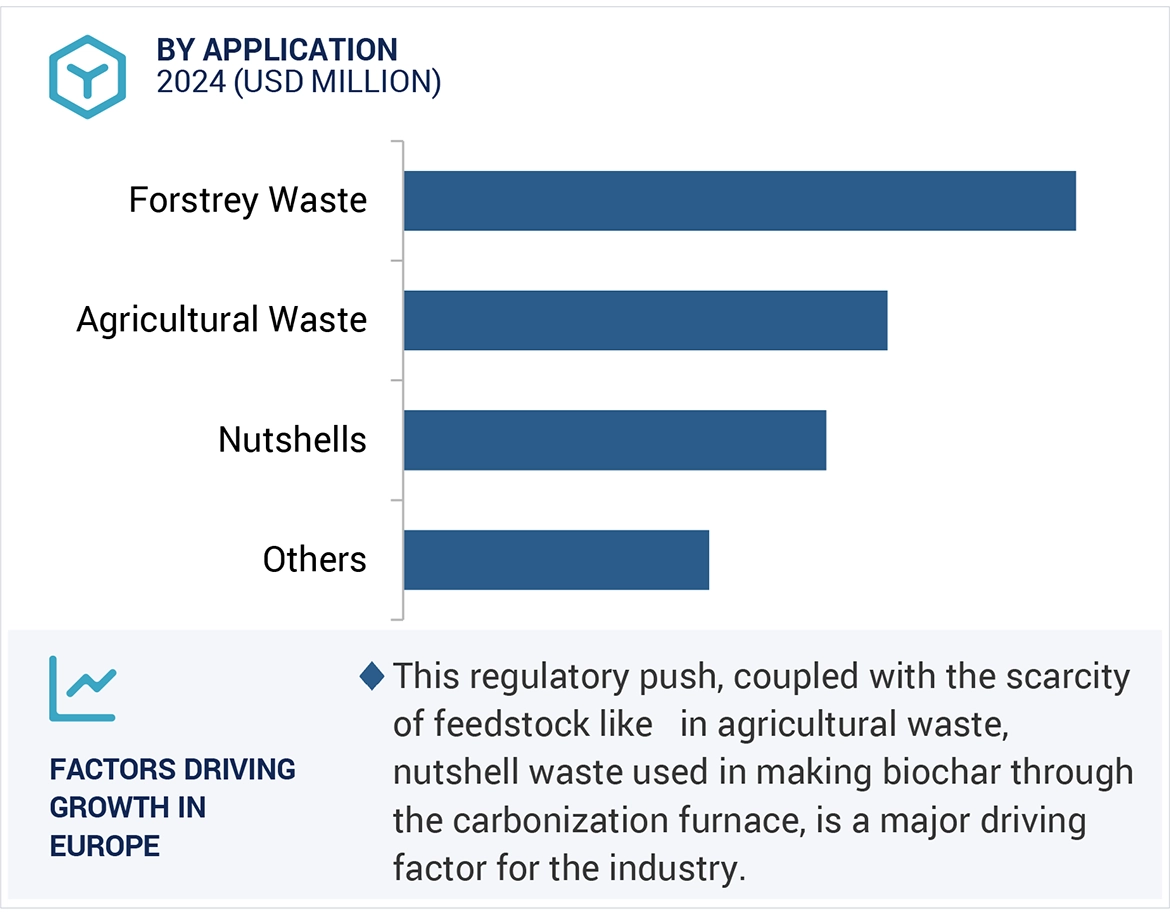
11.4 EUROPE
11.4.1 HISTORICAL TREND AND GROWTH FORECAST
11.4.2 RISK ASSESSMENT
11.4.2.1 Strong emphasis on recycling and waste reduction to stimulate demand
11.4.3 EXECUTIVE SUMMARY
11.4.3.1 Renewable energy projects and waste-to-energy initiatives to create lucrative opportunities
11.4.4 ATTRACTIVE OPPORTUNITIES FOR PLAYERS IN CARBONIZATION FURNACE MARKET
11.4.4.1 Stringent regulations to protect water quality and reduce pollution from agricultural runoff to drive market
11.4.5 CARBONIZATION FURNACE MARKET, BY TYPE
11.4.5.1 Advanced research and innovation in biochar technology to support market growth
11.4.6 MARKET OVERVIEW
11.4.6.1 Adoption of circular economy model to spur demand for carbonization furnaces
11.4.7 MARKET DYNAMICS
11.4.7.1 Decarbonization efforts to contribute to market growth
11.4.8 Increasing focus of farmers on sustainable agriculture and soil improvement
11.5 MIDDLE EAST & AFRICA
11.5.1 Growing emphasis on renewable energy production
11.5.2 RESTRAINTS
11.5.2.1 Saudi Arabia
11.5.2.1.1 Urgent need for effective waste utilization and water conservation technologies to create opportunities
11.5.2.2 UAE
11.5.2.2.1 Increasing investment in sustainable agricultural practices to contribute to market growth
11.5.2.3 Rest of GCC
11.5.3 CHALLENGES
11.5.3.1 Government programs promoting use of biochar to fuel market growth
11.5.4 INDUSTRY TRENDS
11.6 SOUTH AMERICA
11.6.1 TRENDS/DISRUPTIONS IMPACTING CUSTOMER BUSINESS
11.6.1.1 Argentina
11.6.1.1.1 Growing demand for biochar from metallurgy industry to facilitate market growth
11.6.1.2 Brazil
11.6.1.2.1 Significant focus on agroecological practices and bioenergy production to drive market
11.6.1.3 Rest of South America
12 COMPETITIVE LANDSCAPE (Page No. - 176)
12.1 INTRODUCTION
12.2 KEY PLAYER STRATEGIES/RIGHT TO WIN, 2020–2023
12.3 MARKET SHARE ANALYSIS, 2023
12.3.1 COMPLEMENTARY TECHNOLOGIES
12.3.2 Gasification
12.4 REVENUE ANALYSIS, 2020–2023
12.5 BRAND/PRODUCT COMPARISON
12.6 COMPANY EVALUATION MATRIX: KEY PLAYERS, 2023
12.6.1 Bio-oil upgrading
12.6.2 Syngas utilization
12.6.3 PATENT ANALYSIS
12.6.4 METHODOLOGY
12.6.5 TOTAL PATENTS, 2013–2023
12.6.5.1 Company footprint
12.6.5.2 Type footprint
12.6.5.3 Application footprint
12.6.5.4 Feedstock footprint
12.6.5.5 Region footprint
12.7 COMPANY EVALUATION MATRIX: STARTUPS/SMES, 2023
12.7.1 TRADE ANALYSIS
12.7.2 IMPORT SCENARIO (HS CODE 841780)
12.7.3 EXPORT SCENARIO (HS CODE 841780)
12.7.4 KEY CONFERENCES AND EVENTS, 2024–2025
12.7.5 TARIFF AND REGULATORY LANDSCAPE
12.7.5.1 Detailed list of key startups/SMEs
12.7.5.2 Competitive benchmarking of key startups/SMEs
12.8 VALUATION AND FINANCIAL METRICS: CARBONIZATION FURNACE VENDORS
12.9 COMPETITIVE SCENARIO AND TRENDS
12.9.1 THREAT OF NEW ENTRANTS
12.9.2 THREAT OF SUBSTITUTES
13 COMPANY PROFILES (Page No. - 198)
13.1 KEY PLAYERS
13.1.1 INTENSITY OF COMPETITIVE RIVALRY
13.1.1.1 Business overview
13.1.1.2 Products/Solutions/Services offered
13.1.1.3 Recent developments
13.1.1.3.1 Other developments
13.1.1.4 MnM view
13.1.1.4.1 Key strengths
13.1.1.4.2 Strategic choices
13.1.1.4.3 Weaknesses/Competitive threats
13.1.2 THYSSENKRUPP ROTHE ERDE INSTALLED CARBONIZATION PLANT IN LIPPSTADT TO REDUCE OPERATIONAL COST AND C02 EMISSIONS
13.1.2.1 Business overview
13.1.2.2 Products/Solutions/Services offered
13.1.2.3 MnM view
13.1.2.3.1 Key strengths
13.1.2.3.2 Strategic choices
13.1.2.3.3 Weaknesses/Competitive threats
13.1.3 RICE HUSKS
13.1.3.1 Business overview
13.1.3.2 Products/Solutions/Services offered
13.1.3.3 MnM view
13.1.3.3.1 Key strengths
13.1.3.3.2 Strategic choices
13.1.3.3.3 Weaknesses/Competitive threats
13.1.4 NUTSHELLS
13.1.4.1 Business overview
13.1.4.2 Products/Solutions/Services offered
13.1.4.3 MnM view
13.1.4.3.1 Key strengths
13.1.4.3.2 Strategic choices
13.1.4.3.3 Weaknesses/Competitive threats
13.1.5 CARBONIZATION FURNACE MARKET, BY APPLICATION
13.1.5.1 Business overview
13.1.5.2 Products/Solutions/Services offered
13.1.5.3 Recent developments
13.1.5.3.1 Expansions
13.1.5.4 MnM view
13.1.5.4.1 Key strengths
13.1.5.4.2 Strategic choices
13.1.5.4.3 Weaknesses/Competitive threats
13.1.6 Insulating material
13.1.6.1 Business overview
13.1.6.2 Products/Solutions/Services offered
13.1.6.3 MnM view
13.1.6.3.1 Key strengths
13.1.6.3.2 Strategic choices
13.1.6.3.3 Weaknesses/Competitive threats
13.1.7 Additive
13.1.7.1 Business overview
13.1.7.2 Products/Solutions/Services offered
13.1.7.3 MnM view
13.1.7.3.1 Key strengths
13.1.7.3.2 Strategic choices
13.1.7.3.3 Weaknesses/Competitive threats
13.1.8 Carbon black
13.1.8.1 Business overview
13.1.8.2 Products/Solutions/Services offered
13.1.8.3 MnM view
13.1.8.3.1 Key strengths
13.1.8.3.2 Strategic choices
13.1.8.3.3 Weaknesses/Competitive threats
13.1.9 2,000–3,000 KG/H
13.1.9.1 Business overview
13.1.9.2 Products/Services/Solutions offered
13.1.9.3 MnM view
13.1.9.3.1 Key strengths
13.1.9.3.2 Strategic choices
13.1.9.3.3 Weaknesses/Competitive threats
13.1.10 NEED TO PRODUCE LARGE-SCALE BIOCHAR WITH CONSISTENT QUALITY TO FOSTER SEGMENTAL GROWTH
13.1.10.1 Business overview
13.1.10.2 Products/Solutions/Services offered
13.1.10.3 MnM view
13.1.10.3.1 Key strengths
13.1.10.3.2 Strategic choices
13.1.10.3.3 Weaknesses/Competitive threats
13.2 OTHER PLAYERS
13.2.1 ASIA PACIFIC
13.2.2 ASIA PACIFIC: RECESSION IMPACT
13.2.3 CHINA
13.2.4 Climate change mitigation and waste management initiatives to drive market
13.2.5 JAPAN
13.2.6 Focus on developing innovative carbonization solutions to fuel market growth
13.2.7 INDIA
13.2.8 Increasing adoption of sustainable farming techniques to accelerate market growth
13.2.9 SOUTH KOREA
13.2.10 Government subsidies for biomass utilization, soil improvement projects, and sustainable agricultural practices to promote market growth
13.2.11 REST OF ASIA PACIFIC
13.2.12 NORTH AMERICA
13.2.13 NORTH AMERICA: RECESSION IMPACT
13.2.14 US
14 APPENDIX (Page No. - 236)
14.1 DISCUSSION GUIDE
14.2 KNOWLEDGESTORE: MARKETSANDMARKETS’ SUBSCRIPTION PORTAL
14.3 CUSTOMIZATION OPTIONS
14.4 RELATED REPORTS
14.5 AUTHOR DETAILS
LIST OF TABLES (253 TABLES)
TABLE 1 AVERAGE SELLING PRICE OF CARBONIZATION FURNACES, BY REGION, 2020–2029 (USD/UNIT)
TABLE 2 AVERAGE SELLING PRICE TREND OF CARBONIZATION FURNACES, BY TYPE, 2020–2023 (USD/UNIT)
TABLE 3 AVERAGE SELLING PRICE TREND OF CARBONIZATION FURNACES OFFERED BY KEY PLAYERS, BY TYPE (USD/UNIT)
TABLE 4 ROLE OF COMPANIES IN ECOSYSTEM
TABLE 5 TOTAL NUMBER OF PATENTS
TABLE 6 TOP 10 OWNERS OF PATENTS RELATED TO CARBONIZATION FURNACE TECHNOLOGY
TABLE 7 CARBONIZATION FURNACE TECHNOLOGY-RELATED KEY PATENTS
TABLE 8 IMPORTANT CONFERENCES AND EVENTS, 2024–2025
TABLE 9 TARIFF FOR HS CODE 841780-COMPLIANT PRODUCTS, BY COUNTRY (2023)
TABLE 10 NORTH AMERICA: REGULATORY BODIES, GOVERNMENT AGENCIES, AND OTHER ORGANIZATIONS
TABLE 11 EUROPE: REGULATORY BODIES, GOVERNMENT AGENCIES, AND OTHER ORGANIZATIONS
TABLE 12 ASIA PACIFIC: REGULATORY BODIES, GOVERNMENT AGENCIES, AND OTHER ORGANIZATIONS
TABLE 13 MIDDLE EAST & AFRICA: REGULATORY BODIES, GOVERNMENT AGENCIES, AND OTHER ORGANIZATIONS
TABLE 14 SOUTH AMERICA: REGULATORY BODIES, GOVERNMENT AGENCIES, AND OTHER ORGANIZATIONS
TABLE 15 REGULATIONS AND STANDARDS FOR PLAYERS IN CARBONIZATION FURNACE MARKET
TABLE 16 IMPACT OF PORTER’S FIVE FORCES ON CARBONIZATION FURNACE MARKET
TABLE 17 INFLUENCE OF STAKEHOLDERS ON BUYING PROCESS FOR APPLICATIONS
TABLE 18 KEY BUYING CRITERIA FOR APPLICATIONS
TABLE 19 GDP TRENDS AND FORECASTS, BY COUNTRY, 2020–2029 (USD MILLION)
TABLE 20 CARBONIZATION FURNACE MARKET, BY FEEDSTOCK, 2020–2023 (USD MILLION)
TABLE 21 CARBONIZATION FURNACE MARKET, BY FEEDSTOCK, 2024–2029 (USD MILLION)
TABLE 22 CARBONIZATION FURNACE MARKET, BY APPLICATION, 2020–2023 (USD MILLION)
TABLE 23 CARBONIZATION FURNACE MARKET, BY APPLICATION, 2024–2029 (USD MILLION)
TABLE 24 CARBONIZATION FURNACE MARKET, BY APPLICATION, 2020–2023 (UNITS)
TABLE 25 CARBONIZATION FURNACE MARKET, BY APPLICATION, 2024–2029 (UNITS)
TABLE 26 CARBONIZATION FURNACE MARKET, BY CAPACITY, 2020–2023 (USD MILLION)
TABLE 27 CARBONIZATION FURNACE MARKET, BY CAPACITY, 2024–2029 (USD MILLION)
TABLE 28 CARBONIZATION FURNACE MARKET, BY TYPE, 2020–2023 (USD MILLION)
TABLE 29 CARBONIZATION FURNACE MARKET, BY TYPE, 2024–2029 (USD MILLION)
TABLE 30 CARBONIZATION FURNACE MARKET, BY TYPE, 2020–2023 (UNITS)
TABLE 31 CARBONIZATION FURNACE MARKET, BY TYPE, 2024–2029 (UNITS)
TABLE 32 CARBONIZATION FURNACE MARKET, BY REGION, 2020–2023 (USD MILLION)
TABLE 33 CARBONIZATION FURNACE MARKET, BY REGION, 2024–2029 (USD MILLION)
TABLE 34 CARBONIZATION FURNACE MARKET, BY REGION, 2020–2023 (UNITS)
TABLE 35 CARBONIZATION FURNACE MARKET, BY REGION, 2024–2029 (UNITS)
TABLE 36 ASIA PACIFIC: CARBONIZATION FURNACE MARKET, BY COUNTRY, 2020–2023 (USD MILLION)
TABLE 37 ASIA PACIFIC: CARBONIZATION FURNACE MARKET, BY COUNTRY, 2024–2029 (USD MILLION)
TABLE 38 ASIA PACIFIC: CARBONIZATION FURNACE MARKET, BY COUNTRY, 2020–2023 (UNITS)
TABLE 39 ASIA PACIFIC: CARBONIZATION FURNACE MARKET, BY COUNTRY, 2024–2029 (UNITS)
TABLE 40 ASIA PACIFIC: CARBONIZATION FURNACE MARKET, BY TYPE, 2020–2023 (USD MILLION)
TABLE 41 ASIA PACIFIC: CARBONIZATION FURNACE MARKET, BY TYPE, 2024–2029 (USD MILLION)
TABLE 42 ASIA PACIFIC: CARBONIZATION FURNACE MARKET, BY TYPE, 2020–2023 (UNITS)
TABLE 43 ASIA PACIFIC: CARBONIZATION FURNACE MARKET, BY TYPE, 2024–2029 (UNITS)
TABLE 44 ASIA PACIFIC: CARBONIZATION FURNACE MARKET, FEEDSTOCK, 2020–2023 (USD MILLION)
TABLE 45 ASIA PACIFIC: CARBONIZATION FURNACE MARKET, BY FEEDSTOCK, 2024–2029 (USD MILLION)
TABLE 46 ASIA PACIFIC: CARBONIZATION FURNACE MARKET, BY CAPACITY, 2020–2023 (USD MILLION)
TABLE 47 ASIA PACIFIC: CARBONIZATION FURNACE MARKET, BY CAPACITY, 2024–2029 (USD MILLION)
TABLE 48 ASIA PACIFIC: CARBONIZATION FURNACE MARKET, BY APPLICATION, 2020–2023 (USD MILLION)
TABLE 49 ASIA PACIFIC: CARBONIZATION FURNACE MARKET, BY APPLICATION, 2024–2029 (USD MILLION)
TABLE 50 ASIA PACIFIC: CARBONIZATION FURNACE MARKET, BY APPLICATION, 2020–2023 (UNITS)
TABLE 51 ASIA PACIFIC: CARBONIZATION FURNACE MARKET, BY APPLICATION, 2024–2029 (UNITS)
TABLE 52 CHINA: CARBONIZATION FURNACE MARKET, BY APPLICATION, 2020–2023 (USD MILLION)
TABLE 53 CHINA: CARBONIZATION FURNACE MARKET, BY APPLICATION, 2024–2029 (USD MILLION)
TABLE 54 CHINA: CARBONIZATION FURNACE MARKET, BY APPLICATION, 2020–2023 (UNITS)
TABLE 55 CHINA: CARBONIZATION FURNACE MARKET, BY APPLICATION, 2024–2029 (UNITS)
TABLE 56 JAPAN: CARBONIZATION FURNACE MARKET, BY APPLICATION, 2020–2023 (USD MILLION)
TABLE 57 JAPAN: CARBONIZATION FURNACE MARKET, BY APPLICATION, 2024–2029 (USD MILLION)
TABLE 58 JAPAN: CARBONIZATION FURNACE MARKET, BY APPLICATION, 2020–2023 (UNITS)
TABLE 59 JAPAN: CARBONIZATION FURNACE MARKET, BY APPLICATION, 2024–2029 (UNITS)
TABLE 60 INDIA: CARBONIZATION FURNACE MARKET, BY APPLICATION, 2020–2023 (USD MILLION)
TABLE 61 INDIA: CARBONIZATION FURNACE MARKET, BY APPLICATION, 2024–2029 (USD MILLION)
TABLE 62 INDIA: CARBONIZATION FURNACE MARKET, BY APPLICATION, 2020–2023 (UNITS)
TABLE 63 INDIA: CARBONIZATION FURNACE MARKET, BY APPLICATION, 2024–2029 (UNITS)
TABLE 64 SOUTH KOREA: CARBONIZATION FURNACE MARKET, BY APPLICATION, 2020–2023 (USD MILLION)
TABLE 65 SOUTH KOREA: CARBONIZATION FURNACE MARKET, BY APPLICATION, 2024–2029 (USD MILLION)
TABLE 66 SOUTH KOREA: CARBONIZATION FURNACE MARKET, BY APPLICATION, 2020–2023 (UNITS)
TABLE 67 SOUTH KOREA: CARBONIZATION FURNACE MARKET, BY APPLICATION, 2024–2029 (UNITS)
TABLE 68 REST OF ASIA PACIFIC: CARBONIZATION FURNACE MARKET, BY APPLICATION, 2020–2023 (USD MILLION)
TABLE 69 REST OF ASIA PACIFIC: CARBONIZATION FURNACE MARKET, BY APPLICATION, 2024–2029 (USD MILLION)
TABLE 70 REST OF ASIA PACIFIC: CARBONIZATION FURNACE MARKET, BY APPLICATION, 2020–2023 (UNITS)
TABLE 71 REST OF ASIA PACIFIC: CARBONIZATION FURNACE MARKET, BY APPLICATION, 2024–2029 (UNITS)
TABLE 72 NORTH AMERICA: CARBONIZATION FURNACE MARKET, BY COUNTRY, 2020–2023 (USD MILLION)
TABLE 73 NORTH AMERICA: CARBONIZATION FURNACE MARKET, BY COUNTRY, 2024–2029 (USD MILLION)
TABLE 74 NORTH AMERICA: CARBONIZATION FURNACE MARKET, BY COUNTRY, 2020–2023 (UNITS)
TABLE 75 NORTH AMERICA: CARBONIZATION FURNACE MARKET, BY COUNTRY, 2024–2029 (UNITS)
TABLE 76 NORTH AMERICA: CARBONIZATION FURNACE MARKET, BY TYPE, 2020–2023 (USD MILLION)
TABLE 77 NORTH AMERICA: CARBONIZATION FURNACE MARKET, BY TYPE, 2024–2029 (USD MILLION)
TABLE 78 NORTH AMERICA: CARBONIZATION FURNACE MARKET, BY TYPE, 2020–2023 (UNITS)
TABLE 79 NORTH AMERICA: CARBONIZATION FURNACE MARKET, BY TYPE, 2024–2029 (UNITS)
TABLE 80 NORTH AMERICA: CARBONIZATION FURNACE MARKET, BY FEEDSTOCK, 2020–2023 (USD MILLION)
TABLE 81 NORTH AMERICA: CARBONIZATION FURNACE MARKET, BY FEEDSTOCK, 2024–2029 (USD MILLION)
TABLE 82 NORTH AMERICA: CARBONIZATION FURNACE MARKET, BY CAPACITY, 2020–2023 (USD MILLION)
TABLE 83 NORTH AMERICA: CARBONIZATION FURNACE MARKET, BY CAPACITY, 2024–2029 (USD MILLION)
TABLE 84 NORTH AMERICA: CARBONIZATION FURNACE MARKET, BY APPLICATION, 2020–2023 (USD MILLION)
TABLE 85 NORTH AMERICA: CARBONIZATION FURNACE MARKET, BY APPLICATION, 2024–2029 (USD MILLION)
TABLE 86 NORTH AMERICA: CARBONIZATION FURNACE MARKET, BY APPLICATION, 2020–2023 (UNITS)
TABLE 87 NORTH AMERICA: CARBONIZATION FURNACE MARKET, BY APPLICATION, 2024–2029 (UNITS)
TABLE 88 US: CARBONIZATION FURNACE MARKET, BY APPLICATION, 2020–2023 (USD MILLION)
TABLE 89 US: CARBONIZATION FURNACE MARKET, BY APPLICATION, 2024–2029 (USD MILLION)
TABLE 90 US: CARBONIZATION FURNACE MARKET, BY APPLICATION, 2020–2023 (UNITS)
TABLE 91 US: CARBONIZATION FURNACE MARKET, BY APPLICATION, 2024–2029 (UNITS)
TABLE 92 CANADA: CARBONIZATION FURNACE MARKET, BY APPLICATION, 2020–2023 (USD MILLION)
TABLE 93 CANADA: CARBONIZATION FURNACE MARKET, BY APPLICATION, 2024–2029 (USD MILLION)
TABLE 94 CANADA: CARBONIZATION FURNACE MARKET, BY APPLICATION, 2020–2023 (UNITS)
TABLE 95 CANADA: CARBONIZATION FURNACE MARKET, BY APPLICATION, 2024–2029 (UNITS)
TABLE 96 MEXICO: CARBONIZATION FURNACE MARKET, BY APPLICATION, 2020–2023 (USD MILLION)
TABLE 97 MEXICO: CARBONIZATION FURNACE MARKET, BY APPLICATION, 2024–2029 (USD MILLION)
TABLE 98 MEXICO: CARBONIZATION FURNACE MARKET, BY APPLICATION, 2020–2023 (UNITS)
TABLE 99 MEXICO: CARBONIZATION FURNACE MARKET, BY APPLICATION, 2024–2029 (UNITS)
TABLE 100 EUROPE: CARBONIZATION FURNACE MARKET, BY COUNTRY, 2020–2023 (USD MILLION)
TABLE 101 EUROPE: CARBONIZATION FURNACE MARKET, BY COUNTRY, 2024–2029 (USD MILLION)
TABLE 102 EUROPE: CARBONIZATION FURNACE MARKET, BY COUNTRY, 2020–2023 (UNITS)
TABLE 103 EUROPE: CARBONIZATION FURNACE MARKET, BY COUNTRY, 2024–2029 (UNITS)
TABLE 104 EUROPE: CARBONIZATION FURNACE MARKET, BY TYPE, 2020–2023 (USD MILLION)
TABLE 105 EUROPE: CARBONIZATION FURNACE MARKET, BY TYPE, 2024–2029 (USD MILLION)
TABLE 106 EUROPE: CARBONIZATION FURNACE MARKET, BY TYPE, 2020–2023 (UNITS)
TABLE 107 EUROPE: CARBONIZATION FURNACE MARKET, BY TYPE, 2024–2029 (UNITS)
TABLE 108 EUROPE: CARBONIZATION FURNACE MARKET, BY FEEDSTOCK, 2020–2023 (USD MILLION)
TABLE 109 EUROPE: CARBONIZATION FURNACE MARKET, BY FEEDSTOCK, 2024–2029 (USD MILLION)
TABLE 110 EUROPE: CARBONIZATION FURNACE MARKET, BY CAPACITY, 2020–2023 (USD MILLION)
TABLE 111 EUROPE: CARBONIZATION FURNACE MARKET, BY CAPACITY, 2024–2029 (USD MILLION)
TABLE 112 EUROPE: CARBONIZATION FURNACE MARKET, BY APPLICATION, 2020–2023 (USD MILLION)
TABLE 113 EUROPE: CARBONIZATION FURNACE MARKET, BY APPLICATION, 2024–2029 (USD MILLION)
TABLE 114 EUROPE: CARBONIZATION FURNACE MARKET, BY APPLICATION, 2020–2023 (UNITS)
TABLE 115 EUROPE: CARBONIZATION FURNACE MARKET, BY APPLICATION, 2024–2029 (UNITS)
TABLE 116 GERMANY: CARBONIZATION FURNACE MARKET, BY APPLICATION, 2020–2023 (USD MILLION)
TABLE 117 GERMANY: CARBONIZATION FURNACE MARKET, BY APPLICATION, 2024–2029 (USD MILLION)
TABLE 118 GERMANY: CARBONIZATION FURNACE MARKET, BY APPLICATION, 2020–2023 (UNITS)
TABLE 119 GERMANY: CARBONIZATION FURNACE MARKET, BY APPLICATION, 2024–2029 (UNITS)
TABLE 120 ITALY: CARBONIZATION FURNACE MARKET, BY APPLICATION, 2020–2023 (USD MILLION)
TABLE 121 ITALY: CARBONIZATION FURNACE MARKET, BY APPLICATION, 2024–2029 (USD MILLION)
TABLE 122 ITALY: CARBONIZATION FURNACE MARKET, BY APPLICATION, 2020–2023 (UNITS)
TABLE 123 ITALY: CARBONIZATION FURNACE MARKET, BY APPLICATION, 2024–2029 (UNITS)
TABLE 124 FRANCE: CARBONIZATION FURNACE MARKET, BY APPLICATION, 2020–2023 (USD MILLION)
TABLE 125 FRANCE: CARBONIZATION FURNACE MARKET, BY APPLICATION, 2024–2029 (USD MILLION)
TABLE 126 FRANCE: CARBONIZATION FURNACE MARKET, BY APPLICATION, 2020–2023 (UNITS)
TABLE 127 FRANCE: CARBONIZATION FURNACE MARKET, BY APPLICATION, 2024–2029 (UNITS)
TABLE 128 UK: CARBONIZATION FURNACE MARKET, BY APPLICATION, 2020–2023 (USD MILLION)
TABLE 129 UK: CARBONIZATION FURNACE MARKET, BY APPLICATION, 2024–2029 (USD MILLION)
TABLE 130 UK: CARBONIZATION FURNACE MARKET, BY APPLICATION, 2020–2023 (UNITS)
TABLE 131 UK: CARBONIZATION FURNACE MARKET, BY APPLICATION, 2024–2029 (UNITS)
TABLE 132 SPAIN: CARBONIZATION FURNACE MARKET, BY APPLICATION, 2020–2023 (USD MILLION)
TABLE 133 SPAIN: CARBONIZATION FURNACE MARKET, BY APPLICATION, 2024–2029 (USD MILLION)
TABLE 134 SPAIN: CARBONIZATION FURNACE MARKET, BY APPLICATION, 2020–2023 (UNITS)
TABLE 135 SPAIN: CARBONIZATION FURNACE MARKET, BY APPLICATION, 2024–2029 (UNITS)
TABLE 136 RUSSIA: CARBONIZATION FURNACE MARKET, BY APPLICATION, 2020–2023 (USD MILLION)
TABLE 137 RUSSIA: CARBONIZATION FURNACE MARKET, BY APPLICATION, 2024–2029 (USD MILLION)
TABLE 138 RUSSIA: CARBONIZATION FURNACE MARKET, BY APPLICATION, 2020–2023 (UNITS)
TABLE 139 RUSSIA: CARBONIZATION FURNACE MARKET, BY APPLICATION, 2024–2029 (UNITS)
TABLE 140 REST OF EUROPE: CARBONIZATION FURNACE MARKET, BY APPLICATION, 2020–2023 (USD MILLION)
TABLE 141 REST OF EUROPE: CARBONIZATION FURNACE MARKET, BY APPLICATION, 2024–2029 (USD MILLION)
TABLE 142 REST OF EUROPE: CARBONIZATION FURNACE MARKET, BY APPLICATION, 2020–2023 (UNITS)
TABLE 143 REST OF EUROPE: CARBONIZATION FURNACE MARKET, BY APPLICATION, 2024–2029 (UNITS)
TABLE 144 MIDDLE EAST & AFRICA: CARBONIZATION FURNACE MARKET, BY COUNTRY, 2020–2023 (USD MILLION)
TABLE 145 MIDDLE EAST & AFRICA: CARBONIZATION FURNACE MARKET, BY COUNTRY, 2024–2029 (USD MILLION)
TABLE 146 MIDDLE EAST & AFRICA: CARBONIZATION FURNACE MARKET, BY COUNTRY, 2020–2023 (UNITS)
TABLE 147 MIDDLE EAST & AFRICA: CARBONIZATION FURNACE MARKET, BY COUNTRY, 2024–2029 (UNITS)
TABLE 148 MIDDLE EAST & AFRICA: CARBONIZATION FURNACE MARKET, BY TYPE, 2020–2023 (USD MILLION)
TABLE 149 MIDDLE EAST & AFRICA: CARBONIZATION FURNACE MARKET, BY TYPE, 2024–2029 (USD MILLION)
TABLE 150 MIDDLE EAST & AFRICA: CARBONIZATION FURNACE MARKET, BY TYPE, 2020–2023 (UNITS)
TABLE 151 MIDDLE EAST & AFRICA: CARBONIZATION FURNACE MARKET, BY TYPE, 2024–2029 (UNITS)
TABLE 152 MIDDLE EAST & AFRICA: CARBONIZATION FURNACE MARKET, BY FEEDSTOCK, 2020–2023 (USD MILLION)
TABLE 153 MIDDLE EAST & AFRICA: CARBONIZATION FURNACE MARKET, BY FEEDSTOCK, 2024–2029 (USD MILLION)
TABLE 154 MIDDLE EAST & AFRICA: CARBONIZATION FURNACE MARKET, BY CAPACITY, 2020–2023 (USD MILLION)
TABLE 155 MIDDLE EAST & AFRICA: CARBONIZATION FURNACE MARKET, BY CAPACITY, 2024–2029 (USD MILLION)
TABLE 156 MIDDLE EAST & AFRICA: CARBONIZATION FURNACE MARKET, BY APPLICATION, 2020–2023 (USD MILLION)
TABLE 157 MIDDLE EAST & AFRICA: CARBONIZATION FURNACE MARKET, BY APPLICATION, 2024–2029 (USD MILLION)
TABLE 158 MIDDLE EAST & AFRICA: CARBONIZATION FURNACE MARKET, BY APPLICATION, 2020–2023 (UNITS)
TABLE 159 MIDDLE EAST & AFRICA: CARBONIZATION FURNACE MARKET, BY APPLICATION, 2024–2029 (UNITS)
TABLE 160 SAUDI ARABIA: CARBONIZATION FURNACE MARKET, BY APPLICATION, 2020–2023 (USD MILLION)
TABLE 161 SAUDI ARABIA: CARBONIZATION FURNACE MARKET, BY APPLICATION, 2024–2029 (USD MILLION)
TABLE 162 SAUDI ARABIA: CARBONIZATION FURNACE MARKET, BY APPLICATION, 2020–2023 (UNITS)
TABLE 163 SAUDI ARABIA: CARBONIZATION FURNACE MARKET, BY APPLICATION, 2024–2029 (UNITS)
TABLE 164 UAE: CARBONIZATION FURNACE MARKET, BY APPLICATION, 2020–2023 (USD MILLION)
TABLE 165 UAE: CARBONIZATION FURNACE MARKET, BY APPLICATION, 2024–2029 (USD MILLION)
TABLE 166 UAE: CARBONIZATION FURNACE MARKET, BY APPLICATION, 2020–2023 (UNITS)
TABLE 167 UAE: CARBONIZATION FURNACE MARKET, BY APPLICATION, 2024–2029 (UNITS)
TABLE 168 REST OF GCC: CARBONIZATION FURNACE MARKET, BY APPLICATION, 2020–2023 (USD MILLION)
TABLE 169 REST OF GCC: CARBONIZATION FURNACE MARKET, BY APPLICATION, 2024–2029 (USD MILLION)
TABLE 170 REST OF GCC: CARBONIZATION FURNACE MARKET, BY APPLICATION, 2020–2023 (UNITS)
TABLE 171 REST OF GCC: CARBONIZATION FURNACE MARKET, BY APPLICATION, 2024–2029 (UNITS)
TABLE 172 SOUTH AFRICA: CARBONIZATION FURNACE MARKET, BY APPLICATION, 2020–2023 (USD MILLION)
TABLE 173 SOUTH AFRICA: CARBONIZATION FURNACE MARKET, BY APPLICATION, 2024–2029 (USD MILLION)
TABLE 174 SOUTH AFRICA: CARBONIZATION FURNACE MARKET, BY APPLICATION, 2020–2023 (UNITS)
TABLE 175 SOUTH AFRICA: CARBONIZATION FURNACE MARKET, BY APPLICATION, 2024–2029 (UNITS)
TABLE 176 REST OF MIDDLE EAST & AFRICA: CARBONIZATION FURNACE MARKET, BY APPLICATION, 2020–2023 (USD MILLION)
TABLE 177 REST OF MIDDLE EAST & AFRICA: CARBONIZATION FURNACE MARKET, BY APPLICATION, 2024–2029 (USD MILLION)
TABLE 178 REST OF MIDDLE EAST & AFRICA: CARBONIZATION FURNACE MARKET, BY APPLICATION, 2020–2023 (UNITS)
TABLE 179 REST OF MIDDLE EAST & AFRICA: CARBONIZATION FURNACE MARKET, BY APPLICATION, 2024–2029 (UNITS)
TABLE 180 SOUTH AMERICA: CARBONIZATION FURNACE MARKET, BY COUNTRY, 2020–2023 (USD MILLION)
TABLE 181 SOUTH AMERICA: CARBONIZATION FURNACE MARKET, BY COUNTRY, 2024–2029 (USD MILLION)
TABLE 182 SOUTH AMERICA: CARBONIZATION FURNACE MARKET, BY COUNTRY, 2020–2023 (UNITS)
TABLE 183 SOUTH AMERICA: CARBONIZATION FURNACE MARKET, BY COUNTRY, 2024–2029 (UNITS)
TABLE 184 SOUTH AMERICA: CARBONIZATION FURNACE MARKET, BY TYPE, 2020–2023 (USD MILLION)
TABLE 185 SOUTH AMERICA: CARBONIZATION FURNACE MARKET, BY TYPE, 2024–2029 (USD MILLION)
TABLE 186 SOUTH AMERICA: CARBONIZATION FURNACE MARKET, BY TYPE, 2020–2023 (UNITS)
TABLE 187 SOUTH AMERICA: CARBONIZATION FURNACE MARKET, BY TYPE, 2024–2029 (UNITS)
TABLE 188 SOUTH AMERICA: CARBONIZATION FURNACE MARKET, BY FEEDSTOCK, 2020–2023 (USD MILLION)
TABLE 189 SOUTH AMERICA: CARBONIZATION FURNACE MARKET, BY FEEDSTOCK, 2024–2029 (USD MILLION)
TABLE 190 SOUTH AMERICA: CARBONIZATION FURNACE MARKET, BY CAPACITY, 2020–2023 (USD MILLION)
TABLE 191 SOUTH AMERICA: CARBONIZATION FURNACE MARKET, BY CAPACITY, 2024–2029 (USD MILLION)
TABLE 192 SOUTH AMERICA: CARBONIZATION FURNACE MARKET, BY APPLICATION, 2020–2023 (USD MILLION)
TABLE 193 SOUTH AMERICA: CARBONIZATION FURNACE MARKET, BY APPLICATION, 2024–2029 (USD MILLION)
TABLE 194 SOUTH AMERICA: CARBONIZATION FURNACE MARKET, BY APPLICATION, 2020–2023 (UNITS)
TABLE 195 SOUTH AMERICA: CARBONIZATION FURNACE MARKET, BY APPLICATION, 2024–2029 (UNITS)
TABLE 196 ARGENTINA: CARBONIZATION FURNACE MARKET, BY APPLICATION, 2020–2023 (USD MILLION)
TABLE 197 ARGENTINA: CARBONIZATION FURNACE MARKET, BY APPLICATION, 2024–2029 (USD MILLION)
TABLE 198 ARGENTINA: CARBONIZATION FURNACE MARKET, BY APPLICATION, 2020–2023 (UNITS)
TABLE 199 ARGENTINA: CARBONIZATION FURNACE MARKET, BY APPLICATION, 2024–2029 (UNITS)
TABLE 200 BRAZIL: CARBONIZATION FURNACE MARKET, BY APPLICATION, 2020–2023 (USD MILLION)
TABLE 201 BRAZIL: CARBONIZATION FURNACE MARKET, BY APPLICATION, 2024–2029 (USD MILLION)
TABLE 202 BRAZIL: CARBONIZATION FURNACE MARKET, BY APPLICATION, 2020–2023 (UNITS)
TABLE 203 BRAZIL: CARBONIZATION FURNACE MARKET, BY APPLICATION, 2024–2029 (UNITS)
TABLE 204 REST OF SOUTH AMERICA: CARBONIZATION FURNACE MARKET, BY APPLICATION, 2020–2023 (USD MILLION)
TABLE 205 REST OF SOUTH AMERICA: CARBONIZATION FURNACE MARKET, BY APPLICATION, 2024–2029 (USD MILLION)
TABLE 206 REST OF SOUTH AMERICA: CARBONIZATION FURNACE MARKET, BY APPLICATION, 2020–2023 (UNITS)
TABLE 207 REST OF SOUTH AMERICA: CARBONIZATION FURNACE MARKET, BY APPLICATION, 2024–2029 (UNITS)
TABLE 208 OVERVIEW OF STRATEGIES ADOPTED BY KEY CARBONIZATION FURNACE MANUFACTURERS
TABLE 209 CARBONIZATION FURNACE MARKET: DEGREE OF COMPETITION, 2023
TABLE 210 CARBONIZATION FURNACE MARKET: TYPE FOOTPRINT
TABLE 211 CARBONIZATION FURNACE MARKET: APPLICATION FOOTPRINT
TABLE 212 CARBONIZATION FURNACE MARKET: FEEDSTOCK FOOTPRINT
TABLE 213 CARBONIZATION FURNACE MARKET: REGION FOOTPRINT
TABLE 214 CARBONIZATION FURNACE MARKET: LIST OF KEY STARTUPS/SMES
TABLE 215 CARBONIZATION FURNACE MARKET: COMPETITIVE BENCHMARKING OF KEY STARTUPS/SMES
TABLE 216 CARBONIZATION FURNACE MARKET: EXPANSIONS, JANUARY 2020– FEBRUARY 2024
TABLE 217 CARBONIZATION FURNACE MARKET: OTHERS, JANUARY 2020–FEBRUARY 2024
TABLE 218 GREENPOWER LTD: COMPANY OVERVIEW
TABLE 219 GREENPOWER LTD: PRODUCT/SOLUTION/SERVICE OFFERINGS
TABLE 220 GREENPOWER LTD: OTHER DEVELOPMENTS
TABLE 221 BESTON GROUP CO., LTD.: COMPANY OVERVIEW
TABLE 222 BESTON GROUP CO., LTD.: PRODUCT/SOLUTION/SERVICE OFFERINGS
TABLE 223 ZHENGZHOU BELONG MACHINERY CO., LTD: COMPANY OVERVIEW
TABLE 224 ZHENGZHOU BELONG MACHINERY CO., LTD: PRODUCT/SOLUTION/SERVICE OFFERINGS
TABLE 225 TIANJIN MIKIM TECHNIQUE CO., LTD.: COMPANY OVERVIEW
TABLE 226 TIANJIN MIKIM TECHNIQUE CO., LTD.: PRODUCT OFFERINGS
TABLE 227 ZHENGZHOU SHULIY MACHINERY CO. LTD: COMPANY OVERVIEW
TABLE 228 ZHENGZHOU SHULIY MACHINERY CO. LTD: PRODUCT/SOLUTION/SERVICE OFFERINGS
TABLE 229 ZHENGZHOU SHULIY MACHINERY CO. LTD: EXPANSIONS
TABLE 230 HENAN CHENGJINLAI MACHINERY CO., LTD.: COMPANY OVERVIEW
TABLE 231 HENAN CHENGJINLAI MACHINERY CO., LTD.: PRODUCT/SOLUTION/SERVICE OFFERINGS
TABLE 232 GONGYI XIAOYI MINGYANG MACHINERY PLANT: COMPANY OVERVIEW
TABLE 233 GONGYI XIAOYI MINGYANG MACHINERY PLANT: PRODUCT/SOLUTION/SERVICE OFFERINGS
TABLE 234 GONGYI SANJIN CHARCOAL MACHINERY FACTORY: COMPANY OVERVIEW
TABLE 235 GONGYI SANJIN CHARCOAL MACHINERY FACTORY: PRODUCT/SOLUTION/SERVICE OFFERINGS
TABLE 236 ZHENGZHOU JIUTIAN MACHINERY EQUIPMENT CO., LTD.: COMPANY OVERVIEW
TABLE 237 ZHENGZHOU JIUTIAN MACHINERY EQUIPMENT CO., LTD.: PRODUCT/SERVICE/SOLUTION OFFERINGS
TABLE 238 HENAN SUNRISE BIOCHAR MACHINE CO., LTD: COMPANY OVERVIEW
TABLE 239 HENAN SUNRISE BIOCHAR MACHINE CO., LTD: PRODUCT/SOLUTION/SERVICE OFFERINGS
TABLE 240 ZHENGZHOU FUSMAR MACHINERY CO., LTD: COMPANY OVERVIEW
TABLE 241 ZHENGZHOU DINGLI NEW ENERGY TECHNOLOGY CO., LTD: COMPANY OVERVIEW
TABLE 242 OLTEN MACHINERY: COMPANY OVERVIEW
TABLE 243 AGICO CEMENT MACHINERY CO., LTD.: COMPANY OVERVIEW
TABLE 244 HUNAN JINGTAN AUTOMATION EQUIPMENT CO., LTD.: COMPANY OVERVIEW
TABLE 245 ZHENGZHOU E.P MACHINERY CO., LTD.: COMPANY OVERVIEW
TABLE 246 ABC MACHINERY: COMPANY OVERVIEW
TABLE 247 KINGTIGER (SHANGHAI) ENVIRONMENTAL TECHNOLOGY CO., LTD.: COMPANY OVERVIEW
TABLE 248 CXINDUCTION: COMPANY OVERVIEW
TABLE 249 ZHENGZHOU LEABON MACHINERY EQUIPMENT CO., LTD.: COMPANY OVERVIEW
TABLE 250 ZHENGZHOU HENGJU MACHINERY EQUIPMENT CO., LTD: COMPANY OVERVIEW
TABLE 251 HENAN LANTIAN MACHINERY MANUFACTURING CO., LTD.: COMPANY OVERVIEW
TABLE 252 GOMINE INDUSTRIAL TECHNOLOGY CO., LTD: COMPANY OVERVIEW
TABLE 253 DOING HOLDINGS CO., LTD: COMPANY OVERVIEW
LIST OF FIGURES (49 FIGURES)
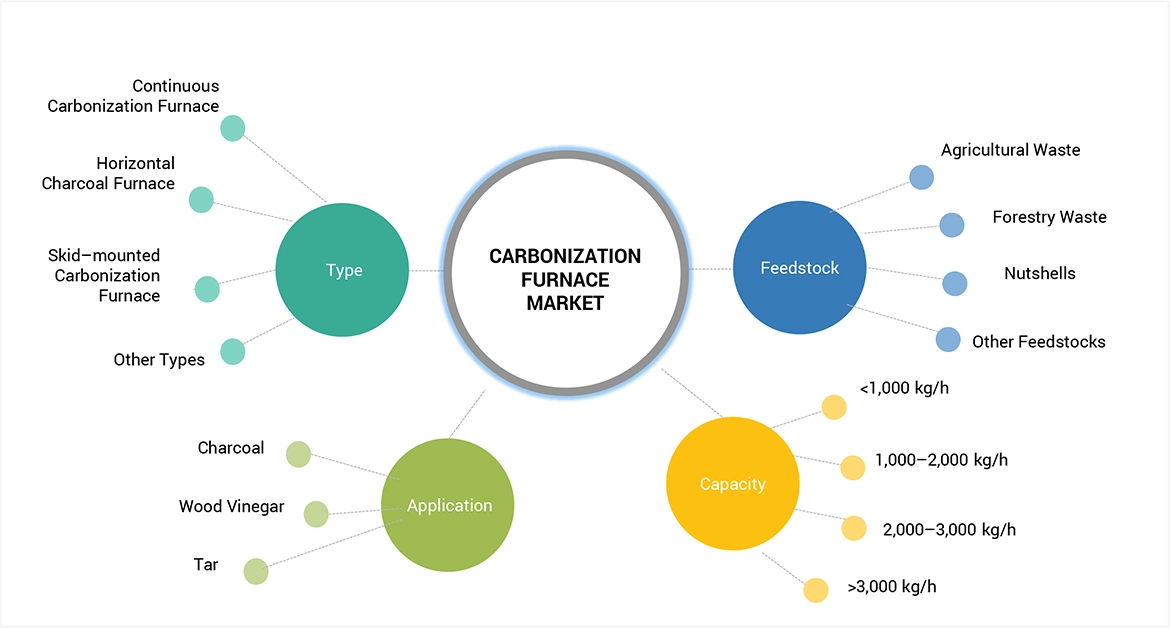
FIGURE 1 CARBONIZATION FURNACE MARKET SEGMENTATION
FIGURE 2 CARBONIZATION FURNACE MARKET: RESEARCH DESIGN
FIGURE 3 MARKET SIZE ESTIMATION METHODOLOGY: SUPPLY-SIDE APPROACH
FIGURE 4 MARKET SIZE ESTIMATION METHODOLOGY: DEMAND-SIDE APPROACH
FIGURE 5 MARKET SIZE ESTIMATION METHODOLOGY: SUPPLY-SIDE ANALYSIS
FIGURE 6 MARKET SIZE ESTIMATION METHODOLOGY: BOTTOM-UP APPROACH
FIGURE 7 MARKET SIZE ESTIMATION METHODOLOGY: TOP-DOWN APPROACH
FIGURE 8 CARBONIZATION FURNACE MARKET: DATA TRIANGULATION
FIGURE 9 COUNTINOUS CARBONIZATION FURNACE SEGMENT TO LEAD MARKET, BY TYPE, FROM 2024 TO 2029
FIGURE 10 CHARCOAL SEGMENT TO COMMAND CARBONIZATION FURNACE MARKET, BY APPLICATION, THROUGHOUT FORECAST PERIOD
FIGURE 11 FORESTRY WASTE SEGMENT TO DOMINATE MARKET, BY FEEDSTOCK, BETWEEN 2024 AND 2029
FIGURE 12 <1,000 KG/H SEGMENT TO LEAD CARBONIZATION FURNACE MARKET, BY CAPACITY, THROUGHOUT FORECAST PERIOD
FIGURE 13 NORTH AMERICA ACCOUNTED FOR LARGEST SHARE OF CARBONIZATION FURNACE MARKET IN 2023
FIGURE 14 GROWING USE OF CARBONIZATION FURNACES TO PRODUCE CHARCOAL AND TAR TO DRIVE MARKET
FIGURE 15 CHARCOAL TO BE FASTEST-GROWING SEGMENT IN CARBONIZATION FURNACE MARKET DURING FORECAST PERIOD
FIGURE 16 CONTINUOUS CARBONIZATION FURNACE TO BE FASTEST-GROWING SEGMENT DURING FORECAST PERIOD
FIGURE 17 MEXICO TO BE FASTEST-GROWING MARKET GLOBALLY DURING FORECAST PERIOD
FIGURE 18 DRIVERS, RESTRAINTS, OPPORTUNITIES, AND CHALLENGES: CARBONIZATION FURNACE MARKET
FIGURE 19 TRENDS INFLUENCING CUSTOMER BUSINESS
FIGURE 20 CARBONIZATION FURNACE MARKET: SUPPLY CHAIN ANALYSIS
FIGURE 21 CARBONIZATION FURNACE MARKET: AVERAGE SELLING PRICE TREND, BY REGION, 2020–2029 (USD/UNIT)
FIGURE 22 AVERAGE SELLING PRICE TREND OF CARBONIZATION FURNACE TYPES PROVIDED BY KEY PLAYERS
FIGURE 23 CARBONIZATION FURNACE MARKET: ECOSYSTEM ANALYSIS
FIGURE 24 PATENTS GRANTED OVER LAST 10 YEARS
FIGURE 25 PATENT ANALYSIS, BY LEGAL STATUS
FIGURE 26 REGIONAL ANALYSIS OF PATENTS GRANTED FOR CARBONIZATION FURNACE TECHNOLOGY, 2023
FIGURE 27 TOP 10 COMPANIES WITH SUBSTANTIAL NUMBER OF PATENTS, 2013–2023
FIGURE 28 IMPORT DATA FOR HS CODE 841780-COMPLIANT PRODUCTS, BY COUNTRY, 2020–2023 (USD THOUSAND)
FIGURE 29 EXPORT DATA FOR HS CODE 841780-COMPLIANT PRODUCTS, BY COUNTRY, 2020–2023 (USD THOUSAND)
FIGURE 30 PORTER’S FIVE FORCES ANALYSIS: CARBONIZATION FURNACE MARKET
FIGURE 31 INFLUENCE OF STAKEHOLDERS ON BUYING PROCESS FOR APPLICATIONS
FIGURE 32 KEY BUYING CRITERIA FOR APPLICATIONS
FIGURE 33 FORESTRY WASTE SEGMENT TO COMMAND CARBONIZATION FURNACE MARKET THROUGHOUT FORECAST PERIOD
FIGURE 34 CHARCOAL TO LEAD CARBONIZATION FURNACE MARKET DURING FORECAST PERIOD
FIGURE 35 <1,000 KG/H SEGMENT TO DOMINATE CARBONIZATION FURNACE MARKET THROUGHOUT FORECAST PERIOD
FIGURE 36 CONTINUOUS CARBONIZATION FURNACE SEGMENT TO LEAD MARKET THROUGHOUT FORECAST PERIOD
FIGURE 37 ASIA PACIFIC TO BE FASTEST-GROWING MARKET DURING FORECAST PERIOD
FIGURE 38 ASIA PACIFIC: CARBONIZATION FURNACE MARKET SNAPSHOT
FIGURE 39 NORTH AMERICA: CARBONIZATION FURNACE MARKET SNAPSHOT
FIGURE 40 EUROPE: CARBONIZATION FURNACE MARKET SNAPSHOT
FIGURE 41 RANKING OF TOP 5 PLAYERS IN CARBONIZATION FURNACE MARKET, 2023
FIGURE 42 CARBONIZATION FURNACE MARKET SHARE ANALYSIS OF KEY PLAYERS, 2023
FIGURE 43 REVENUE ANALYSIS OF KEY PLAYERS, 2020–2024
FIGURE 44 BRAND/PRODUCT COMPARATIVE ANALYSIS
FIGURE 45 CARBONIZATION FURNACE MARKET: COMPANY EVALUATION MATRIX (KEY PLAYERS), 2023
FIGURE 46 CARBONIZATION FURNACE MARKET: COMPANY FOOTPRINT
FIGURE 47 CARBONIZATION FURNACE MARKET: COMPANY EVALUATION MATRIX (STARTUPS/SMES), 2023
FIGURE 48 EV/EBITDA OF KEY VENDORS
FIGURE 49 YEAR-TO-DATE (YTD) PRICE TOTAL RETURN AND 5-YEAR STOCK BETA OF KEY VENDORS


Growth opportunities and latent adjacency in Carbonization Furnace Market