Body Contouring Devices Market: Growth, Size, Share, and Trends

Report Code MD 9193
Published in Oct, 2024, By MarketsandMarkets™
Download PDF

Choose License Type

Buy Report Now Inquire Before Buying

Body Contouring Devices Market by Product (Non-invasive, Invasive), Application (Fat Reduction, Skin Tightening, Cellulite Treatment, Body Toning and Sculpting), Age Group (Below 35 Years, Between 35 to 50 Years, Above 50 Years) - Global Forecast to 2029

Overview

The global body contouring devices market growth forecasted to transform from USD 1.74 Billion in 2024 to USD 3.00 Billion by 2029, driven by a CAGR of 11.4%. The rising adoption of body contouring devices is a direct response to the growing volume of these procedures. These techniques are associated with fewer complications and shorter recovery times, making them immensely popular among patients seeking these treatments. Patients' choice of body contouring has shifted from invasive surgical procedures like liposuction to radiofrequency and fat freezing, which pose much lower risks to the body and provide quicker results. Procedures such as radiofrequency, fat freezing, HIFU, and LLLT are expected to drive market growth with newer technologies and increased availability of treatments like skin tightening and body sculpting.

Similarly, growth opportunities in emerging countries across the Asia Pacific are expected to boost the market due to the increasing medical tourism in countries like Thailand, Vietnam, and India. These countries offer body contouring procedures at very lucrative rates, which makes them a hub for these treatments. These countries also have less stringent regulatory guidelines, making it easier for companies to enter the market.

Attractive Opportunities in the Body Contouring Devices Market

Asia Pacific

The Asia Pacific market is expected to register the highest CAGR during the forecast period, primarily due to the increasing number of aesthetic procedures and rising adoption of body contouring devices.

Growth in this market is driven by the increased demand for advanced body enhancement procedures.

Improved regulatory scenarios, the growth potential in developing countries, and the rising number of specialty clinics are expected to provide growth opportunities.

Emerging markets are expected to offer lucrative growth opportunities for players in the body contouring devices market.

Product launches, approvals, acquisitions, and mergers were the most widely adopted growth strategies by market players.

Global Body Contouring Devices Market Dynamics

Driver: Growing adoption of minimally invasive and non-invasive aesthetic procedures

There is an increase in the adoption of minimally invasive procedures or non-invasive procedures for body contouring. These procedures mainly involve applications like fat reduction and skin tightening, which involve technologies such as fat freezing and radiofrequency. These devices are more actively used due to the lower risk to the body, increased accuracy, and faster results. Using non-invasive devices adds to the added benefit of cost saving as there is no hospitalization or major surgery that requires prolonged care, significantly reducing the treatment cost. Furthermore, these procedures are the first choice of treatment for patients as well as surgeons. The number of procedures with non-invasive devices has increased over the years, which has led to an overall increase in the body contouring devices market.

Restraint: High cost of treatment and lack of reimbursement

The cost of aesthetic procedures, including body contouring, is high, especially for procedures with advanced technology. The cost varies by region, and in places like North America, it is much higher compared to regions like the Asia Pacific. This explains the higher growth rate in the Asia Pacific. Since these procedures are considered non-essential or aesthetic, they are not well reimbursed, making them even costlier for patients. They are not covered by insurance, which limits the growth of the body contouring devices market.


Opportunity: Improving healthcare infrastructure in emerging markets

There is a major shift in the healthcare infrastructure in emerging markets like India, Brazil, and Mexico. This improved healthcare infrastructure provides added opportunities to the body contouring devices market. There is a significant increase in the number of specialty clinics, medical spas, and beauty centers, which has led to an increased number of procedures in these regions as the improved infrastructure attracts patients from different parts of the world, leading to improved medical tourism. The cost of procedures is also comparatively lower in these regions, which further drives market growth.

Challenge: Stringent regulatory compliance and safety standards

Regulations for medical devices, including aesthetic devices, are very strict in regions like North America and Europe. These stringent guidelines pose a challenge for small companies or startups aiming to enter these markets. While strict guidelines for medical devices such as body contouring devices benefit end users or patients, they also limit market innovation and growth. Regulatory authorities also maintain safety standards, further adding to the challenge for manufacturers of these devices worldwide. Thus, market growth is hindered by these stringent regulations.

Global Body Contouring Devices Market Ecosystem Analysis

Ecosystem analysis para- Ecosystem analysis maps the elements that body contouring devices comprises with the demonstration of body involved. It briefly includes products, applications, gender, age group and end user. It provides a gist of technologies and treatments involved in the body contouring devices market namely non-invasive devices and invasive devices and applications like fat reduction , fat freezing, skin tightening and amongst others. Manufacturer of the body contouring devices includes different organizations involved in the process on research, approval, manufacturing, sales and marketing. End users involved in the body contouring devices market which are the key stakeholders of the market.


In 2023, the non-invasive devices segment accounted for the largest share.

The market for body contouring devices is mainly divided into non-invasive and invasive categories. In 2023, the non-invasive devices segment held the largest share. Most body contouring treatments are non-invasive, as these devices are the preferred choice for surgeons and the targeted population. Non-invasive devices offer a wide range of applications, from skin tightening to fat reduction, body sculpting, and toning. These devices also provide affordable treatment options for patients. Due to added benefits such as being less time-consuming and more effective, non-invasive procedures are widely adopted by those seeking treatment. Treatments like fat freezing and fat reduction use devices like radiofrequency and fat freezers, which have minimal side effects and much shorter downtime. Additionally, these devices are compact, do not consume much space, and have affordable regular maintenance, making them the first choice of treatment for caregivers. There is increasing acceptance of non-invasive body contouring devices among the target population due to rising steady incomes.

In 2023, the fat reduction application segment accounted for the largest share.

The market is mainly divided into cellulite treatment, fat reduction, body toning, and sculpting & skin tightening. In 2023, fat reduction was the largest segment of this market. The significant share of this market segment is due to the growing obese population worldwide and increased awareness of body contouring procedures that help reduce body fat with minimal effort and time. There is a growing acceptance of altering body types to fit into a particular category, and increased awareness through social media about treatment options provides easy access to information, which will further increase the acceptance of body contouring options for fat reduction. These factors significantly improve market growth.

In 2023, individuals between 35 to 50 years segment accounted for the largest share.

By age group, the market is primarily segmented into individuals between 35 to 50 years, above 50 years, and below 35 years. Individuals between 35 and 50 years accounted for the largest share of the body contouring devices market in 2023. Reduced body fat in middle-aged individuals not only provides an improved aesthetic appearance but also offers a healthy body. There are numerous reasons for people in this age group to opt for body contouring procedures, including increased awareness of the procedures available, social media trends, and increased acceptance of new trends and technologies.

In 2023, women accounted for the largest share.

By gender, the market is primarily segmented into women and men. The females segment accounted for a larger share of the body contouring devices market in 2023. The large share of this segment can be attributed to the increased awareness about body contouring treatments among women and the easy availability of treatment options like fat reduction, skin tightening, and body sculpting and toning. There is an increasing focus among women on maintaining a particular body type, which leads more women to go for body contouring treatments.

In 2023, specialty clinics segment accounted for the largest share.

The market is divided into hospitals, specialty clinics, and medical spas & beauty centers. In 2023, the specialty clinics segment had the largest share of the body contouring devices market. This can be attributed to the growth in the number of specialty clinics, technological advancements, and skilled professionals. Expansions of specialty clinics are making body contouring more accessible. These clinics use advanced technologies, upgraded medical systems, and telemedicine for treatments. The rise in medical tourism in the Asia Pacific has also led to a significant increase in specialty clinics, offering affordable treatments with expertise, contributing to the market growth of the specialty clinics segment.

North America accounted for the largest share in transfection technologies market in 2022.

The global body contouring devices market is segmented into five major regions—North America, Europe, the Asia Pacific, Latin America, and the Middle East & Africa. North America held the largest market share for body contouring devices worldwide in 2023. The North American body contouring devices market is growing due to the increasing population and rising awareness of body contouring devices. More people are now opting for body contouring for both aesthetic and medical reasons. This shift is happening worldwide, owing to increased awareness through various platforms and easily accessible treatments with minimal downtime and improved results. North America is a significant market for advanced treatments, leading to a larger market share.

HIGHEST CAGR MARKET IN 2023
US FASTEST GROWING MARKET IN THE REGION

Recent Developments of Body Contouring Devices Market

  • In January 2024, Bausch Health Companies Inc. and Solta Medical announced the approval of Thermage FLX and the TR-4 Return Pad by China’s National Medical Products Administration (NMPA).
  • In August 2022, AbbVie, announced the US FDA approval of JUVÉDERM VOLUX XC.
  • In December 2021, Cutera launched the next generation of truSculpt flex.
  • In December 2021, Abbvie announced the successful completion of its acquisition of Soliton, Inc. for its portfolio of non-invasive body contouring treatments.

Key Market Players

Want to explore hidden markets that can drive new revenue in Body Contouring Devices Market?

Scope of the Report

Report Metric Details
Market size available for years 2022-2029
Base Year Considered 2023
Forecast period 2024-2029
Forecast units Value (USD Billion)
Segments covered product, application, age group, gender, end-user, and region.
Geographies covered North America, Europe, Asia Pacific, Latin America, the Middle East & Africa and GCC Countries

Key Questions Addressed by the Report

What are the recent trends affecting the body contouring devices market?
Recent trends impacting the body contouring devices market include the increasing advertisement of body contouring procedures and the rising integration of advanced non-invasive body contouring devices.
Who are the key players in the body contouring devices market?
The key players in this market are AbbVie, Inc. (US), Cutera (US), Bausch Health Companies Inc. (Canada), InMode Ltd. (Israel), Venus Concept (Canada), ENDYMED Medical (US), Cynosure Lutronic (US), Lumenis BE Ltd. (Israel), Alma Lasers (Israel), and Candela Corporation (US)
Which are the major product types in the body contouring devices market?
The body contouring devices market is segmented into non-invasive and invasive devices. In 2023, non-invasive devices accounted for the largest share of the market, primarily because of the growing volume of aesthetic procedures and the advancing technological innovations in non-invasive devices.
What are the major applications in the body contouring devices market?
By application, the market is primarily segmented into fat reduction, body toning & sculpting, skin tightening, and cellulite treatment. In 2023, the fat reduction application segment accounted for the largest share of the body contouring devices market.
What are the major age groups in the body contouring devices market?
The market is primarily segmented by age group into those below 35 years, between 35 to 50 years, and above 50 years. The age group between 35 to 50 years accounted for the largest share of the body contouring devices market in 2023.
Which gender leads the body contouring devices market?
The market is primarily segmented by gender, into men and women. Women accounted for the largest share of the body contouring devices market in 2023.
What are the major end users of body contouring devices market?
The market is categorized by end users into hospitals, specialty clinics, and medical spas & beauty centers. In 2023, the specialty clinics segment accounted for the largest share of the body contouring devices market, primarily because specialty clinics conduct a significant number of minimally invasive procedures.
Which region is lucrative for the body contouring devices market?
The emerging economies in the Asia Pacific region will be lucrative markets for body contouring devices.

Personalize This Research

  • Triangulate with your Own Data
  • Get Data as per your Format and Definition
  • Gain a Deeper Dive on a Specific Application, Geography, Customer or Competitor
  • Any level of Personalization
Request A Free Customisation

Let Us Help You

  • What are the Known and Unknown Adjacencies Impacting the Body Contouring Devices Market
  • What will your New Revenue Sources be?
  • Who will be your Top Customer; what will make them switch?
  • Defend your Market Share or Win Competitors
  • Get a Scorecard for Target Partners
Customized Workshop Request

Table Of Contents

Exclusive indicates content/data unique to MarketsandMarkets and not available with any competitors.

TITLE
PAGE NO
INTRODUCTION
29
RESEARCH METHODOLOGY
33
EXECUTIVE SUMMARY
45
PREMIUM INSIGHTS
50
MARKET OVERVIEW
55
  • 5.1 INTRODUCTION
  • 5.2 MARKET DYNAMICS
    DRIVERS
    - Growing adoption of minimally invasive and non-invasive aesthetic procedures
    - Increasing awareness and acceptance of body contouring
    - Increasing demand for aesthetic treatments among men
    - Technological advancements
    RESTRAINTS
    - High cost of treatment and lack of reimbursement
    OPPORTUNITIES
    - Improving healthcare infrastructure in emerging markets
    CHALLENGES
    - Stringent regulatory compliance and safety standards
    - Social and cultural barriers in emerging economies
  • 5.3 PRICING ANALYSIS
    INDICATIVE PRICING MODEL ANALYSIS OF MARKET PLAYERS
    AVERAGE SELLING PRICE OF BODY CONTOURING DEVICES, BY REGION
  • 5.4 PATENT ANALYSIS
    LIST OF MAJOR PATENTS
  • 5.5 VALUE CHAIN ANALYSIS
  • 5.6 SUPPLY CHAIN ANALYSIS
  • 5.7 TRADE ANALYSIS
    TRADE ANALYSIS FOR LASER AESTHETIC DEVICES
  • 5.8 ECOSYSTEM ANALYSIS
    BODY CONTOURING DEVICES MARKET: ROLE IN ECOSYSTEM
  • 5.9 PORTER’S FIVE FORCES ANALYSIS
    THREAT OF NEW ENTRANTS
    THREAT OF SUBSTITUTES
    BARGAINING POWER OF BUYERS
    BARGAINING POWER OF SUPPLIERS
    INTENSITY OF COMPETITIVE RIVALRY
  • 5.10 REGULATORY LANDSCAPE
    REGULATORY BODIES, GOVERNMENT AGENCIES, AND OTHER ORGANIZATIONS
    REGULATORY ANALYSIS
    - North America
    - Europe
    - Asia Pacific
    - Latin America
    - Middle East
  • 5.11 TECHNOLOGY ANALYSIS
    KEY TECHNOLOGIES
    - Cryolipolysis
    - Radiofrequency (RF)
    - High-intensity-focused Ultrasound (HIFU)
    COMPLEMENTARY TECHNOLOGIES
    - Laser-assisted devices
    - Implants
    ADJACENT TECHNOLOGIES
    - Body sculpting rollers
    - Electrostimulation devices
  • 5.12 KEY CONFERENCES & EVENTS IN 2024–2025
  • 5.13 TRENDS/DISRUPTIONS IMPACTING CUSTOMERS’ BUSINESSES
    TRENDS/DISRUPTIONS IMPACTING CUSTOMERS’ BUSINESSES
  • 5.14 KEY STAKEHOLDERS & BUYING CRITERIA
    KEY STAKEHOLDERS IN BUYING PROCESS
    BUYING CRITERIA
  • 5.15 INVESTMENT & FUNDING SCENARIO
  • 5.16 IMPACT OF AI ON BODY CONTOURING DEVICES MARKET
BODY CONTOURING DEVICES MARKET, BY TYPE
86
  • 6.1 INTRODUCTION
  • 6.2 NON-INVASIVE DEVICES
    RADIOFREQUENCY (RF) DEVICES
    - Ability to deliver noticeable results with minimal downtime to drive market growth
    CRYOLIPOLYSIS/FAT FREEZING DEVICES
    - Risk associated with fat freezing to challenge market growth
    HIGH-INTENSITY-FOCUSED ULTRASOUND (HIFU) DEVICES
    - Minimal downtime of HIFU devices to support adoption
    LOW-LEVEL LASER THERAPY (LLLT) DEVICES
    - Increased patient safety and quick results to support market growth
    OTHER NON-INVASIVE DEVICES
  • 6.3 INVASIVE DEVICES
    LIPOSUCTION DEVICES
    - Increasing obese population to drive growth
    LASER-ASSISTED DEVICES
    - Shift towards minimally invasive aesthetic treatments to drive growth
    IMPLANTS/FILLERS
    - Rising demand for cosmetic implants to fuel growth
BODY CONTOURING DEVICES MARKET, BY APPLICATION
121
  • 7.1 INTRODUCTION
  • 7.2 FAT REDUCTION
    INCREASING NUMBER OF NON-INVASIVE AND MINIMALLY INVASIVE AESTHETIC PROCEDURES TO PROPEL MARKET GROWTH
  • 7.3 SKIN TIGHTENING
    INTRODUCTION OF CUTTING-EDGE DEVICES TO FUEL UPTAKE
  • 7.4 BODY TONING & SCULPTING
    INCREASED CONSUMER DESIRE FOR ENHANCED BODY AESTHETICS TO DRIVE MARKET GROWTH
  • 7.5 CELLULITE TREATMENT
    ADVANTAGES ASSOCIATED WITH ROBOTIC-ASSISTED SURGERY TO BOOST MARKET GROWTH
BODY CONTOURING DEVICES MARKET, BY AGE GROUP
135
  • 8.1 INTRODUCTION
  • 8.2 BETWEEN 35 TO 50 YEARS
    GROWING INTEREST IN MAINTAINING YOUTHFUL APPEARANCE TO DRIVE MARKET GROWTH
  • 8.3 ABOVE 50 YEARS
    GROWING GERIATRIC POPULATION AND SUBSEQUENT INCREASE IN ACCEPTANCE OF COSMETIC PROCEDURES TO BOOST MARKET
  • 8.4 BELOW 35 YEARS
    INCREASING NUMBER OF CUSTOMIZABLE TREATMENT PLANS TO FAVOR MARKET GROWTH
BODY CONTOURING DEVICES MARKET, BY GENDER
146
  • 9.1 INTRODUCTION
  • 9.2 WOMEN
    INCREASED AWARENESS AND ACCESSIBILITY OF BODY CONTOURING PROCEDURES TO DRIVE MARKET GROWTH
  • 9.3 MEN
    INCREASING ACCEPTANCE OF AESTHETIC PROCEDURES AMONG MEN TO BOOST UPTAKE
BODY CONTOURING DEVICES MARKET, BY END USER
154
  • 10.1 INTRODUCTION
  • 10.2 SPECIALTY CLINICS
    OPERATIONAL ENHANCEMENTS, COMBINED WITH TARGETED MARKETING STRATEGIES, TO PROPEL MARKET
  • 10.3 MEDICAL SPAS & BEAUTY CENTERS
    AVAILABILITY OF MEDICAL TREATMENT IN COMFORTABLE AND RELAXING SETTINGS TO AID MARKET GROWTH
  • 10.4 HOSPITALS
    GROWING ADOPTION OF MINIMALLY INVASIVE PROCEDURES IN HOSPITALS TO SUPPORT MARKET GROWTH
BODY CONTOURING DEVICES MARKET, BY REGION
165
  • 11.1 INTRODUCTION
  • 11.2 NORTH AMERICA
    MACROECONOMIC OUTLOOK FOR NORTH AMERICA
    US
    - Increased demand for aesthetic procedures to drive market growth
    CANADA
    - Rapid increase in geriatric population and increased awareness about non-invasive body contouring procedures to boost market
  • 11.3 EUROPE
    MACROECONOMIC OUTLOOK FOR EUROPE
    GERMANY
    - Rising disposable incomes to boost use of body contouring devices
    UK
    - Reduced stigma for body contouring procedures to drive market growth
    FRANCE
    - Improved standard of living and growing disposable income to support market growth
    ITALY
    - Increasing number of plastic surgeons to favor market growth
    SPAIN
    - Increasing demand for cosmetic procedures and rising availability of safe minimally invasive technology to fuel growth
    REST OF EUROPE
  • 11.4 ASIA PACIFIC
    MACROECONOMIC OUTLOOK FOR ASIA PACIFIC
    CHINA
    - Growing availability of body contouring surgery to drive market
    JAPAN
    - Increasing number of plastic surgeons to propel market growth in Japan
    INDIA
    - Increasing disposable incomes to drive market growth in India
    REST OF ASIA PACIFIC
  • 11.5 LATIN AMERICA
    MACROECONOMIC OUTLOOK FOR LATIN AMERICA
    BRAZIL
    - Growing focus on medical tourism to drive market growth
    MEXICO
    - Growing volume of surgical procedures to aid market growth
    REST OF LATIN AMERICA
  • 11.6 MIDDLE EAST & AFRICA
    IMPLEMENTATION OF FAVORABLE INITIATIVES TO BOOST MARKET
    MACROECONOMIC OUTLOOK FOR MIDDLE EAST & AFRICA
  • 11.7 GCC COUNTRIES
    HIGHER DISPOSABLE INCOMES TO SUPPORT MARKET GROWTH
    MACROECONOMIC OUTLOOK FOR GCC COUNTRIES
COMPETITIVE LANDSCAPE
249
  • 12.1 OVERVIEW
  • 12.2 KEY PLAYER STRATEGY/RIGHT TO WIN
    OVERVIEW OF STRATEGIES DEPLOYED BY PLAYERS IN BODY CONTOURING DEVICES MARKET
  • 12.3 REVENUE ANALYSIS, 2019–2023
  • 12.4 MARKET SHARE ANALYSIS, 2023
  • 12.5 COMPANY EVALUATION MATRIX: KEY PLAYERS, 2023
    LIST OF EVALUATED VENDORS
    STARS
    EMERGING LEADERS
    PERVASIVE PLAYERS
    PARTICIPANTS
    COMPANY FOOTPRINT: KEY PLAYERS, 2023
    - Company footprint
    - Type footprint
    - Application footprint
    - Region footprint
  • 12.6 COMPANY EVALUATION MATRIX: START-UPS/SMES, 2023
    PROGRESSIVE COMPANIES
    RESPONSIVE COMPANIES
    DYNAMIC COMPANIES
    STARTING BLOCKS
    COMPETITIVE BENCHMARKING: START-UPS/SMES, 2023
  • 12.7 COMPANY VALUATION & FINANCIAL METRICS
    FINANCIAL METRICS
    COMPANY VALUATION
  • 12.8 BRAND/PRODUCT COMPARISON
    ABBVIE, INC.
    CYNOSURE LUTRONIC
    CUTERA
  • 12.9 COMPETITIVE SCENARIO
    PRODUCT LAUNCHES & APPROVALS
    DEALS
COMPANY PROFILES
264
  • 13.1 KEY PLAYERS
    ABBVIE, INC.
    - Business overview
    - Products offered
    - Recent developments
    - MnM view
    INMODE LTD.
    - Business overview
    - Products offered
    - MnM view
    BAUSCH HEALTH COMPANIES INC.
    - Business overview
    - Products offered
    - Recent developments
    - MnM view
    CYNOSURE LUTRONIC
    - Business overview
    - Products offered
    - MnM view
    CUTERA, INC.
    - Business overview
    - Products offered
    - Recent developments
    - MnM view
    VENUS CONCEPT
    - Business overview
    - Products offered
    - Recent developments
    ENDYMED MEDICAL
    - Business overview
    - Products offered
    LUMENIS BE LTD.
    - Business overview
    - Products offered
    ALMA LASERS
    - Business overview
    - Products offered
    CANDELA CORPORATION
    - Business overview
    - Products offered
    - Recent developments
  • 13.2 OTHER PLAYERS
    BTL AESTHETICS LTD.
    MICROAIRE SURGICAL INSTRUMENTS, LLC
    FOTONA
    NOUVAG AG
    ERCHONIA CORPORATION
    KONMISON
    SKINNOVATION PVT. LTD.
    3D AESTHETICS
    ZIMMER MEDIZINSYSTEME GMBH
    ROHRER AESTHETICS
    SKIN AESTHETICS
    SHARPLIGHT TECHNOLOGIES INC.
    SEBBIN
    DEKA M.E.L.A. S.R.L.
    INDIBA
APPENDIX
302
  • 14.1 DISCUSSION GUIDE
  • 14.2 KNOWLEDGESTORE: MARKETSANDMARKETS’ SUBSCRIPTION PORTAL
  • 14.3 CUSTOMIZATION OPTIONS
  • 14.4 RELATED REPORTS
  • 14.5 AUTHOR DETAILS
LIST OF TABLES
 
  • TABLE 1 RISK ASSESSMENT: BODY CONTOURING DEVICES MARKET
  • TABLE 2 NUMBER OF PROCEDURES (2022 VS. 2023)
  • TABLE 3 NUMBER OF PROCEDURES (2019 VS. 2022)
  • TABLE 4 NUMBER OF PROCEDURES IN MALES (2022)
  • TABLE 5 AESTHETIC PLASTIC SURGEON FEES FOR BODY CONTOURING PROCEDURES
  • TABLE 6 INDICATIVE PRICING FOR BODY CONTOURING DEVICES (2024)
  • TABLE 7 AVERAGE SELLING PRICE OF BODY CONTOURING DEVICES, BY REGION/COUNTRY (2022 VS. 2023 VS. 2024)
  • TABLE 8 IMPORT DATA FOR LASER AESTHETIC DEVICES, BY COUNTRY, 2019–2023 (USD MILLION)
  • TABLE 9 EXPORT DATA FOR LASER AESTHETIC DEVICES, BY COUNTRY, 2019–2023 (USD MILLION)
  • TABLE 10 BODY CONTOURING DEVICES MARKET: PORTER’S FIVE FORCES ANALYSIS
  • TABLE 11 NORTH AMERICA: REGULATORY BODIES, GOVERNMENT AGENCIES, AND OTHER ORGANIZATIONS
  • TABLE 12 EUROPE: REGULATORY BODIES, GOVERNMENT AGENCIES, AND OTHER ORGANIZATIONS
  • TABLE 13 ASIA PACIFIC: REGULATORY BODIES, GOVERNMENT AGENCIES, AND OTHER ORGANIZATIONS
  • TABLE 14 US FDA: MEDICAL DEVICE REGULATORY APPROVAL PROCESS
  • TABLE 15 CHINA: CLASSIFICATION OF MEDICAL DEVICES
  • TABLE 16 BODY CONTOURING DEVICES MARKET: DETAILED LIST OF CONFERENCES & EVENTS
  • TABLE 17 INFLUENCE OF STAKEHOLDERS ON BUYING PROCESS OF BODY CONTOURING DEVICES FOR END USERS (%)
  • TABLE 18 KEY BUYING CRITERIA OF BODY CONTOURING DEVICES FOR END USERS
  • TABLE 19 BODY CONTOURING DEVICES MARKET, BY TYPE, 2022–2029 (USD MILLION)
  • TABLE 20 NON-INVASIVE BODY CONTOURING DEVICES AND TECHNOLOGIES
  • TABLE 21 NON-INVASIVE BODY CONTOURING DEVICES MARKET, BY TYPE, 2022–2029 (USD MILLION)
  • TABLE 22 NON-INVASIVE BODY CONTOURING DEVICES MARKET, BY REGION, 2022–2029 (USD MILLION)
  • TABLE 23 NORTH AMERICA: NON-INVASIVE BODY CONTOURING DEVICES MARKET, BY COUNTRY, 2022–2029 (USD MILLION)
  • TABLE 24 EUROPE: NON-INVASIVE BODY CONTOURING DEVICES MARKET, BY COUNTRY, 2022–2029 (USD MILLION)
  • TABLE 25 ASIA PACIFIC: NON-INVASIVE BODY CONTOURING DEVICES MARKET, BY COUNTRY, 2022–2029 (USD MILLION)
  • TABLE 26 LATIN AMERICA: NON-INVASIVE BODY CONTOURING DEVICES MARKET, BY COUNTRY, 2022–2029 (USD MILLION)
  • TABLE 27 KEY RADIOFREQUENCY (RF) BODY CONTOURING DEVICES AVAILABLE IN MARKET
  • TABLE 28 RADIOFREQUENCY (RF) BODY CONTOURING DEVICES MARKET, BY REGION, 2022–2029 (USD MILLION)
  • TABLE 29 NORTH AMERICA: RADIOFREQUENCY (RF) BODY CONTOURING DEVICES MARKET, BY COUNTRY, 2022–2029 (USD MILLION)
  • TABLE 30 EUROPE: RADIOFREQUENCY (RF) BODY CONTOURING DEVICES MARKET, BY COUNTRY, 2022–2029 (USD MILLION)
  • TABLE 31 ASIA PACIFIC: RADIOFREQUENCY (RF) BODY CONTOURING DEVICES MARKET, BY COUNTRY, 2022–2029 (USD MILLION)
  • TABLE 32 LATIN AMERICA: RADIOFREQUENCY (RF) BODY CONTOURING DEVICES MARKET, BY COUNTRY, 2022–2029 (USD MILLION)
  • TABLE 33 KEY CRYOLIPOLYSIS/FAT FREEZING BODY CONTOURING DEVICES AVAILABLE IN MARKET
  • TABLE 34 CRYOLIPOLYSIS/FAT FREEZING BODY CONTOURING DEVICES MARKET, BY REGION, 2022–2029 (USD MILLION)
  • TABLE 35 NORTH AMERICA: CRYOLIPOLYSIS/FAT FREEZING BODY CONTOURING DEVICES MARKET, BY COUNTRY, 2022–2029 (USD MILLION)
  • TABLE 36 EUROPE: CRYOLIPOLYSIS/FAT FREEZING BODY CONTOURING DEVICES MARKET, BY COUNTRY, 2022–2029 (USD MILLION)
  • TABLE 37 ASIA PACIFIC: CRYOLIPOLYSIS/FAT FREEZING BODY CONTOURING DEVICES MARKET, BY COUNTRY, 2022–2029 (USD MILLION)
  • TABLE 38 LATIN AMERICA: CRYOLIPOLYSIS/FAT FREEZING BODY CONTOURING DEVICES MARKET, BY COUNTRY, 2022–2029 (USD MILLION)
  • TABLE 39 KEY HIGH-INTENSITY-FOCUSED ULTRASOUND (HIFU) BODY CONTOURING DEVICES AVAILABLE IN MARKET
  • TABLE 40 HIGH-INTENSITY-FOCUSED ULTRASOUND (HIFU) BODY CONTOURING DEVICES MARKET, BY REGION, 2022–2029 (USD MILLION)
  • TABLE 41 NORTH AMERICA: HIGH-INTENSITY-FOCUSED ULTRASOUND (HIFU) BODY CONTOURING DEVICES MARKET, BY COUNTRY, 2022–2029 (USD MILLION)
  • TABLE 42 EUROPE: HIGH-INTENSITY-FOCUSED ULTRASOUND (HIFU) BODY CONTOURING DEVICES MARKET, BY COUNTRY, 2022–2029 (USD MILLION)
  • TABLE 43 ASIA PACIFIC: HIGH-INTENSITY-FOCUSED ULTRASOUND (HIFU) BODY CONTOURING DEVICES MARKET, BY COUNTRY, 2022–2029 (USD MILLION)
  • TABLE 44 LATIN AMERICA: HIGH-INTENSITY-FOCUSED ULTRASOUND (HIFU) BODY CONTOURING DEVICES MARKET, BY COUNTRY, 2022–2029 (USD MILLION)
  • TABLE 45 KEY LOW-LEVEL LASER THERAPY (LLLT) BODY CONTOURING DEVICESAVAILABLE IN MARKET
  • TABLE 46 LOW-LEVEL LASER THERAPY (LLLT) BODY CONTOURING DEVICES MARKET, BY REGION, 2022–2029 (USD MILLION)
  • TABLE 47 NORTH AMERICA: LOW-LEVEL LASER THERAPY (LLLT) BODY CONTOURING DEVICES MARKET, BY COUNTRY, 2022–2029 (USD MILLION)
  • TABLE 48 EUROPE: LOW-LEVEL LASER THERAPY (LLLT) BODY CONTOURING DEVICES MARKET, BY COUNTRY, 2022–2029 (USD MILLION)
  • TABLE 49 ASIA PACIFIC: LOW-LEVEL LASER THERAPY (LLLT) BODY CONTOURING DEVICES MARKET, BY COUNTRY, 2022–2029 (USD MILLION)
  • TABLE 50 LATIN AMERICA: LOW-LEVEL LASER THERAPY (LLLT) BODY CONTOURING DEVICES MARKET, BY COUNTRY, 2022–2029 (USD MILLION)
  • TABLE 51 OTHER NON-INVASIVE BODY CONTOURING DEVICES MARKET, BY REGION, 2022–2029 (USD MILLION)
  • TABLE 52 NORTH AMERICA: OTHER NON-INVASIVE BODY CONTOURING DEVICES MARKET, BY COUNTRY, 2022–2029 (USD MILLION)
  • TABLE 53 EUROPE: OTHER NON-INVASIVE BODY CONTOURING DEVICES MARKET, BY COUNTRY, 2022–2029 (USD MILLION)
  • TABLE 54 ASIA PACIFIC: OTHER NON-INVASIVE BODY CONTOURING DEVICES MARKET, BY COUNTRY, 2022–2029 (USD MILLION)
  • TABLE 55 LATIN AMERICA: OTHER NON-INVASIVE BODY CONTOURING DEVICES MARKET, BY COUNTRY, 2022–2029 (USD MILLION)
  • TABLE 56 INVASIVE BODY CONTOURING DEVICES MARKET, BY TYPE, 2022–2029 (USD MILLION)
  • TABLE 57 INVASIVE BODY CONTOURING DEVICES MARKET, BY REGION, 2022–2029 (USD MILLION)
  • TABLE 58 NORTH AMERICA: INVASIVE BODY CONTOURING DEVICES MARKET, BY COUNTRY, 2022–2029 (USD MILLION)
  • TABLE 59 EUROPE: INVASIVE BODY CONTOURING DEVICES MARKET, BY COUNTRY, 2022–2029 (USD MILLION)
  • TABLE 60 ASIA PACIFIC: INVASIVE BODY CONTOURING DEVICES MARKET, BY COUNTRY, 2022–2029 (USD MILLION)
  • TABLE 61 LATIN AMERICA: INVASIVE BODY CONTOURING DEVICES MARKET, BY COUNTRY, 2022–2029 (USD MILLION)
  • TABLE 62 TOP 5 COUNTRIES PERFORMING LIPOSUCTION TREATMENTS (2018–2022)
  • TABLE 63 KEY LIPOSUCTION BODY CONTOURING DEVICES AVAILABLE IN MARKET
  • TABLE 64 LIPOSUCTION BODY CONTOURING DEVICES MARKET, BY GENDER, 2022–2029 (THOUSAND PROCEDURES)
  • TABLE 65 LIPOSUCTION BODY CONTOURING DEVICES MARKET, BY REGION, 2022–2029 (USD MILLION)
  • TABLE 66 NORTH AMERICA: LIPOSUCTION BODY CONTOURING DEVICES MARKET, BY COUNTRY, 2022–2029 (USD MILLION)
  • TABLE 67 EUROPE: LIPOSUCTION BODY CONTOURING DEVICES MARKET, BY COUNTRY, 2022–2029 (USD MILLION)
  • TABLE 68 ASIA PACIFIC: LIPOSUCTION BODY CONTOURING DEVICES MARKET, BY COUNTRY, 2022–2029 (USD MILLION)
  • TABLE 69 LATIN AMERICA: LIPOSUCTION BODY CONTOURING DEVICES MARKET, BY COUNTRY, 2022–2029 (USD MILLION)
  • TABLE 70 KEY LASER-ASSISTED BODY CONTOURING DEVICES AVAILABLE IN MARKET
  • TABLE 71 LASER-ASSISTED BODY CONTOURING DEVICES MARKET, BY REGION, 2022–2029 (USD MILLION)
  • TABLE 72 NORTH AMERICA: LASER-ASSISTED BODY CONTOURING DEVICES MARKET, BY COUNTRY, 2022–2029 (USD MILLION)
  • TABLE 73 EUROPE: LASER-ASSISTED BODY CONTOURING DEVICES MARKET, BY COUNTRY, 2022–2029 (USD MILLION)
  • TABLE 74 ASIA PACIFIC: LASER-ASSISTED BODY CONTOURING DEVICES MARKET, BY COUNTRY, 2022–2029 (USD MILLION)
  • TABLE 75 LATIN AMERICA: LASER-ASSISTED BODY CONTOURING DEVICES MARKET, BY COUNTRY, 2022–2029 (USD MILLION)
  • TABLE 76 KEY BODY CONTOURING IMPLANTS/FILLERS AVAILABLE IN MARKET
  • TABLE 77 BODY CONTOURING IMPLANTS/FILLERS MARKET, BY REGION, 2022–2029 (USD MILLION)
  • TABLE 78 NORTH AMERICA: BODY CONTOURING IMPLANTS/FILLERS MARKET, BY COUNTRY, 2022–2029 (USD MILLION)
  • TABLE 79 EUROPE: BODY CONTOURING IMPLANTS/FILLERS MARKET, BY COUNTRY, 2022–2029 (USD MILLION)
  • TABLE 80 ASIA PACIFIC: BODY CONTOURING IMPLANTS/FILLERS MARKET, BY COUNTRY, 2022–2029 (USD MILLION)
  • TABLE 81 LATIN AMERICA: BODY CONTOURING IMPLANTS/FILLERS MARKET, BY COUNTRY, 2022–2029 (USD MILLION)
  • TABLE 82 BODY CONTOURING DEVICES MARKET, BY APPLICATION, 2022–2029 (USD MILLION)
  • TABLE 83 TOP 5 COUNTRIES PERFORMING NON-SURGICAL FAT REDUCTION TREATMENTS (2018–2022)
  • TABLE 84 BODY CONTOURING DEVICES MARKET FOR FAT REDUCTION APPLICATIONS, BY REGION, 2022–2029 (USD MILLION)
  • TABLE 85 NORTH AMERICA: BODY CONTOURING DEVICES MARKET FOR FAT REDUCTION APPLICATIONS, BY COUNTRY, 2022–2029 (USD MILLION)
  • TABLE 86 EUROPE: BODY CONTOURING DEVICES MARKET FOR FAT REDUCTION APPLICATIONS, BY COUNTRY, 2022–2029 (USD MILLION)
  • TABLE 87 ASIA PACIFIC: BODY CONTOURING DEVICES MARKET FOR FAT REDUCTION APPLICATIONS, BY COUNTRY, 2022–2029 (USD MILLION)
  • TABLE 88 LATIN AMERICA: BODY CONTOURING DEVICES MARKET FOR FAT REDUCTION APPLICATIONS, BY COUNTRY, 2022–2029 (USD MILLION)
  • TABLE 89 BODY CONTOURING DEVICES MARKET FOR SKIN TIGHTENING APPLICATIONS, BY REGION, 2022–2029 (USD MILLION)
  • TABLE 90 NORTH AMERICA: BODY CONTOURING DEVICES MARKET FOR SKIN TIGHTENING APPLICATIONS, BY COUNTRY, 2022–2029 (USD MILLION)
  • TABLE 91 EUROPE: BODY CONTOURING DEVICES MARKET FOR SKIN TIGHTENING APPLICATIONS, BY COUNTRY, 2022–2029 (USD MILLION)
  • TABLE 92 ASIA PACIFIC: BODY CONTOURING DEVICES MARKET FOR SKIN TIGHTENING APPLICATIONS, BY COUNTRY, 2022–2029 (USD MILLION)
  • TABLE 93 LATIN AMERICA: BODY CONTOURING DEVICES MARKET FOR SKIN TIGHTENING APPLICATIONS, BY COUNTRY, 2022–2029 (USD MILLION)
  • TABLE 94 BODY CONTOURING DEVICES MARKET FOR BODY TONING & SCULPTING APPLICATIONS, BY REGION, 2022–2029 (USD MILLION)
  • TABLE 95 NORTH AMERICA: BODY CONTOURING DEVICES MARKET FOR BODY TONING & SCULPTING APPLICATIONS, BY COUNTRY, 2022–2029 (USD MILLION)
  • TABLE 96 EUROPE: BODY CONTOURING DEVICES MARKET FOR BODY TONING & SCULPTING APPLICATIONS, BY COUNTRY, 2022–2029 (USD MILLION)
  • TABLE 97 ASIA PACIFIC: BODY CONTOURING DEVICES MARKET FOR BODY TONING & SCULPTING APPLICATIONS, BY COUNTRY, 2022–2029 (USD MILLION)
  • TABLE 98 LATIN AMERICA: BODY CONTOURING DEVICES MARKET FOR BODY TONING & SCULPTING APPLICATIONS, BY COUNTRY, 2022–2029 (USD MILLION)
  • TABLE 99 NO. OF CELLULITE TREATMENTS PERFORMED (2022)
  • TABLE 100 BODY CONTOURING DEVICES MARKET FOR CELLULITE TREATMENT APPLICATIONS, BY REGION, 2022–2029 (USD MILLION)
  • TABLE 101 NORTH AMERICA: BODY CONTOURING DEVICES MARKET FOR CELLULITE TREATMENT APPLICATIONS, BY COUNTRY, 2022–2029 (USD MILLION)
  • TABLE 102 EUROPE: BODY CONTOURING DEVICES MARKET FOR CELLULITE TREATMENT APPLICATIONS, BY COUNTRY, 2022–2029 (USD MILLION)
  • TABLE 103 ASIA PACIFIC: BODY CONTOURING DEVICES MARKET FOR CELLULITE TREATMENT APPLICATIONS, BY COUNTRY, 2022–2029 (USD MILLION)
  • TABLE 104 LATIN AMERICA: BODY CONTOURING DEVICES MARKET FOR CELLULITE TREATMENT APPLICATIONS, BY COUNTRY, 2022–2029 (USD MILLION)
  • TABLE 105 BODY CONTOURING DEVICES MARKET, BY AGE GROUP, 2022–2029 (USD MILLION)
  • TABLE 106 BODY CONTOURING DEVICES MARKET FOR INDIVIDUALS BETWEEN 35 TO 50 YEARS, BY REGION, 2022–2029 (USD MILLION)
  • TABLE 107 NORTH AMERICA: BODY CONTOURING DEVICES MARKET FOR INDIVIDUALS BETWEEN 35 TO 50 YEARS, BY COUNTRY, 2022–2029 (USD MILLION)
  • TABLE 108 EUROPE: BODY CONTOURING DEVICES MARKET FOR INDIVIDUALS BETWEEN 35 TO 50 YEARS, BY COUNTRY, 2022–2029 (USD MILLION)
  • TABLE 109 ASIA PACIFIC: BODY CONTOURING DEVICES MARKET FOR INDIVIDUALS BETWEEN 35 TO 50 YEARS, BY COUNTRY, 2022–2029 (USD MILLION)
  • TABLE 110 LATIN AMERICA: BODY CONTOURING DEVICES MARKET FOR INDIVIDUALS BETWEEN 35 TO 50 YEARS, BY COUNTRY, 2022–2029 (USD MILLION)
  • TABLE 111 BODY CONTOURING DEVICES MARKET FOR INDIVIDUALS ABOVE 50 YEARS, BY REGION, 2022–2029 (USD MILLION)
  • TABLE 112 NORTH AMERICA: BODY CONTOURING DEVICES MARKET FOR INDIVIDUALS ABOVE 50 YEARS, BY COUNTRY, 2022–2029 (USD MILLION)
  • TABLE 113 EUROPE: BODY CONTOURING DEVICES MARKET FOR INDIVIDUALS ABOVE 50 YEARS, BY COUNTRY, 2022–2029 (USD MILLION)
  • TABLE 114 ASIA PACIFIC: BODY CONTOURING DEVICES MARKET FOR INDIVIDUALS ABOVE 50 YEARS, BY COUNTRY, 2022–2029 (USD MILLION)
  • TABLE 115 LATIN AMERICA: BODY CONTOURING DEVICES MARKET FOR INDIVIDUALS ABOVE 50 YEARS, BY COUNTRY, 2022–2029 (USD MILLION)
  • TABLE 116 BODY CONTOURING DEVICES MARKET FOR INDIVIDUALS BELOW 35 YEARS, BY REGION, 2022–2029 (USD MILLION)
  • TABLE 117 NORTH AMERICA: BODY CONTOURING DEVICES MARKET FOR INDIVIDUALS BELOW 35 YEARS, BY COUNTRY, 2022–2029 (USD MILLION)
  • TABLE 118 EUROPE: BODY CONTOURING DEVICES MARKET FOR INDIVIDUALS BELOW 35 YEARS, BY COUNTRY, 2022–2029 (USD MILLION)
  • TABLE 119 ASIA PACIFIC: BODY CONTOURING DEVICES MARKET FOR INDIVIDUALS BELOW 35 YEARS, BY COUNTRY, 2022–2029 (USD MILLION)
  • TABLE 120 LATIN AMERICA: BODY CONTOURING DEVICES MARKET FOR INDIVIDUALS BELOW 35 YEARS, BY COUNTRY, 2022–2029 (USD MILLION)
  • TABLE 121 BODY CONTOURING DEVICES MARKET, BY GENDER, 2022–2029 (USD MILLION)
  • TABLE 122 BODY CONTOURING PROCEDURES IN WOMEN (2022)
  • TABLE 123 BODY CONTOURING DEVICES MARKET FOR WOMEN, BY REGION, 2022–2029 (USD MILLION)
  • TABLE 124 NORTH AMERICA: BODY CONTOURING DEVICES MARKET FOR WOMEN, BY COUNTRY, 2022–2029 (USD MILLION)
  • TABLE 125 EUROPE: BODY CONTOURING DEVICES MARKET FOR WOMEN, BY COUNTRY, 2022–2029 (USD MILLION)
  • TABLE 126 ASIA PACIFIC: BODY CONTOURING DEVICES MARKET FOR WOMEN, BY COUNTRY, 2022–2029 (USD MILLION)
  • TABLE 127 LATIN AMERICA: BODY CONTOURING DEVICES MARKET FOR WOMEN, BY COUNTRY, 2022–2029 (USD MILLION)
  • TABLE 128 BODY CONTOURING PROCEDURES IN MEN (2022)
  • TABLE 129 BODY CONTOURING DEVICES MARKET FOR MEN, BY REGION, 2022–2029 (USD MILLION)
  • TABLE 130 NORTH AMERICA: BODY CONTOURING DEVICES MARKET FOR MEN, BY COUNTRY, 2022–2029 (USD MILLION)
  • TABLE 131 EUROPE: BODY CONTOURING DEVICES MARKET FOR MEN, BY COUNTRY, 2022–2029 (USD MILLION)
  • TABLE 132 ASIA PACIFIC: BODY CONTOURING DEVICES MARKET FOR MEN, BY COUNTRY, 2022–2029 (USD MILLION)
  • TABLE 133 LATIN AMERICA: BODY CONTOURING DEVICES MARKET FOR MEN, BY COUNTRY, 2022–2029 (USD MILLION)
  • TABLE 134 BODY CONTOURING DEVICES MARKET, BY END USER, 2022–2029 (USD MILLION)
  • TABLE 135 BODY CONTOURING DEVICES MARKET FOR SPECIALTY CLINICS, BY REGION, 2022–2029 (USD MILLION)
  • TABLE 136 NORTH AMERICA: BODY CONTOURING DEVICES MARKET FOR SPECIALTY CLINICS, BY COUNTRY, 2022–2029 (USD MILLION)
  • TABLE 137 EUROPE: BODY CONTOURING DEVICES MARKET FOR SPECIALTY CLINICS, BY COUNTRY, 2022–2029 (USD MILLION)
  • TABLE 138 ASIA PACIFIC: BODY CONTOURING DEVICES MARKET FOR SPECIALTY CLINICS, BY COUNTRY, 2022–2029 (USD MILLION)
  • TABLE 139 LATIN AMERICA: BODY CONTOURING DEVICES MARKET FOR SPECIALTY CLINICS, BY COUNTRY, 2022–2029 (USD MILLION)
  • TABLE 140 BODY CONTOURING DEVICES MARKET FOR MEDICAL SPAS & BEAUTY CENTERS, BY REGION, 2022–2029 (USD MILLION)
  • TABLE 141 NORTH AMERICA: BODY CONTOURING DEVICES MARKET FOR MEDICAL SPAS & BEAUTY CENTERS, BY COUNTRY, 2022–2029 (USD MILLION)
  • TABLE 142 EUROPE: BODY CONTOURING DEVICES MARKET FOR MEDICAL SPAS & BEAUTY CENTERS, BY COUNTRY, 2022–2029 (USD MILLION)
  • TABLE 143 ASIA PACIFIC: BODY CONTOURING DEVICES MARKET FOR MEDICAL SPAS & BEAUTY CENTERS, BY COUNTRY, 2022–2029 (USD MILLION)
  • TABLE 144 LATIN AMERICA: BODY CONTOURING DEVICES MARKET FOR MEDICAL SPAS & BEAUTY CENTERS, BY COUNTRY, 2022–2029 (USD MILLION)
  • TABLE 145 BODY CONTOURING DEVICES MARKET FOR HOSPITALS, BY REGION, 2022–2029 (USD MILLION)
  • TABLE 146 NORTH AMERICA: BODY CONTOURING DEVICES MARKET FOR HOSPITALS, BY COUNTRY, 2022–2029 (USD MILLION)
  • TABLE 147 EUROPE: BODY CONTOURING DEVICES MARKET FOR HOSPITALS, BY COUNTRY, 2022–2029 (USD MILLION)
  • TABLE 148 ASIA PACIFIC: BODY CONTOURING DEVICES MARKET FOR HOSPITALS, BY COUNTRY, 2022–2029 (USD MILLION)
  • TABLE 149 LATIN AMERICA: BODY CONTOURING DEVICES MARKET FOR HOSPITALS, BY COUNTRY, 2022–2029 (USD MILLION)
  • TABLE 150 BODY CONTOURING DEVICES MARKET, BY REGION, 2022–2029 (USD MILLION)
  • TABLE 151 NORTH AMERICA: BODY CONTOURING DEVICES MARKET, BY COUNTRY, 2022–2029 (USD MILLION)
  • TABLE 152 NORTH AMERICA: BODY CONTOURING DEVICES MARKET, BY TYPE, 2022–2029 (USD MILLION)
  • TABLE 153 NORTH AMERICA: NON-INVASIVE BODY CONTOURING DEVICES MARKET, BY TYPE, 2022–2029 (USD MILLION)
  • TABLE 154 NORTH AMERICA: INVASIVE BODY CONTOURING DEVICES MARKET, BY TYPE, 2022–2029 (USD MILLION)
  • TABLE 155 NORTH AMERICA: BODY CONTOURING DEVICES MARKET, BY APPLICATION, 2022–2029 (USD MILLION)
  • TABLE 156 NORTH AMERICA: BODY CONTOURING DEVICES MARKET, BY AGE GROUP, 2022–2029 (USD MILLION)
  • TABLE 157 NORTH AMERICA: BODY CONTOURING DEVICES MARKET, BY GENDER, 2022–2029 (USD MILLION)
  • TABLE 158 NORTH AMERICA: BODY CONTOURING DEVICES MARKET, BY END USER, 2022–2029 (USD MILLION)
  • TABLE 159 NORTH AMERICA: MACROECONOMIC INDICATORS
  • TABLE 160 US: NO. OF BODY CONTOURING PROCEDURES (2018 VS. 2020 VS. 2022)
  • TABLE 161 US: BODY CONTOURING DEVICES MARKET, BY TYPE, 2022–2029 (USD MILLION)
  • TABLE 162 US: NON-INVASIVE BODY CONTOURING DEVICES MARKET, BY TYPE, 2022–2029 (USD MILLION)
  • TABLE 163 US: INVASIVE BODY CONTOURING DEVICES MARKET, BY TYPE, 2022–2029 (USD MILLION)
  • TABLE 164 US: BODY CONTOURING DEVICES MARKET, BY APPLICATION, 2022–2029 (USD MILLION)
  • TABLE 165 US: BODY CONTOURING DEVICES MARKET, BY AGE GROUP, 2022–2029 (USD MILLION)
  • TABLE 166 US: BODY CONTOURING DEVICES MARKET, BY GENDER, 2022–2029 (USD MILLION)
  • TABLE 167 US: BODY CONTOURING DEVICES MARKET, BY END USER, 2022–2029 (USD MILLION)
  • TABLE 168 CANADA: BODY CONTOURING DEVICES MARKET, BY TYPE, 2022–2029 (USD MILLION)
  • TABLE 169 CANADA: NON-INVASIVE BODY CONTOURING DEVICES MARKET, BY TYPE,2022–2029 (USD MILLION)
  • TABLE 170 CANADA: INVASIVE BODY CONTOURING DEVICES MARKET, BY TYPE, 2022–2029 (USD MILLION)
  • TABLE 171 CANADA: BODY CONTOURING DEVICES MARKET, BY APPLICATION, 2022–2029 (USD MILLION)
  • TABLE 172 CANADA: BODY CONTOURING DEVICES MARKET, BY AGE GROUP, 2022–2029 (USD MILLION)
  • TABLE 173 CANADA: BODY CONTOURING DEVICES MARKET, BY GENDER, 2022–2029 (USD MILLION)
  • TABLE 174 CANADA: BODY CONTOURING DEVICES MARKET, BY END USER, 2022–2029 (USD MILLION)
  • TABLE 175 EUROPE: BODY CONTOURING DEVICES MARKET, BY COUNTRY, 2022–2029 (USD MILLION)
  • TABLE 176 EUROPE: BODY CONTOURING DEVICES MARKET, BY TYPE, 2022–2029 (USD MILLION)
  • TABLE 177 EUROPE: NON-INVASIVE BODY CONTOURING DEVICES MARKET, BY TYPE, 2022–2029 (USD MILLION)
  • TABLE 178 EUROPE: INVASIVE BODY CONTOURING DEVICES MARKET, BY TYPE, 2022–2029 (USD MILLION)
  • TABLE 179 EUROPE: BODY CONTOURING DEVICES MARKET, BY APPLICATION, 2022–2029 (USD MILLION)
  • TABLE 180 EUROPE: BODY CONTOURING DEVICES MARKET, BY AGE GROUP, 2022–2029 (USD MILLION)
  • TABLE 181 EUROPE: BODY CONTOURING DEVICES MARKET, BY GENDER, 2022–2029 (USD MILLION)
  • TABLE 182 EUROPE: BODY CONTOURING DEVICES MARKET, BY END USER, 2022–2029 (USD MILLION)
  • TABLE 183 EUROPE: MACROECONOMIC INDICATORS
  • TABLE 184 GERMANY: NO. OF BODY CONTOURING PROCEDURES (2018 VS. 2020 VS. 2022)
  • TABLE 185 GERMANY: BODY CONTOURING DEVICES MARKET, BY TYPE, 2022–2029 (USD MILLION)
  • TABLE 186 GERMANY: NON-INVASIVE BODY CONTOURING DEVICES MARKET, BY TYPE, 2022–2029 (USD MILLION)
  • TABLE 187 GERMANY: INVASIVE BODY CONTOURING DEVICES MARKET, BY TYPE, 2022–2029 (USD MILLION)
  • TABLE 188 GERMANY: BODY CONTOURING DEVICES MARKET, BY APPLICATION, 2022–2029 (USD MILLION)
  • TABLE 189 GERMANY: BODY CONTOURING DEVICES MARKET, BY AGE GROUP, 2022–2029 (USD MILLION)
  • TABLE 190 GERMANY: BODY CONTOURING DEVICES MARKET, BY GENDER, 2022–2029 (USD MILLION)
  • TABLE 191 GERMANY: BODY CONTOURING DEVICES MARKET, BY END USER, 2022–2029 (USD MILLION)
  • TABLE 192 UK: BODY CONTOURING DEVICES MARKET, BY TYPE, 2022–2029 (USD MILLION)
  • TABLE 193 UK: NON-INVASIVE BODY CONTOURING DEVICES MARKET, BY TYPE, 2022–2029 (USD MILLION)
  • TABLE 194 UK: INVASIVE BODY CONTOURING DEVICES MARKET, BY TYPE, 2022–2029 (USD MILLION)
  • TABLE 195 UK: BODY CONTOURING DEVICES MARKET, BY APPLICATION, 2022–2029 (USD MILLION)
  • TABLE 196 UK: BODY CONTOURING DEVICES MARKET, BY AGE GROUP, 2022–2029 (USD MILLION)
  • TABLE 197 UK: BODY CONTOURING DEVICES MARKET, BY GENDER, 2022–2029 (USD MILLION)
  • TABLE 198 UK: BODY CONTOURING DEVICES MARKET, BY END USER, 2022–2029 (USD MILLION)
  • TABLE 199 FRANCE: BODY CONTOURING DEVICES MARKET, BY TYPE, 2022–2029 (USD MILLION)
  • TABLE 200 FRANCE: NON-INVASIVE BODY CONTOURING DEVICES MARKET, BY TYPE, 2022–2029 (USD MILLION)
  • TABLE 201 FRANCE: INVASIVE BODY CONTOURING DEVICES MARKET, BY TYPE, 2022–2029 (USD MILLION)
  • TABLE 202 FRANCE: BODY CONTOURING DEVICES MARKET, BY APPLICATION, 2022–2029 (USD MILLION)
  • TABLE 203 FRANCE: BODY CONTOURING DEVICES MARKET, BY AGE GROUP, 2022–2029 (USD MILLION)
  • TABLE 204 FRANCE: BODY CONTOURING DEVICES MARKET, BY GENDER, 2022–2029 (USD MILLION)
  • TABLE 205 FRANCE: BODY CONTOURING DEVICES MARKET, BY END USER, 2022–2029 (USD MILLION)
  • TABLE 206 ITALY: NO. OF BODY CONTOURING PROCEDURES (2018 VS. 2020 VS. 2022)
  • TABLE 207 ITALY: BODY CONTOURING DEVICES MARKET, BY TYPE, 2022–2029 (USD MILLION)
  • TABLE 208 ITALY: NON-INVASIVE BODY CONTOURING DEVICES MARKET, BY TYPE, 2022–2029 (USD MILLION)
  • TABLE 209 ITALY: INVASIVE BODY CONTOURING DEVICES MARKET, BY TYPE, 2022–2029 (USD MILLION)
  • TABLE 210 ITALY: BODY CONTOURING DEVICES MARKET, BY APPLICATION, 2022–2029 (USD MILLION)
  • TABLE 211 ITALY: BODY CONTOURING DEVICES MARKET, BY AGE GROUP, 2022–2029 (USD MILLION)
  • TABLE 212 ITALY: BODY CONTOURING DEVICES MARKET, BY GENDER, 2022–2029 (USD MILLION)
  • TABLE 213 ITALY: BODY CONTOURING DEVICES MARKET, BY END USER, 2022–2029 (USD MILLION)
  • TABLE 214 SPAIN: BODY CONTOURING DEVICES MARKET, BY TYPE, 2022–2029 (USD MILLION)
  • TABLE 215 SPAIN: NON-INVASIVE BODY CONTOURING DEVICES MARKET, BY TYPE, 2022–2029 (USD MILLION)
  • TABLE 216 SPAIN: INVASIVE BODY CONTOURING DEVICES MARKET, BY TYPE, 2022–2029 (USD MILLION)
  • TABLE 217 SPAIN: BODY CONTOURING DEVICES MARKET, BY APPLICATION, 2022–2029 (USD MILLION)
  • TABLE 218 SPAIN: BODY CONTOURING DEVICES MARKET, BY AGE GROUP, 2022–2029 (USD MILLION)
  • TABLE 219 SPAIN: BODY CONTOURING DEVICES MARKET, BY GENDER, 2022–2029 (USD MILLION)
  • TABLE 220 SPAIN: BODY CONTOURING DEVICES MARKET, BY END USER, 2022–2029 (USD MILLION)
  • TABLE 221 REST OF EUROPE: BODY CONTOURING DEVICES MARKET, BY TYPE, 2022–2029 (USD MILLION)
  • TABLE 222 REST OF EUROPE: NON-INVASIVE BODY CONTOURING DEVICES MARKET, BY TYPE, 2022–2029 (USD MILLION)
  • TABLE 223 REST OF EUROPE: INVASIVE BODY CONTOURING DEVICES MARKET, BY TYPE, 2022–2029 (USD MILLION)
  • TABLE 224 REST OF EUROPE: BODY CONTOURING DEVICES MARKET, BY APPLICATION, 2022–2029 (USD MILLION)
  • TABLE 225 REST OF EUROPE: BODY CONTOURING DEVICES MARKET, BY AGE GROUP, 2022–2029 (USD MILLION)
  • TABLE 226 REST OF EUROPE: BODY CONTOURING DEVICES MARKET, BY GENDER, 2022–2029 (USD MILLION)
  • TABLE 227 REST OF EUROPE: BODY CONTOURING DEVICES MARKET, BY END USER, 2022–2029 (USD MILLION)
  • TABLE 228 ASIA PACIFIC: NO. OF BODY CONTOURING PROCEDURES, BY COUNTRY, 2022
  • TABLE 229 ASIA PACIFIC: BODY CONTOURING DEVICES MARKET, BY COUNTRY, 2022–2029 (USD MILLION)
  • TABLE 230 ASIA PACIFIC: BODY CONTOURING DEVICES MARKET, BY TYPE, 2022–2029 (USD MILLION)
  • TABLE 231 ASIA PACIFIC: NON-INVASIVE BODY CONTOURING DEVICES MARKET, BY TYPE, 2022–2029 (USD MILLION)
  • TABLE 232 ASIA PACIFIC: INVASIVE BODY CONTOURING DEVICES MARKET, BY TYPE, 2022–2029 (USD MILLION)
  • TABLE 233 ASIA PACIFIC: BODY CONTOURING DEVICES MARKET, BY APPLICATION, 2022–2029 (USD MILLION)
  • TABLE 234 ASIA PACIFIC: BODY CONTOURING DEVICES MARKET, BY AGE GROUP, 2022–2029 (USD MILLION)
  • TABLE 235 ASIA PACIFIC: BODY CONTOURING DEVICES MARKET, BY GENDER, 2022–2029 (USD MILLION)
  • TABLE 236 ASIA PACIFIC: BODY CONTOURING DEVICES MARKET, BY END USER, 2022–2029 (USD MILLION)
  • TABLE 237 ASIA PACIFIC: MACROECONOMIC INDICATORS
  • TABLE 238 CHINA: BODY CONTOURING DEVICES MARKET, BY TYPE, 2022–2029 (USD MILLION)
  • TABLE 239 CHINA: NON-INVASIVE BODY CONTOURING DEVICES MARKET, BY TYPE, 2022–2029 (USD MILLION)
  • TABLE 240 CHINA: INVASIVE BODY CONTOURING DEVICES MARKET, BY TYPE, 2022–2029 (USD MILLION)
  • TABLE 241 CHINA: BODY CONTOURING DEVICES MARKET, BY APPLICATION, 2022–2029 (USD MILLION)
  • TABLE 242 CHINA: BODY CONTOURING DEVICES MARKET, BY AGE GROUP, 2022–2029 (USD MILLION)
  • TABLE 243 CHINA: BODY CONTOURING DEVICES MARKET, BY GENDER, 2022–2029 (USD MILLION)
  • TABLE 244 CHINA: BODY CONTOURING DEVICES MARKET, BY END USER, 2022–2029 (USD MILLION)
  • TABLE 245 JAPAN: BODY CONTOURING DEVICES MARKET, BY TYPE, 2022–2029 (USD MILLION)
  • TABLE 246 JAPAN: NON-INVASIVE BODY CONTOURING DEVICES MARKET, BY TYPE, 2022–2029 (USD MILLION)
  • TABLE 247 JAPAN: INVASIVE BODY CONTOURING DEVICES MARKET, BY TYPE, 2022–2029 (USD MILLION)
  • TABLE 248 JAPAN: BODY CONTOURING DEVICES MARKET, BY APPLICATION, 2022–2029 (USD MILLION)
  • TABLE 249 JAPAN: BODY CONTOURING DEVICES MARKET, BY AGE GROUP, 2022–2029 (USD MILLION)
  • TABLE 250 JAPAN: BODY CONTOURING DEVICES MARKET, BY GENDER, 2022–2029 (USD MILLION)
  • TABLE 251 JAPAN: BODY CONTOURING DEVICES MARKET, BY END USER, 2022–2029 (USD MILLION)
  • TABLE 252 INDIA: BODY CONTOURING DEVICES MARKET, BY TYPE, 2022–2029 (USD MILLION)
  • TABLE 253 INDIA: NON-INVASIVE BODY CONTOURING DEVICES MARKET, BY TYPE, 2022–2029 (USD MILLION)
  • TABLE 254 INDIA: INVASIVE BODY CONTOURING DEVICES MARKET, BY TYPE, 2022–2029 (USD MILLION)
  • TABLE 255 INDIA: BODY CONTOURING DEVICES MARKET, BY APPLICATION, 2022–2029 (USD MILLION)
  • TABLE 256 INDIA: BODY CONTOURING DEVICES MARKET, BY AGE GROUP,2022–2029 (USD MILLION)
  • TABLE 257 INDIA: BODY CONTOURING DEVICES MARKET, BY GENDER, 2022–2029 (USD MILLION)
  • TABLE 258 INDIA: BODY CONTOURING DEVICES MARKET, BY END USER, 2022–2029 (USD MILLION)
  • TABLE 259 REST OF ASIA PACIFIC: BODY CONTOURING DEVICES MARKET, BY TYPE, 2022–2029 (USD MILLION)
  • TABLE 260 REST OF ASIA PACIFIC: NON-INVASIVE BODY CONTOURING DEVICES MARKET, BY TYPE, 2022–2029 (USD MILLION)
  • TABLE 261 REST OF ASIA PACIFIC: INVASIVE BODY CONTOURING DEVICES MARKET, BY TYPE, 2022–2029 (USD MILLION)
  • TABLE 262 REST OF ASIA PACIFIC: BODY CONTOURING DEVICES MARKET, BY APPLICATION, 2022–2029 (USD MILLION)
  • TABLE 263 REST OF ASIA PACIFIC: BODY CONTOURING DEVICES MARKET, BY AGE GROUP, 2022–2029 (USD MILLION)
  • TABLE 264 REST OF ASIA PACIFIC: BODY CONTOURING DEVICES MARKET, BY GENDER, 2022–2029 (USD MILLION)
  • TABLE 265 REST OF ASIA PACIFIC: BODY CONTOURING DEVICES MARKET, BY END USER, 2022–2029 (USD MILLION)
  • TABLE 266 COST OF AESTHETIC PROCEDURES IN US VS. LATIN AMERICAN COUNTRIES, AS OF 2022 (USD)
  • TABLE 267 LATIN AMERICA: BODY CONTOURING DEVICES MARKET, BY COUNTRY, 2022–2029 (USD MILLION)
  • TABLE 268 LATIN AMERICA: BODY CONTOURING DEVICES MARKET, BY TYPE, 2022–2029 (USD MILLION)
  • TABLE 269 LATIN AMERICA: NON-INVASIVE BODY CONTOURING DEVICES MARKET, BY TYPE, 2022–2029 (USD MILLION)
  • TABLE 270 LATIN AMERICA: INVASIVE BODY CONTOURING DEVICES MARKET, BY TYPE, 2022–2029 (USD MILLION)
  • TABLE 271 LATIN AMERICA: BODY CONTOURING DEVICES MARKET, BY APPLICATION, 2022–2029 (USD MILLION)
  • TABLE 272 LATIN AMERICA: BODY CONTOURING DEVICES MARKET, BY AGE GROUP, 2022–2029 (USD MILLION)
  • TABLE 273 LATIN AMERICA: BODY CONTOURING DEVICES MARKET, BY GENDER, 2022–2029 (USD MILLION)
  • TABLE 274 LATIN AMERICA: BODY CONTOURING DEVICES MARKET, BY END USER, 2022–2029 (USD MILLION)
  • TABLE 275 LATIN AMERICA & CARIBBEAN: MACROECONOMIC INDICATORS
  • TABLE 276 BRAZIL: NO. OF BODY CONTOURING PROCEDURES (2022)
  • TABLE 277 BRAZIL: BODY CONTOURING DEVICES MARKET, BY TYPE, 2022–2029 (USD MILLION)
  • TABLE 278 BRAZIL: NON-INVASIVE BODY CONTOURING DEVICES MARKET, BY TYPE, 2022–2029 (USD MILLION)
  • TABLE 279 BRAZIL: INVASIVE BODY CONTOURING DEVICES MARKET, BY TYPE, 2022–2029 (USD MILLION)
  • TABLE 280 BRAZIL: BODY CONTOURING DEVICES MARKET, BY APPLICATION, 2022–2029 (USD MILLION)
  • TABLE 281 BRAZIL: BODY CONTOURING DEVICES MARKET, BY AGE GROUP, 2022–2029 (USD MILLION)
  • TABLE 282 BRAZIL: BODY CONTOURING DEVICES MARKET, BY GENDER, 2022–2029 (USD MILLION)
  • TABLE 283 BRAZIL: BODY CONTOURING DEVICES MARKET, BY END USER, 2022–2029 (USD MILLION)
  • TABLE 284 MEXICO: NO. OF BODY CONTOURING PROCEDURES (2022)
  • TABLE 285 MEXICO: BODY CONTOURING DEVICES MARKET, BY TYPE, 2022–2029 (USD MILLION)
  • TABLE 286 MEXICO: NON-INVASIVE BODY CONTOURING DEVICES MARKET, BY TYPE, 2022–2029 (USD MILLION)
  • TABLE 287 MEXICO: INVASIVE BODY CONTOURING DEVICES MARKET, BY TYPE, 2022–2029 (USD MILLION)
  • TABLE 288 MEXICO: BODY CONTOURING DEVICES MARKET, BY APPLICATION, 2022–2029 (USD MILLION)
  • TABLE 289 MEXICO: BODY CONTOURING DEVICES MARKET, BY AGE GROUP, 2022–2029 (USD MILLION)
  • TABLE 290 MEXICO: BODY CONTOURING DEVICES MARKET, BY GENDER, 2022–2029 (USD MILLION)
  • TABLE 291 MEXICO: BODY CONTOURING DEVICES MARKET, BY END USER, 2022–2029 (USD MILLION)
  • TABLE 292 REST OF LATIN AMERICA: BODY CONTOURING DEVICES MARKET, BY TYPE, 2022–2029 (USD MILLION)
  • TABLE 293 REST OF LATIN AMERICA: NON-INVASIVE BODY CONTOURING DEVICES MARKET, BY TYPE, 2022–2029 (USD MILLION)
  • TABLE 294 REST OF LATIN AMERICA: INVASIVE BODY CONTOURING DEVICES MARKET, BY TYPE, 2022–2029 (USD MILLION)
  • TABLE 295 REST OF LATIN AMERICA: BODY CONTOURING DEVICES MARKET, BY APPLICATION, 2022–2029 (USD MILLION)
  • TABLE 296 REST OF LATIN AMERICA: BODY CONTOURING DEVICES MARKET, BY AGE GROUP, 2022–2029 (USD MILLION)
  • TABLE 297 REST OF LATIN AMERICA: BODY CONTOURING DEVICES MARKET, BY GENDER, 2022–2029 (USD MILLION)
  • TABLE 298 REST OF LATIN AMERICA: BODY CONTOURING DEVICES MARKET, BY END USER, 2022–2029 (USD MILLION)
  • TABLE 299 MIDDLE EAST & AFRICA: BODY CONTOURING DEVICES MARKET, BY TYPE, 2022–2029 (USD MILLION)
  • TABLE 300 MIDDLE EAST & AFRICA: NON-INVASIVE BODY CONTOURING DEVICES MARKET, BY TYPE, 2022–2029 (USD MILLION)
  • TABLE 301 MIDDLE EAST & AFRICA: INVASIVE BODY CONTOURING DEVICES MARKET, BY TYPE, 2022–2029 (USD MILLION)
  • TABLE 302 MIDDLE EAST & AFRICA: BODY CONTOURING DEVICES MARKET, BY APPLICATION, 2022–2029 (USD MILLION)
  • TABLE 303 MIDDLE EAST & AFRICA: BODY CONTOURING DEVICES MARKET, BY AGE GROUP, 2022–2029 (USD MILLION)
  • TABLE 304 MIDDLE EAST & AFRICA: BODY CONTOURING DEVICES MARKET, BY GENDER, 2022–2029 (USD MILLION)
  • TABLE 305 MIDDLE EAST & AFRICA: BODY CONTOURING DEVICES MARKET, BY END USER, 2022–2029 (USD MILLION)
  • TABLE 306 MIDDLE EAST & NORTH AFRICA: MACROECONOMIC INDICATORS
  • TABLE 307 GCC COUNTRIES: BODY CONTOURING DEVICES MARKET, BY TYPE, 2022–2029 (USD MILLION)
  • TABLE 308 GCC COUNTRIES: NON-INVASIVE BODY CONTOURING DEVICES MARKET, BY TYPE, 2022–2029 (USD MILLION)
  • TABLE 309 GCC COUNTRIES: INVASIVE BODY CONTOURING DEVICES MARKET, BY TYPE, 2022–2029 (USD MILLION)
  • TABLE 310 GCC COUNTRIES: BODY CONTOURING DEVICES MARKET, BY APPLICATION, 2022–2029 (USD MILLION)
  • TABLE 311 GCC COUNTRIES: BODY CONTOURING DEVICES MARKET, BY AGE GROUP, 2022–2029 (USD MILLION)
  • TABLE 312 GCC COUNTRIES: BODY CONTOURING DEVICES MARKET, BY GENDER, 2022–2029 (USD MILLION)
  • TABLE 313 GCC COUNTRIES: BODY CONTOURING DEVICES MARKET, BY END USER, 2022–2029 (USD MILLION)
  • TABLE 314 GCC COUNTRIES: MACROECONOMIC INDICATORS
  • TABLE 315 BODY CONTOURING DEVICES MARKET: STRATEGIES ADOPTED
  • TABLE 316 BODY CONTOURING DEVICES MARKET: DEGREE OF COMPETITION
  • TABLE 317 BODY CONTOURING DEVICES MARKET: TYPE FOOTPRINT
  • TABLE 318 BODY CONTOURING DEVICES MARKET: APPLICATION FOOTPRINT
  • TABLE 319 BODY CONTOURING DEVICES MARKET: REGION FOOTPRINT
  • TABLE 320 BODY CONTOURING DEVICES MARKET: DETAILED LIST OF KEY START-UPS/SMES
  • TABLE 321 BODY CONTOURING DEVICES MARKET: COMPETITIVE BENCHMARKING OF START-UPS/SMES
  • TABLE 322 BODY CONTOURING DEVICES MARKET: PRODUCT LAUNCHES & APPROVALS, JANUARY 2021–AUGUST 2024
  • TABLE 323 BODY CONTOURING DEVICES MARKET: DEALS, JANUARY 2021–AUGUST 2024
  • TABLE 324 ABBVIE, INC.: COMPANY OVERVIEW
  • TABLE 325 ABBVIE, INC.: PRODUCTS OFFERED
  • TABLE 326 ABBVIE, INC.: PRODUCT LAUNCHES & APPROVALS, JANUARY 2021–JULY 2024
  • TABLE 327 ABBVIE, INC.: DEALS, JANUARY 2021–MARCH 2024
  • TABLE 328 INMODE LTD.: COMPANY OVERVIEW
  • TABLE 329 INMODE LTD.: PRODUCTS OFFERED
  • TABLE 330 BAUSCH HEALTH COMPANIES INC.: COMPANY OVERVIEW
  • TABLE 331 BAUSCH HEALTH COMPANIES INC.: PRODUCTS OFFERED
  • TABLE 332 BAUSCH HEALTH COMPANIES INC.: PRODUCT APPROVALS, JANUARY 2021–JULY 2024
  • TABLE 333 CYNOSURE LUTRONIC: COMPANY OVERVIEW
  • TABLE 334 CYNOSURE LUTRONIC: PRODUCTS OFFERED
  • TABLE 335 CUTERA, INC.: COMPANY OVERVIEW
  • TABLE 336 CUTERA, INC.: PRODUCTS OFFERED
  • TABLE 337 CUTERA, INC.: PRODUCT LAUNCHES, JANUARY 2021–JULY 2024
  • TABLE 338 VENUS CONCEPT: COMPANY OVERVIEW
  • TABLE 339 VENUS CONCEPT: PRODUCTS OFFERED
  • TABLE 340 VENUS CONCEPT: PRODUCT LAUNCHES & APPROVALS, JANUARY 2021–JULY 2024
  • TABLE 341 ENDYMED MEDICAL: COMPANY OVERVIEW
  • TABLE 342 ENDYMED MEDICAL: PRODUCTS OFFERED
  • TABLE 343 LUMENIS BE LTD.: COMPANY OVERVIEW
  • TABLE 344 LUMENIS BE LTD.: PRODUCTS OFFERED
  • TABLE 345 ALMA LASERS: COMPANY OVERVIEW
  • TABLE 346 ALMA LASERS: PRODUCTS OFFERED
  • TABLE 347 CANDELA CORPORATION: COMPANY OVERVIEW
  • TABLE 348 CANDELA CORPORATION: PRODUCTS OFFERED
  • TABLE 349 CANDELA CORPORATION: PRODUCT LAUNCHES, JANUARY 2021–JULY 2024
LIST OF FIGURES
 
  • FIGURE 1 BODY CONTOURING DEVICES MARKET: RESEARCH DESIGN METHODOLOGY
  • FIGURE 2 BREAKDOWN OF PRIMARY INTERVIEWS: SUPPLY-SIDE AND DEMAND-SIDE PARTICIPANTS
  • FIGURE 3 BREAKDOWN OF PRIMARY INTERVIEWS: BY COMPANY TYPE, DESIGNATION, AND REGION
  • FIGURE 4 BOTTOM-UP APPROACH: COMPANY REVENUE ESTIMATION APPROACH
  • FIGURE 5 CAGR PROJECTIONS: SUPPLY-SIDE ANALYSIS
  • FIGURE 6 BODY CONTOURING DEVICES MARKET: TOP-DOWN APPROACH
  • FIGURE 7 DATA TRIANGULATION METHODOLOGY
  • FIGURE 8 BODY CONTOURING DEVICES MARKET, BY TYPE, 2024 VS. 2029 (USD MILLION)
  • FIGURE 9 BODY CONTOURING DEVICES MARKET, BY APPLICATION, 2024 VS. 2029 (USD MILLION)
  • FIGURE 10 BODY CONTOURING DEVICES MARKET, BY AGE GROUP, 2024 VS. 2029 (USD MILLION)
  • FIGURE 11 BODY CONTOURING DEVICES MARKET, BY GENDER, 2024 VS. 2029 (USD MILLION)
  • FIGURE 12 BODY CONTOURING DEVICES MARKET, BY END USER, 2024 VS. 2029 (USD MILLION)
  • FIGURE 13 BODY CONTOURING DEVICES MARKET: GEOGRAPHIC SNAPSHOT
  • FIGURE 14 GROWING AWARENESS OF BODY CONTOURING AND AESTHETIC PROCEDURESTO DRIVE MARKET GROWTH
  • FIGURE 15 NON-INVASIVE DEVICES TO CONTINUE TO DOMINATE MARKET IN 2029
  • FIGURE 16 FAT REDUCTION APPLICATIONS TO DOMINATE MARKET DURING FORECAST PERIOD
  • FIGURE 17 MARKET FOR INDIVIDUALS BETWEEN 35 TO 50 YEARS TO ACCOUNT FOR LARGEST SHARE OF BODY CONTOURING MARKET DURING FORECAST PERIOD
  • FIGURE 18 BODY CONTOURING MARKET FOR WOMEN TO HOLD HIGHER SHARE OF OVERALL MARKET IN 2029
  • FIGURE 19 SPECIALTY CLINICS TO CONTINUE TO DOMINATE MARKET IN 2029
  • FIGURE 20 ASIA PACIFIC TO REGISTER HIGHEST GROWTH RATE IN BODY CONTOURING DEVICES MARKET DURING FORECAST PERIOD
  • FIGURE 21 BODY CONTOURING DEVICES MARKET: DRIVERS, RESTRAINTS, OPPORTUNITIES, AND CHALLENGES
  • FIGURE 22 PATENT ANALYSIS FOR BODY CONTOURING DEVICES (JANUARY 2014–DECEMBER 2023)
  • FIGURE 23 VALUE CHAIN ANALYSIS OF BODY CONTOURING DEVICES: MAJOR VALUE IS ADDED DURING MANUFACTURING AND ASSEMBLY PHASES
  • FIGURE 24 BODY CONTOURING DEVICES MARKET: SUPPLY CHAIN ANALYSIS
  • FIGURE 25 BODY CONTOURING DEVICES MARKET: ECOSYSTEM ANALYSIS
  • FIGURE 26 BODY CONTOURING DEVICES MARKET: PORTER’S FIVE FORCES ANALYSIS
  • FIGURE 27 INFLUENCE OF STAKEHOLDERS ON BUYING PROCESS OF BODY CONTOURING DEVICES FOR END USERS
  • FIGURE 28 KEY BUYING CRITERIA OF BODY CONTOURING DEVICES FOR END USERS
  • FIGURE 29 BODY CONTOURING DEVICES MARKET: INVESTMENT & FUNDING SCENARIO
  • FIGURE 30 NORTH AMERICA: BODY CONTOURING DEVICES MARKET SNAPSHOT
  • FIGURE 31 ASIA PACIFIC: BODY CONTOURING DEVICES MARKET SNAPSHOT
  • FIGURE 32 REVENUE ANALYSIS OF KEY PLAYERS IN BODY CONTOURING DEVICES MARKET (2019–2023)
  • FIGURE 33 MARKET SHARE ANALYSIS OF KEY PLAYERS IN BODY CONTOURING DEVICES MARKET (2023)
  • FIGURE 34 BODY CONTOURING DEVICES MARKET: COMPANY EVALUATION MATRIX (KEY PLAYERS), 2023
  • FIGURE 35 BODY CONTOURING DEVICES MARKET: COMPANY FOOTPRINT
  • FIGURE 36 BODY CONTOURING DEVICES MARKET: COMPANY EVALUATION MATRIX (START-UPS/SMES), 2023
  • FIGURE 37 EV/EBITDA OF KEY VENDORS
  • FIGURE 38 YEAR-TO-DATE (YTD) PRICE TOTAL RETURN AND 5-YEAR STOCK BETA OF KEY VENDORS
  • FIGURE 39 BODY CONTOURING DEVICES MARKET: PRODUCT/BRAND COMPARISON
  • FIGURE 40 ABBVIE, INC.: COMPANY SNAPSHOT (2023)
  • FIGURE 41 INMODE LTD.: COMPANY SNAPSHOT (2023)
  • FIGURE 42 BAUSCH HEALTH COMPANIES INC.: COMPANY SNAPSHOT (2022)
  • FIGURE 43 CUTERA, INC.: COMPANY SNAPSHOT (2022)
  • FIGURE 44 VENUS CONCEPT: COMPANY SNAPSHOT (2023)

The objective of the study is analyzing the key market dynamics such as drivers, opportunities, challenges, restraints, and key player strategies. To track companies’ developments such as product launch, approval, acquisition and merger of the leading players, the competitive landscape of the body contouring devices market to analyzes market players on various parameters within the broad categories of business and product strategy. Top-down and bottom-up approaches were used to estimate the market size. To estimate the market size of segments and subsegments the market breakdown and data triangulation were used.

The four steps involved in estimating the market size are

Secondary Research

In the secondary research process, various secondary sources such as annual reports, press releases & investor presentations of companies, white papers, certified publications, articles by recognized authors, gold-standard & silver-standard websites, regulatory bodies, and databases (such as D&B Hoovers, Bloomberg Business, and Factiva) were referred to identify and collect information for this study.

Primary Research

In the primary research process, various sources from both the supply and demand sides were interviewed to obtain qualitative and quantitative information for this report. Primary sources were mainly industry experts from the core and related industries and preferred suppliers, manufacturers, distributors, service providers, technology developers, researchers, and organizations related to all segments of this industry’s value chain. In-depth interviews were conducted with various primary respondents, including key industry participants, subject-matter experts, C-level executives of key market players, and industry consultants, to obtain and verify the critical qualitative and quantitative information as well as assess prospects.

The following is a breakdown of the primary respondents:
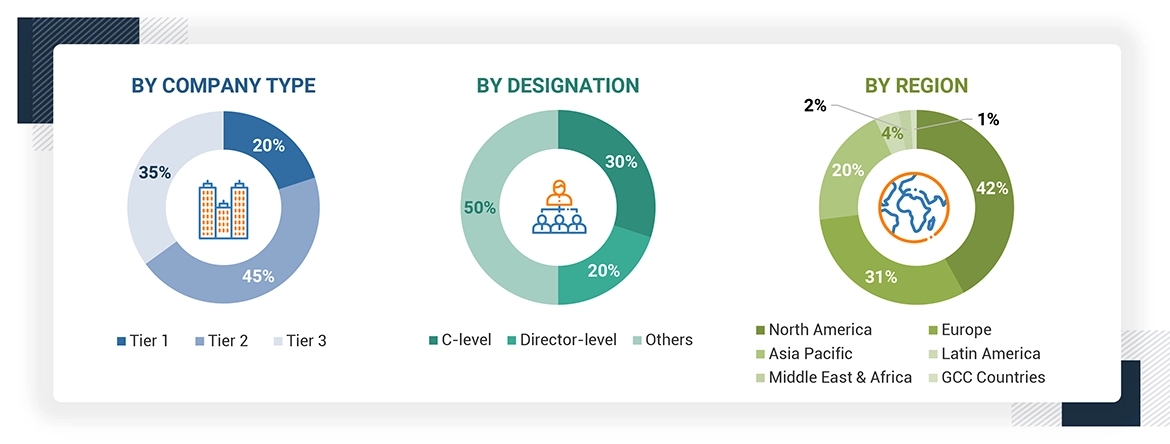
Note 1: Others include sales managers, marketing managers, and product managers.

Note 2: Companies are classified into tiers based on their total revenues. As of 2022, Tier 1 = >USD 100 million, Tier 2 = USD 10 million to USD 100 million, and Tier 3 = < USD 10 million.

To know about the assumptions considered for the study, download the pdf brochure

COMPANY NAME DESIGNATION
Abbvie, Inc. (US) Marketing Manager
InMode Ltd. (US) Senior Product Manager
Bausch Health Companies, Inc. (US) Marketing Manager

Market Size Estimation

Both top-down and bottom-up approaches were used to estimate and validate the body contouring devices market's total size. These methods were also used extensively to estimate the size of various subsegments in the market. The research methodology used to estimate the market size includes the following:

  • The key players in the industry have been identified through extensive secondary research
  • The revenues generated by leading players operating in the body contouring devices market have been determined through primary and secondary research
  • All percentage shares, splits, and breakdowns have been determined using secondary sources and verified through primary sources

Data Triangulation

After arriving at the overall market size applying the process mentioned above, the total market was split into several segments and subsegments. To complete the overall market engineering process and arrive at the exact statistics for all segments and subsegments, data triangulation and market breakdown procedures were employed, wherever applicable. The data was triangulated by studying various factors and trends from both the demand and supply sides.

Market Definition

Body contouring is a aesthetic procedures aimed at enhancing the shape and appearance of the body. These procedures typically involve reducing or reshaping areas of the body to improve contours and proportions. Body contouring can target various areas such as the abdomen, thighs, arms, buttocks, and more, often using techniques like liposuction, non-surgical fat reduction, skin tightening, and muscle toning. Devices used to contour the appearance of the body through non-invasive or minimally invasive procedures are body contouring devices. These devices utilize various technologies such as laser, radiofrequency, ultrasound, cryolipolysis (cooling), and others.

Stakeholders

  • Senior Management
  • End User
  • Finance/Procurement Department
  • R&D Department

Report Objectives

  • To define, describe, segment, and forecast the body contouring devices market by product, application, age group, gender, end user and region
  • To provide detailed information regarding the major factors influencing the market growth (drivers, restraints, opportunities, and challenges)
  • To analyze micromarkets1 with respect to individual growth trends, prospects, and contributions to the overall market
  • To analyze market opportunities for stakeholders and provide details of the competitive landscape for key players
  • To forecast the size of the market segments with respect to six regions, namely, North America, Europe, the Asia Pacific, Middle East & Africa, Latin America, and GCC countries
  • To profile the key players and comprehensively analyze their product portfolios, market positions, and core competencies
  • To track and analyze company developments such as product launch, approval, acquisition, and merger in the body contouring devices market
  • To benchmark players within the body contouring devices market using the Company Evaluation Matrix framework, which analyzes market players on various parameters within the broad categories of business strategy, market share, and product offerings

Previous Versions of this Report

Custom Market Research Services

We Will Customise The Research For You, In Case The Report Listed Above Does Not Meet With Your Requirements

Get 10% Free Customisation

Growth opportunities and latent adjacency in Body Contouring Devices Market

DMCA.com Protection Status